Selecting the most appropriate time points to profile in high-throughput studies
- School of Computer Science, Carnegie Mellon University, United States
- University of Alabama at Birmingham, United States
- University of California, United States
- CARady Children’s Hospital San Diego, United States
- School of Medicine, Yale University, United States
Figures
Figure 1 with 3 supplements
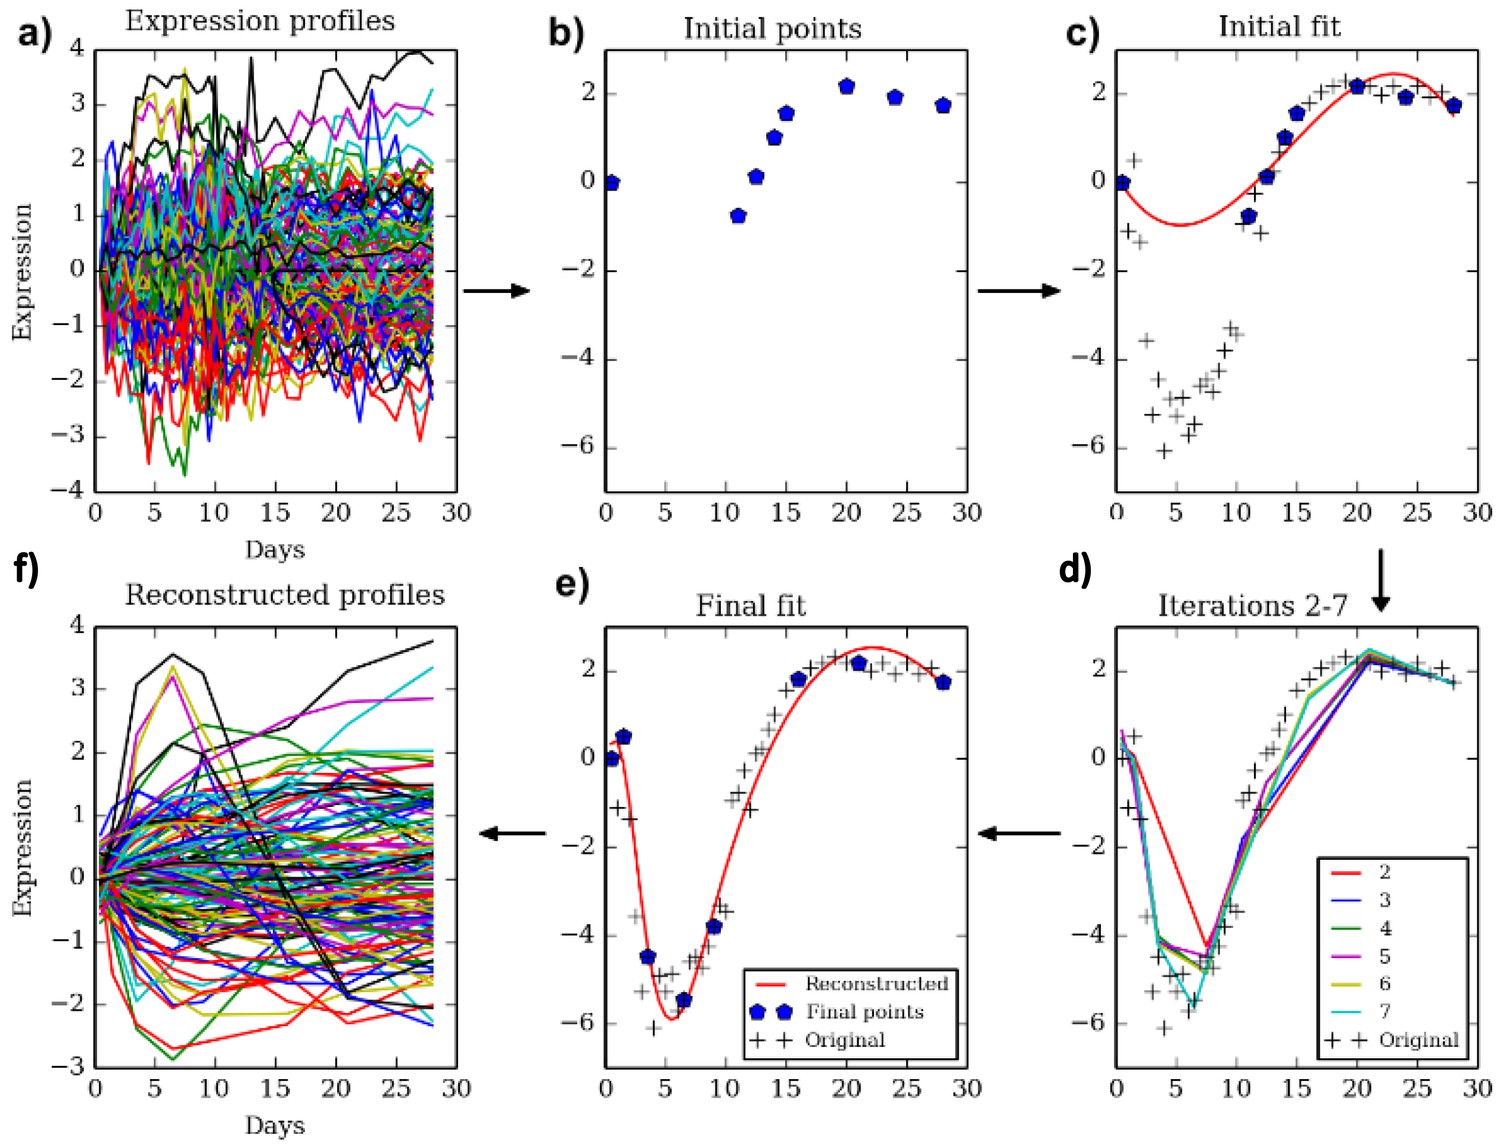
The TPS method.
Clockwise from top left. Given a dense sampling of a selected subset of genes (a) we select an initial set of points (b) using the initialization method described in the text. Next, we fit a spline to the selected points for each gene (c) and evaluate the error on all other points. We perform a greedy search process (d) which iteratively removes and adds points to improve the test data fit resulting in the final set of points (e). The reconstructed curves are fitted to all genes (f) and an overall error is computed and compared to the theoretical limit (noise) to determine the ability of the selected number of points to fit the data.
Figure 1—figure supplement 1
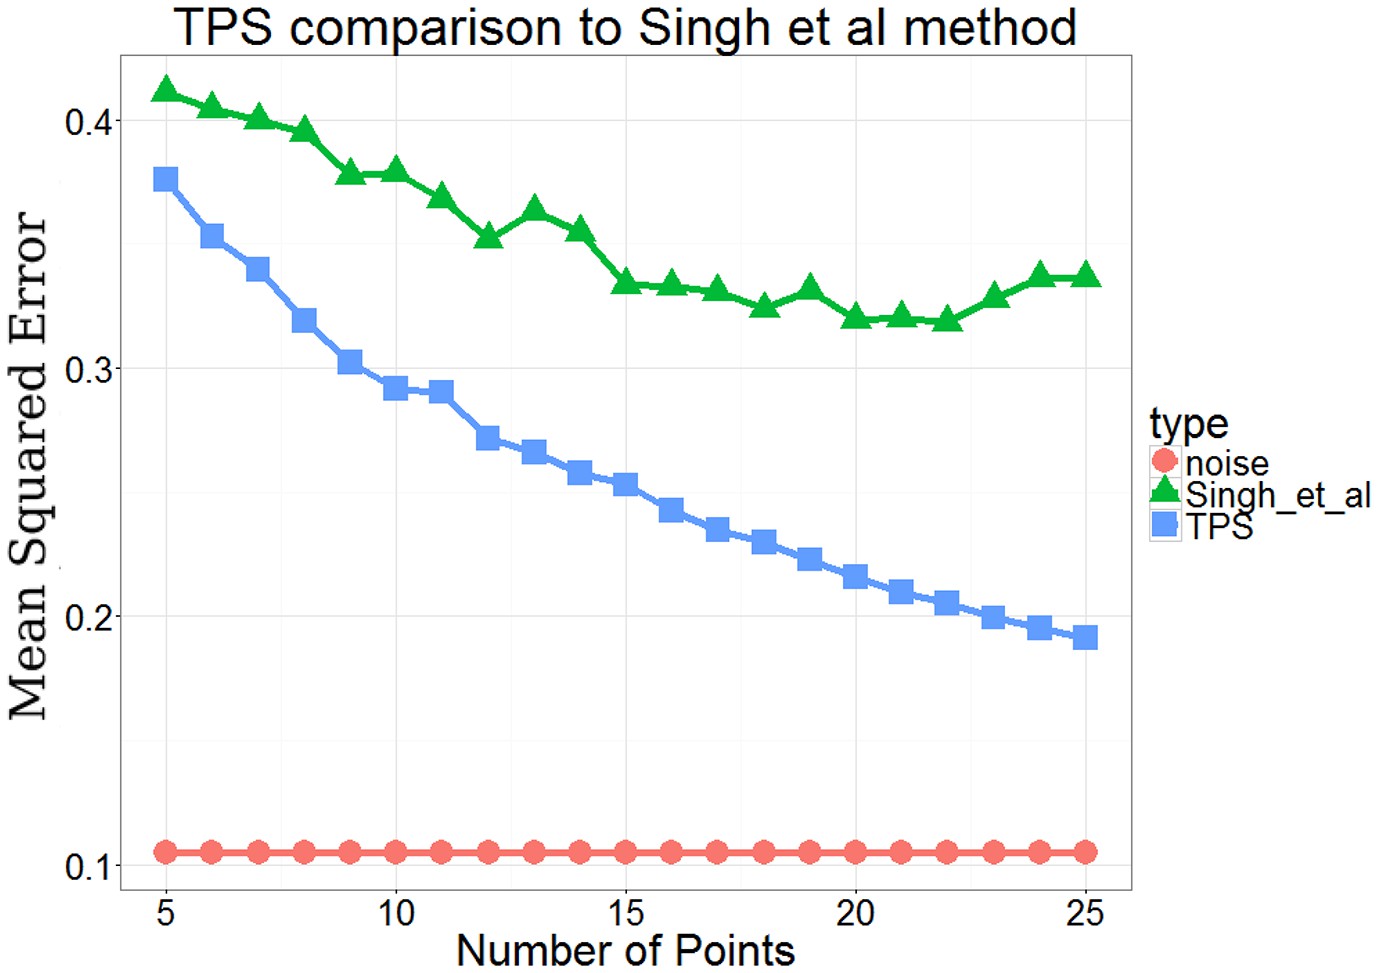
Comparison of performance between TPSand a previous method Singh et al.
(Singh et al., 2005) which used an active learning method based on dynamic programming.
Figure 1—figure supplement 2
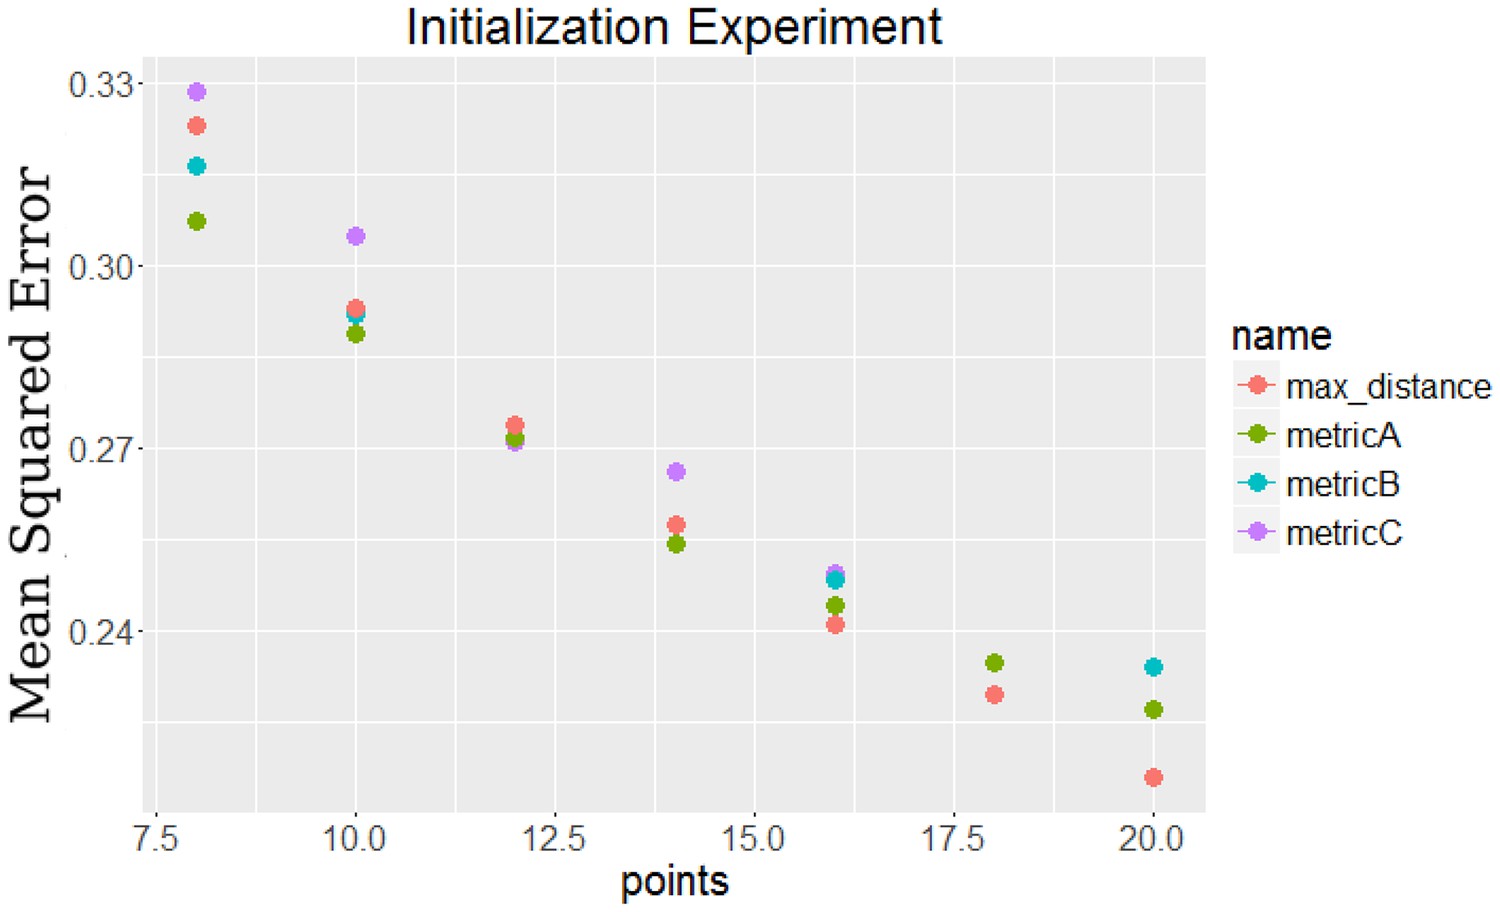
Comparison of initialization methods to each other by their final error.
The points labeled metricA, metricB, and metricC all use the dynamic initialization approaches, while the max distance points use static initialization.
Figure 1—figure supplement 3
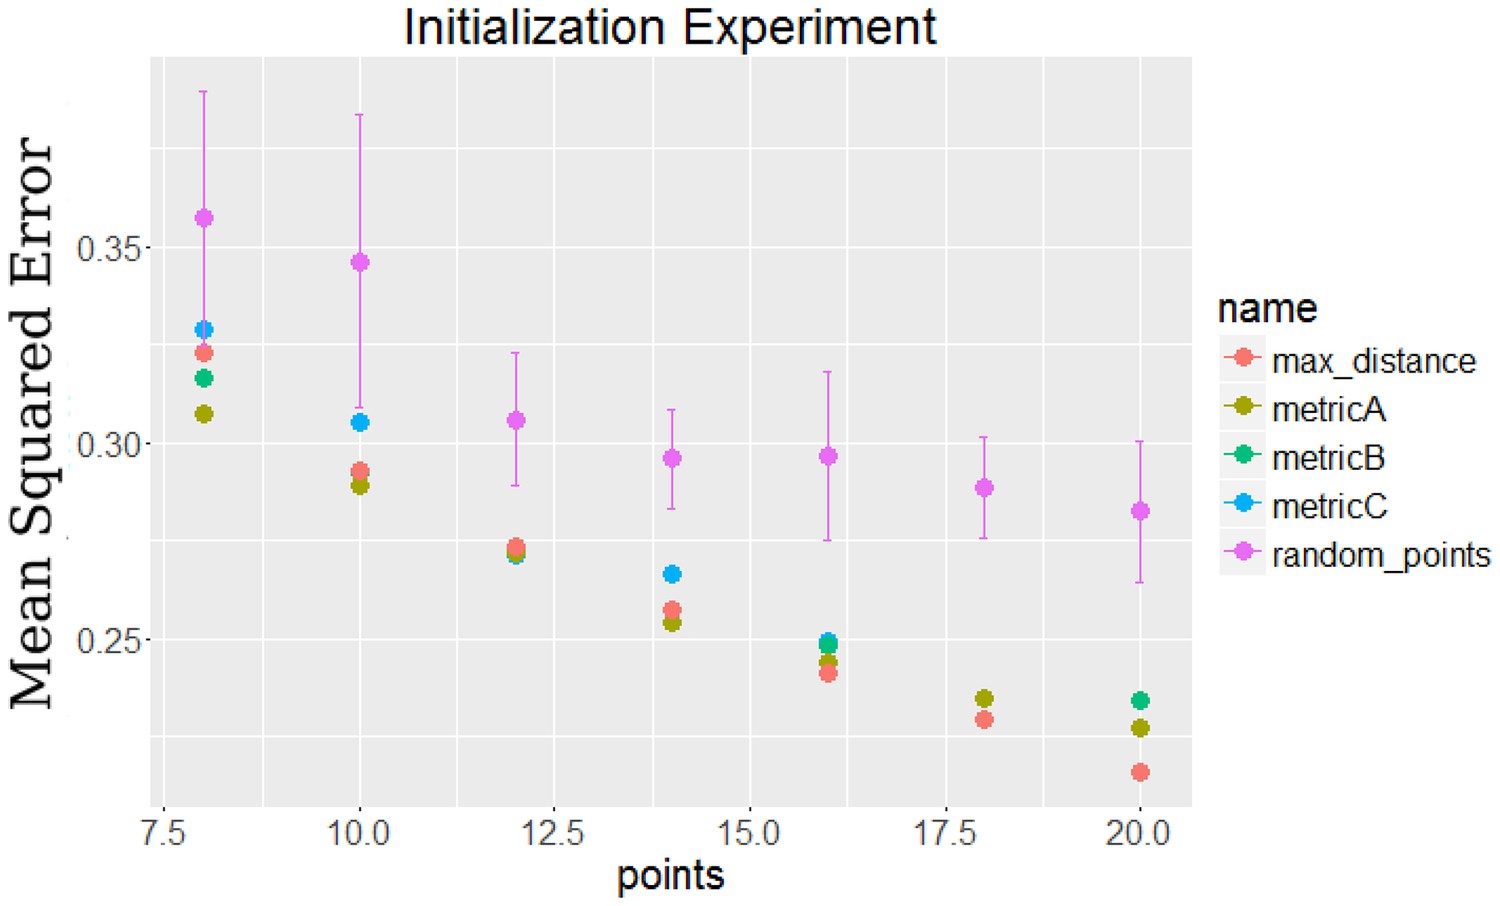
Comparison of initialization method by their final error compared to selecting random points.
https://doi.org/10.7554/eLife.18541.005
Figure 2 with 4 supplements
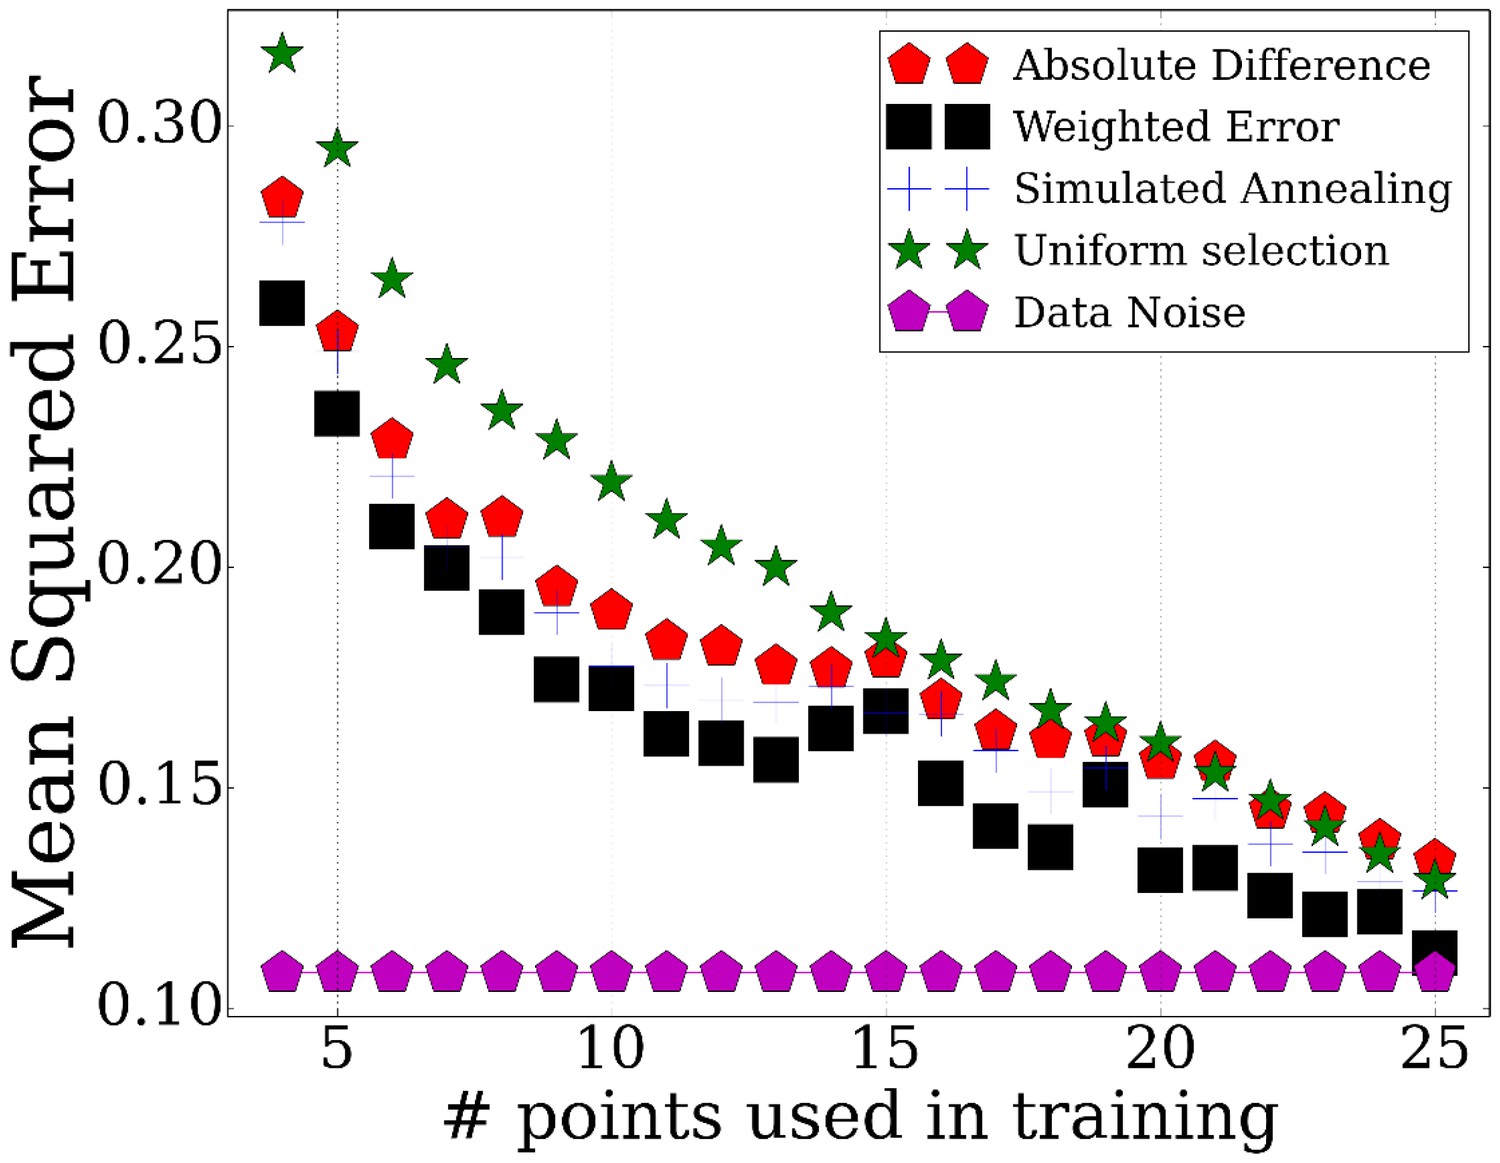
Performance of TPS using different sizes for the selected points.
Error comparisons of TPS variants to uniform selection of points and noise. Absolute difference - Greedy iterative addition with absolute difference initialization (Algorithm 1, Appendix Methods). Simulated annealing - Iterating using simulated annealing with absolute difference initialization. Weighted error - Selection based on cluster rather than individual gene errors. See Appendix Methods for details.
Figure 2—figure supplement 1

Average noise in each mRNA expression time point.
https://doi.org/10.7554/eLife.18541.007
Figure 2—figure supplement 2
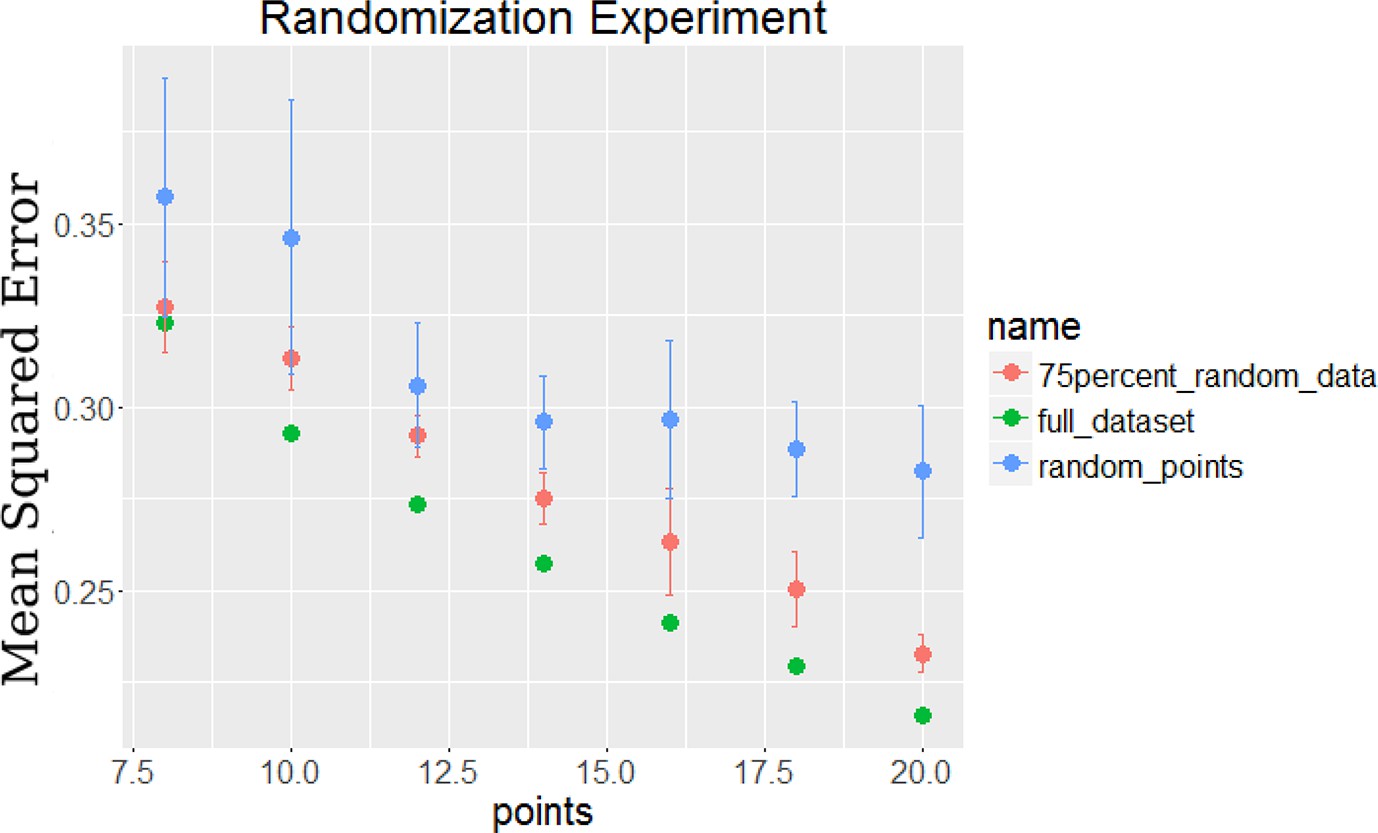
Comparison of error for the TPS algorithm on full data, 75% random data, and random points chosen on the full data.
The 75% random data was created by replacing 75% of the gene time series with random value time series selected from a Gaussian distribution with mean 0 and standard deviation equal to the noise of the original data.
Figure 2—figure supplement 3
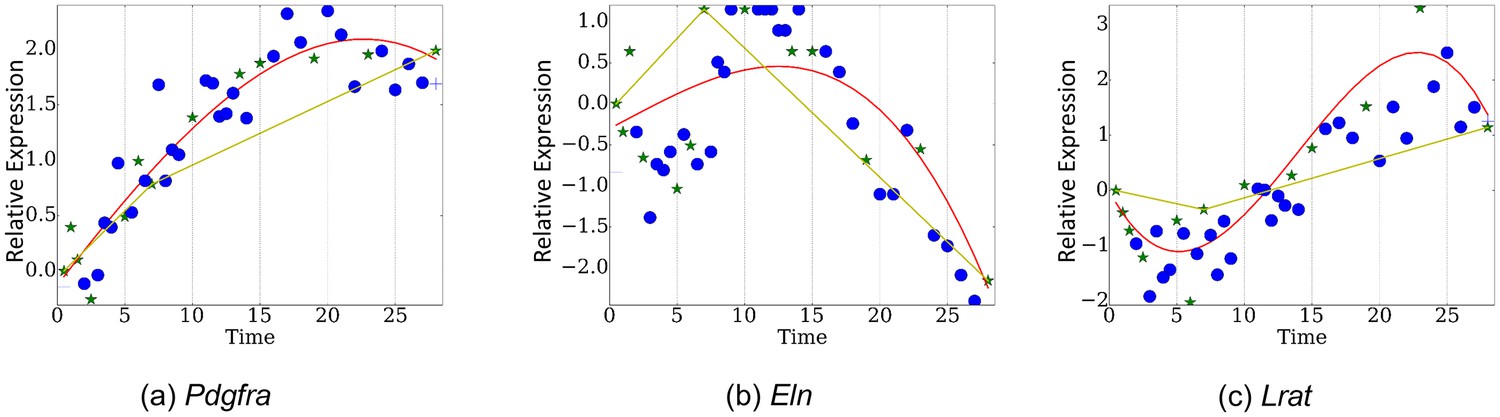
Comparison of TPS and piecewise linear fitting over genes (a) Pdgfra, (b)Eln, (c) Lrat.
https://doi.org/10.7554/eLife.18541.009
Figure 2—figure supplement 4
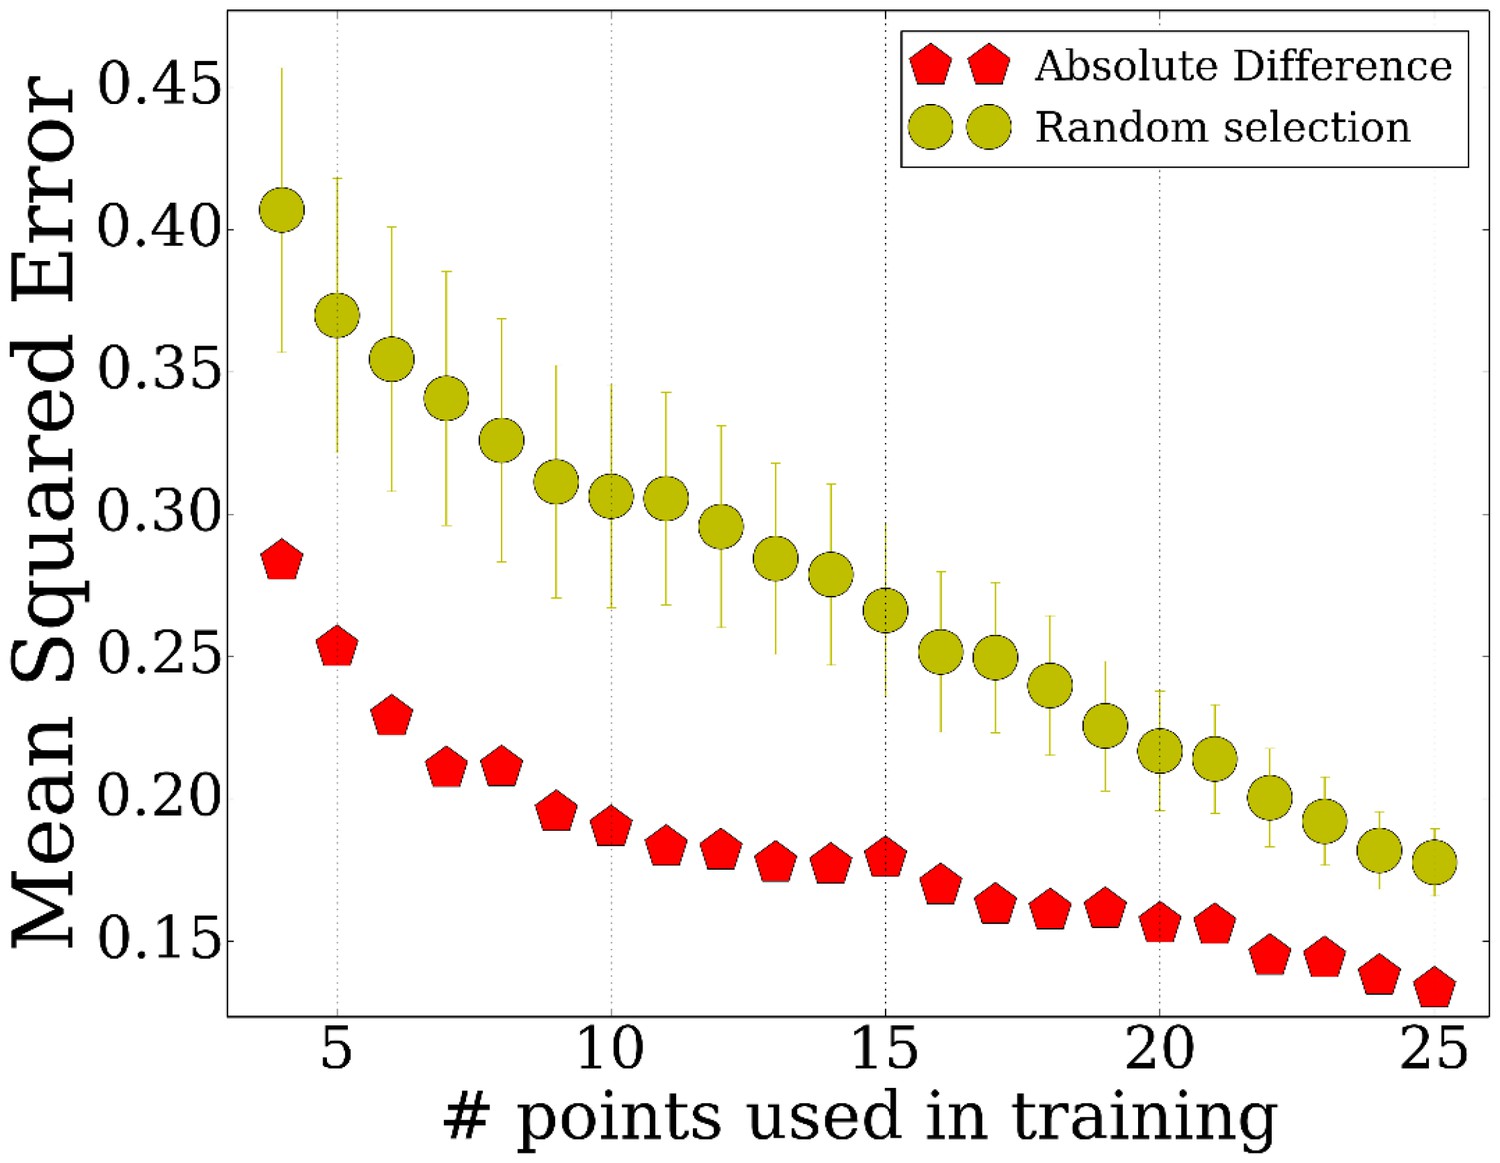
Comparison of the reconstruction error when using the points selected by TPS and when using the same number of random points from the overall set of sampled points.
https://doi.org/10.7554/eLife.18541.010
Figure 3 with 2 supplements
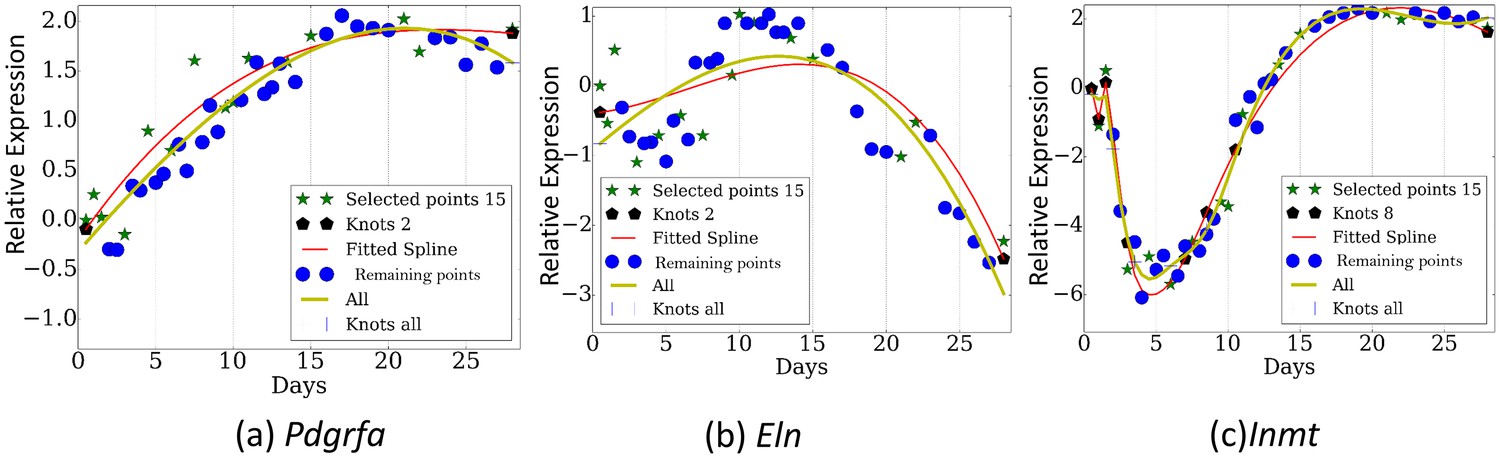
Reconstructed expression profiles for selected genes.
(a). Pdgfra. , (b). Eln. , (c). Inmt.
Figure 3—figure supplement 1
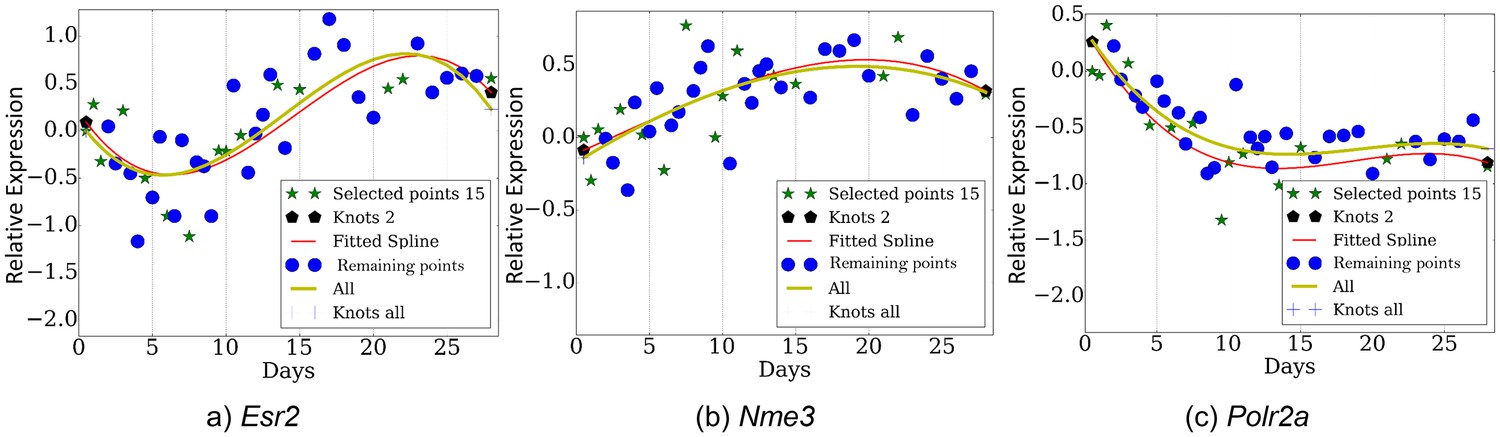
Expression profiles over several genes (a) Esr2, (b) Nme3, (c) Polr2a.
https://doi.org/10.7554/eLife.18541.012
Figure 3—figure supplement 2
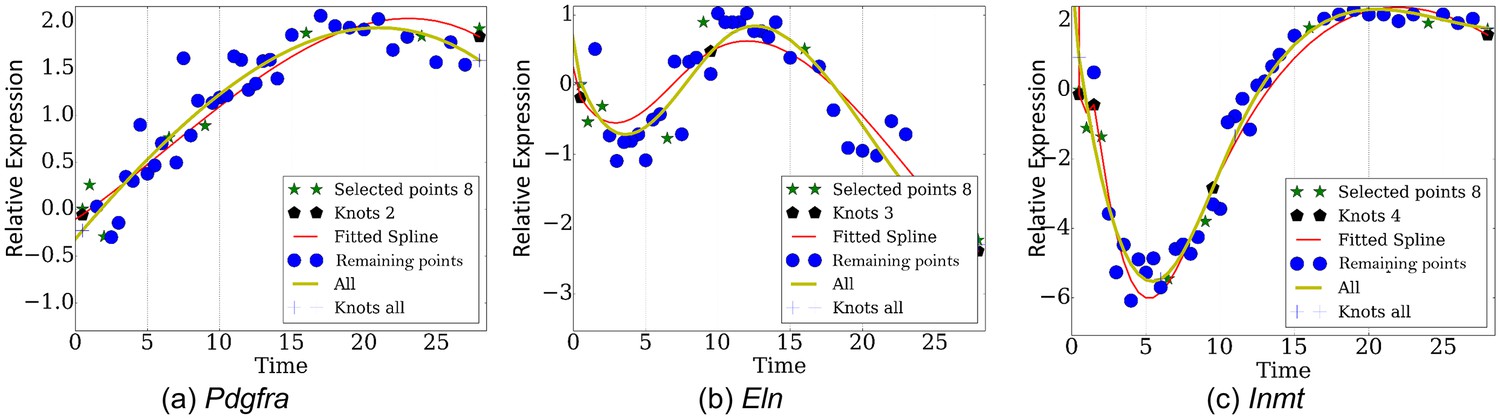
Reconstructed expression proles by eight points over genes (a) Pdgfra, (b) Eln, (c) Inmt.
https://doi.org/10.7554/eLife.18541.013
Figure 4 with 3 supplements
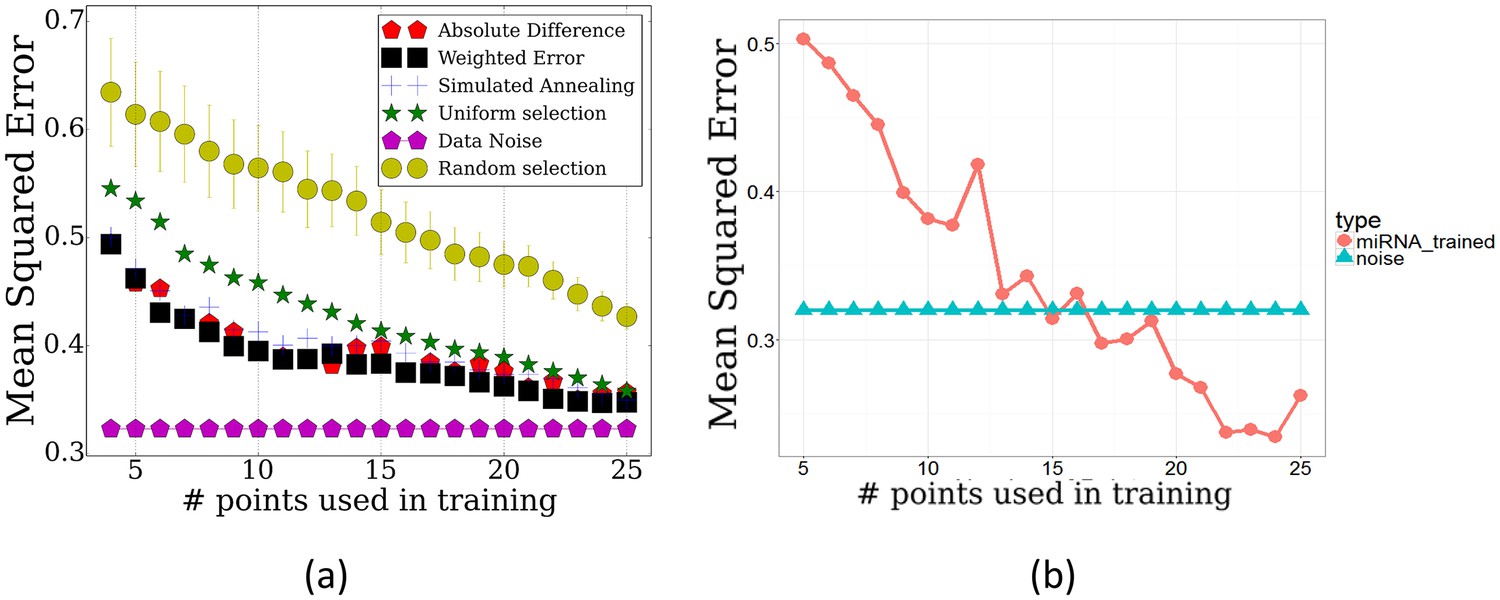
Performance of TPS by on the miRNA data.
(a) TPS reconstruction error when using the mRNA data to select time points for the miRNA experiments. Results of random and uniform selection as well as repeat noise error are also presented for comparison. TPS variants shown are the same two presented in Figure 2. (b) Error of splines with points selected by training TPS on the actual miRNA data itself, using the maximum absolute difference initialization.
Figure 4—figure supplement 1
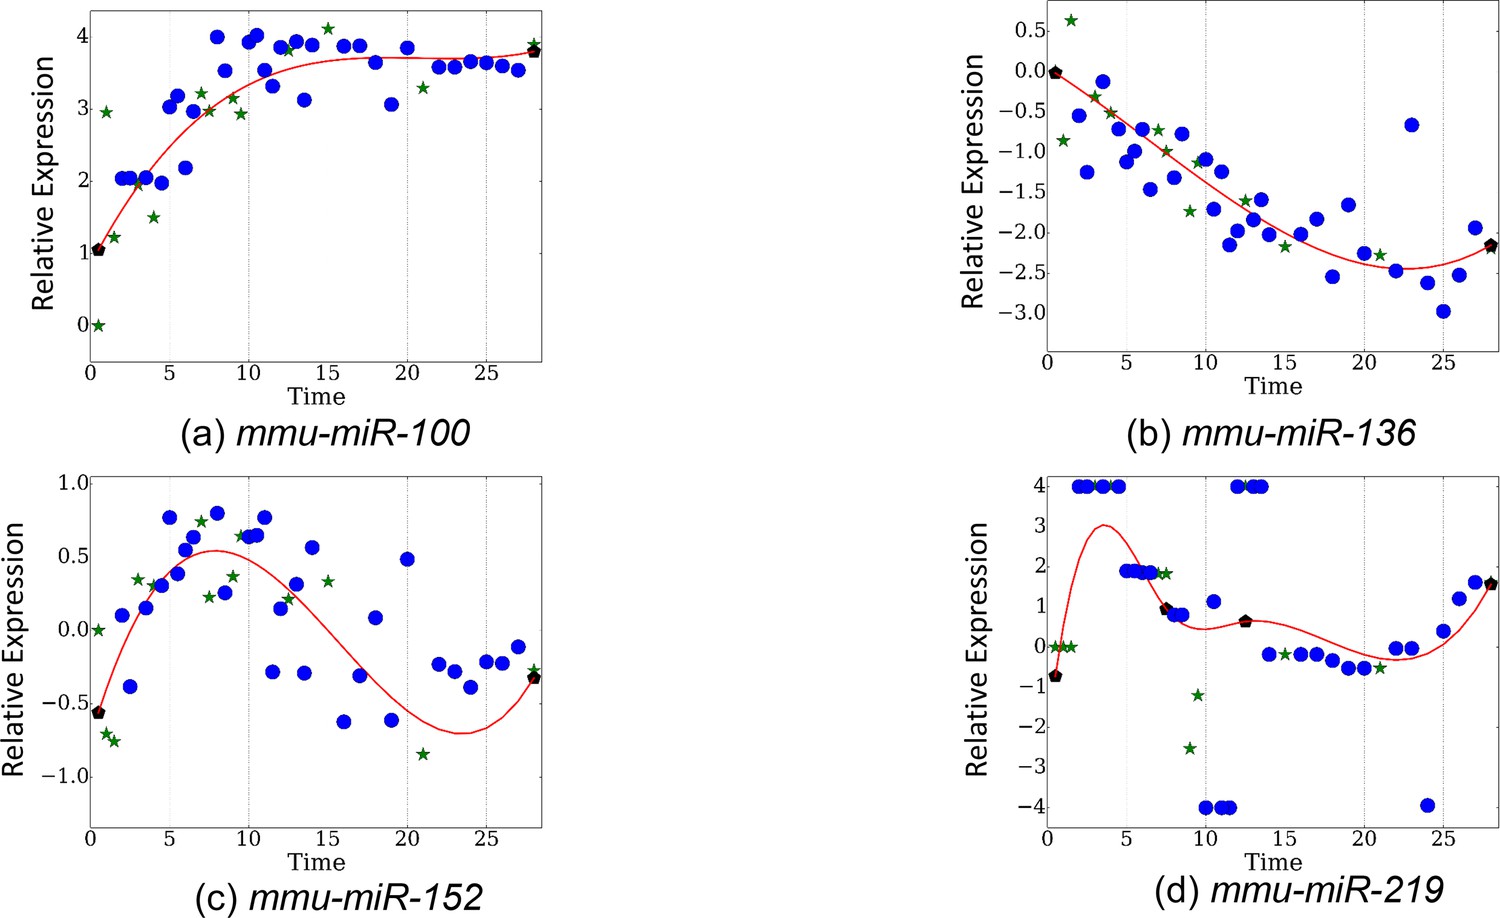
Observed and reconstructed expression proles for miRNAs (a) mmu-miR-100, (b) mmu-miR-136,c) mmu-miR-152, (d) mmu-miR-219.
https://doi.org/10.7554/eLife.18541.015
Figure 4—figure supplement 2
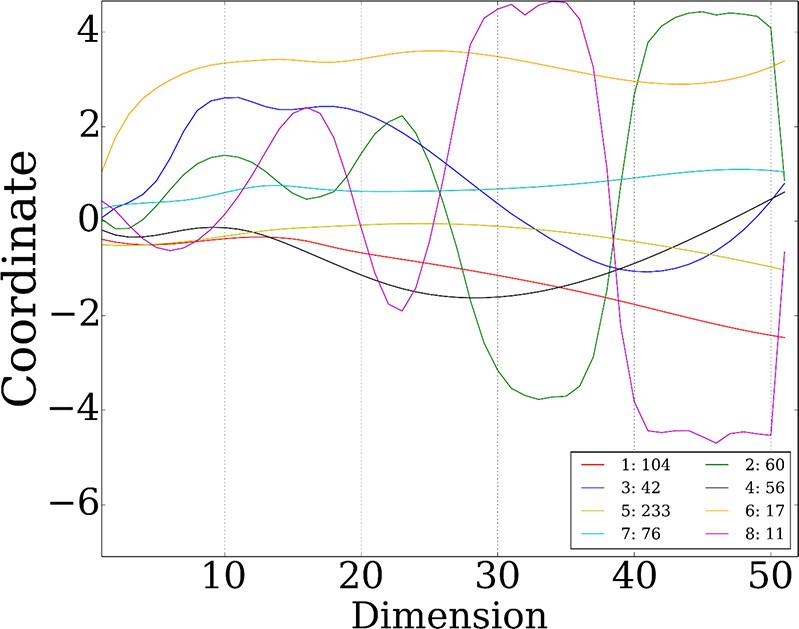
8 stable miRNA clusters.
https://doi.org/10.7554/eLife.18541.016
Figure 4—figure supplement 3
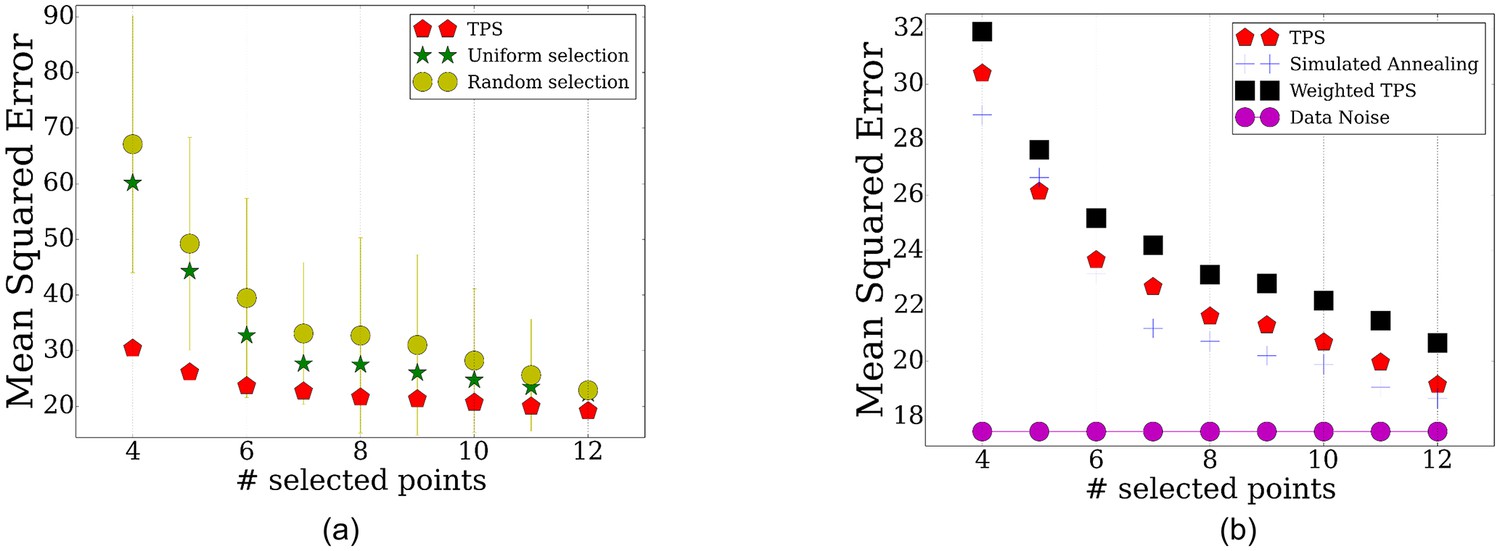
TPS performance for the proteomics data using different number of time points.
(a) Comparison of the reconstruction error when using the points selected by TPS, uniform selection of points, and when using the same number of random points from the overall set of sampled points. (b) Error comparisons of TPSto noise, and various search and initialization options discussed in Methods.
Figure 5 with 2 supplements
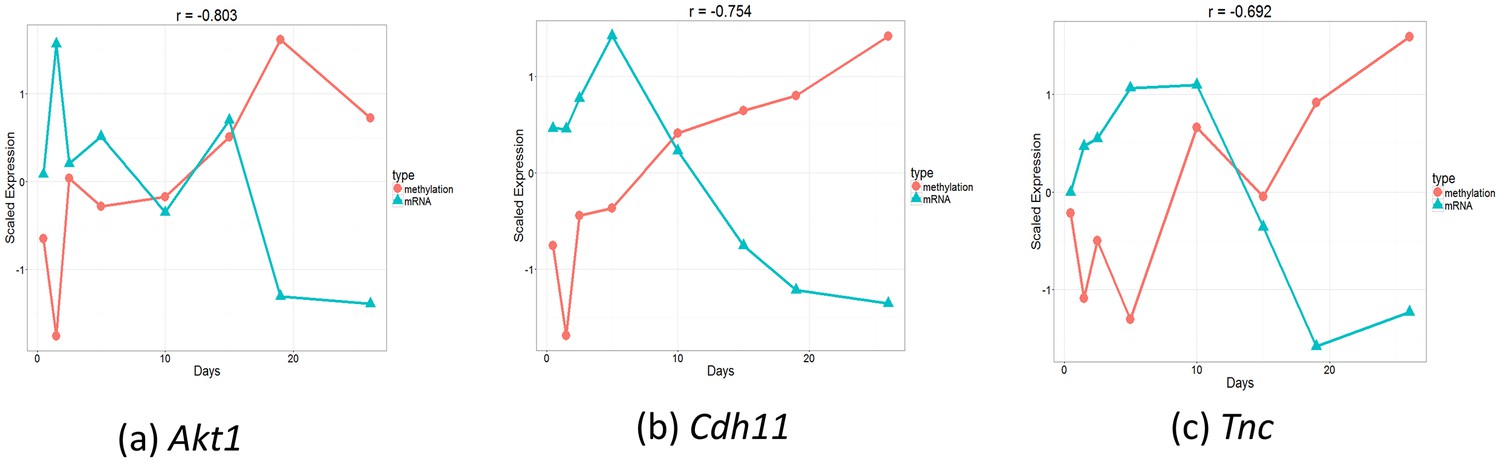
Comparison of gene expression and methylation data for selected genes.
(a). Akt1. , (b). Cdh11. , (c). Tnc.
Figure 5—figure supplement 1
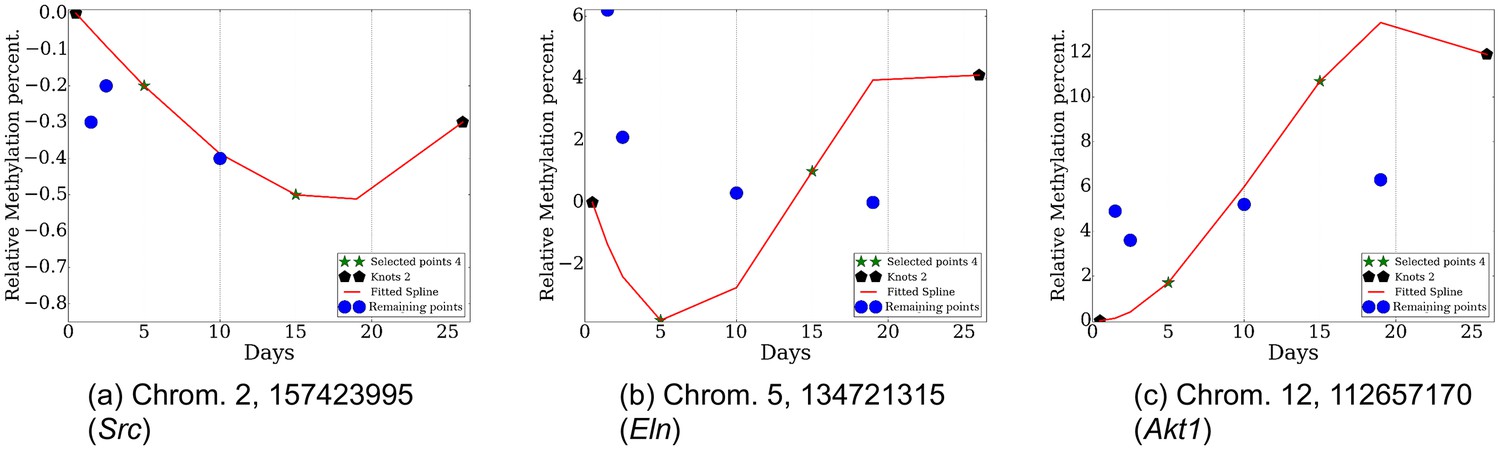
Reconstructed methylation proles over several loci (chromosome, position) with corresponding genes.
https://doi.org/10.7554/eLife.18541.019
Figure 5—figure supplement 2
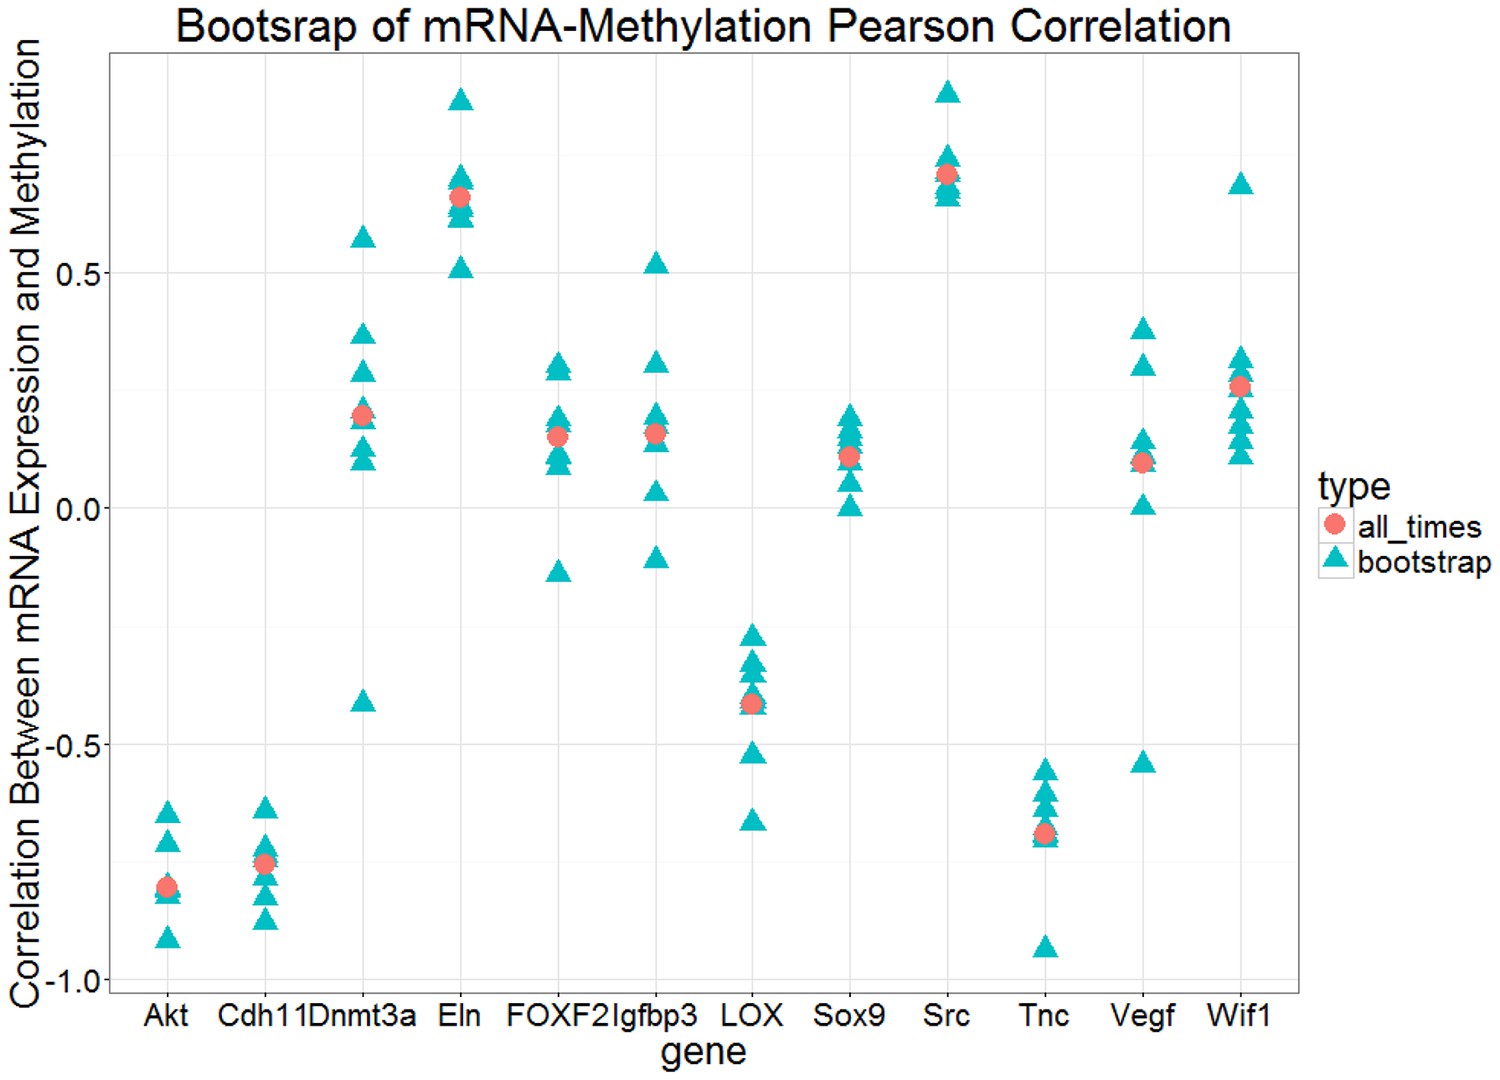
Bootstrap analysis of Pearson correlation r between expression and methylation datasets over eight time points for each gene.
The red circles are the Pearson correlation over all eight points and the blue triangles are the Pearson correlation for all subsets of 7 points.
Figure 6 with 1 supplement
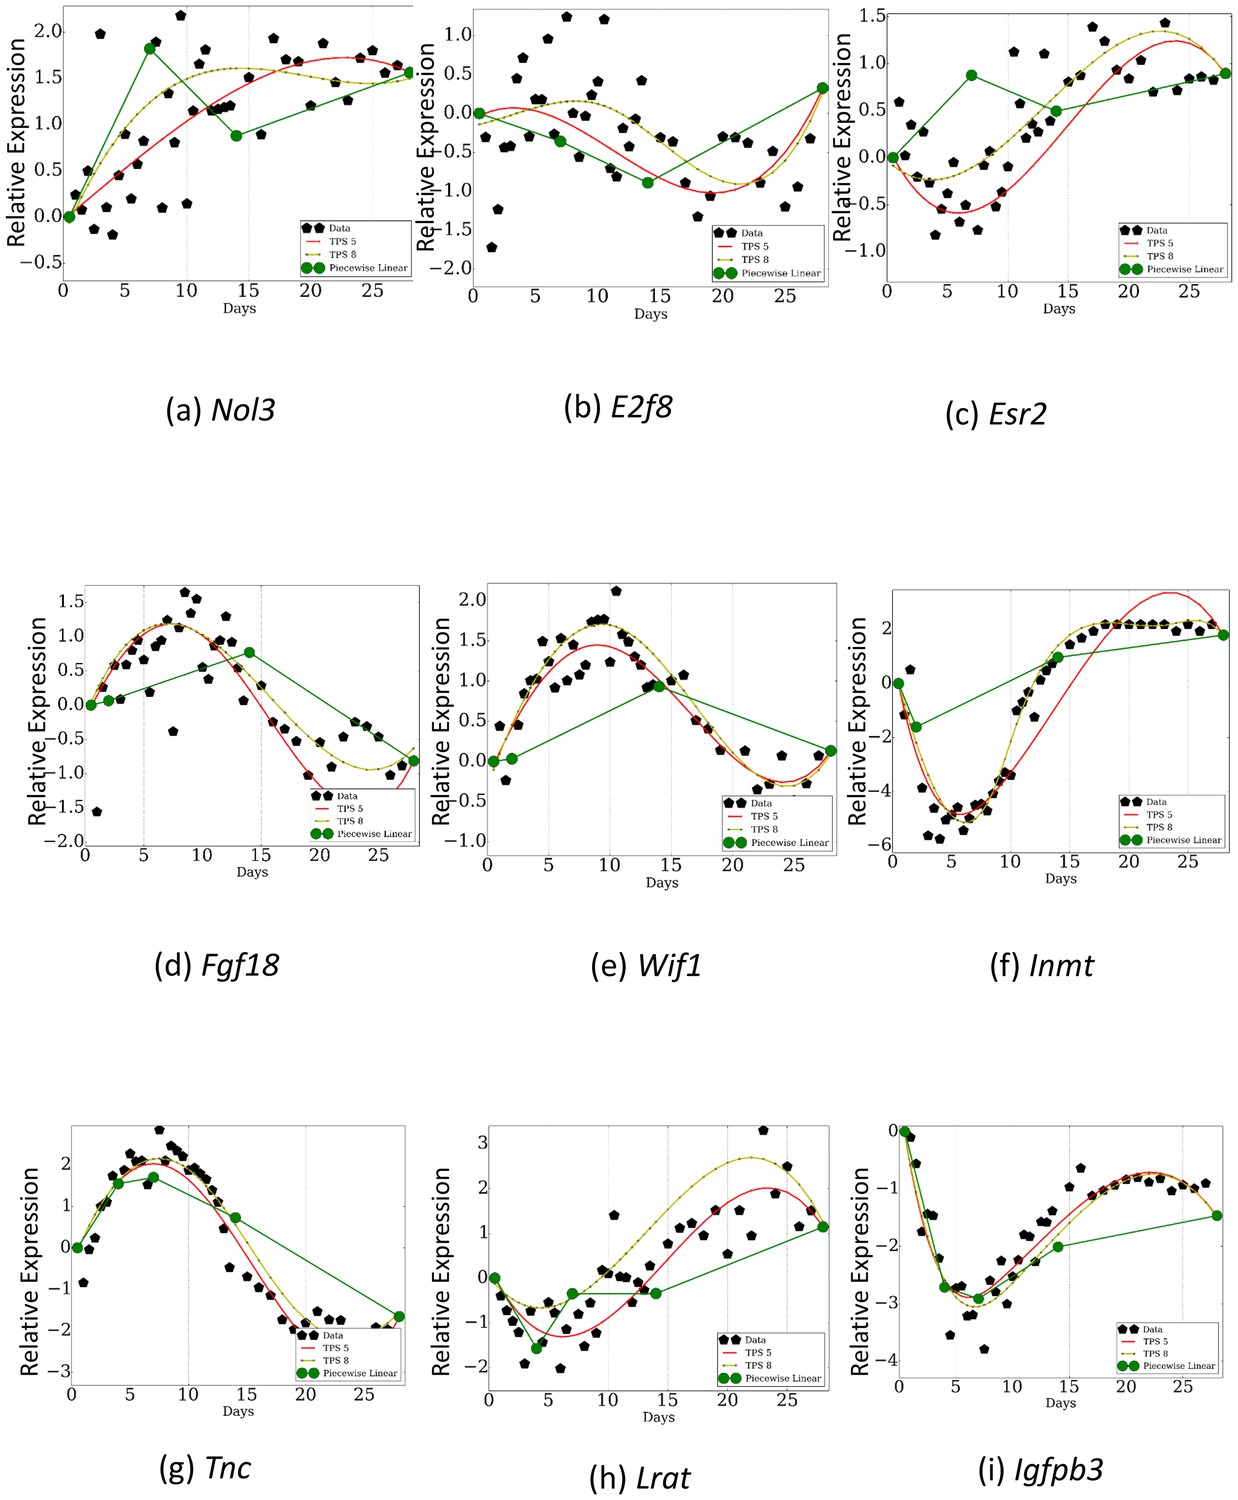
Comparison of TPS with sampling rates used in previous studies.
Dark green curves are the reconstructed profiles based on the points profiled by prior studies. Light green and red curves are based on the points selected by TPS . As can be seen, even when comparing results from using the same number of points, TPS can identify key events for some of the genes that are missed when using the phenotype based sampling rates. Subfigures a,b, and c are a piecewise linear fit over points 0.5, 7.0, 14.0, 28.0 . Subfigures d,e, and f are a piecewise linear fit over points 0.5, 2.0, 14.0, 28.0. Subfigures g,h, and i are a piecewise linear fit over points 0.5, 4.0, 7.0, 14.0, 28.0.
Figure 6—figure supplement 1
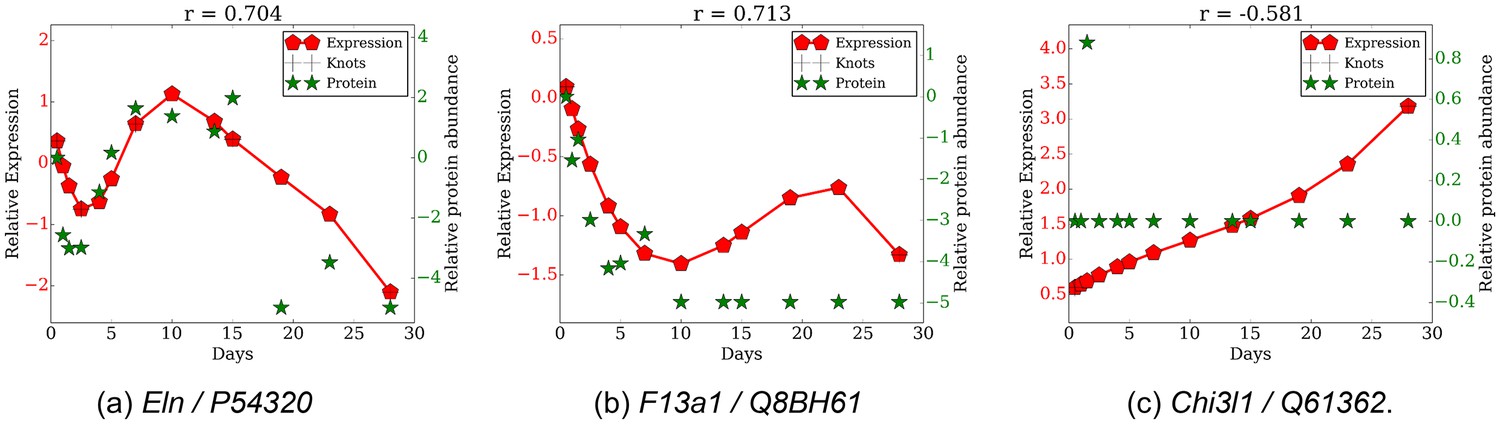
Comparison of gene expression and protein abundance for selected gene protein pairs.
(a) Eln/P54320, (b) F13a1/Q8BH61, (c) Chil1/Q61362.
Tables
Table 1
Summary of prior high throughput lung development studies.
| Reference | Data types | Selected time points (Days) |
|---|---|---|
mRNA expression | E9, E4, E17, 0, 7, 14, 28 | |
mRNA expression | E16, E18, 0, 7, 14, 28 | |
microRNA expression | E16, E19, E21, 0, 6, 14, 60 | |
mRNA and microRNA expression | E12, E14, E16, 0, 2, 10 | |
Protein expression levels | E12, E14, E18, 2, 14, 56 | |
mRNA and miRNA expression | 0, 4, 7, 14, 42 | |
mRNA expression | 0, 7, 14, adult | |
mRNA expression | E15, E17, E19, E21, 1, 14, 84 | |
mRNA expression | E18, 1, 4, 7, 10, 14, 21, adult |
Appendix 2—table 1
List of genes used for the Nanostring analysis and the rational for their inclusion.
| Ensembl gene ID | Accession number | Gene name | Rationale |
|---|---|---|---|
| ENSMUSG00000024130 | NM_001039581.2 | Abca3 | Alveolar Type II cell marker |
| ENSMUSG00000031378 | NM_007435.1 | Abcd1 | important in other processes (IPF, COPD etc) |
| ENSMUSG00000029802 | NM_011920.3 | Abcg2 | Mesenchymal cell marker |
| ENSMUSG00000035783 | NM_007392.3 | Acta2 | Fibroblast cell marker |
| ENSMUSG00000029580 | NM_007393.1 | Actb | Common house-keeping gene |
| ENSMUSG00000036040 | NM_029981.1 | Adamtsl2 | Altered DNA methylation during septation |
| ENSMUSG00000015452 | NM_007425.2 | Ager | Alveolar Type I cell marker |
| ENSMUSG00000001729 | NM_001165894.1 | Akt1 | Altered DNA methylation during septation |
| ENSMUSG00000053279 | NM_013467.3 | Aldh1a1 | Important for septation |
| ENSMUSG00000013584 | NM_009022.3 | Aldh1a2 | Potentially important for septation |
| ENSMUSG00000022244 | NM_008537.4 | Amacr | important in other processes (IPF , COPD etc) |
| ENSMUSG00000044217 | NM_009701.4 | Aqp5 | Alveolar Type I cell marker |
| ENSMUSG00000026576 | NM_009721.5 | Atp1b1 | Lung fluid clearance |
| ENSMUSG00000060802 | NM_009735.3 | B2m | Common house-keeping gene |
| ENSMUSG00000102037 | NM_009742.3 | Bcl2a1a | Apoptosis regulator |
| ENSMUSG00000056216 | NM_009884.3 | Cebpg | Important for lung development |
| ENSMUSG00000029084 | NM_007646.4 | Cd38 | Airway smooth muscle cell functional responses |
| ENSMUSG00000018774 | NM_009853.1 | Cd68 | Monocyte cell marker |
| ENSMUSG00000031673 | NM_009866.4 | Cdh1 | Epithelial cell marker |
| ENSMUSG00000064246 | NM_007695.2 | Chil1 | Monocyte cell marker |
| ENSMUSG00000040809 | NM_009892.1 | Chil3 | Increased during septation |
| ENSMUSG00000022512 | NM_016674.3 | Cldn1 | Tight junction protein |
| ENSMUSG00000070473 | NM_009902.4 | Cldn3 | Tight junction protein (mostly epithelial) |
| ENSMUSG00000041378 | NM_013805.4 | Cldn5 | Tight junction protein |
| ENSMUSG00000018569 | NM_016887.6 | Cldn7 | Tight junction protein (mostly epithelial) |
| ENSMUSG00000001506 | NM_007742.3 | Col1a1 | Fibroblast cell marker |
| ENSMUSG00000063063 | NM_009819.2 | Ctnna2 | Altered DNA methylation during septation |
| ENSMUSG00000031360 | NM_001168571.1 | Ctps2 | important in other processes (IPF , COPD etc) |
| ENSMUSG00000040856 | NM_010052.4 | Dlk1 | Decreased during septation |
| ENSMUSG00000020661 | NM_007872.4 | Dnmt3a | Altered DNA methylation during septation |
| ENSMUSG00000046179 | NM_001013368.5 | E2f8 | Altered DNA methylation during septation |
| ENSMUSG00000000303 | NM_009864.2 | Cdh1 | Epithelial cell marker |
| ENSMUSG00000020122 | NM_207655.2 | Egfr | Important for lung development |
| ENSMUSG00000029675 | NM_007925.3 | Eln | Altered DNA methylation during septation |
| ENSMUSG00000045394 | NM_008532.2 | Epcam | Epithelial cell marker |
| ENSMUSG00000052504 | NM_010140.3 | Epha3 | Involved in lung development |
| ENSMUSG00000028289 | NM_001122889.1 | Epha7 | Involved in lung cancer, potential role in development |
| ENSMUSG00000021055 | NM_010157.3 | Esr2 | Important regulator of multiple processes |
| ENSMUSG00000061731 | NM_010162.2 | Ext1 | Altered DNA methylation during septation |
| ENSMUSG00000039109 | NM_001166391.1 | F13a1 | Involved in lung injury , cancer |
| ENSMUSG00000057967 | NM_008005.1 | Fgf18 | Important for septation |
| ENSMUSG00000030849 | NM_010207.2 | Fgfr2 | Important regulator of multiple processes |
| ENSMUSG00000078302 | NM_008242.2 | Foxd1 | Pericyte cell marker |
| ENSMUSG00000042812 | NM_010426.1 | Foxf1 | Involved in lung development |
| ENSMUSG00000038402 | NM_010225.1 | Foxf2 | Altered DNA methylation during fibrosis |
| ENSMUSG00000001020 | NM_011311.1 | S100a4 | Fibroblast cell marker |
| ENSMUSG00000057666 | NM_001001303.1 | Gapdh | Common house-keeping gene |
| ENSMUSG00000005836 | NM_010258.3 | Gata6 | Important regulator of multiple processes |
| ENSMUSG00000029992 | NM_013528.3 | Gfpt1 | important in other processes (IPF, COPD etc) |
| ENSMUSG00000041624 | NM_001033322.2 | Gucy1a2 | Important for septation |
| ENSMUSG00000025534 | NM_010368.1 | Gusb | Common house-keeping gene |
| ENSMUSG00000021109 | NM_010431.2 | Hif1a | Hypoxia signaling |
| ENSMUSG00000058773 | NM_020034.1 | Hist1h1b | Decreased during septation |
| ENSMUSG00000061615 | NM_175660.3 | Hist1h2ab | Decreased during septation |
| ENSMUSG00000032126 | NM_013551.2 | Hmbs | Common house-keeping gene |
| ENSMUSG00000029919 | NM_019455.4 | Hpgds | important in other processes (IPF, COPD etc) |
| ENSMUSG00000025630 | NM_013556.2 | Hprt | Common house-keeping gene |
| ENSMUSG00000020053 | NM_001111274.1 | Igf1 | Regulating miRNA altered during septation |
| ENSMUSG00000020427 | NM_008343.2 | Igfbp3 | Altered DNA methylation during septation, fibrosis |
| ENSMUSG00000003477 | NM_009349.3 | Inmt | Increased during septation |
| ENSMUSG00000026768 | NM_001001309.2 | Itga8 | Involved in lung development |
| ENSMUSG00000040029 | NM_001081113.1 | Ipo8 | important in other processes (IPF, COPD etc) |
| ENSMUSG00000030786 | NM_001082960.1 | Itgam | Monocyte cell marker |
| ENSMUSG00000030789 | NM_021334.2 | Itgax | Monocyte cell marker |
| ENSMUSG00000090122 | NM_021487.1 | Kcne1l | important in other processes (IPF, COPD etc) |
| ENSMUSG00000063142.10 | XM_006518608.1 | Kcnma1 | Altered DNA methylation during septation |
| ENSMUSG00000079852 | NM_010649.3 | Klra4 | Increased during septation |
| ENSMUSG00000023043 | NM_010664.2 | Krt18 | Epithelial cell marker |
| ENSMUSG00000061527 | NM_027011.2 | Krt5 | Basal cell marker |
| ENSMUSG00000029570 | NM_008494.3 | Lfng | Important for septation |
| ENSMUSG00000024529 | NM_010728.2 | Lox | Altered DNA methylation during fibrosis |
| ENSMUSG00000028003 | NM_023624.4 | Lrat | Increased during septation |
| ENSMUSG00000027070 | NM_001081088.1 | Lrp2 | Altered DNA methylation during septation |
| ENSMUSG00000061068 | NM_010779.2 | Mcpt4 | Decreased during septation |
| ENSMUSG00000026110 | NM_173870.2 | Mgat4a | Involved in acute lung injury |
| ENSMUSG00000043613 | NM_010809.1 | Mmp3 | Increased during septation |
| ENSMUSG00000018623 | NM_010810.4 | Mmp7 | Important in lung fibrosis |
| ENSMUSG00000066108 | XM_006508653.1 | Muc5b | Important in lung fibrosis |
| ENSMUSG00000037974 | NM_010844.1 | Muc5ac | Epithelial cell marker |
| ENSMUSG00000024304 | NM_007664.4 | Cdh2 | Tight Junction/Adhesion |
| ENSMUSG00000054008 | NM_008306.4 | Ndst1 | Involved in pathologic airway remodeling |
| ENSMUSG00000031902 | NM_010901.2 | Nfatc3 | Important for lung development |
| ENSMUSG00000073435 | NM_019730.2 | Nme3 | Apoptosis-related gene |
| ENSMUSG00000026575 | NM_138314.3 | Nme7 | Important for stem cell renewal |
| ENSMUSG00000014776 | NM_030152.4 | Nol3 | Regulating miRNA altered during septation |
| ENSMUSG00000051048 | NM_177161.4 | P4ha3 | Important in lung fibrosis |
| ENSMUSG00000068039 | NM_013686.3 | Tcp1 | Basal cell marker |
| ENSMUSG00000029998 | NM_025823.4 | Pcyox1 | important in other processes (IPF , COPD etc) |
| ENSMUSG00000029231 | NM_011058.2 | Pdgfra | Important for septation |
| ENSMUSG00000024620 | NM_008809.1 | Pdgfrb | Pericyte cell marker |
| ENSMUSG00000028583 | NM_010329.2 | Pdpn | Alveolar Type I cell marker |
| ENSMUSG00000062070 | NM_008828.2 | Pgk1 | important in other processes (IPF , COPD etc) |
| ENSMUSG00000053398 | NM_016966.3 | Phgdh | important in other processes (IPF, COPD etc) |
| ENSMUSG00000005198 | NM_009089.2 | Polr2a | important in other processes (IPF, COPD etc) |
| ENSMUSG00000071866 | NM_008907.1 | Ppia | Common house-keeping gene |
| ENSMUSG00000024997 | NM_007452.2 | Prdx3 | Mitochondrial oxidative stress regulator |
| ENSMUSG00000026134 | NM_008922.2 | Prim2 | Expressed in placenta and crucial for mammalian growth. |
| ENSMUSG00000033491 | NM_178738.3 | Prss35 | Decreased during septation |
| ENSMUSG00000032487 | NM_011198.3 | Ptgs2 | Regulating miRNA altered during septation |
| ENSMUSG00000056458 | NM_011973.2 | Mok | Alveolar Type I cell marker |
| ENSMUSG00000037992 | NM_001177302.1 | Rara | Important for septation |
| ENSMUSG00000022883 | NM_019413.2 | Robo1 | Altered DNA methylation during septation |
| ENSMUSG00000025508 | NM_026020.6 | Rplp2 | |
| ENSMUSG00000066361 | NM_008458.2 | Serpina3c | Increased during septation |
| ENSMUSG00000022097 | NM_011359.1 | Sftpc | Alveolar Type II cell marker |
| ENSMUSG00000021795 | NM_009160.2 | Sftpd | Alveolar Type II cell marker |
| ENSMUSG00000050010 | NM_001033415.3 | Shisa3 | Altered DNA methylation during septation |
| ENSMUSG00000032402 | NM_016769.3 | Smad3 | Important for septation |
| ENSMUSG00000042821 | NM_011427.2 | Snai1 | Important for lung development and injury |
| ENSMUSG00000000567 | NM_011448.4 | Sox9 | Altered DNA methylation during septation |
| ENSMUSG00000027646 | NM_001025395.2 | Src | Altered DNA methylation during septation |
| ENSMUSG00000014767 | NM_013684.3 | Tbp | Common house-keeping gene , involved in multiple processes |
| ENSMUSG00000000094 | NM_172798.1 | Tbx4 | Altered DNA methylation during septation |
| ENSMUSG00000032228 | NM_011544.3 | Tcf12 | Involved in multiple developmental processes |
| ENSMUSG00000022797 | NM_011638.3 | Tfrc | Common house-keeping gene |
| ENSMUSG00000002603 | NM_011577.1 | Tgfb1 | Important for septation |
| ENSMUSG00000045691 | NM_153083.5 | Thtpa | important in other processes (IPF, COPD etc) |
| ENSMUSG00000032011 | NM_009382.3 | Thy1 | Fibroblast cell marker |
| ENSMUSG00000028364 | NM_011607.1 | Tnc | Altered DNA methylation during septation |
| ENSMUSG00000044986 | NM_009437.4 | Tst | important in other processes (IPF, COPD etc) |
| ENSMUSG00000026803 | NM_009442.2 | Ttf1 | Important for lung development |
| ENSMUSG00000008348 | NM_019639.4 | Ubc | Common house-keeping gene |
| ENSMUSG00000023951 | NM_001025250.3 | Vegfa | Angiogenesis; Altered DNA methylation during septation |
| ENSMUSG00000026728 | NM_011701.4 | Vim | Mesenchymal cell marker |
| ENSMUSG00000020218 | NM_011915.1 | Wif1 | Altered DNA methylation during septation |
| ENSMUSG00000022285 | NM_011740.2 | Ywhaz | Common house-keeping gene |
Appendix 2—table 2
Summary of methylation dataset
| Gene | Number of loci | Gene | Number of loci | |
|---|---|---|---|---|
| Cdh11 | 14 | Zfp536 | 16 | |
| Src | 11 | Igfbp3 | 34 | |
| Sox9 | 16 | Wif1 | 21 | |
| Dnmt3a | 41 | Vegfa | 20 | |
| Eln | 20 | Tnc | 4 | |
| Foxf2 | 41 | Lox | 17 | |
| Akt1 | 11 |
Appendix 2—table 3
Target regions for each gene for methylation analysis
| Gene | Ensembl gene ID | Ensembl transcript ID | Assay ID | Target location | Fwd Tm | Rev Tm | % GC | Coordinates (GRCm38/mm10) |
|---|---|---|---|---|---|---|---|---|
| Akt1 | ENSMUSG00000001729 | ENSMUST00000001780 | ADS3333 | 3’ UTR | 68 | 65.5 | 31.5 | chr12:112654548–112654709 |
| Akt1 | ENSMUSG00000001729 | ENSMUST00000001780 | ADS3332 | Intron 9/Exon 10 | 68.3 | 69.8 | 38.3 | chr12:112657120–112657273 |
| Cdh11 | ENSMUSG00000031673 | ENSMUST00000075190 | ADS3308 | Intron 3 | 66.8 | 68.3 | 36.9 | chr8:102677609–102677766 |
| Cdh11 | ENSMUSG00000031673 | ENSMUST00000075190 | ADS3318 | Intron 1 | 64.1 | 69.7 | 37 | chr8:102784569–102784722 |
| Cdh11 | ENSMUSG00000031673 | ENSMUST00000075190 | ADS3307 | Promoter | 69.1 | 71.3 | 29.9 | chr8:102785456–102785649 |
| Dnmt3a | ENSMUSG00000020661 | ENSMUST00000020991 | ADS3326 | Promoter | 68.6 | 67.7 | 47.1 | chr12:3806505–3806659 |
| Dnmt3a | ENSMUSG00000020661 | ENSMUST00000020991 | ADS632 | Intron 1 | 64 | 64.7 | 32.2 | chr12:3834382–3834592 |
| Dnmt3a | ENSMUSG00000020661 | ENSMUST00000020991 | ADS3328 | Exon 6/Intron 6 | 64.7 | 64 | 31.8 | chr12:3901545–3901764 |
| Dnmt3a | ENSMUSG00000020661 | ENSMUST00000020991 | ADS3329 | Intron 6 | 66.8 | 66.1 | 25.4 | chr12:3907514–3907765 |
| Eln | ENSMUSG00000029675 | ENSMUST00000015138 | ADS3319 | Intron 16 | 67.1 | 67.9 | 47.8 | chr5:134721191–134721447 |
| Eln | ENSMUSG00000029675 | ENSMUST00000015138 | ADS3309 | Intron 7/Exon 8/Intron 8 | 64.1 | 67.4 | 37.8 | chr5:134729221–134729526 |
| Eln | ENSMUSG00000029675 | ENSMUST00000015138 | ADS024 | Promoter | 65 | 67.4 | 42.6 | chr5:134747412–134747606 |
| Foxf2 | ENSMUSG00000038402 | ENSMUST00000042054 | ADS4505 | Promoter | 63.1 | 65 | 42.5 | chr13: 31625470–31625556 |
| Foxf2 | ENSMUSG00000038402 | ENSMUST00000042054 | ADS4506 | 5-UTR | 65.1 | 64.8 | 37.9 | chr13:31625904–31626093 |
| Foxf2 | ENSMUSG00000038402 | ENSMUST00000042054 | ADS4507 | 3-Downstream | 68 | 68.9 | 28.1 | chr13:31632481–31632716 |
| Igfbp3 | ENSMUSG00000020427 | ENSMUST00000020702 | ADS5134 | 3-Downstream | 69.3 | 69.6 | 32.1 | chr11:7203969–7204208 |
| Igfbp3 | ENSMUSG00000020427 | ENSMUST00000020702 | ADS3301 | Exon 4/Intron 4 | 70.5 | 70 | 33 | chr11:7208306–7208481 |
| Igfbp3 | ENSMUSG00000020427 | ENSMUST00000020702 | ADS5133 | Intron 1 | 68.3 | 68.5 | 26.1 | chr11:7212803–7213043 |
| Igfbp3 | ENSMUSG00000020427 | ENSMUST00000020702 | ADS5132 | Promoter | 67.8 | 69.2 | 28.7 | chr11:7214210–7214499 |
| Lox | ENSMUSG00000024529 | ENSMUST00000171470 | ADS4512 | Exon 2 | 69 | 70.9 | 31.3 | chr18: 52529184–52529315 |
| Lox | ENSMUSG00000024529 | ENSMUST00000171470 | ADS4513 | Exon 4 | 65.7 | 64.8 | 28.5 | chr18:52526887–52527023 |
| Lox | ENSMUSG00000024529 | ENSMUST00000171470 | ADS4511 | Promoter | 64.7 | 66.4 | 21.2 | chr18:52530080–52530216 |
| Sox9 | ENSMUSG00000000567 | ENSMUST00000000579 | ADS796 | Promoter | 61 | 66.1 | 31.4 | chr11:112781641–112781811 |
| Sox9 | ENSMUSG00000000567 | ENSMUST00000000579 | ADS3311 | Intron 1 | 69.7 | 68.5 | 34.7 | chr11:112783358–112783605 |
| Sox9 | ENSMUSG00000000567 | ENSMUST00000000579 | ADS3310 | Exon 3 | 66.4 | 63.1 | 26.2 | chr11:112784760–112784885 |
| Src | ENSMUSG00000027646 | ENSMUST00000109533 | ADS4514 | Intron 1 | 64.8 | 65.9 | 35.9 | chr2:157423925–157424027 |
| Src | ENSMUSG00000027646 | ENSMUST00000109533 | ADS4515 | Intron 4 | 66.5 | 68.8 | 37.6 | chr2:157457351–157457520 |
| Src | ENSMUSG00000027646 | ENSMUST00000109533 | ADS4516 | Exon 14 | 65.5 | 65.6 | 33.7 | chr2:157469741–157469912 |
| Tnc | ENSMUSG00000028364 | ENSMUST00000107377 | ADS3324 | Intron 14 | 63.3 | 62.2 | 23 | chr4:63982645–63982818 |
| Tnc | ENSMUSG00000028364 | ENSMUST00000107377 | ADS3325 | Intron 14 | 62.5 | 61.6 | 20.2 | chr4:63982799–63982986 |
| Tnc | ENSMUSG00000028364 | ENSMUST00000107377 | ADS3323 | Exon 3 | 65 | 67.5 | 35.2 | chr4:64017478–64017721 |
| Tnc | ENSMUSG00000028364 | ENSMUST00000107377 | ADS3322 | Promoter | 62.7 | 63.9 | 26.7 | chr4:64047034–64047149 |
| Vegfa | ENSMUSG00000023951 | ENSMUST00000071648 | ADS3336 | 3-UTR | 67.2 | 66.9 | 32.6 | chr17:46018598–46018735 |
| Vegfa | ENSMUSG00000023951 | ENSMUST00000071648 | ADS3335 | Intron 2/Exon 3 | 64.6 | 63.8 | 29.5 | chr17:46025336–46025620 |
| Wif1 | ENSMUSG00000020218 | ENSMUST00000020439 | ADS3302 | Promoter | 69.4 | 68.7 | 31.3 | chr10:121033395–121033691 |
| Wif1 | ENSMUSG00000020218 | ENSMUST00000020439 | ADS3303 | Intron 4/Exon 5/Intron 5 | 60.9 | 60.1 | 31.8 | chr10:121083800–121083997 |
| Wif1 | ENSMUSG00000020218 | ENSMUST00000020439 | ADS3304 | Exon 10/3-UTR | 66.6 | 67.5 | 24.8 | chr10:121099752–121099973 |
| Zfp536 | ENSMUSG00000043456 | ENSMUST00000056338 | ADS4510 | 3-Downstream | 65.4 | 67.4 | 35.9 | chr7:37473451–37473606 |
| Zfp536 | ENSMUSG00000043456 | ENSMUST00000056338 | ADS4509 | Exon 4 | 68.4 | 69.9 | 35.4 | chr7:37567973–37568130 |
Appendix 2—table 4
Mean and standard deviation of mean squared error over all genes by TPS selecting points and piecewise linear fits over sets of points identified heuristically in the literature.
| Method | Mean | Std dev |
|---|---|---|
| TPS (, , , and ) | 0.40306335962 | 0.2206665163 |
| Piecewise linear over , , , | 0.594072719494 | 0.399642079492 |
| Piecewise linear over , , , | 0.710967061349 | 0.721681860787 |
| Piecewise linear over , , , , | 0.560990230501 | 0.364739525724 |
Additional files
-
Supplementary file 1
Raw mRNA expression values for the 126 genes studied using nanostring
- https://doi.org/10.7554/eLife.18541.024
-
Supplementary file 2
Raw miRNA expression values from the nanostring analysis.
- https://doi.org/10.7554/eLife.18541.025
Download links
A two-part list of links to download the article, or parts of the article, in various formats.
Downloads (link to download the article as PDF)
Open citations (links to open the citations from this article in various online reference manager services)
Cite this article (links to download the citations from this article in formats compatible with various reference manager tools)
Selecting the most appropriate time points to profile in high-throughput studies
eLife 6:e18541.
https://doi.org/10.7554/eLife.18541


