Mechanism of cargo-directed Atg8 conjugation during selective autophagy
- Max F. Perutz Laboratories (MFPL), University of Vienna, Vienna Biocenter (VBC), Austria
Figures
Figure 1 with 1 supplement
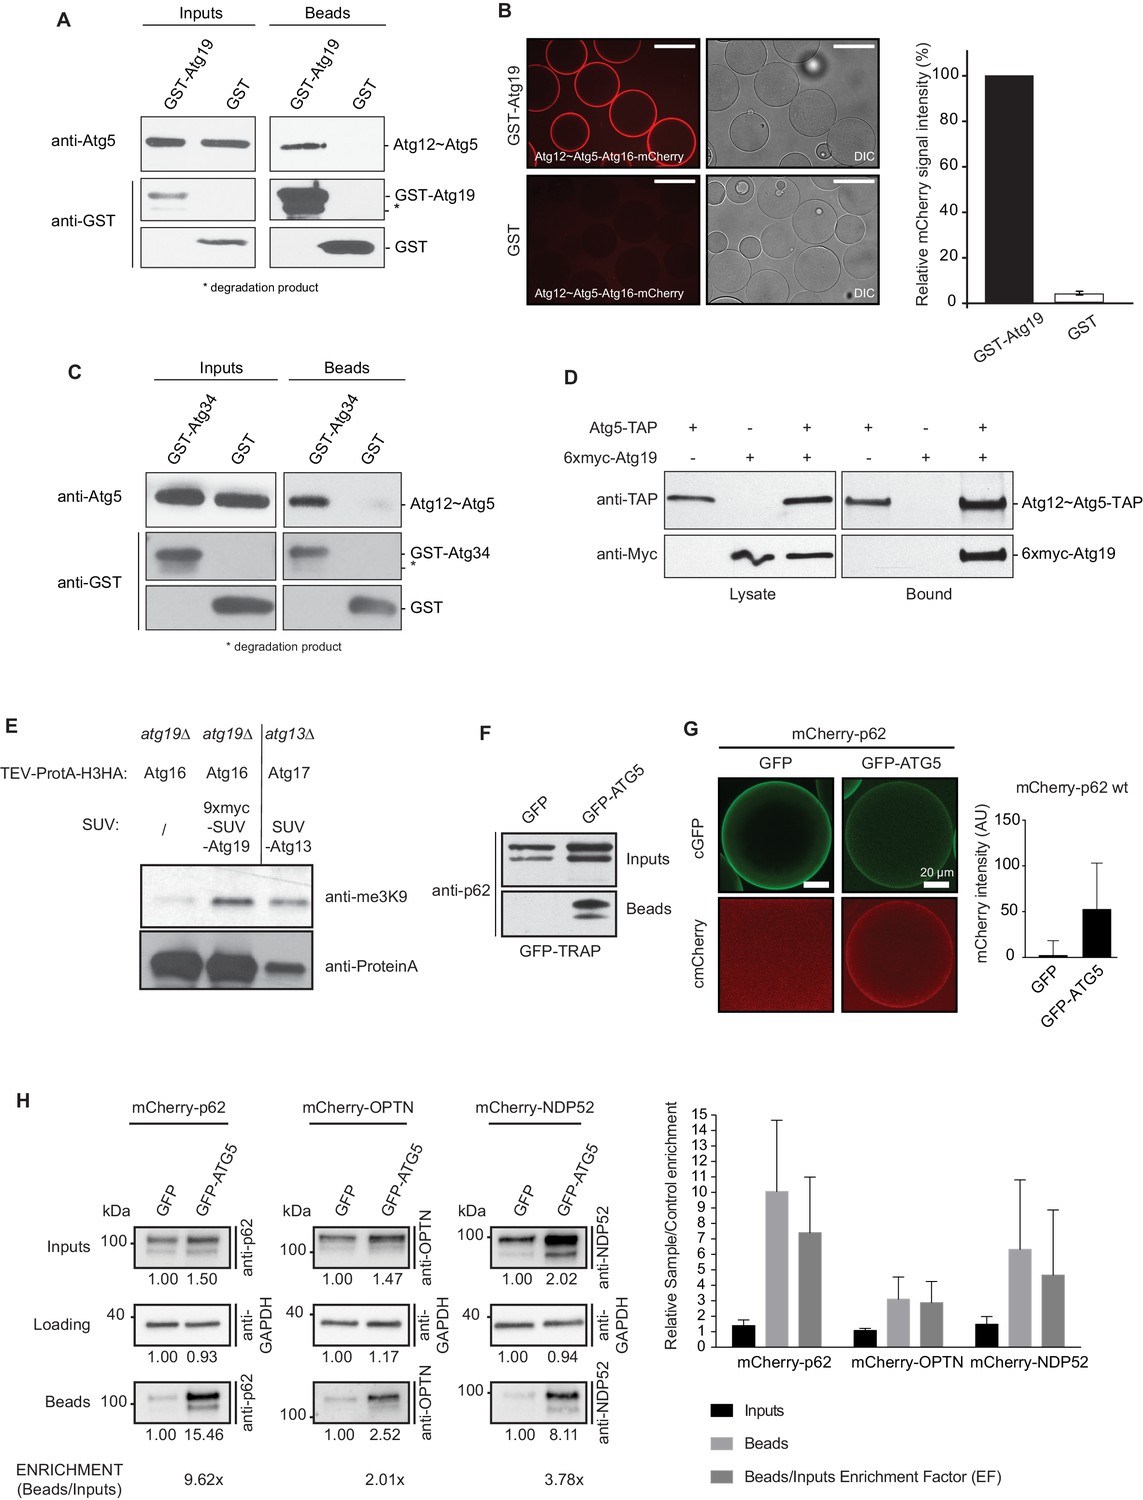
Cargo receptors interact with the Atg12~Atg5-Atg16 complex in vitro and in vivo.
(A) Western blots of GST-pull down experiments using GST-Atg19 as bait and the Atg12~Atg5-Atg16 complex as prey. Degradation bands of GST-Atg19 are marked with an asterisk (*). (B) Glutathione Sepharose beads were coated with GST-Atg19 or GST and imaged in the presence of the Atg12~Atg5-Atg16-mCherry complex at equilibrium. The quantification shows the relative mCherry signal intensity measured at the bead in percent. Three independent experiments were considered for quantification. Scale bar: 100 µm. (C) Same assay as shown in (A) but using GST-Atg34 as a bait. (D) Western blots of a co-immunoprecipitation experiment using atg19Δ, atg8∆ S. cerevisiae cells with integrated Atg5-TAP and transformed with 6xmyc-Atg19. Atg5-TAP was precipitated using magnetic Epoxy IgG-beads. (E) M-Track assay using Protein A-Histone 3 (H3)-tagged Atg16 and Atg19 fused to 9xmyc and the SUV39H1 methyl-transferase (HKMT). Shown is a Western blot with an anti-trimethylation-specific antibody to assess the methylation signal and anti-ProteinA to assess the amount of cleaved protein A-H3 on beads. The Atg13 interaction with Atg17 was used as a positive control for the assay. (F) Co-immunoprecipitation experiment using GFP-TRAP beads incubated with lysates from HeLa cells transfected with the indicated expression constructs. Endogenous p62 was down regulated by RNAi. (G) Lysates from HeLa cells transfected with GFP and mCherry-p62 or GFP-ATG5 and mCherry-p62 were incubated with GFP-TRAP beads and the recruitment of the proteins to the beads was imaged by spinning disc microscopy. The graph shows the average and standard deviation over all beads from one experiment. The endogenous p62 was downregulated by RNAi. (H) Western blot analysis of lysates from HeLa cells co-transfected with the indicated constructs and subjected to anti-GFP immunoprecipitation (GFP-TRAP, Chromotek). Numbers below each blot indicate the relative band intensity for the particular blots shown. The beads/input enrichment factors (EF) indicate the fold of enrichment of each mCherry-tagged cargo receptor in the GFP-ATG5 beads fraction over its correspondent GFP control, normalized on the input levels and equalized to the GAPDH blots. Representative blots of at least four independent experiments are shown (left). The plot shows the average sample/control fold enrichment in the indicated fractions for each cargo receptor. The beads/input enrichment factor is defined as above. Averages and standard deviations of at least four independent experiments are shown (right).
Figure 1—figure supplement 1
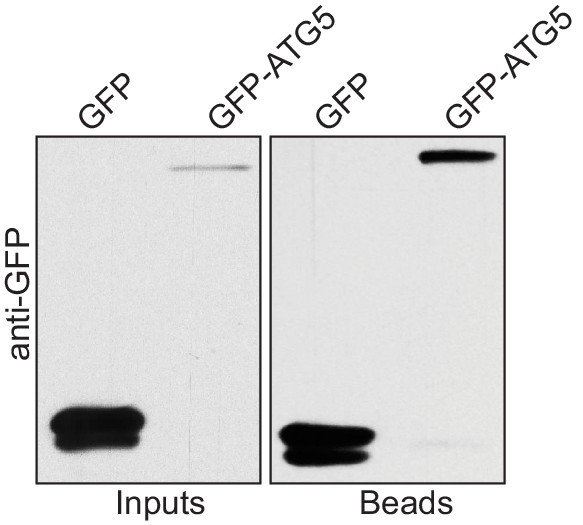
Human ATG5 pulls down p62 from cell lysates.
Anti-GFP blot of the GFP-TRAP experiment shown in Figure 1F. Shown are input and bead fractions.
Figure 2 with 2 supplements
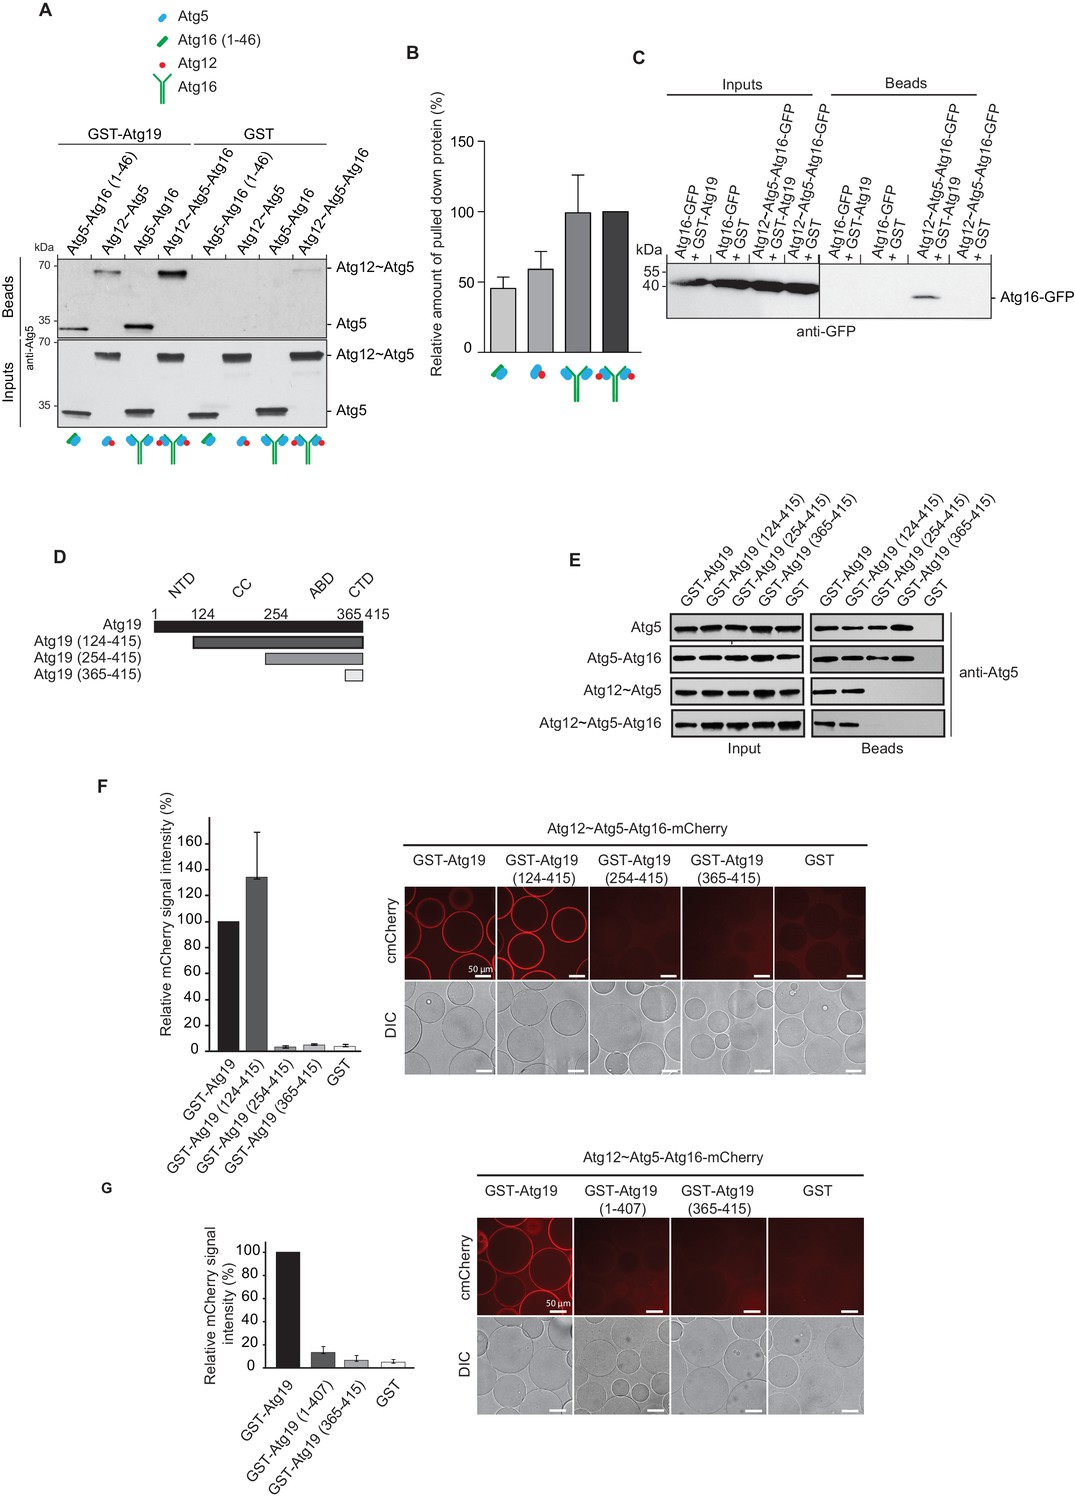
Atg19 directly binds Atg5 via its C-terminal domain and requires its coiled-coil domain to interact with the Atg12~Atg5-Atg16 complex.
(A) GST-pull down experiment using GST-Atg19 or GST as bait in the presence of recombinant Atg5-Atg16 (1–46), Atg12~Atg5, Atg5-Atg16 or Atg12~Atg5-Atg16 complexes as preys. Input and bead fractions were loaded on a SDS-PAGE gel and subjected to Western blotting. Proteins were detected using an anti-Atg5 antibody. See also Figure 2—figure supplements 1 and 2. (B) Quantification of GST-pull down experiments, one of which is shown in (A). The amount of pulled down protein for the Atg12~Atg5-Atg16 complex was set to 100%. Average values were calculated from three independent experiments and plotted in the histogram together with the standard deviations. (C) GST-pull down experiment using GST-Atg19 or GST as bait and recombinant Atg16-meGFP or the Atg12~Atg5-Atg16-meGFP complex as prey. Input and bead samples were loaded on a SDS-PAGE gel and subjected to Western blotting. Proteins were detected using an anti-GFP antibody. See also Figure 2—figure supplement 2. (D) Schematic representation of the Atg19 domain organization. N-terminal domain (NTD, residues 1–124), coiled-coil domain (CC, residues 124–254), Ams1 binding domain (ABD, residue 254–365) and C-terminal domain (CTD, residues 365–415). (E) The Atg12~Atg5-Atg16 complex and its subunits, Atg5-Atg16 (1–46), Atg5-Atg16 and the Atg12~Atg5 conjugate were incubated with either full length GST-Atg19 or truncated versions thereof as baits and the pulled down protein was detected by Western blotting using an anti-Atg5 antibody. The bead fractions showing GST-labeled Atg19 and truncated versions thereof are depicted in Figure 2—figure supplement 2. (F) Glutathione beads coated with full length GST-Atg19 or truncations thereof were incubated with the Atg12~Atg5-Atg16-mCherry complex and its recruitment to the beads was determined by spinning disc microscopy. A quantification of three independent experiments is shown to the left. The signal measured for binding to GST-Atg19 full length was set to 100%. (G) Glutathione beads were coated with Atg19 full length (GST-Atg19), Atg19 C-terminal domain (GST-Atg19(365–415)) or Atg19 lacking the C-terminal canonical AIM motif (GST-Atg19(1–407)) and incubated with Atg12~Atg5-Atg16-mCherry. A quantification of three independent experiments is shown to the left. The signal measured for binding to GST-Atg19 full length was set to 100%.
Figure 2—figure supplement 1
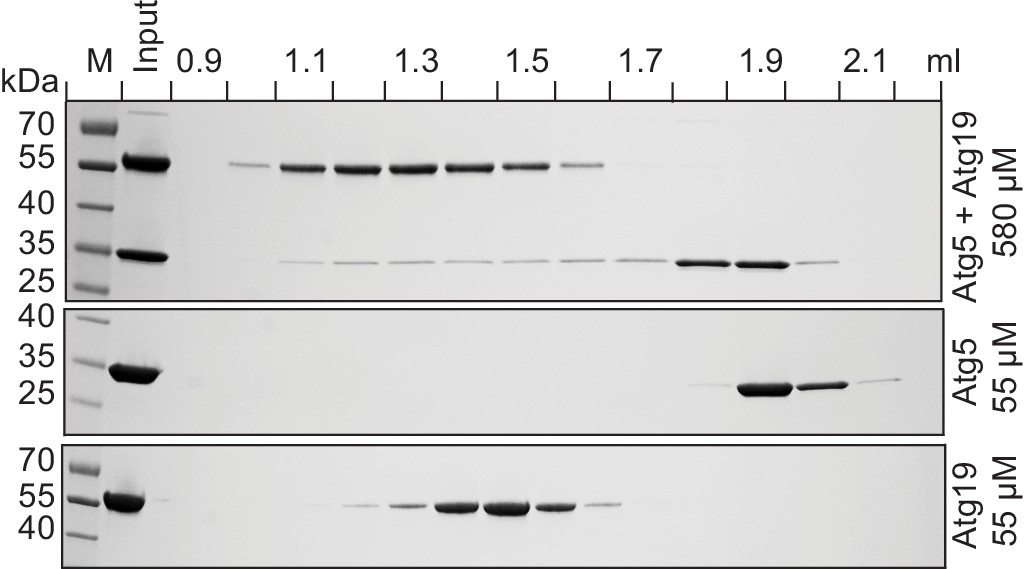
Atg19 and Atg5 interact in solution.
Atg19 and Atg5-Atg16 (1–46) were co-incubated at concentrations of 580 µM and run on a Superose 6 size exclusion column. Aliquots of individual fractions were run on SDS-PAGE gels and Coomassie stained (top panel). Size exclusion chromatography fractions of individual Atg5-Atg16 (1–46) (middle panel) and Atg19 (bottom panel) proteins run at 55 µM concentration.
Figure 2—figure supplement 2

Mapping Atg19 interaction with Atg12~Atg5-Atg16 complex.
(A) Ponceau staining of input samples of pull down experiment shown in Figure 2A. (B) Ponceau staining of input and bead samples of pull down experiment shown in Figure 2C. (C) Coomassie stained gels of GST-labeled Atg19 and truncated versions thereof used for the pull down experiments shown in Figure 2E. Each panel represents final bead fractions after incubation with the indicated prey proteins.
Figure 3 with 2 supplements
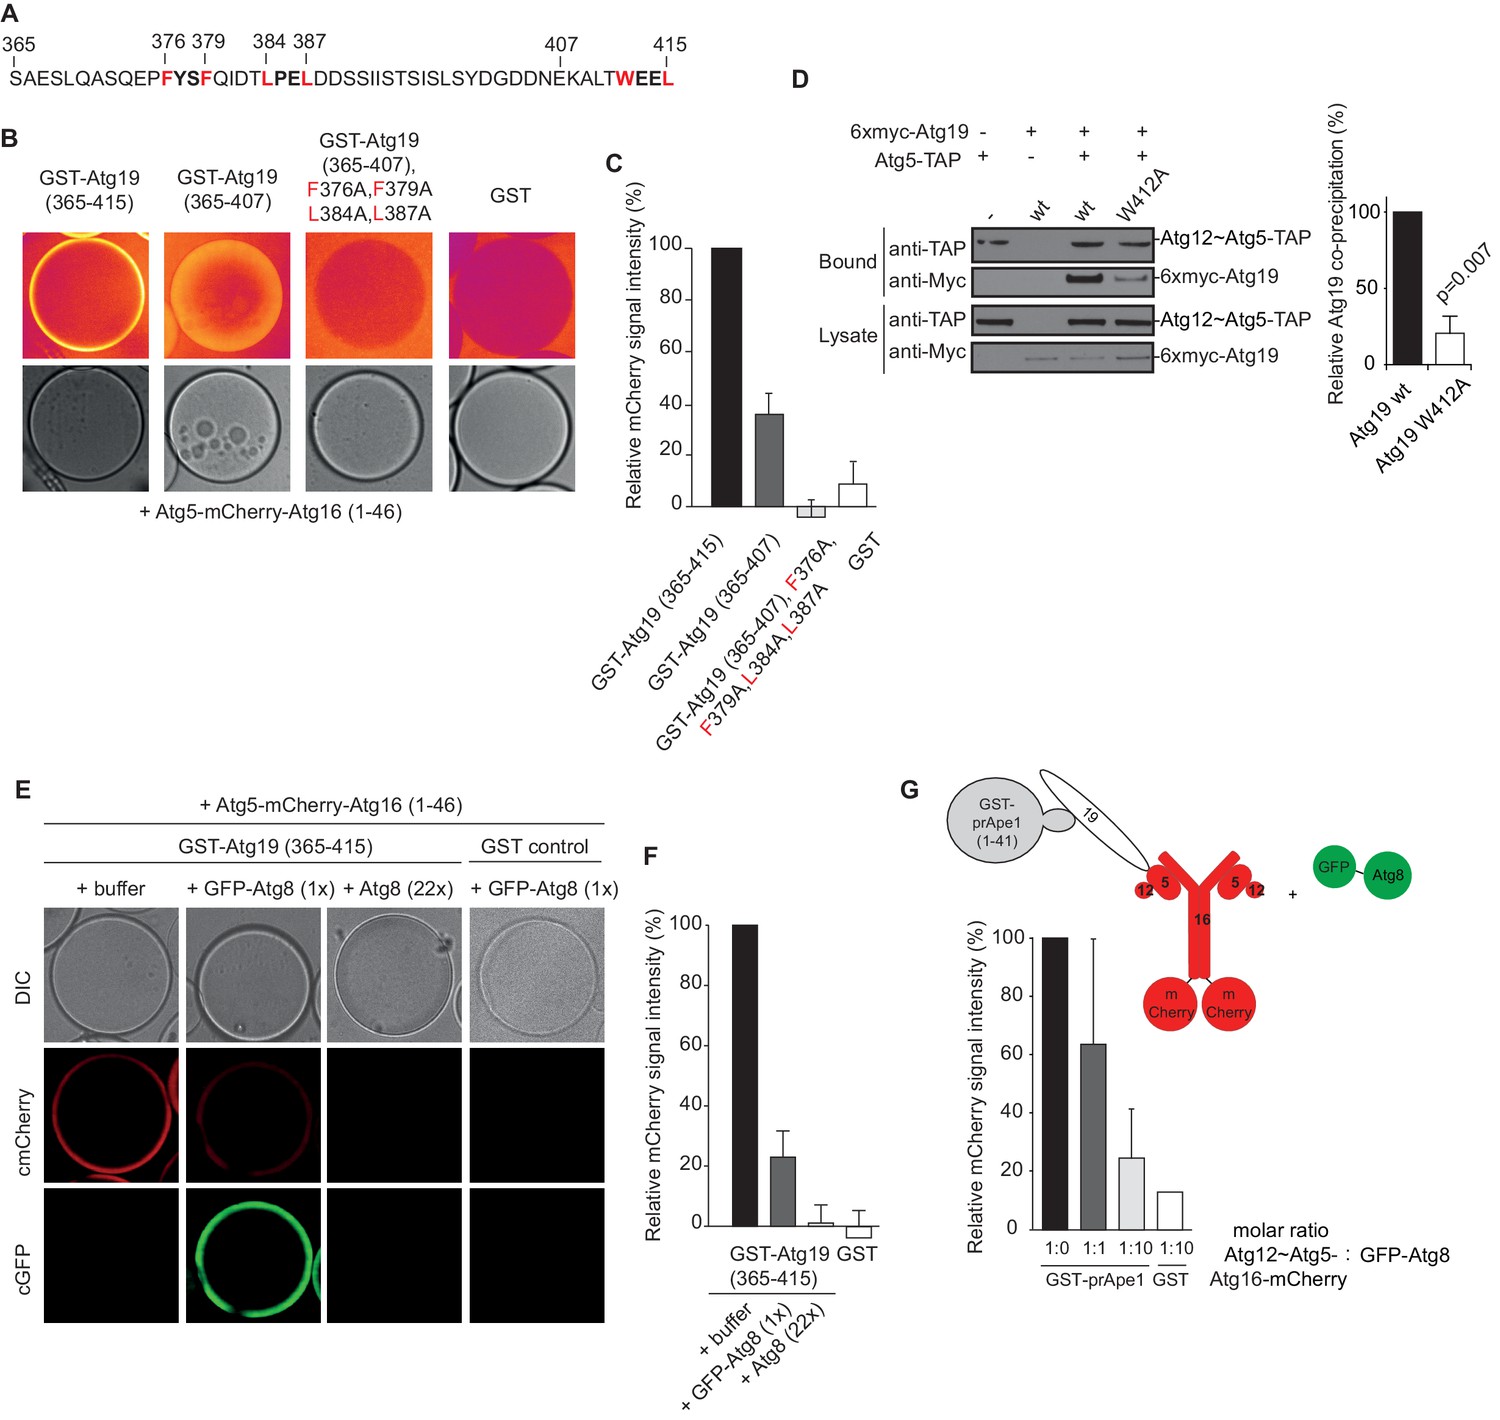
The AIM motifs in the C-terminal domain of Atg19 are required for its interaction with Atg5 and are competitively bound by Atg8.
(A) Amino acid sequence of the C-terminal domain (365-415) of Atg19 containing the canonical AIM motif (412WEEL415) and two AIM-like motifs (376FYSF379, 384LPEL387). (B) Glutathione beads coated with the indicated proteins were imaged in the presence of Atg5-mCherry-Atg16 (1–46) complex under equilibrium conditions. The mCherry signal is shown in false color (ImageJ: Fire). See also Figure 3—figure supplement 1. (C) Quantification of three independent experiments of the relative mCherry signal intensity measured at the bead. Due to optical reasons very low signals at the beads resulted in values lower than the background and thus negative values. Error bars represent standard deviations. (D) Co-immunoprecipitation experiment of 6xmyc-Atg19 or 6xmyc-Atg19W412A with Atg5-TAP as bait in S. cerevisiae cell lysates. Western blots of bead and lysate fractions are shown. Atg12~Atg5-TAP was detected with an anti-TAP and 6xmyc-Atg19 with an anti-Myc antibody. A quantification of three independent experiments is shown to the right. Shown are averages and standard deviations. (E) Glutathione beads coated with the GST-Atg19 C-terminus (365-415) or GST were imaged in the presence of Atg5-mCherry-Atg16 (1–46) complex under equilibrium conditions. For the competition experiment recombinant GFP-Atg8 (or buffer) was added to the sample at a final concentration corresponding to 1x initial concentration of Atg5-mCherry-Atg16 (1–46). Purified Atg8 (or buffer) was added to a final concentration of 22x the initial concentration of Atg5-mCherry-Atg16 (1–46)). Representative microscopy pictures are shown. (F) Quantification of three independent experiments, one of which is shown in (E). The mCherry intensity in the ‘+ buffer’ sample were GST-Atg19(365–415) was used as bait was set to 100%. Due to optical reasons very low signals at the beads resulted in values lower than the background and thus negative values. Bars represent standard deviations. (G) Glutathione Sepharose beads were coated with GST-prApe1(1–41) and Atg19 or GST and imaged in the presence of the Atg12~Atg5-Atg16-mCherry complex. Subsequently, recombinant GFP-Atg8 was added to the sample at a final concentration corresponding to 1x or 10x the initial concentration of the Atg12~Atg5-Atg16-mCherry complex. The binding of the complex to the beads in the absence of Atg8 was set to 100%. The histogram shows the averaged values of three independent experiments and the error bars represent standard deviations. N = 3 for the prApe1 samples. See also Figure 3—figure supplement 2.
Figure 3—figure supplement 1
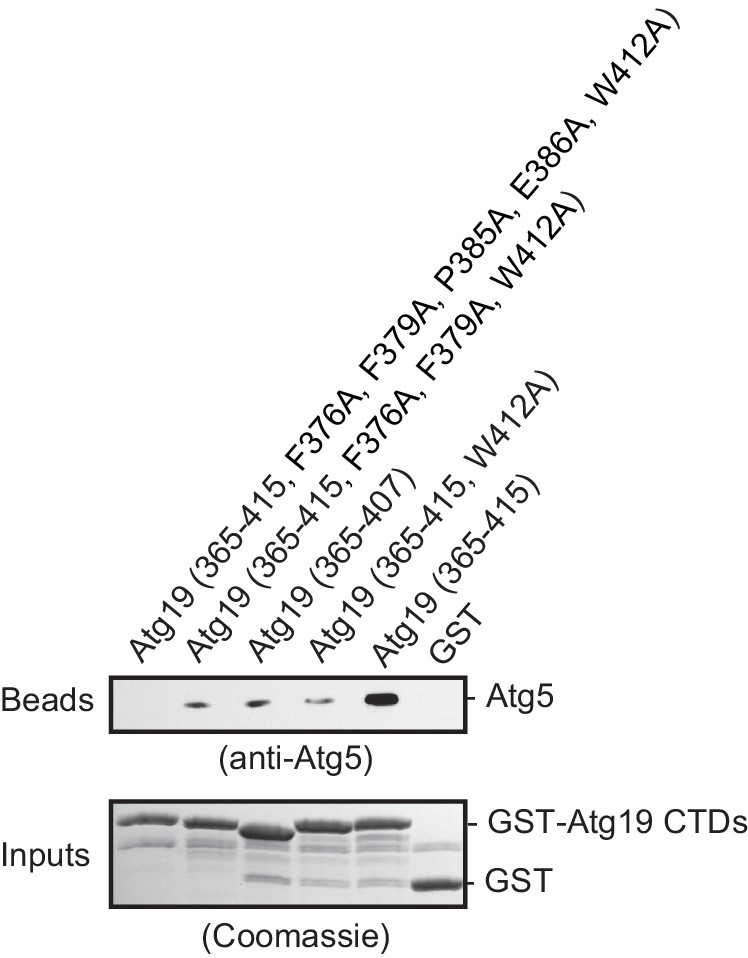
AIM-dependent interaction of the Atg19 C-terminal domain with Atg5.
Western blot of a GST-pull down experiment employing GST fusions of the wild type Atg19 CTD (365-415) or the indicated mutants as baits and Atg5-Atg16 (1–46) as prey. Bead samples were subjected to Western blotting using an anti-Atg5 antibody for detection (bead samples, upper panel) or Coomassie staining (input samples, lower panel), respectively.
Figure 3—figure supplement 2
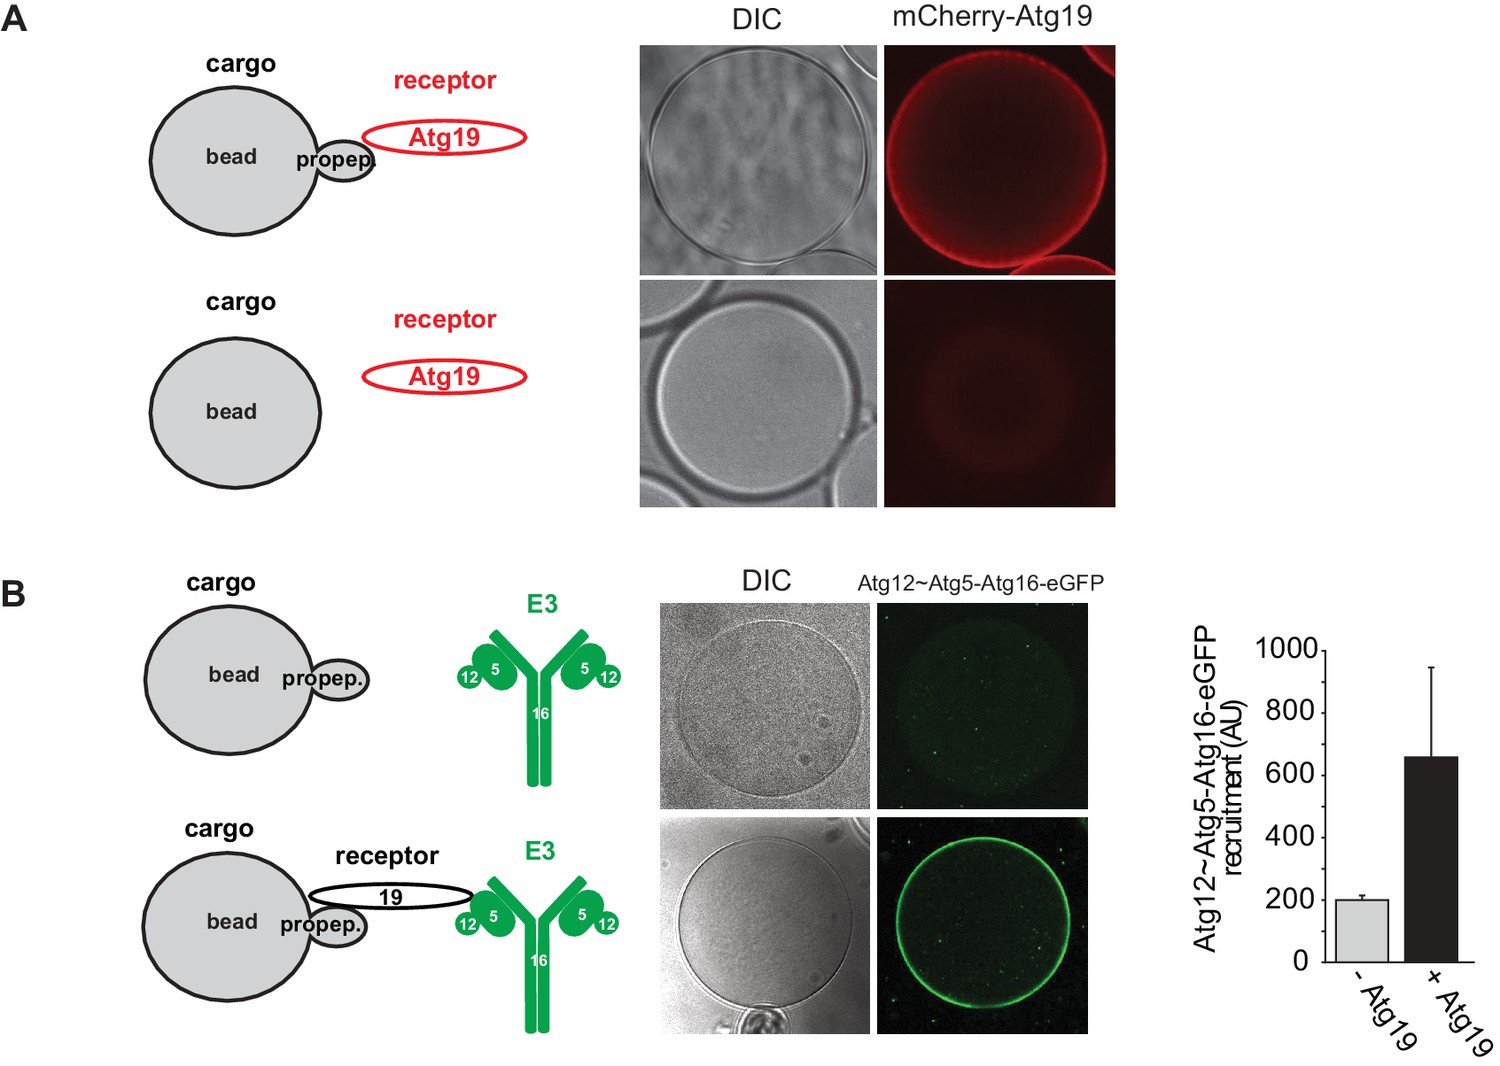
Recruitment of Atg19 and Atg12~Atg5-Atg16 to cargo mimetic beads.
Representative pictures and experimental scheme of mCherry-Atg19 recruitment to cargo mimetic beads coated with GST-prApe1(1–45) in (A) and Atg12~Atg5-Atg16-eGFP to beads in the presence or absence of Atg19 in (B). A quantification of three independent experiments is shown in (B).
Figure 4 with 1 supplement
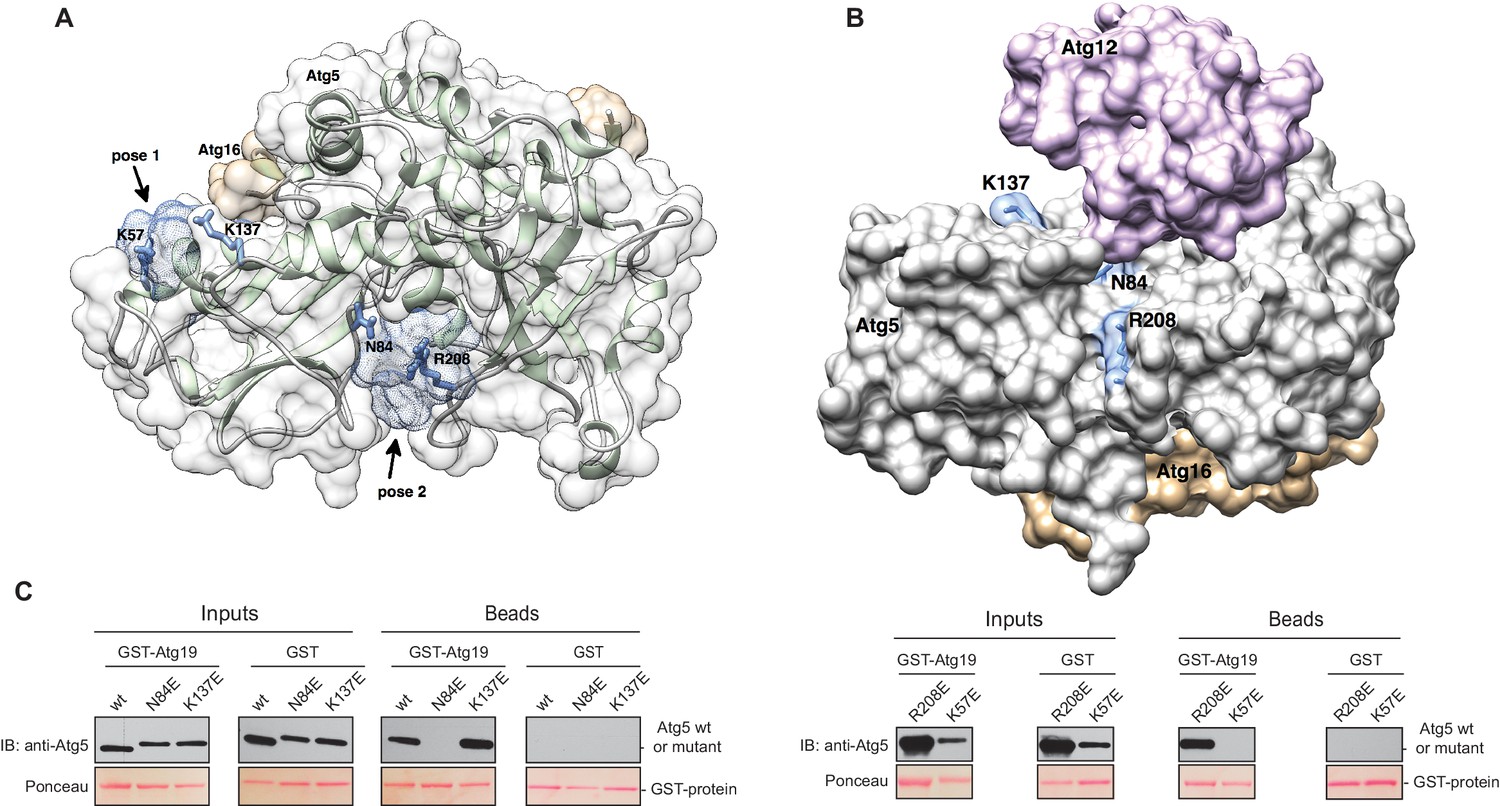
Structure of the Atg5-Atg16 (1–46) complex with the predicted binding sites for the TWEEL peptide.
(A) Structure of Atg5 in complex with the N-terminus of Atg16 (PDB:2DYO, [Matsushita et al., 2007]). The backbone of Atg5 is shown in green and Atg16 is shown in orange. The position of the predicted TWEEL pentapeptide binding sites on Atg5 are shown in blue (pose 1 and 2). The residues predicted to contact the glutamates of the TWEEL peptide are shown as sticks. (B) Surface representation of the Atg12~Atg5-Atg16 (1–46) complex (PDB:3W1S [Noda et al., 2013]). The amino acids in the potential TWEEL binding sites predicted to contact the glutamates of the peptide are shown in blue. Atg5 is shown in grey, Atg12 is shown in violet and Atg16 is shown in orange. (C) Representative blots of GST-pull down experiments conducted with GST-Atg19 or GST in the presence of Atg5-Atg16 (1–46) wild type and its single mutant versions (K57E, N84E, K137E and R208E) are shown. Input and bead samples were subjected to Western blot analysis. GST-fusion bait proteins were detected with Ponceau Staining (lower row) and prey proteins were detected with an anti-Atg5 antibody (upper row).
Figure 4—figure supplement 1
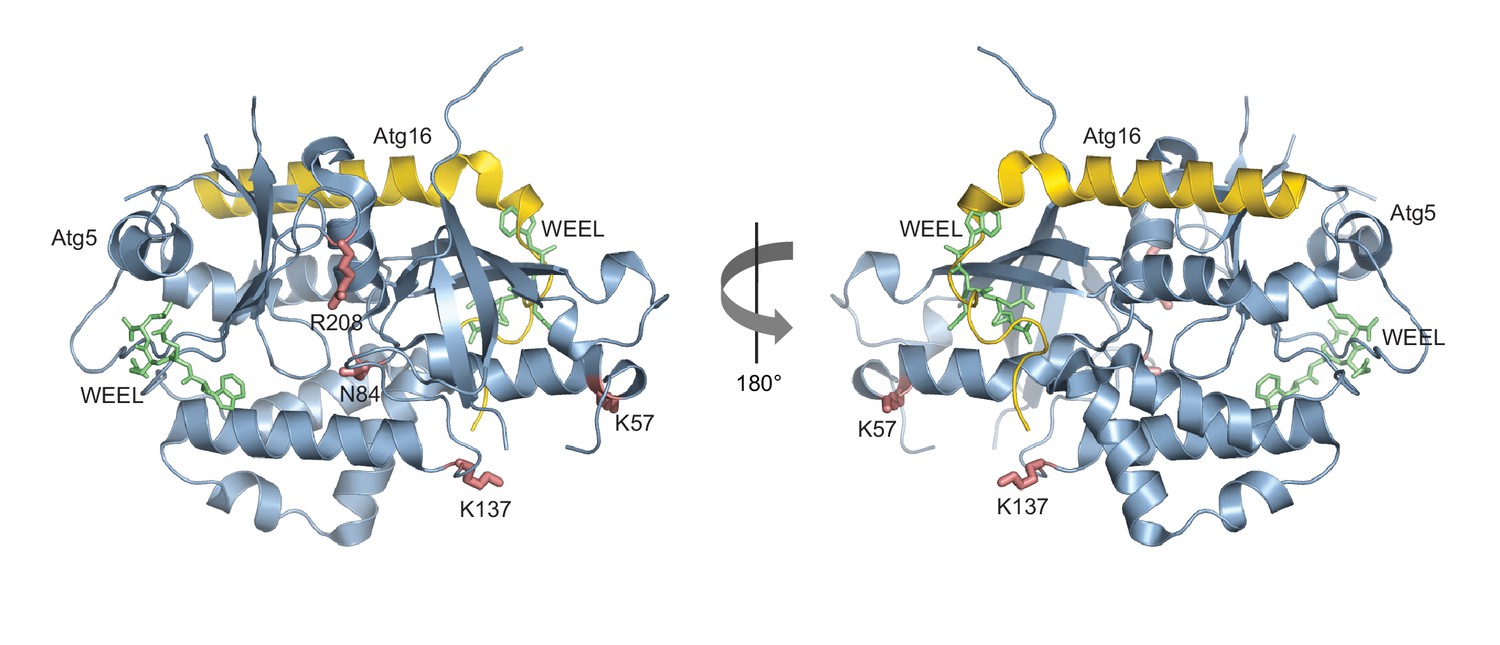
Structural relationship between the Atg5 and Atg8 AIM binding sites.
Shown is the structure of Atg5 (blue) in complex with the N-terminus of Atg16 (yellow) (PDB: 2DYO, [Matsushita et al., 2007]). The canonical AIM motif of Atg19 (412WEEL415) (Noda et al., 2008) is shown in green and is located at the positions it would occupy if the binding mode was analogous to its binding to Atg8. The Atg8 K57 and K137 in pose 1 as well as N84 and R208 in pose 2 are shown in red.
Figure 5 with 4 supplements
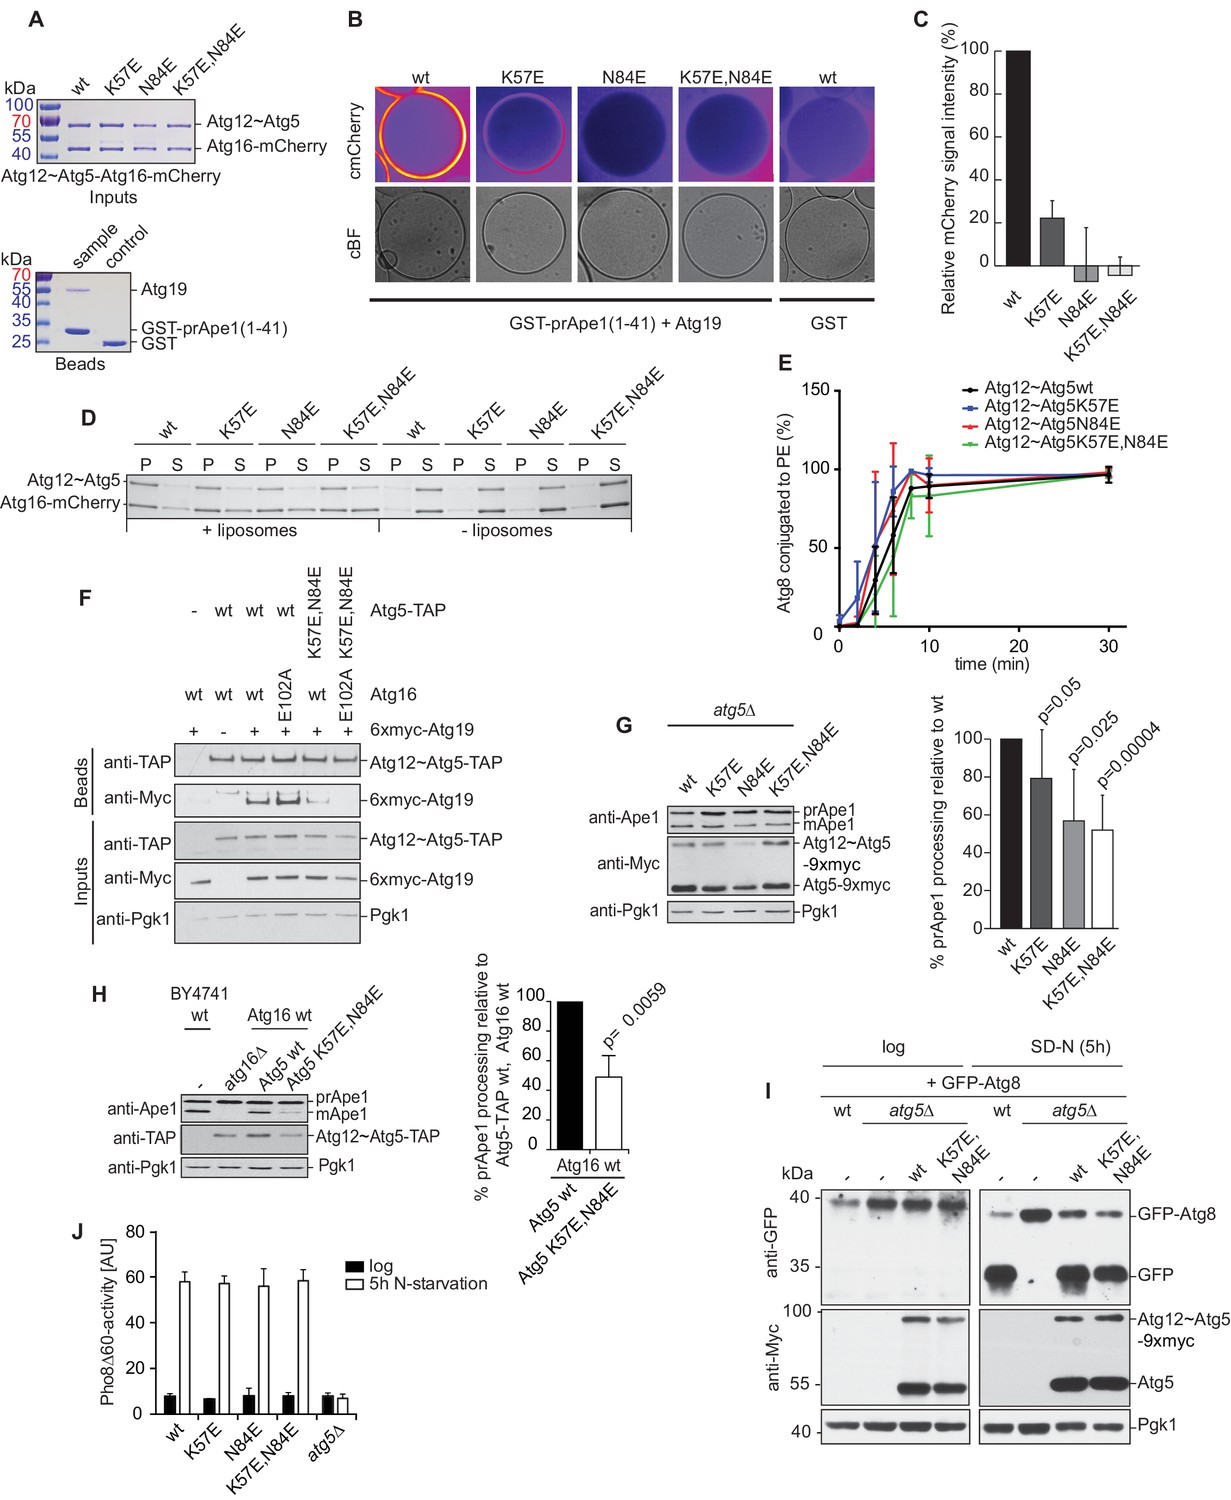
Mutation of the predicted binding sites for Atg19 in Atg5 impairs the recruitment of the Atg12~Atg5-Atg16 complex to cargo mimetic beads and Cvt pathway function but does not affect bulk autophagy.
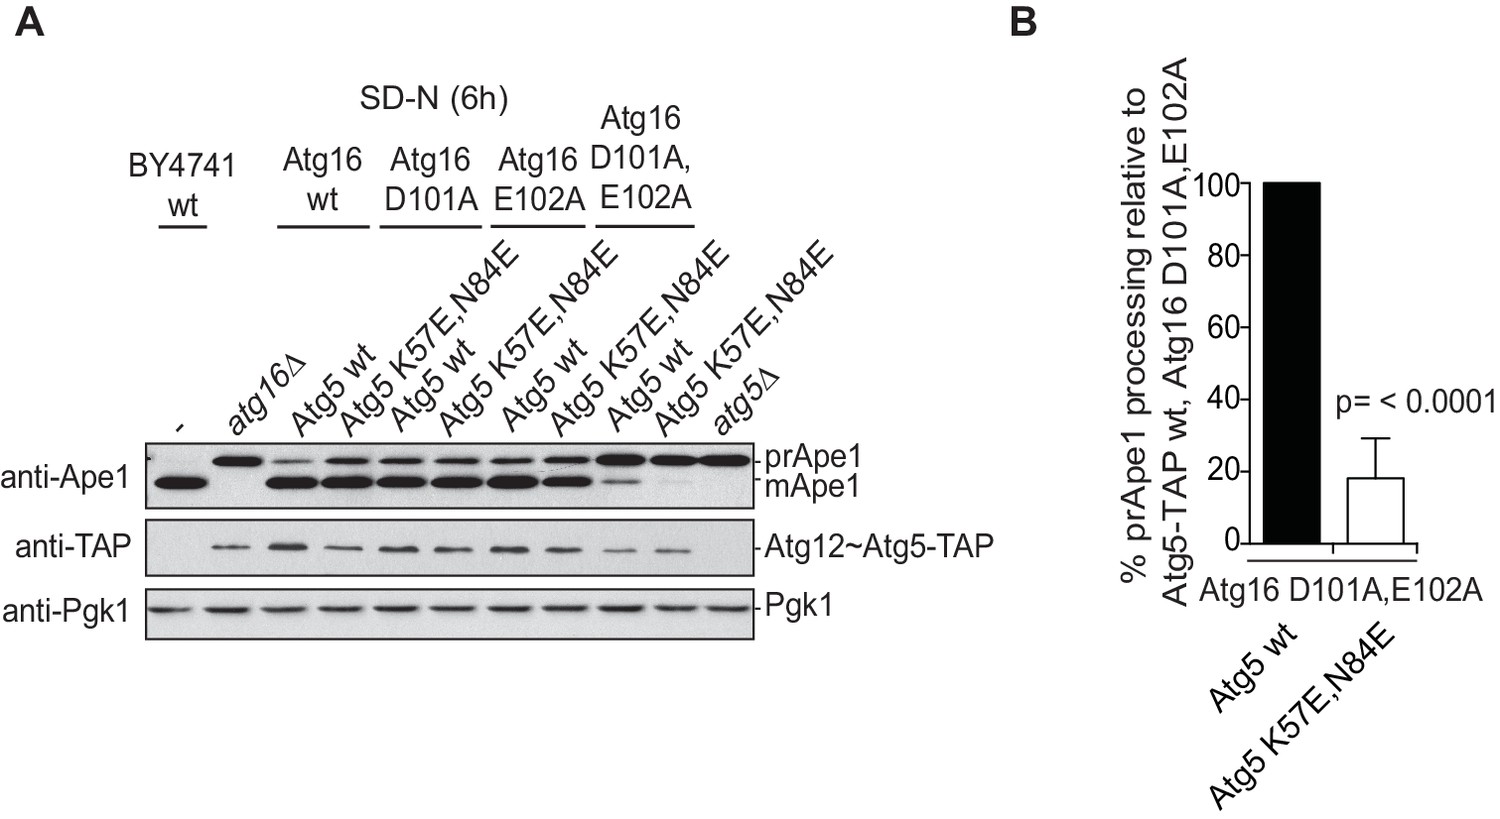
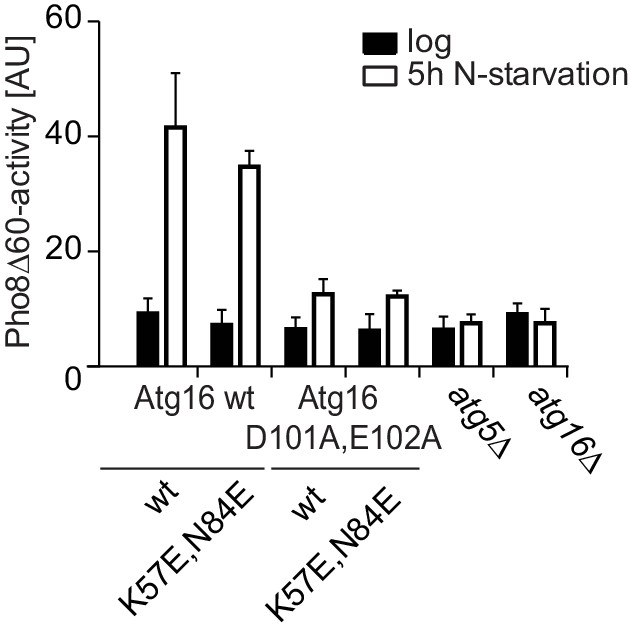
(A) Coomassie stained gels showing the input amounts of the Atg12~Atg5-Atg16-mCherry complex (upper gel) and of the GST-prApe1(1–41) + Atg19 or GST proteins on the beads (lower gel) used for the experiment shown in (B). (B) GST-prApe1(1–41) + Atg19 or GST coated glutathione beads imaged in the presence of Atg12~Atg5-Atg16-mCherry complex (wild type, K57E, N84E or K57E,N84E). (C) Quantification of three independent experiments of the relative mCherry signal intensity measured at the beads. One experiment used for the quantification is shown in (B). The signal measured for the wild type Atg5~Atg12-Atg16-mCherry complex was set to 100%. Due to optical reasons very low signals at the beads resulted in values lower than the background and thus negative values. Error bars represent standard deviations. (D) Coomassie-stained gel showing the result of a liposome co-sedimentation assay using wild type Atg12~Atg5-Atg16-mCherry and the indicated point mutants thereof. Liposome binding allows the protein to be pelleted (P). The unbound protein remains in the supernatant (S). (E) Quantification of in vitro Atg8 conjugation assays using the indicated mutants of Atg12~Atg5. The amount of conjugated Atg8 and un-conjugated Atg8 was measured as the band intensity signal on a Coomassie stained gel and set as 100%. Amounts of conjugated Atg8 were determined relative to this. Averages of these values were calculated from three independent experiments and the final values are plotted together with standard deviations. See also Figure 5—figure supplement 1. (F) Co-immunoprecipitation using Atg5-TAP or Atg5 K57E,N84E-TAP as bait in the presence of 6xmyc-Atg19 and either Atg16 wild type or Atg16 E102A. 6xmyc-Atg19 pulled down protein in wild type Atg5 and Atg16 expressing samples was set to 100. All the other conditions were quantified in relation to this (Atg5 wild type and Atg16 E102A, 85% (±59) p-value = 0.63, n.s.; Atg5 K57E,N84E and Atg16 wild type, 13% (±12.9) p-value < 0.0001; Atg5 K57E,N84E and Atg16 E102A, 2.9% (±4.6) p-value < 0.0001). The p-values were calculated using a two-tailed Student t-test. Proteins were detected using anti-TAP and anti-Myc antibodies, anti-Pgk1 was used as loading control. Shown is a representative blot of three experiments. (G) prApe1 processing assay using an atg5Δ strain transformed with the indicated expression constructs. The lower Ape1 band indicates prApe1 processing and thus its delivery into the vacuole. The prApe1 and Ape1 bands were detected with an anti-Ape1 antibody. The expression levels of Atg5 were visualised with an anti-Myc antibody. The Pgk1 signal served as a loading control. The bar graph to the right shows a quantification of six independent experiments. The p-values were calculated using a two-tailed Student t-test. (H) prApe1 processing assay using yeast atg16Δ strain with Atg5 wild type-TAP or Atg5 K57E,N84E-TAP stably integrated in the genome and transformed with the indicated Atg16 constructs. The blot shows the prApe1 processing in the Atg5 mutants in combination with Atg16 wild type in rich conditions (the full set of tested Atg16 can be found in Figure 5—figure supplement 2). A blot showing the full set of Atg16 mutants after 6 hr nitrogen-starvation is shown in Figure 5—figure supplement 3. The Ape1 bands were detected using an anti-Ape1 antibody. The bar graph shows quantification of the prApe1 processing of four independent experiments. The p-value was calculated using a two-tailed Student t-test. (I) A representative blot of a GFP-Atg8 cleavage assay is shown. (J) Pho8∆60-activity assay under rich (black bars) and 5 hr N-starvation (white bars) growing conditions using a pho13∆, pho8∆60, atg5Δ strain transformed with the indicated Atg5 expression constructs or an empty vector. At least three independent experiments were conducted and the mean values for each conditions were plotted. The error bars represent the standard deviation.
Figure 5—figure supplement 1
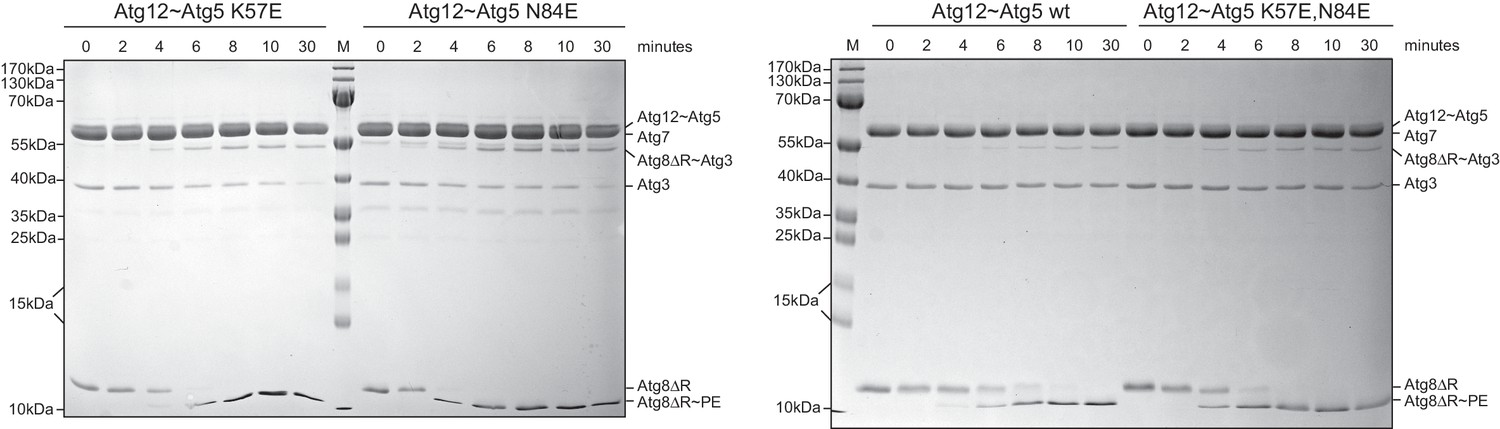
The K57E and N84E mutations do not impair the ability of the Atg12~Atg5 conjugate to promote Atg8 conjugation.
In vitro Atg8 lipidation reaction using SUVs and wild type as well the indicated Atg12~Atg5 mutants. Shown are Coomassie stained gels of a time series of Atg8 conjugation reactions in the presence of Atg12~Atg5 K57E or N84E (left panel) and wild type or K57E,N84E mutant (right panel). The Atg12~Atg5 band is not visible on the gel at the concentrations used in this experiment. The Atg8~PE is detected as a faster migrating band in a urea containing gel.
Figure 5—figure supplement 2
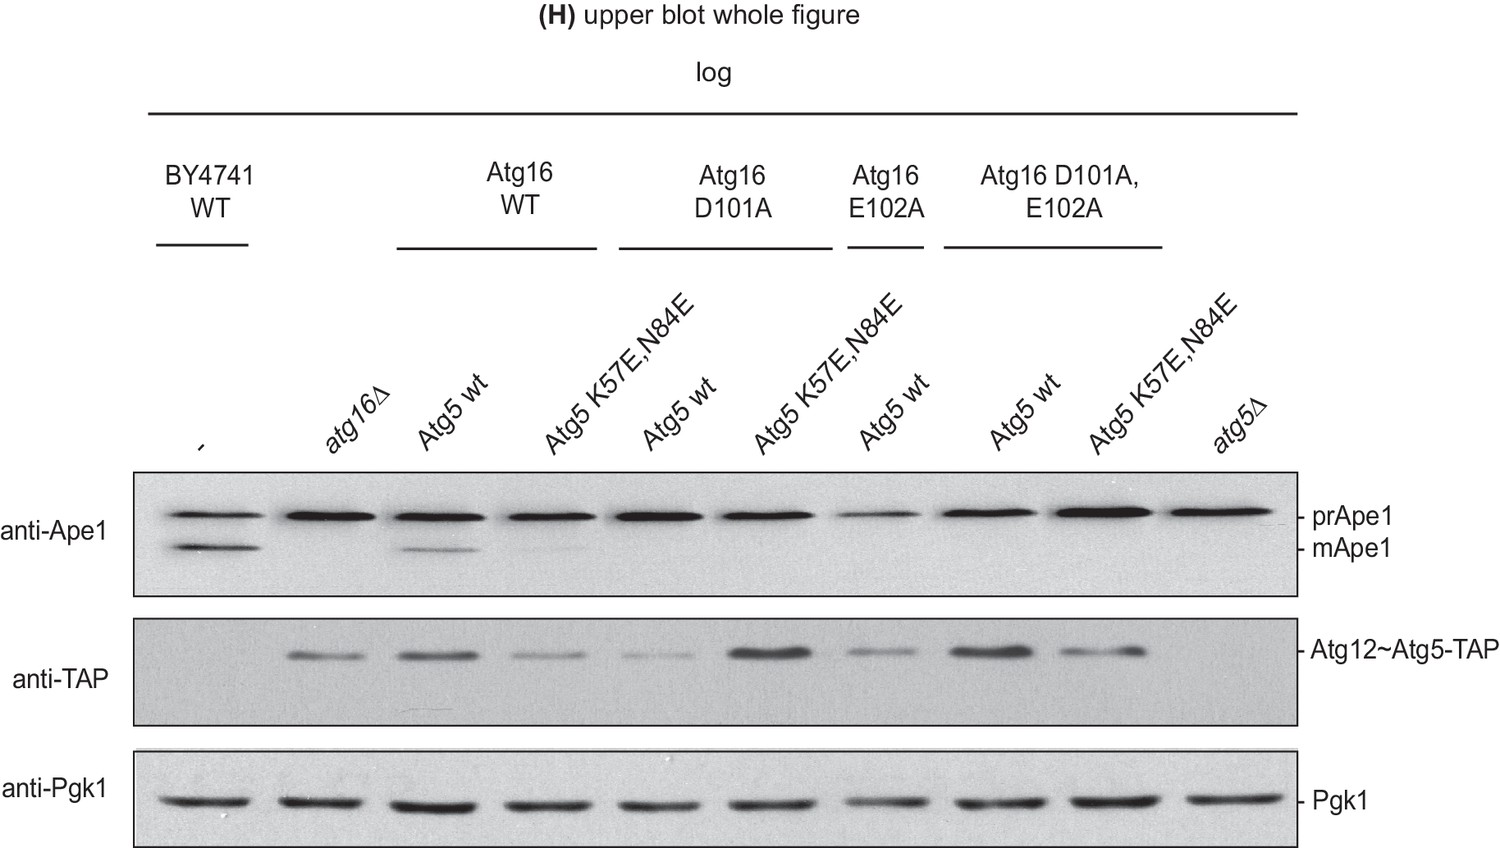
Effect of the disruption of the Atg16 – Atg21 interaction on prApe1 processing.
prApe1 processing assay in atg16Δ yeast strain expressing transiently transformed Atg16 D101A or E102A or D101A,E102A-double mutant proteins and Atg5-TAP or Atg5 K57E,N84E-TAP stably integrated in the genome (complete blot from Figure 5H upper blot). The Atg5 K57E,N84E-TAP in combination with Atg16 wild type shows reduced prApe1 processing. This mutant, in combination with Atg16 D101A,E102A and D101A,E102A-double mutation, shows fully arrested prApe1 processing. Atg5 expression levels were checked using anti-TAP-antibody; Pgk1 served as a loading control.
Figure 5—figure supplement 3
The Cvt pathway is affected upon disrupting Atg19 – Atg5 interaction.
(A) prApe1 processing assay using yeast atg16Δ strain with Atg5-TAP or Atg5 K57E,N84E-TAP stably integrated in the genome and transformed with the indicated Atg16 constructs. The blot shows the full set of Atg16 mutants after 6 hr nitrogen-starvation. The Ape1 bands were detected using anti-Ape1 antibody. The bar graph in (B) shows quantification of the prApe1 processing of four independent experiments. The p-value was calculated using a two-tailed Student t-test.
Figure 5—figure supplement 4
Mutation of the predicted binding sites for Atg19 in Atg5 does not affect bulk autophagy.
Pho8∆60-activity assay under rich (black bars) and 5 hr N-starvation (white bars) growing conditions using a pho13∆, pho8∆60, atg16∆, Atg5-TAP or Atg5 K57E,N84E-TAP strain transformed with the indicated Atg16 expression constructs or an empty vector. Three independent experiments were conducted and the mean values for each conditions were plotted. The error bars represent the standard deviation. No significant difference was observed between the wild type Atg5 and the Atg5 K57E,N84E mutant.
Figure 6 with 3 supplements
In vitro reconstitution of cargo-directed Atg8 lipidation.
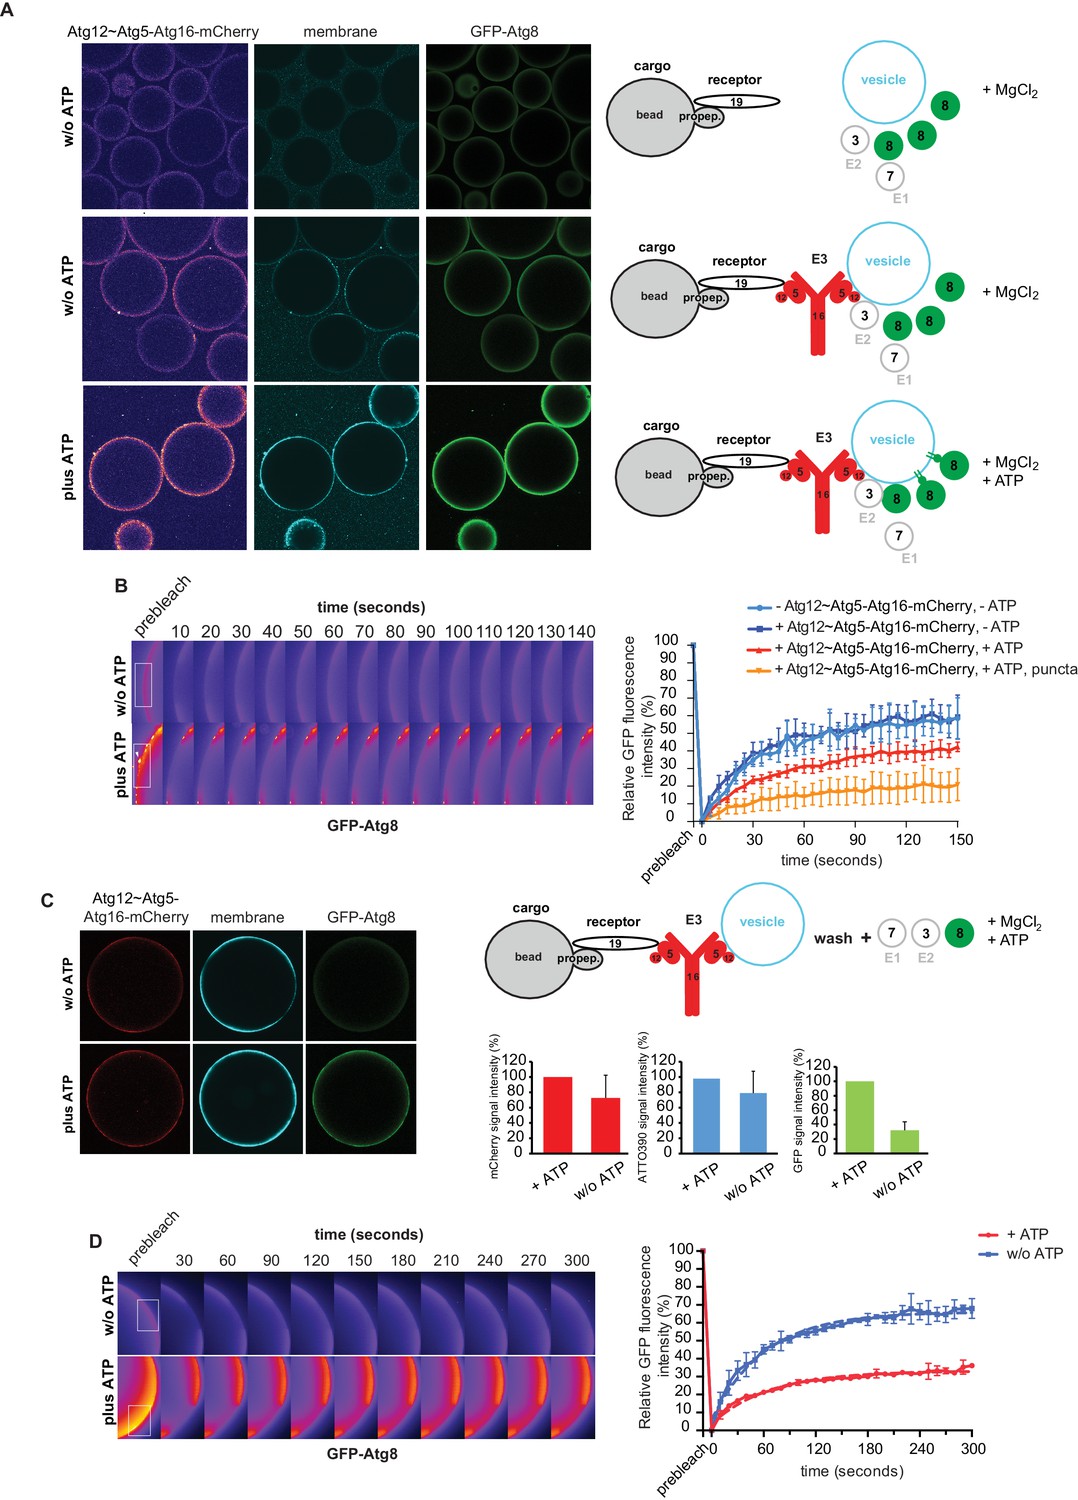
(A) GST-prApe1(1–45) + Atg19 ± Atg12~Atg5-Atg16-mCherry coated Sepharose beads were imaged in the presence of ATTO390-containing SUVs and GFP-Atg8∆R117, Atg7, Atg3, MgCl2 with or without ATP. Representative pictures and the experimental scheme are shown. The images corresponding to the mCherry channel are displayed in false color (ImageJ: Fire). See also Figure 6—figure supplement 1 and Figure 6—figure supplement 2. (B) Representative pictures of a GFP-Atg8 FRAP experiment conducted on the surface of GST-prApe1(1–45) + Atg19 + Atg12~Atg5-Atg16-mCherry coated Sepharose beads after the conjugation reaction performed in the presence (lower row) or absence (upper row) of ATP. The graph shows the quantification of the GFP signal measured on the surface of at least two beads per condition (Cx: Atg12~Atg5-Atg16-mCherry). (C) Representative pictures, experimental scheme and quantification of Atg8 lipidation on cargo mimetic beads coated with GST-prApe1(1–45) + Atg19 + Atg12~Atg5-Atg16-mCherry + ATTO390-containing SUVs in the presence of the conjugation machinery (Atg7, Atg3, GFP-Atg8∆R117, MgCl2, ±ATP) after removal of SUVs from the solution by washing. (D) Representative pictures of a GFP-Atg8 FRAP experiment conducted on the surface of GST-prApe1(1–45) + Atg19 + Atg12~Atg5-Atg16-mCherry + ATTO390-containing SUVs-coated Sepharose beads, after conjugation reaction performed in the presence (lower row) or absence (upper row) of ATP. The graph shows the quantification of the recovered GFP signal on the beads in the presence or absence of ATP, respectively, for at least two beads per condition. See also Figure 6—figure supplement 3.
Figure 6—figure supplement 1

Atg19 AIM-dependent recruitment of the Atg12~Atg5-Atg16 complex and vesicles to cargo mimetic beads.
Representative pictures and experimental scheme of Rhodamine-SUV recruitment to cargo mimetic beads coated with GST-prApe1(1–45) and Atg19 (wild type or AIM mutant (F376A, F379A, P385A, E386A, W412A)) with or without the Atg12~Atg5-Atg16-meGFP complex.
Figure 6—figure supplement 2
Vesicle recruitment by Atg12~Atg5-Atg16 mutants to cargo mimetic beads.
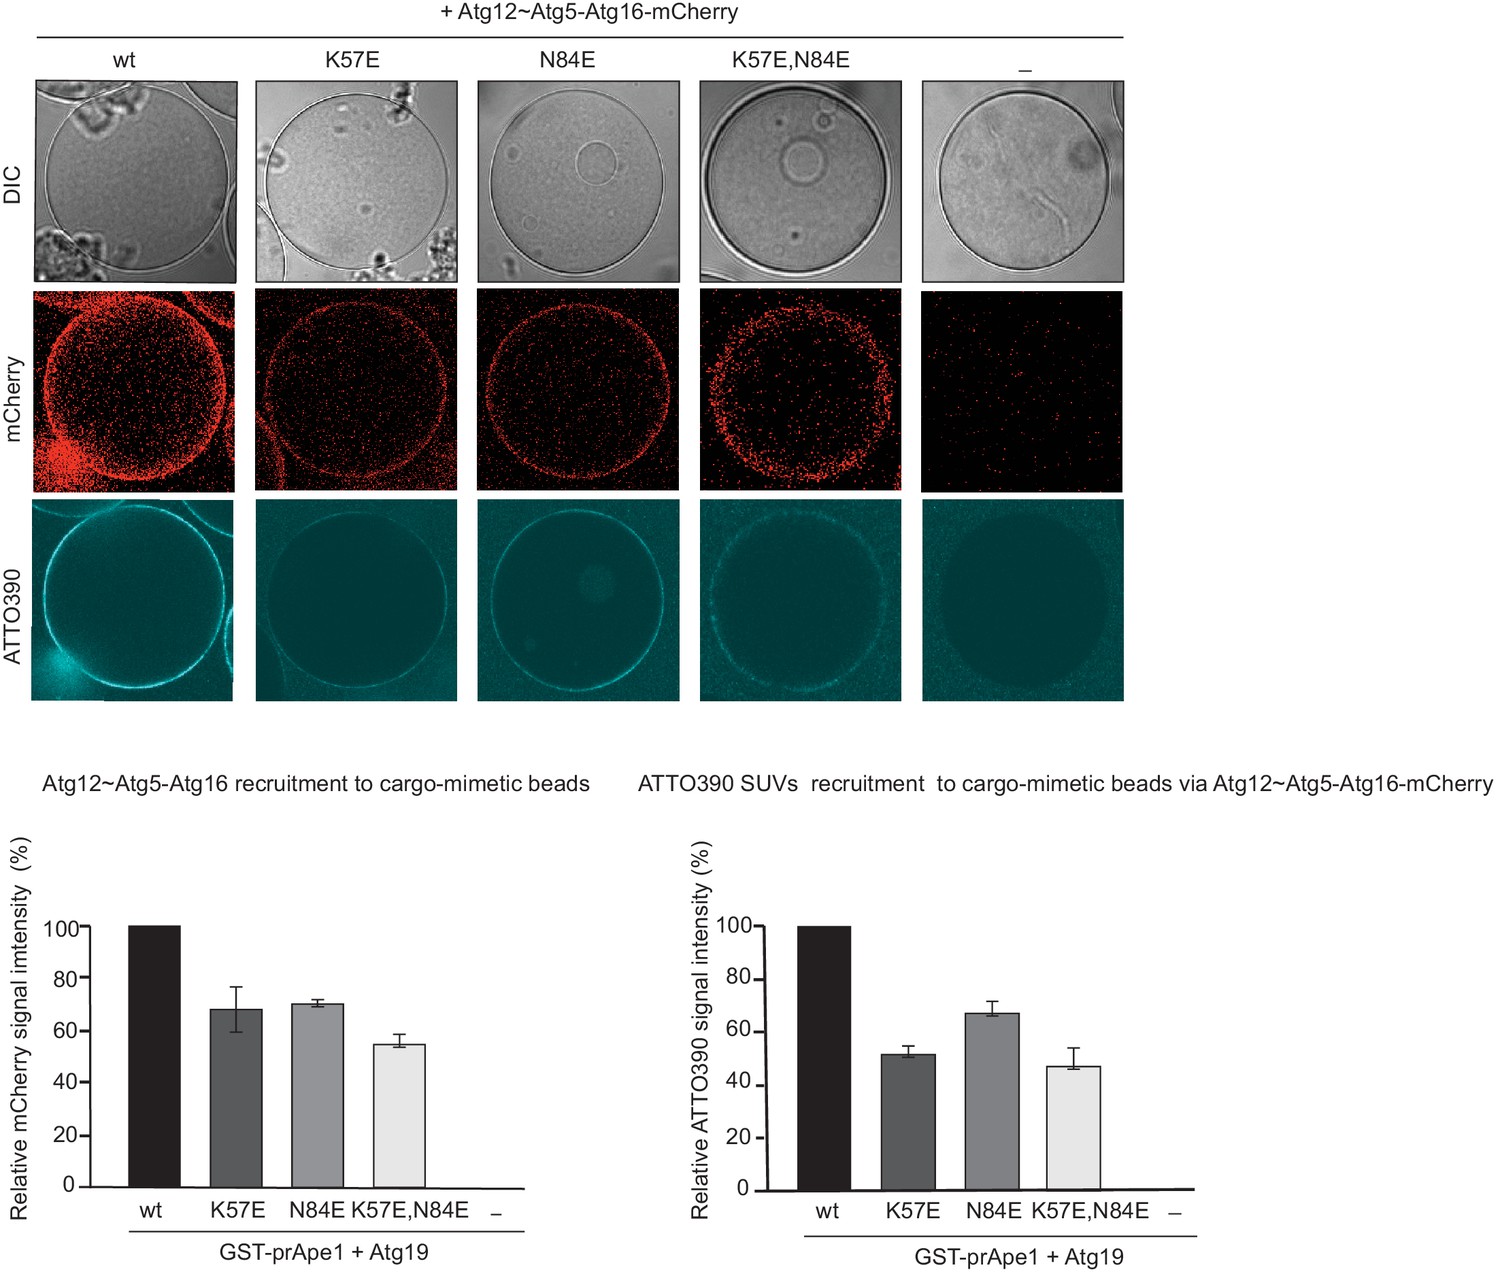
Representative pictures and quantification of Atg12~Atg5-Atg16-mCherry and ATTO390-SUVs recruitment to cargo mimetic beads coated with GST-prApe1(1–45) and Atg19. The quantification is based on three independent experiments and the bars indicate the standard deviation. Signal corresponding to wild type Atg12~Atg5-Atg16 was set to 100%.
Figure 6—figure supplement 3
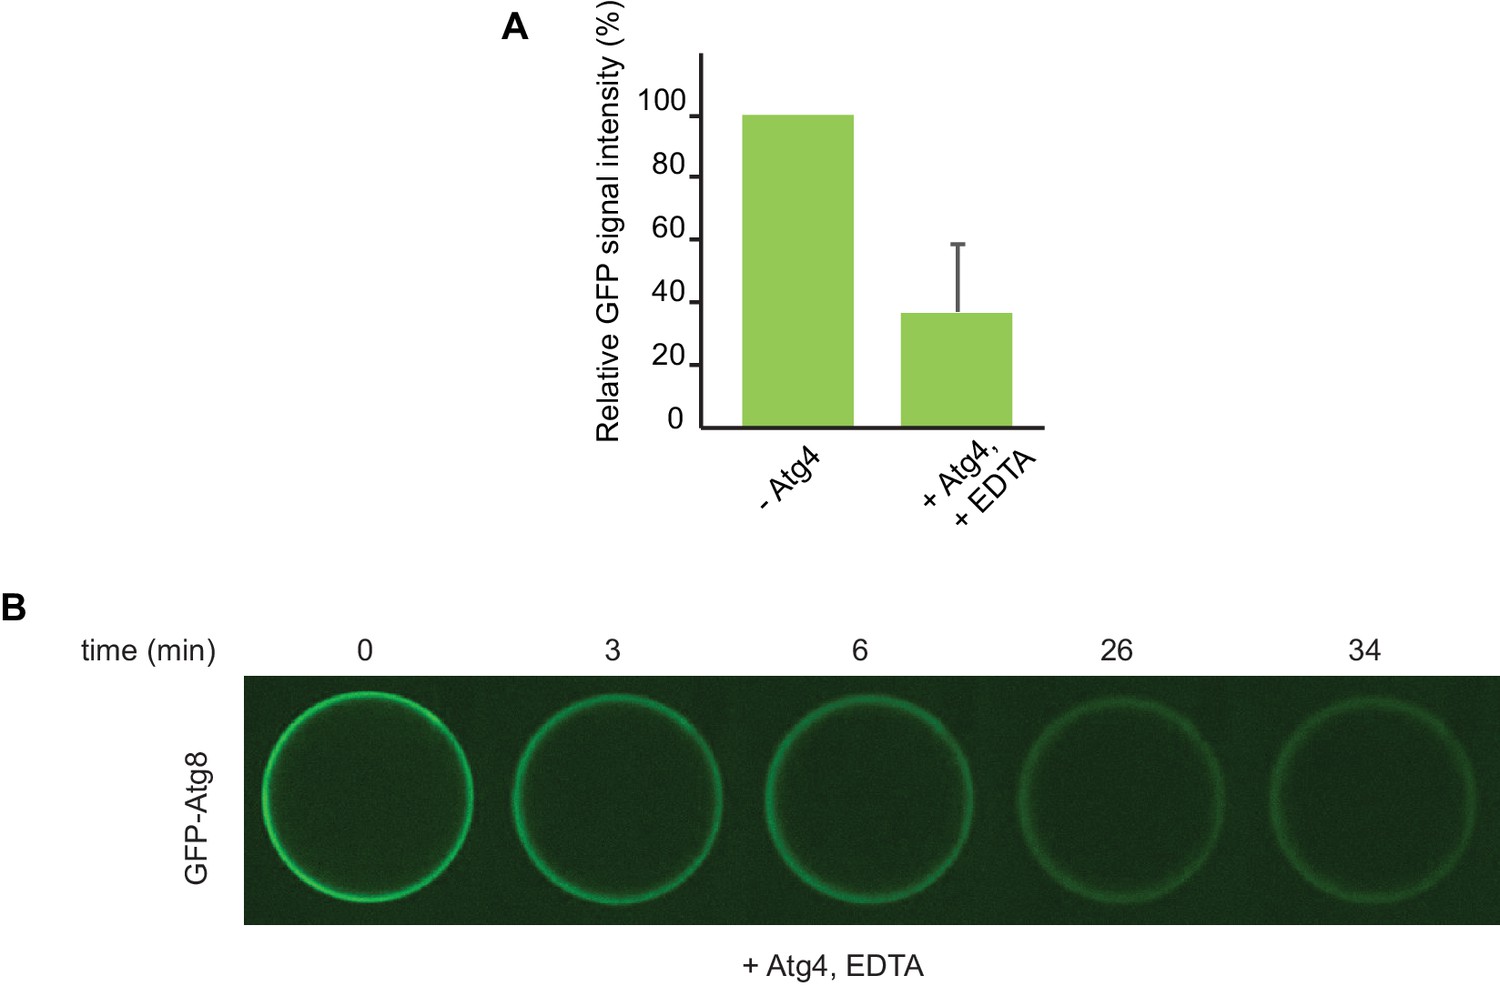
De-conjugation of lipidated Atg8 on the beads.
(A) Quantification of three independent experiments performed using cargo mimetic beads prepared as in Figure 6A. Atg4 was added to cargo mimetic beads after an overnight conjugation reaction. The GFP-Atg8∆R117 signal at the beads was measured after 30 min of de-conjugation reaction. (B) Representative images of the Atg4 de-conjugation of Atg8 at the beads at the indicated time points.
Figure 7
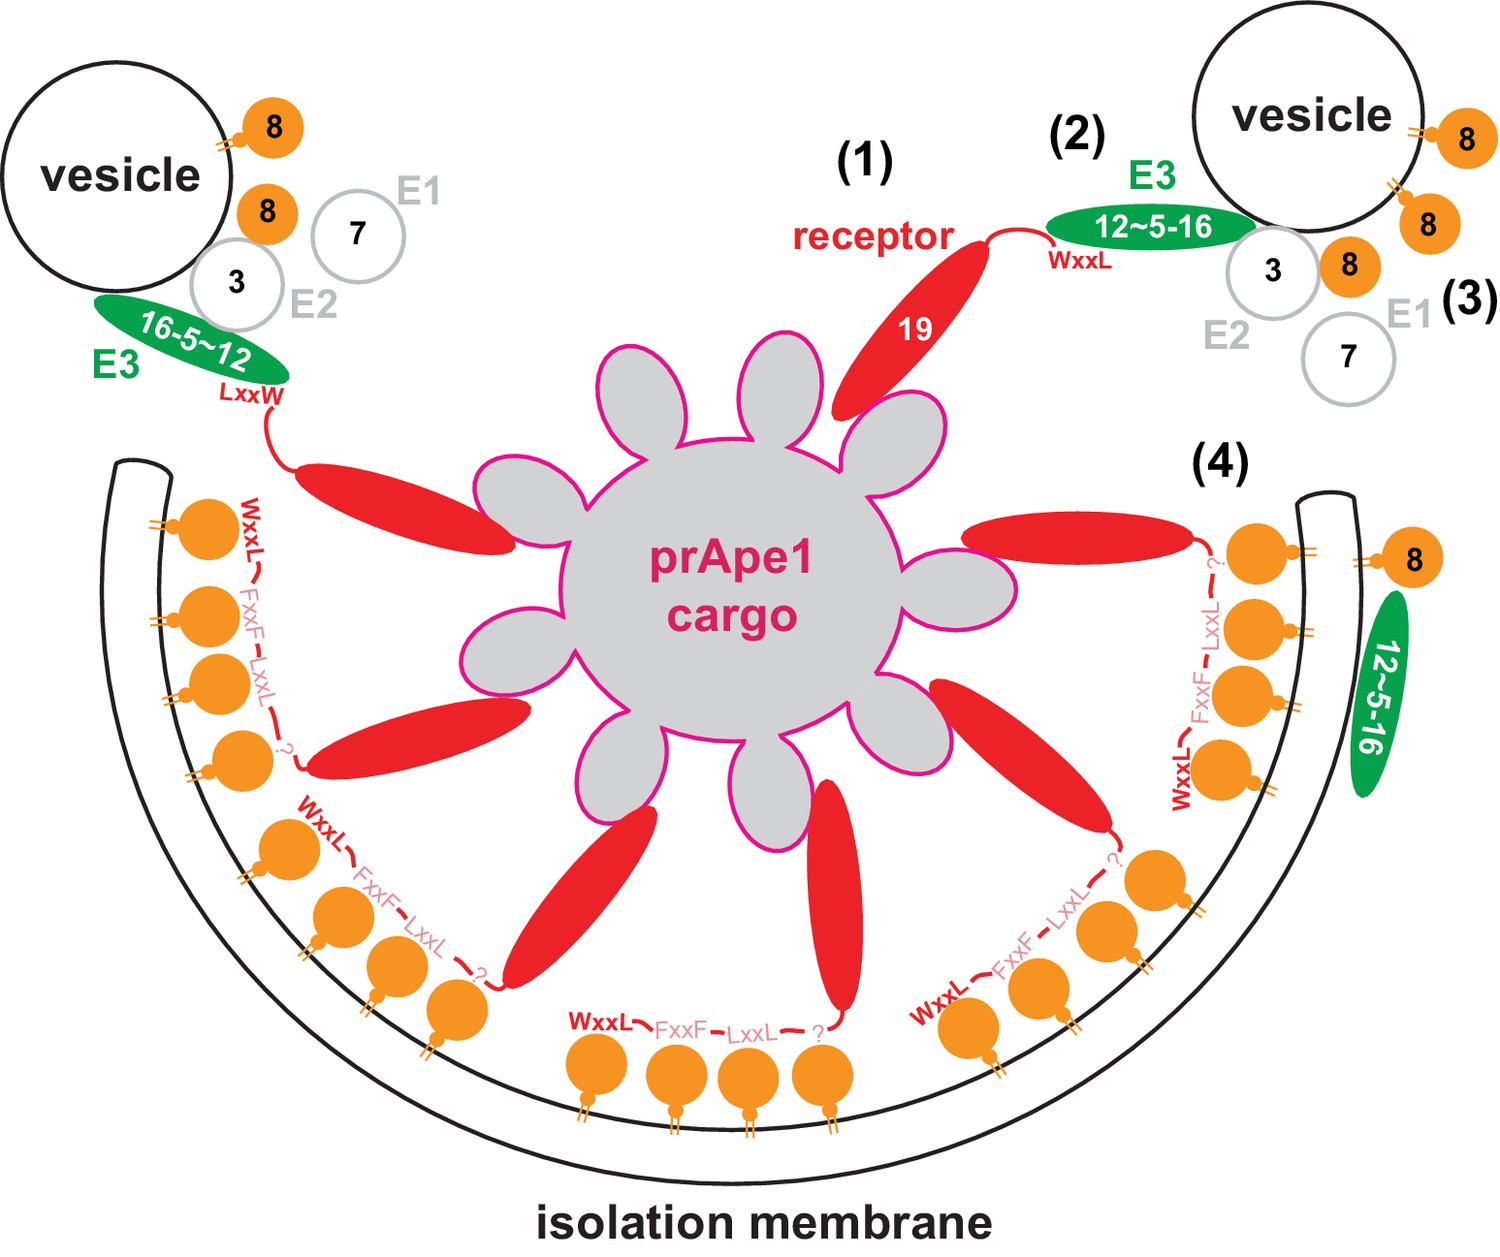
Model for the molecular mechanism of cargo-directed Atg8 lipidation.
The Atg19 cargo receptor binds the cargo (1) and recruits the E3-like Atg12~Atg5-Atg16 complex to the cargo via its AIM motifs (2). In the presence of a membrane source, Atg8 is locally conjugated (3) and may eventually outcompete the Atg12~Atg5-Atg16 complex from Atg19 binding. At the same time the AIM motifs of Atg19 may keep the Atg8-coated isolation membrane close to the cargo excluding non-cargo material from incorporation into selective autophagosomes (4). See main text for extended discussion.
Tables
Table 1
Table of constructs.
Identification number | Vector | Expression system | Expressing | Published |
|---|---|---|---|---|
SMC3 | pGEX-4T-3 | E. coli Rosetta pLysS | GST-Atg3 | |
SMC7 | pGEX-4T-3 | E. coli Rosetta pLysS | GST-Atg5 | this study |
SMC17 | pOPTH | E. coli Rosetta pLysS | 6xHis-Atg7 | |
SMC34 | pOPTG | E. coli Rosetta pLysS | GST-Atg16 | |
SMC58 | pET-Duet-1 | E. coli Rosetta pLysS | 6xHis-Atg8∆R117 | this study |
SMC126 | pET Duet-1 | E. coli Rosetta pLysS | 6xHis-Atg5, Atg12 | |
SMC131 | pCOLA Duet-1 | E. coli Rosetta pLysS | Atg7, Atg10 | |
SMC156 | pET Duet-1 | E. coli Rosetta pLysS | 6xHis-mCherry-Atg19 | |
SMC159 | pGEX-4T-1 | E. coli Rosetta pLysS | GST-Atg19 | |
SMC178 | pET Duet-1 | E. coli Rosetta pLysS | 6xHis-Atg16-meGFP | |
SMC179 | pET Duet-1 | E. coli Rosetta pLysS | 6xHis-meGFP-Atg8∆R117 | |
SMC180 | pCOLA-Duet | E. coli Rosetta pLysS | 6xHis-Atg16 (1–46) | |
SMC185 | pGEX-4T-1 | E. coli Rosetta pLysS | GST-Atg34 | |
SMC188 | pGEX-4T-1 | E. coli Rosetta pLysS | GST-Atg19W412A | |
SMC293 | pGEX-4T-1 | E. coli Rosetta pLysS | GST-Atg19(124–415) | |
SMC294 | pGEX-4T-1 | E. coli Rosetta pLysS | GST-Atg19(254–415) | |
SMC295 | pGEX-4T-1 | E. coli Rosetta pLysS | GST-Atg19(365–415) | |
SMC300 | pGEX-4T-1 | E. coli Rosetta pLysS | GST-prApe1(1–45) | |
SMC301 | pGEX-4T-1 | E. coli Rosetta pLysS | GST-Atg19(1–407) | |
SMC309 | pGEX-4T-1 | E. coli Rosetta pLysS | GST-Atg19(365–407) | this study |
SMC564 | pGEX-4T-3 | E. coli Rosetta pLysS | GST-Atg4 | |
SMC595 | pGEX-4T-1 | E. coli Rosetta pLysS | GST-prApe1(1–41) | this study |
SMC665 | pET Duet-1 | E. coli Rosetta pLysS | 6xHis-Atg5(K57E), Atg12 | this study |
SMC668 | pET Duet-1 | E. coli Rosetta pLysS | 6xHis-Atg5(N84E), Atg12 | this study |
SMC743 | pET Duet-1 | E. coli Rosetta pLysS | 6xHis-Atg5(K57E,N84E), Atg12 | this study |
SMC772 | pGEX-4T-2 | E. coli Rosetta pLysS | GST-Atg19(408–415) | this study |
SMC782 | pET Duet-1 | E. coli Rosetta pLysS | 6xHis-Atg5-mCherry | this study |
SMC808 | pGEX-4T-1 | E. coli Rosetta pLysS | GST-Atg19(365–407) F376A, F379A, L384A, L387A | this study |
SMC819 | pET Duet-1 | E. coli Rosetta pLysS | 6xHis-Atg16-mCherry | |
SMC255 | pEGFP-C1 | HeLa cell line | EGFP-ATG5 | this study |
SMC398 | pmCherry-C1 | Hela cell line | pmCherry-OPTN | this study |
SMC516 | pmCherry-C1 | HeLa cell line | mCherry-p62 | |
SMC539 | pmCherry-C1 | Hela cell line | pmCherry-NDP52 | this study |
pRS313 | S. cerevisiae | |||
pRS315, | S. cerevisiae | |||
pRS316 | S. cerevisiae | |||
pRS415 | S. cerevisiae | |||
pAB15 | S. cerevisiae | 9xmycHKMT-ATG19_cyc1term, pRS415, ATG19 Promoter | this study | |
pCK48 (SMC199) | pRS315 | S. cerevisiae | GFP-Atg8 | |
pLW38.1 | S. cerevisiae | ATG13-HKMT, YCp111, ATG13 promoter | ||
pLW52 | S. cerevisiae | ATG2-9xmyc-HKMT, pRS415, ATG2 promoter | ||
pTP9 (SMC852) | pRS313 | S. cerevisiae | endogenous promoter-6xmyc-Atg19 | this study |
SMC236 | pRS315 | S. cerevisiae | endogenous promotor-Atg16 wild type - terminator | this study |
SMC270 | pRS316 | S. cerevisiae | endogenous promoter-Atg5wild type-9xmyc | |
SMC343 | pRS316 | S. cerevisiae | 6xmyc-Atg19 wild type | |
SMC381 | pRS316 | S. cerevisiae | 6xmyc-Atg19W412A | |
SMC418 | pRS316 | S. cerevisiae | 6xmyc-Atg19 F376A, F379A,W412A | |
SMC422 | pRS316 | S. cerevisiae | 6xmyc-Atg19 F376A, F379A,P385A,E386A, W412A | |
SMC524 | pRS315 | S. cerevisiae | 6xmyc-Atg19 wild type | this study |
SMC678 | pRS315 | S. cerevisiae | 6xmyc-Atg19W412A | this study |
SMC690 | pRS316 | S. cerevisiae | endogenous promoter-Atg5K57E-9xmyc | this study |
SMC691 | pRS316 | S. cerevisiae | endogenous promoter-Atg5N84E-9xmyc | this study |
SMC692 | pRS316 | S. cerevisiae | endogenous promoter-Atg5K57E,N84E-9xmyc | this study |
SMC836 | pRS315 | S. cerevisiae | endogenous promotor-Atg16(D101A)-terminator | this study |
SMC837 | pRS315 | S. cerevisiae | endogenous promotor-Atg16(E102A)-terminator | this study |
SMC838 | pRS315 | S. cerevisiae | endogenous promotor-Atg16(D101A,E102A)-terminator | this study |
Table 2
Yeast manipulation and strain list.
Name | Genotype | Background | Source |
|---|---|---|---|
BY4741/SMy1 | Mat a; his3△1, leu2△0,met15△0, ura3△0 | BY474x | Euroscarf |
BY4743 | Diploid; his3△1/his3△1, leu2△0/leu2△0, met15△0/met15△0, ura3△0/ura3△0 | BY474x | Euroscarf |
SMy2 | Mat a; atg5::KanMX | BY474x | Euroscarf |
SMy33 | ∆pho8::pho8∆60His,∆pho13::kan | BY474x | |
SMy62 | ∆Atg5::nat; pho8∆60::His; ∆pho13::KanMX | BY474x | |
SMy147 | Mat a; atg19::KanMX | BY474x | Euroscarf |
SMy196 | Mat a; ATG5-TAP:URA3, atg19::KanMX, atg8::NatMX | BY474x | this study |
SMy201 | Mat a; ATG16-TEV-2xProtA-4xH3-5xHA:URA3; atg19::KanMX | BY474x | this study |
SMy239 | Mat a; ape1::KanMX | BY474x | Euroscarf |
SMy306 | atg16::kan; ATG5-K57E,N84E-TAP-cyc1term-URA-tTEF | BY474x | this study |
SMy308 | atg16::kan; ATG5-TAP-cyc1term-URA-tTEF | BY474x | this study |
SMy342 | Mat a; ATG5-TAP:URA3, atg19::KanMX, atg16::KanMX | BY474x | this study |
SMy344 | Mat a; ATG5-K57E,N84E-TAP:URA3, atg19::KanMX, atg16::KanMX | BY474x | this study |
SMy346 | atg19::KanMX, atg16::KanMX | BY474x | this study |
SMy356 | atg16::kan; pho13::kan; pho8∆60::His; ATG5-TAP-cyc1term-URA-tTEF | BY474x | this study |
SMy358 | atg16::kan; pho13::kan; pho8∆60::His; ATG5-K57E,N84E-TAP-cyc1term-URA-tTEF | BY474x | this study |
yAB7 | atg13::KanMX, ATG17-TEV-2xProtA-4xH3-5xHA:URA | BY474x |
Download links
A two-part list of links to download the article, or parts of the article, in various formats.
Downloads (link to download the article as PDF)
Open citations (links to open the citations from this article in various online reference manager services)
Cite this article (links to download the citations from this article in formats compatible with various reference manager tools)
Mechanism of cargo-directed Atg8 conjugation during selective autophagy
eLife 5:e18544.
https://doi.org/10.7554/eLife.18544


