Cellular and neurochemical basis of sleep stages in the thalamocortical network
- University of California, San Diego, United States
- Université Laval, Canada
- Massachusetts General Hospital and Harvard Medical School, United States
Figures
Figure. 1
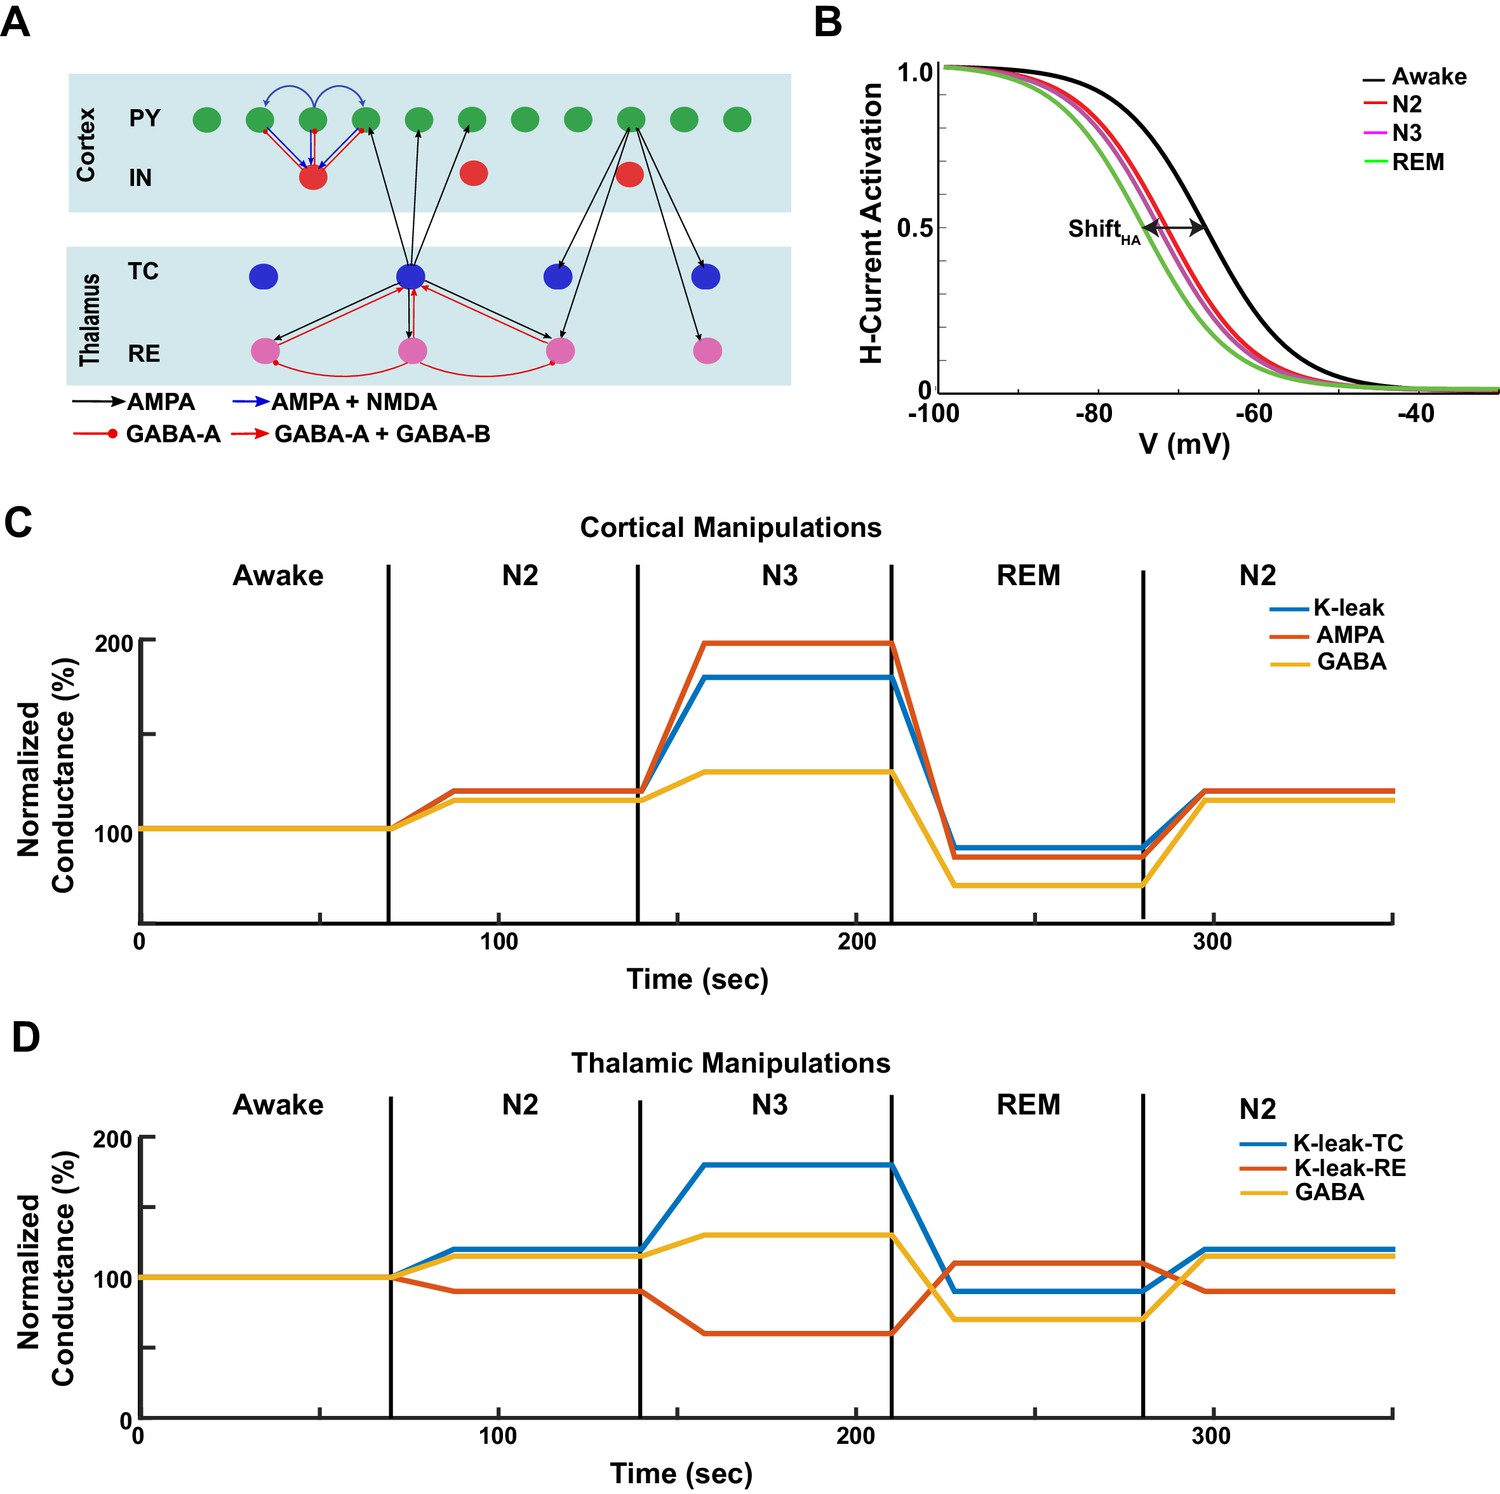
Model design.
(A) Network structure of the model. PY - cortical principal neurons, IN - cortical inhibitory interneurons, TC - thalamocortical (relay) neurons, RE - thalamic reticular neurons. There were 500 PY, 100 IN, 100 RE and 100 TC cells in the network. (B) The activation function for the h-current under different HA levels, corresponding to the different awake and sleep states as indicated in the legend. = 0 for the REM state. (C) A sequence of changes to the maximal conductances for AMPA, GABA and leak currents in the cortex to model sleep stage transitions. (D) A sequence of changes in leak currents in thalamic cells, and the maximal conductance for GABA synaptic currents within the thalamus.
Figure 2
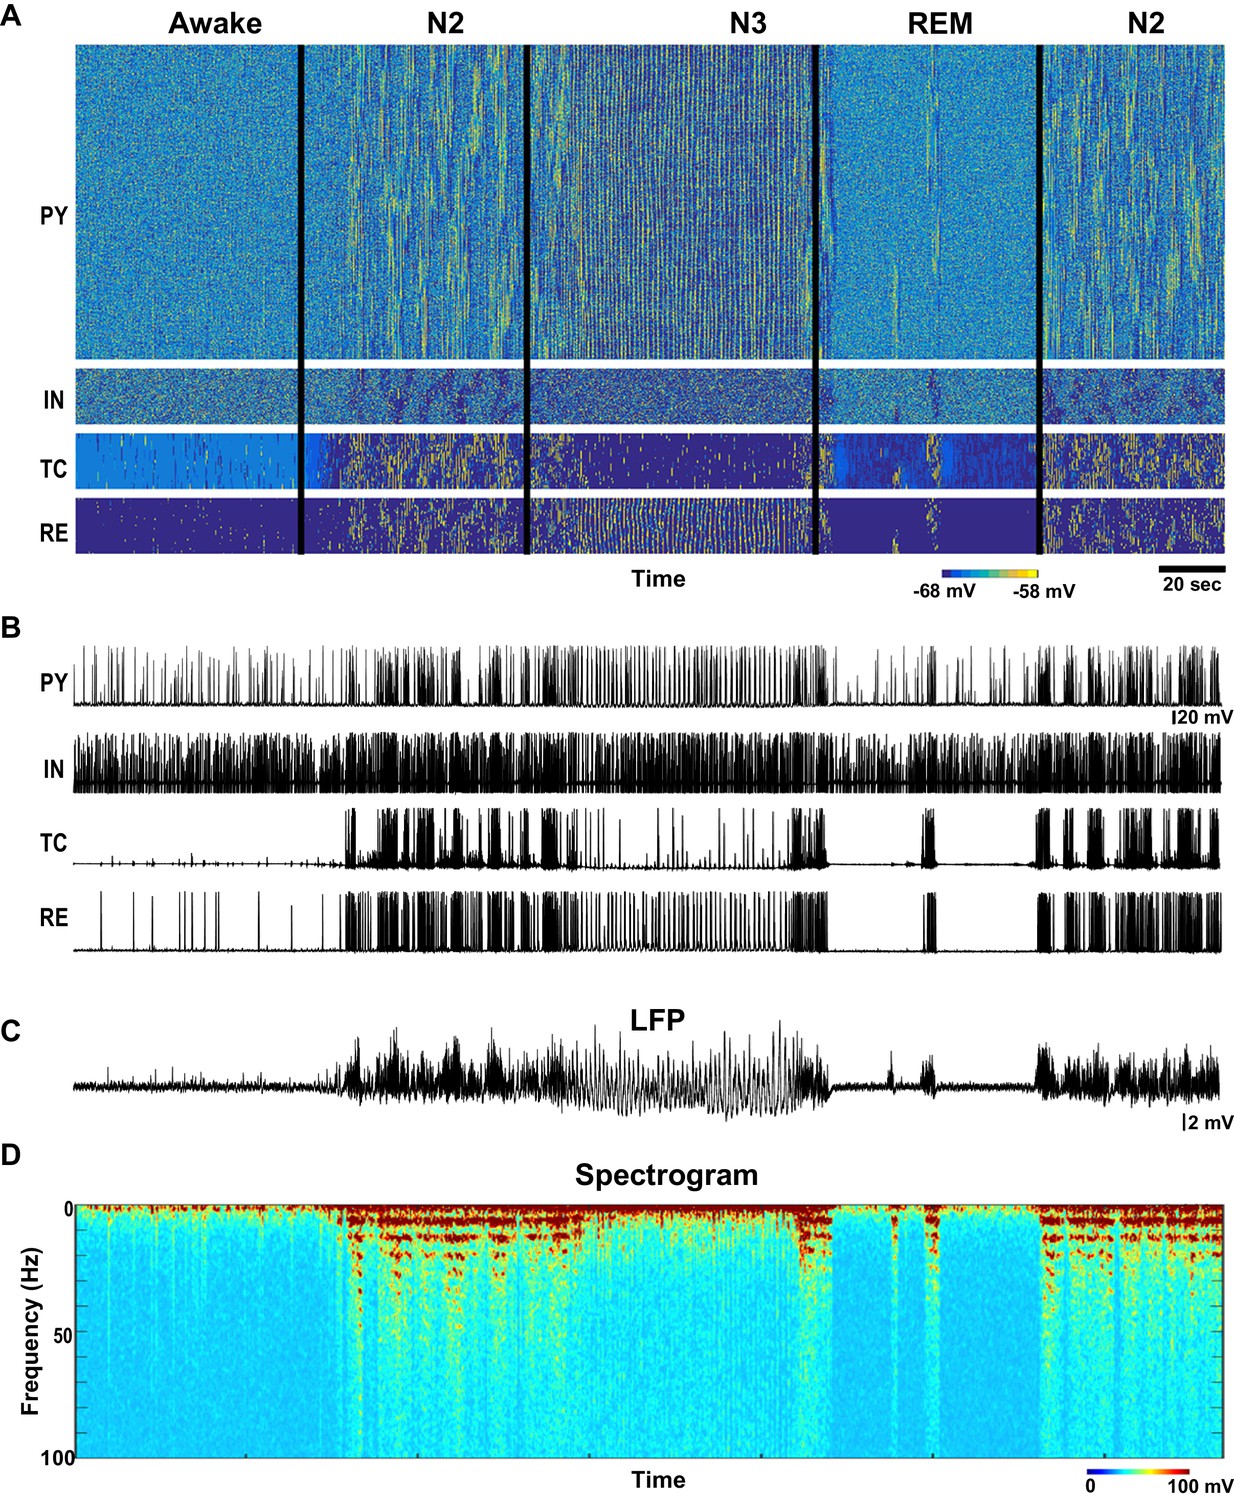
Network activity in awake, N2, N3 and REM sleep stages.
(A) Top: Activity of all classes of neurons in the thalamocortical network model (500 PY, 100 IN, 100 RE and 100 TC cells) with the neuromodulators (ACh, GABA and HA) varying as shown in the Figure 1B–D. X-axis is time and Y-axis is neuron index. Colors indicate membrane voltage. For awake, N2, N3 and REM stages, respectively, ACh was 100%, 80%, 50% and 115%; HA was 100%, 40%, 30% and 10%; and GABA was 100%, 115% 130% and 75%. (B) Membrane voltages of the representative selected neurons from the network. (C) LFP calculated from PY network (mean voltage of all 500 PY neurons). Note spindles and slow oscillations during N2 and N3, respectably. (D) Spectrogram (based on the sliding time window FFT) of the LFP shows activity in spindle frequency (8–15 Hz) during N2, rare alpha-burst events (8–15 Hz) during REM, and slow oscillation (0.5–1 Hz) during N3.
Figure 3
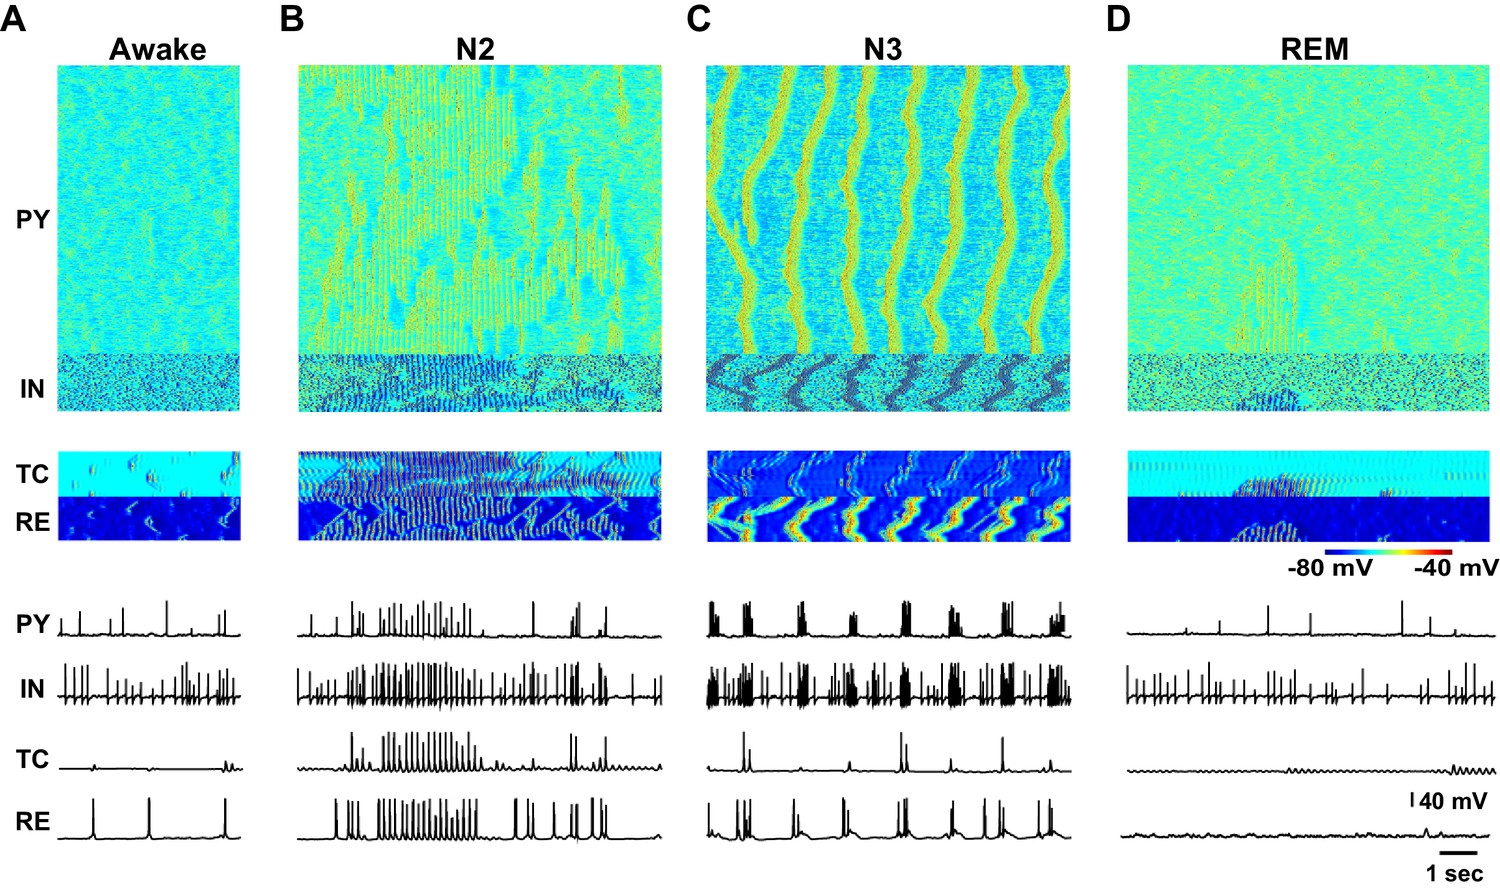
Characteristic patterns of electrical activity during different sleep stages.
(A) Top: Network activity in PY, IN, TC and RE cells shown for a 5 s time window during awake. Y-axis is neuron index. Colors indicate membrane voltage. Bottom: membrane voltages of selected neurons from the network (neuron #250 in PY, #50 in IN, RE and TC populations). (B–D) Network activity during N2 (B) N3 (C) and REM (D) sleep for a 10 s time window. Legend is same as for panel A. Note a single localized in space 'alpha-burst' event in D.
Figure 4
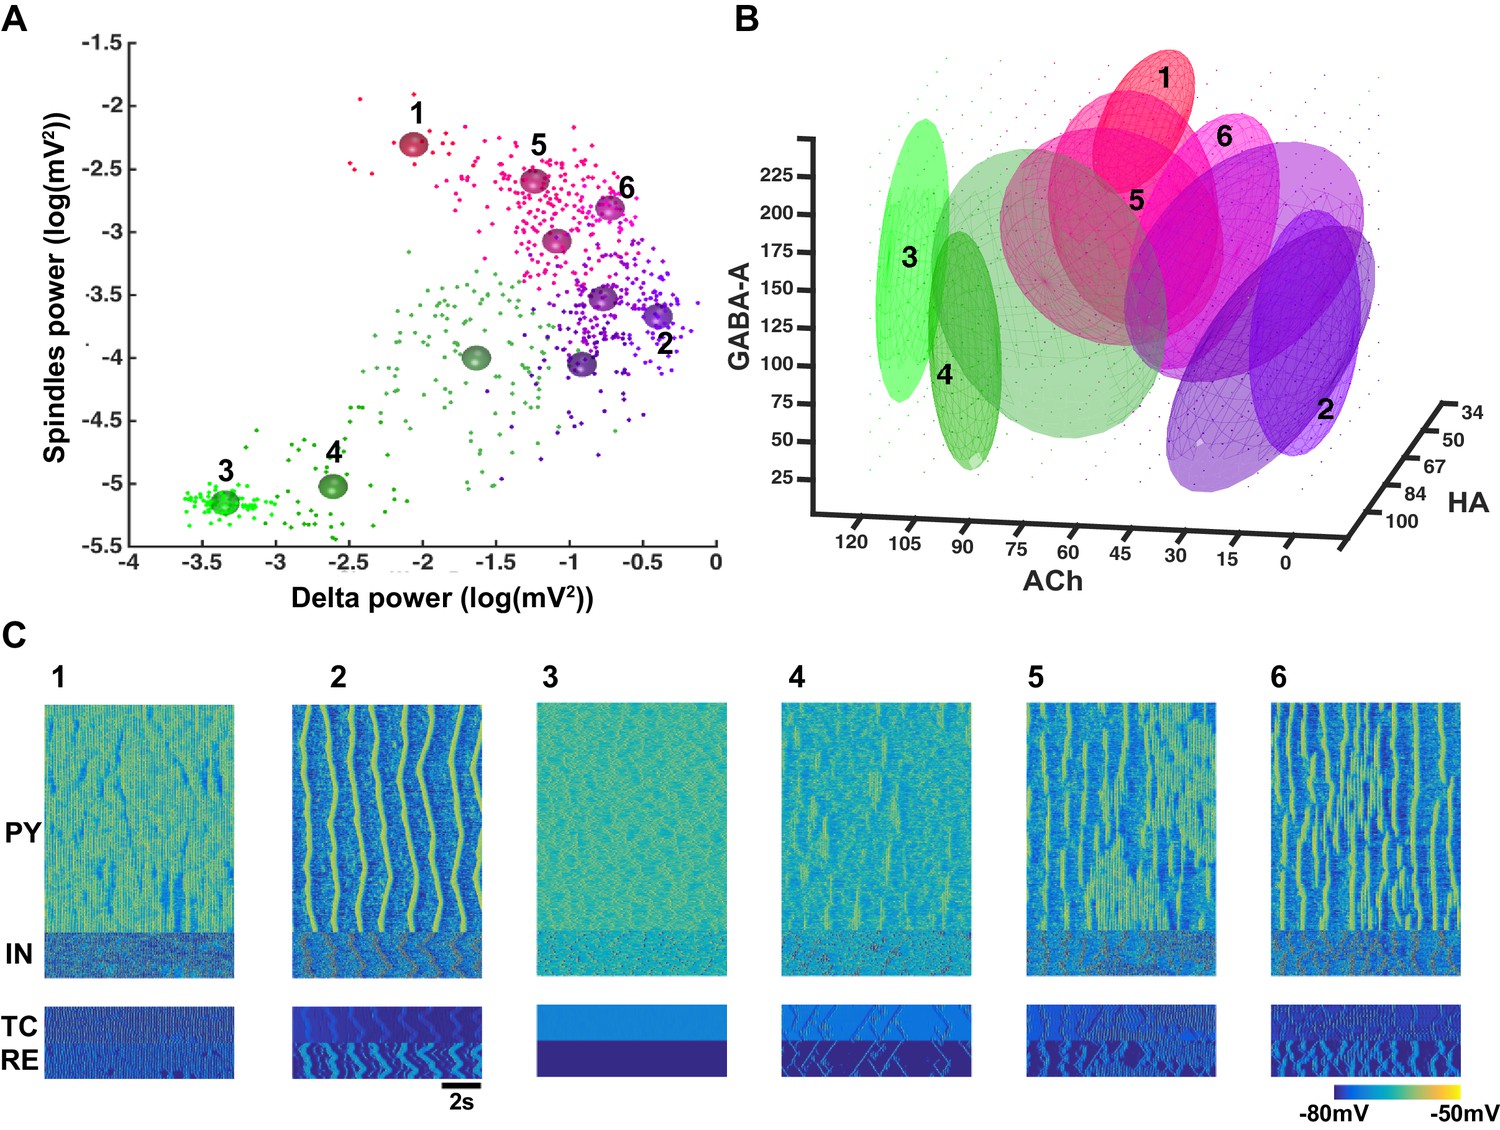
Cluster analysis of the electrophysiological and neuromodulatory spaces.
(A) Delta (0.5–4 Hz) power of the global LFP (mean voltage of the 500 PY neurons) is plotted against spindle (7–15 Hz) power for different combinations of ACh, GABA and HA. Different colors represent different clusters identified based on the cluster analysis (mixed Gaussian model-based clustering was computed with spindle and delta power and Phase Locking Value (PLV) as inputs; 10 different clusters were identified). The PLV was computed for all pairs taken from 5 LFPs (mean voltage time series that were obtained by averaging every 100 PY neurons). Color spheres indicate the mean values of the clusters. (B) Projections of the clusters identified in panel A to the neuromodulator space of the ACh, HA and GABA. Each ellipsoid represents the approximate location of the clusters identified in A. (C) Characteristic electrical activity of the thalamocortical network (top to bottom: PY, IN, TC and RE cells) for each cluster identified in panels A and B. Cluster index is indicated above each plot and corresponds to the index in the panels A and B.
Figure 5
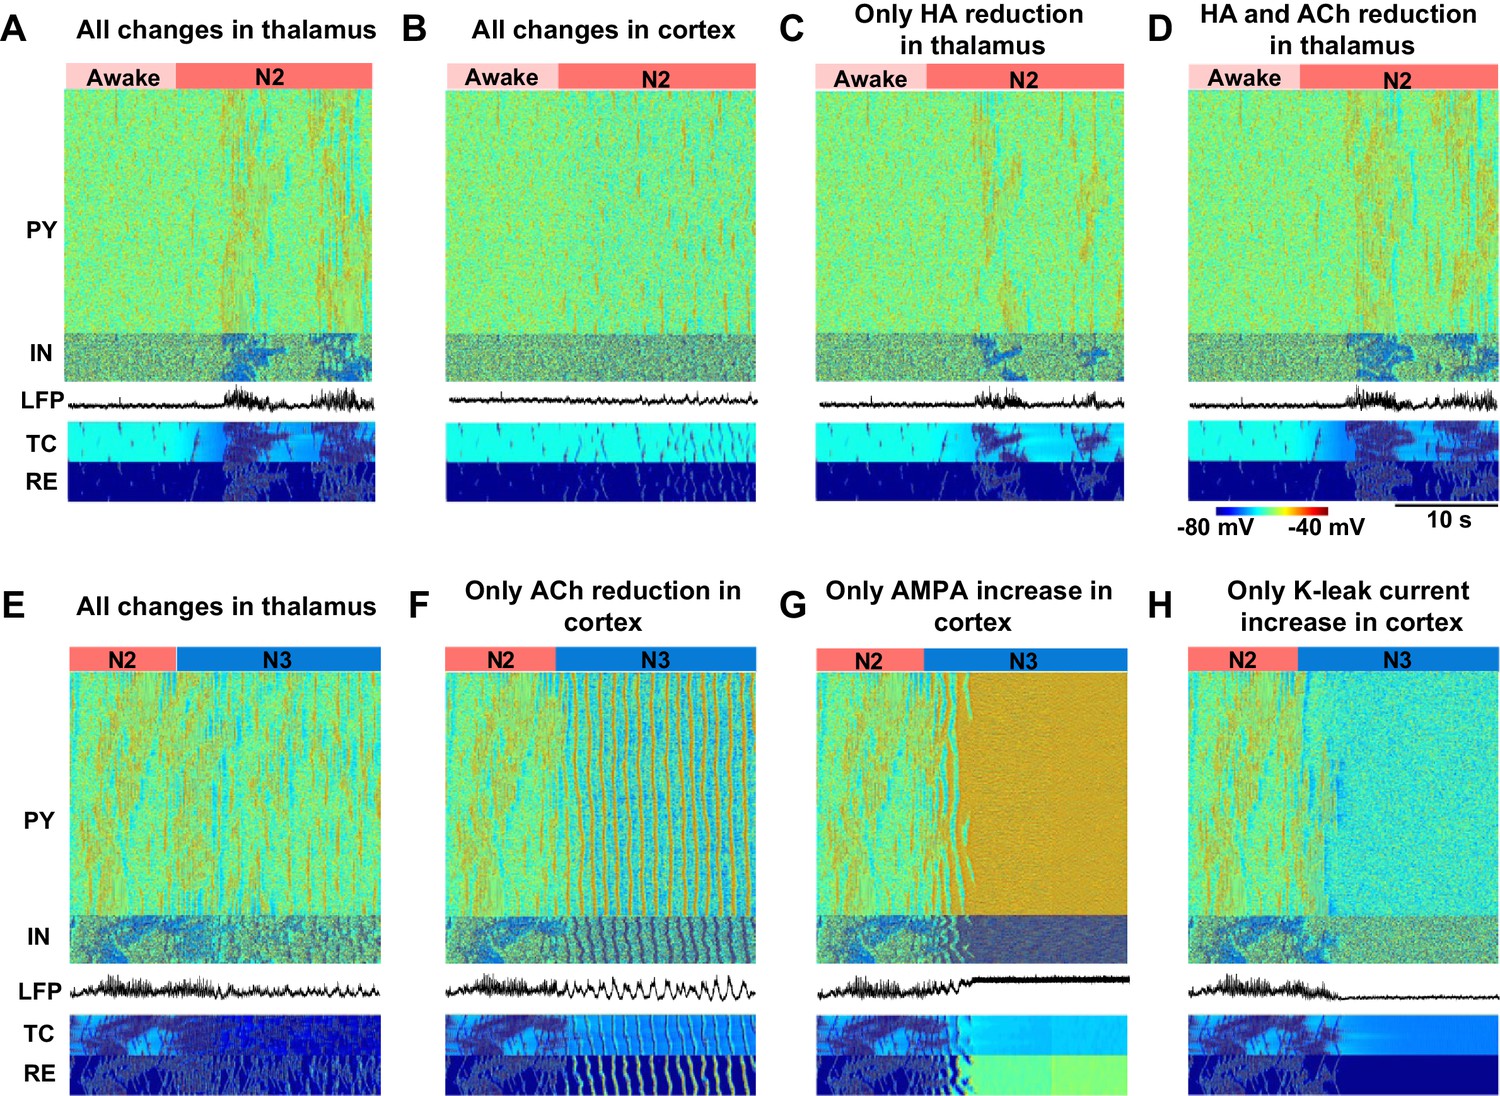
Minimal models of sleep state transitions.
In all these simulations only specific indicated manipulations were performed. Other model parameters remained unchanged compared to the awake state. The time of the parameter changes is indicated by the bars at the top of each plot. Each plot shows activity of all classes of neurons in the thalamocortical network (500 PY, 100 IN, 100 RE and 100 TC cells) and the LFP. (A) All previously indicated manipulations corresponding to the awake to N2 transition (reduction of ACh and HA, and an increase in GABA) were performed in the thalamic network; no cortical changes. For awake stage: , , , (RE-RE, RE-TC) were 1.0, 1.0, −8.0 and 1.0 respectively. For N2 stage: , , , (RE-RE, RE-TC) were 1.25, 1.25, −3.0 and 1.15 respectively; , and (IN-PY) were all fixed at 1.0. (B) All previously indicated manipulations corresponding to the awake to N2 transition (reduction of ACh and increase in GABA) were performed in the cortical network; no thalamic changes. For awake stage: , , , (IN-CX) were 1.0, 1.0, -8.0 and 1.0 respectively. For N2 stage: , , and (IN-CX) were 1.25, 1.25, -3.0 and 1.15 respectively; , and (RE-RE, RE-TC) were fixed at 1.0. (C) HA level was reduced in the thalamic network; no any other changes were performed. For awake and N2: only was changed from −8 to −3; all other variables were fixed at awake level. (D) HA and ACh levels were reduced in the thalamic network; no any other changes were performed. For awake stage: , , (RE-RE, RE-TC) were 1.0, 1,0, −8.0 and 1.0 respectively. For N2 stage: , , (RE-RE, RE-TC) were 1.25, 1.25, −3.0 and 1.15 respectively; , , (IN-CX) were fixed at 1.0. (E) All specific manipulations corresponding to the N2 to SWS transition (ACh, HA and GABA levels modified) were performed in the thalamic network; no changes in the cortex. For N2 stage: , , , (RE-RE, RE-TC) were 1.25, 1.25, − 3.0 and 1.15 respectively. For N3 stage: , , , (RE-RE, RE-TC) were 2.0, 2.0, −8.0 and 1.3, respectively; , and (IN-PY) were fixed at N2 stage level. (F) ACh level was reduced in the cortex; no any other changes were performed. For N2 and N3 stages, was 1.0 and 1.25; was 1.0 and 1.25; all other variables were fixed at N2 level. (G) Only AMPA strength was increased in the cortex. For N2 and N3 stages, was 1 and 1.25, correspondingly; all other variables were fixed at N2 level. (H) K+ leak current was decreased in the PY neurons. For N2 and N3 stages, was 1 and 1.25, correspodingly; all other variables were fixed at N2 level.
Figure 6
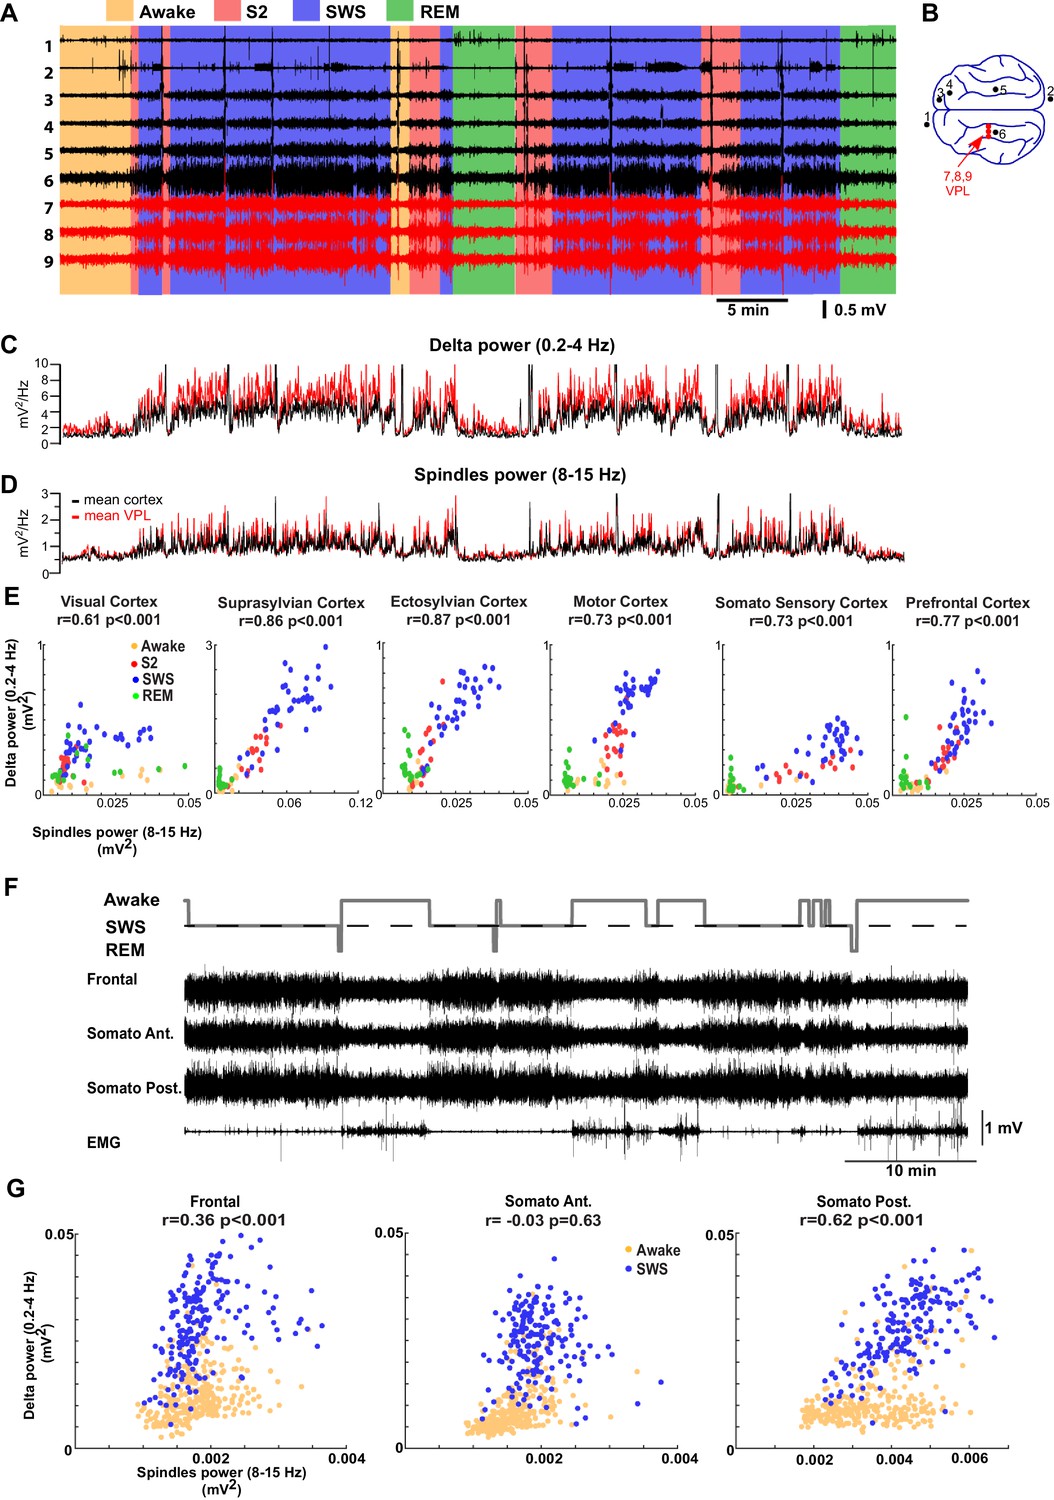
LFP recordings from cats and mice show positively correlated spindle and delta power during NREM sleep.
(A). In vivo LFP recordings from different locations in the cortex (black lines) and the thalamus (red lines) of a non-anesthetized cat. (B) Locations of the recording electrodes. (C,D) Power at delta frequency (0.2–4 Hz) (C) and spindle frequency (8–15 Hz) (D) measured from 5 s time windows (1 s sliding window). (E) Spindle power is plotted against delta power for different channels. PCA was applied prior to computing the power and the principal components correlating strongly to EOG were removed; channel data were recomputed from remaining components to remove eye movement artifacts. Each dot represents the power in spindle and delta bands measured from a 30-s period of cat recordings. Note a positive correlation between delta and spindle power when combining S2 and SWS epochs. (F) Top: Hypnogram of recordings in mice. Bottom: In vivo LFP recordings from different cortical locations in mice. Note lack of S2 periods in mice. (G) Spindle power is plotted against delta power for different channels in mice. Each dot represents the power in spindle and delta bands measured from a 30-s window of data. There is a positive correlation between delta and spindle power during SWS epochs.
Figure 7
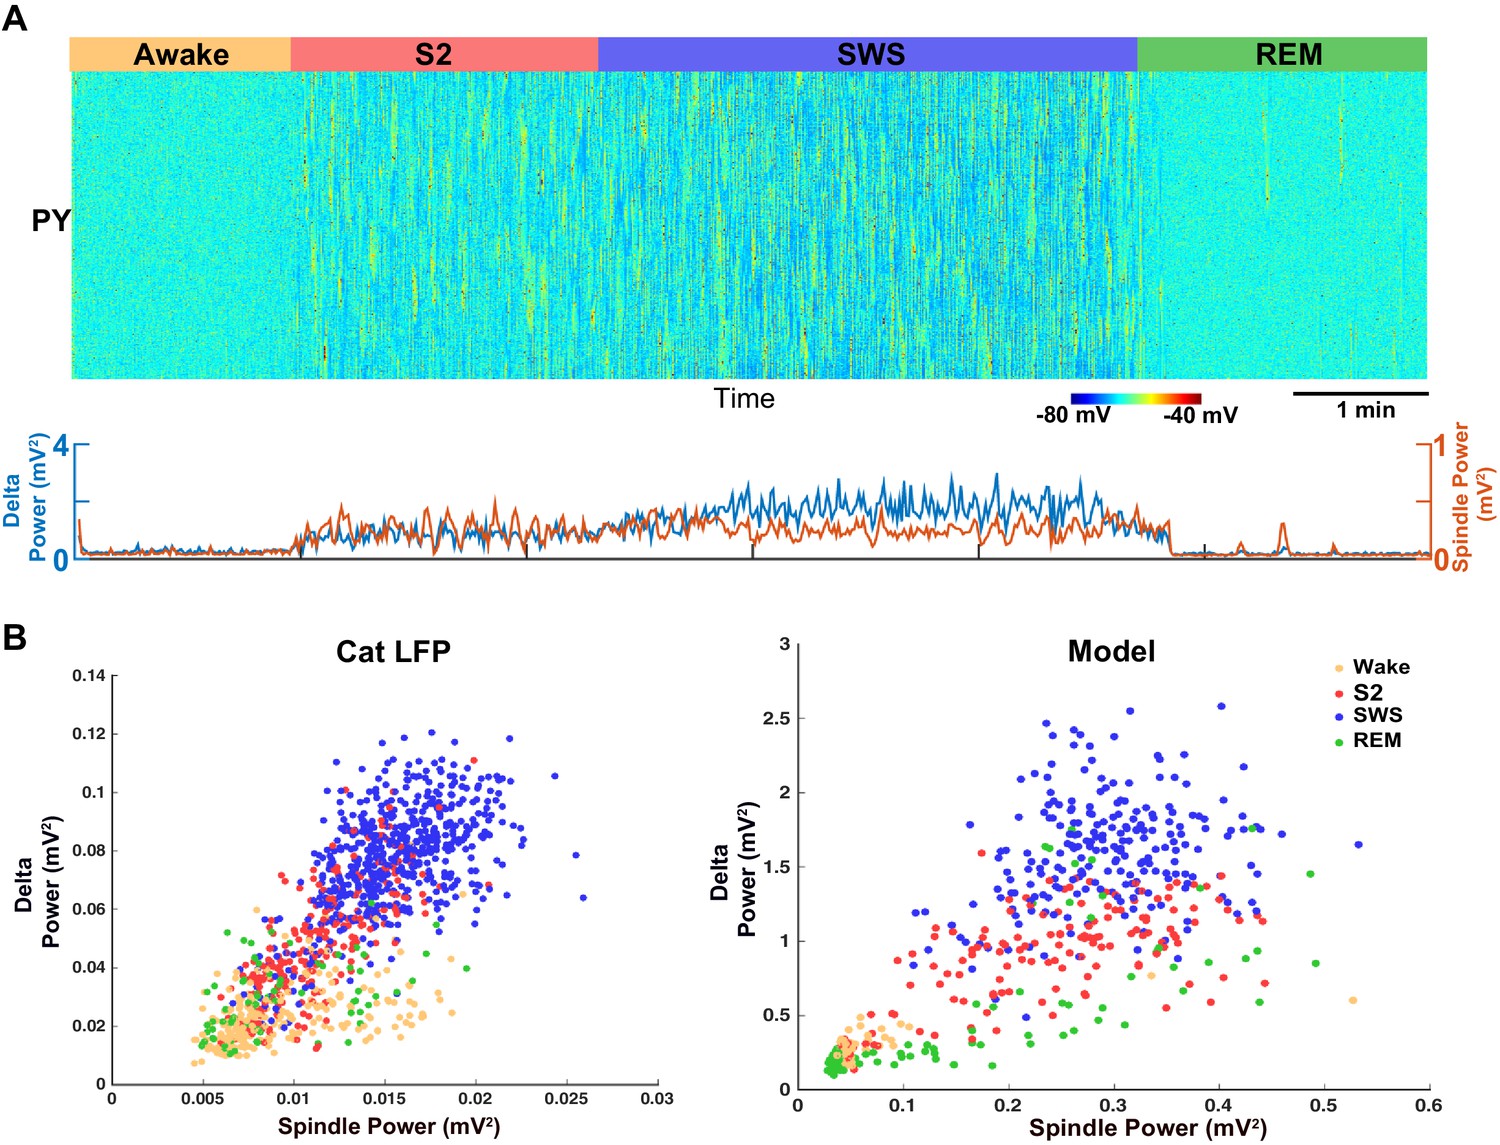
Model predicts temporal characteristics of the LFP activity in cats and mice.
(A) The network model implementing moderate ACh reduction (to 75% of the baseline awake level) reproduces sleep stage transitions with pattern of activity similar to that recorded from cats and mice. (B) Spindle power (7–15 Hz) averaged across all electrodes is plotted against delta band power (0.5–4 Hz) for different sleep stages. PCA was applied to remove eye movement artifacts in cat recordings. Right: Spindle power vs. delta power based on the model simulations. Average activity within groups of 100 neurons was used as an estimate of the LFP. Each dot represents the power in spindle and delta bands measured from 2 s windows of data obtained from the model simulations.
Figure 8
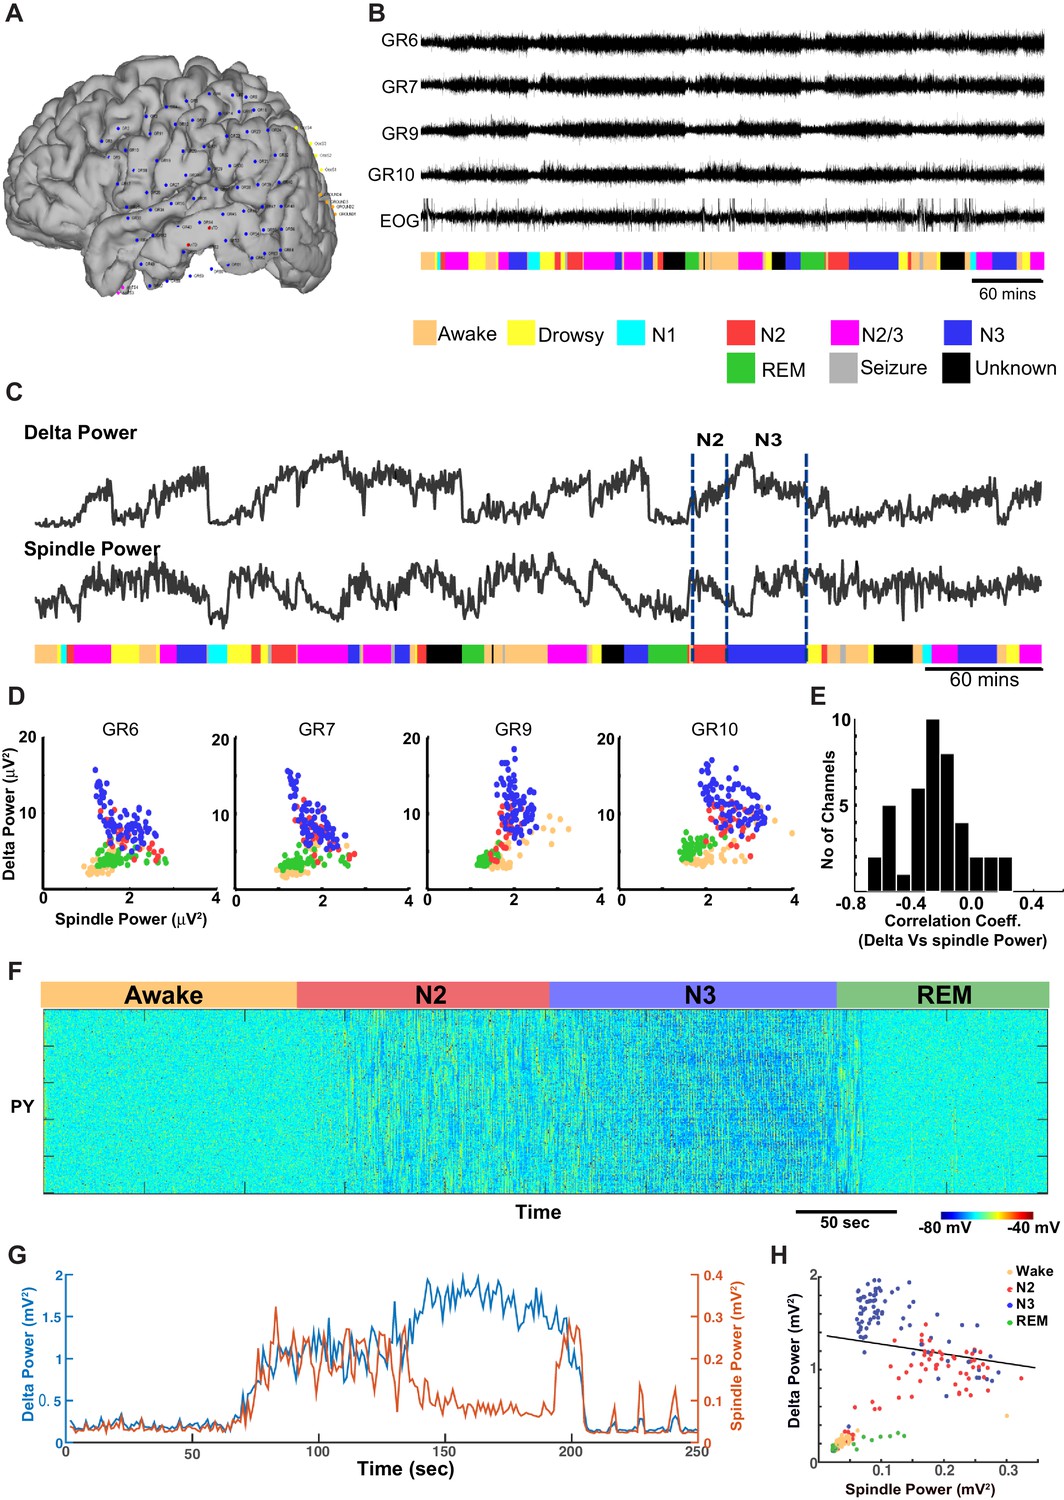
ECoG recordings from a human patient show negatively correlated spindle and delta power during NREM sleep.
(A) Patient MG29 had a 64-contact grid and 4 strips implanted over the left hemisphere. After rejection of electrodes that either had poor contact or showed significant epileptic interictal activity, 42 electrode contacts remained for analysis. (B) Recording of patient for 9 hr beginning in the evening, during which patient was both awake and asleep. Shown are LFP over four grid electrodes, along with the right EOG channel. Beneath that is the sleep staging done in 30 s epochs. Staging was scored using information from scalp, EOG and intracranial electrodes. Data from Awake, REM, N2 and N3 were used for further analysis. A significant decrease in overall LFP amplitude was seen in REM and occasionally during awake. (C) Delta and spindle power over the same period. A Fast Fourier Transform with a window size of 30 s was done for delta (band 0.01–2 Hz) and spindle (9–17 Hz) band frequencies to obtain their power. All 42 electrodes were averaged and are plotted here. (D) Delta vs. spindle bands for 30 s time epochs were plotted for individual electrodes and separated based on sleep staging. There is a negative correlation between delta (dominated by slow oscillation) and spindle activities for these electrodes when combining N2 and N3 epochs. (E) A histogram of Pearson's R correlation coefficients between delta and spindle power during N2 and N3 across all 42 electrodes. (F) The computational model implementing significant ACh reduction (to 45% of the baseline awake level) reproduces sleep stage transitions with pattern of activity similar to that recorded from humans. (G) Spectral analysis of model activity. Power at delta frequency (0.2–4 Hz, red) and spindle frequency (8–15 Hz, blue) were measured from FFT obtained with non-overlapping sliding 2 s windows, similar to the analysis shown in C of actual recordings. (H) Inverse correlation of delta and spindle power in the model during combined N2 and N3 activity, similar to human recordings in D.
Figure 9
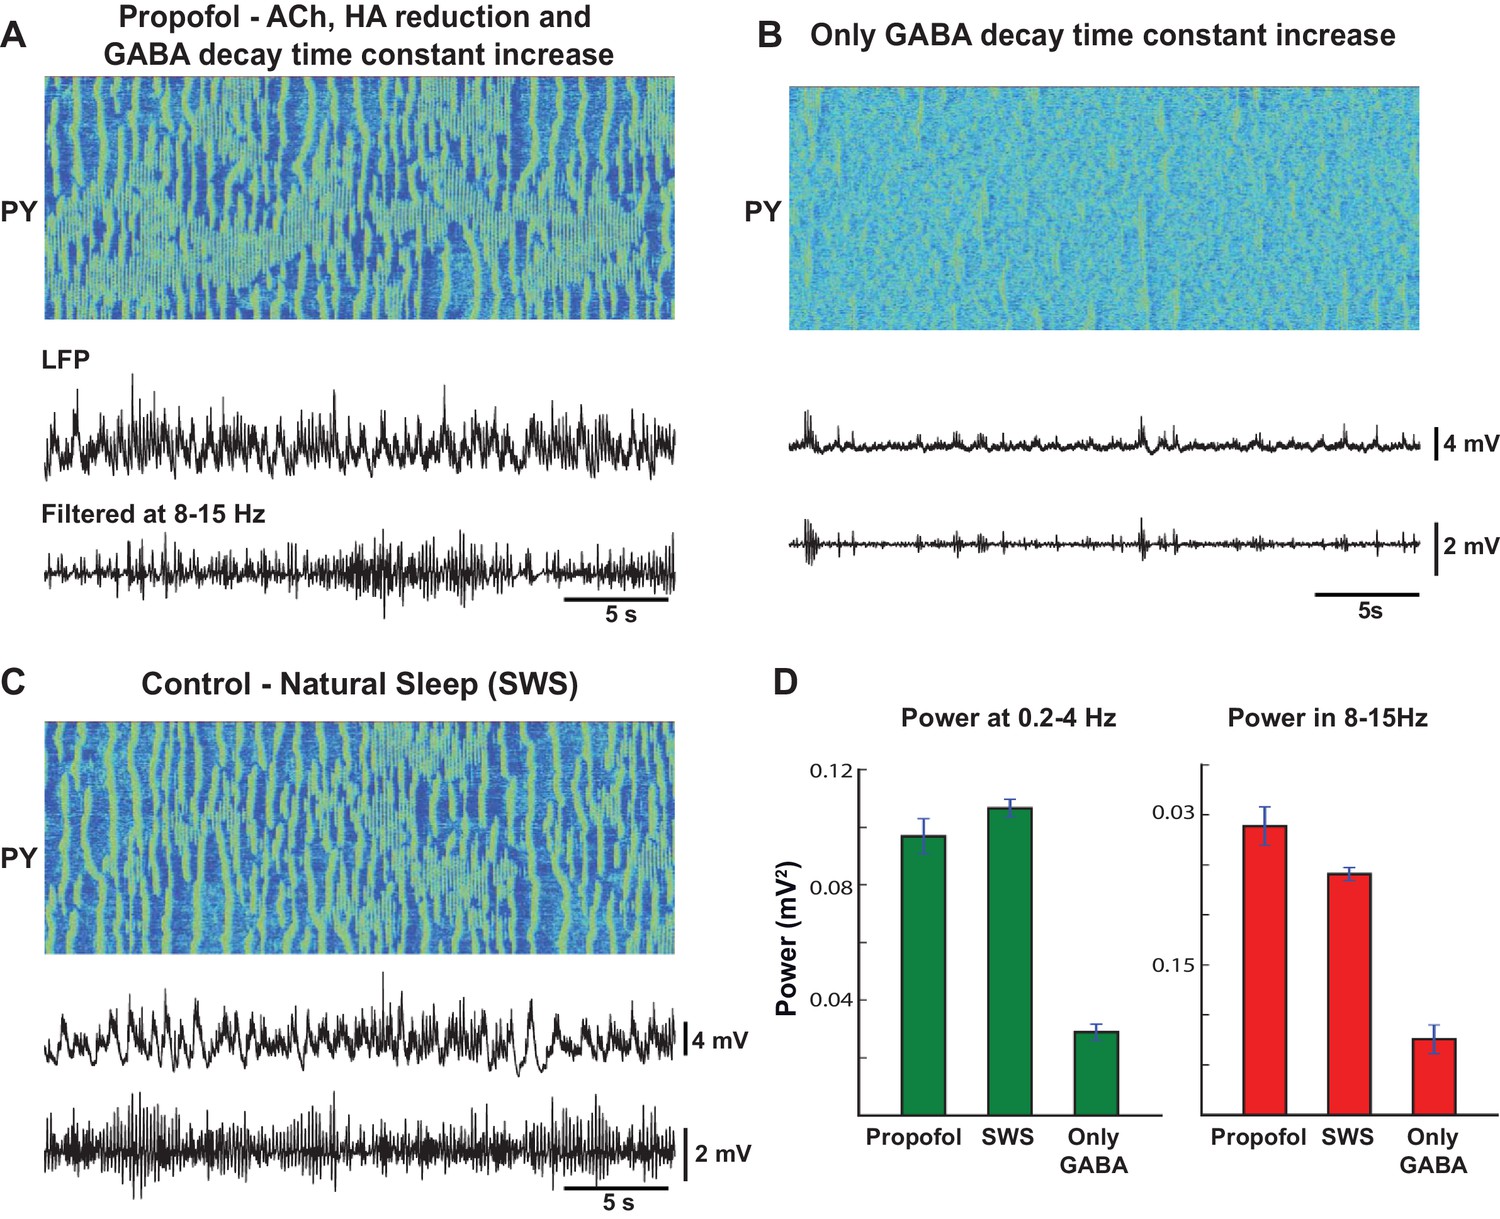
Mechanism of action of propofol induced anesthesia.
(A) Model of propofol anesthesia implementing inhibition of ACh and HA release and increase in the decay time constant of the GABAergic IPSPs. From top to bottom: Spatio-temporal pattern of activity in PY neurons, average activity in PY network (simulated LFP), band-filtered (7–15 Hz) PY LFP. The GABA decay time constant was increased by 150%; ACh and HA were reduced to the same level as in simulations of the natural sleep in cats. Note significant amount of spindle activity. (B) The model where only the GABA time constant was increased by 150%. Note an almost complete absence of spindle activity. (C) Network activity during simulated natural SWS in cat model. Note decreased spindle activity compared to the propofol simulations in panel A. (D) Power in 0.2–4 Hz and 8–15 Hz bands for all three conditions. The network was divided into 10 groups of 50 neurons. Membrane voltages were averaged within each group, then FFT was used to estimate power in each group. Bar height indicates average across 10 groups, error bar indicates standard deviation across 10 groups.
Figure 10
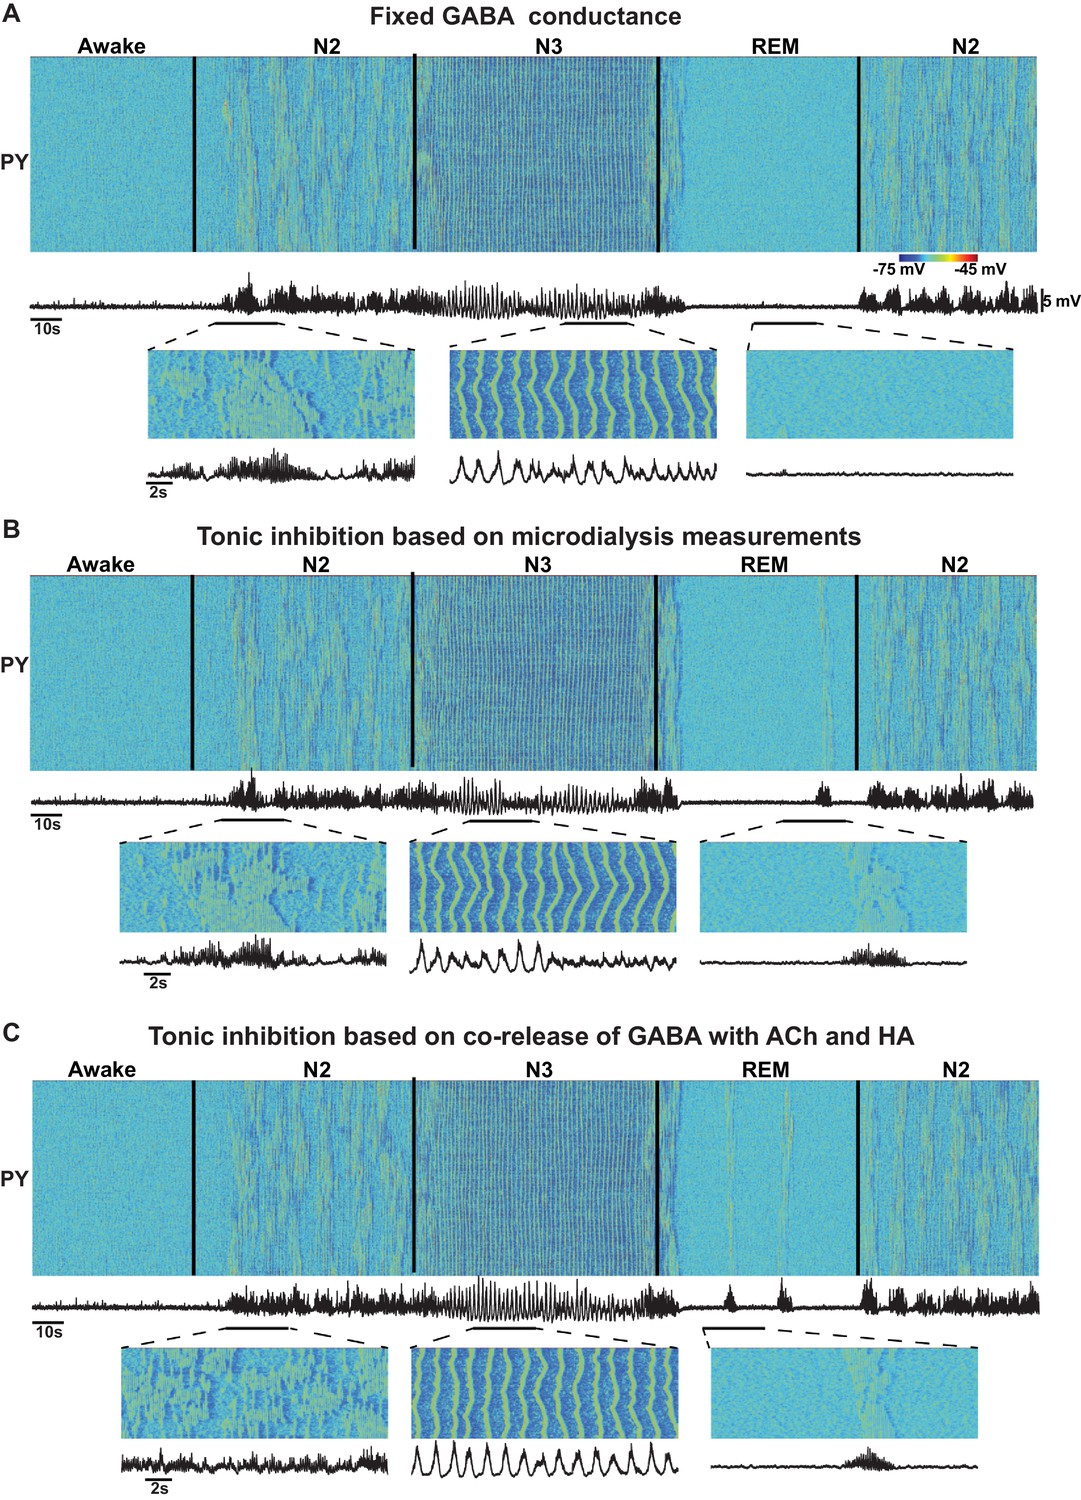
Effect of GABA on the network state transitions.
(A) Both phasic and tonic GABA conductances were fixed for entire simulation. Note the state transitions similar to the baseline model (Figure 2). (B) Tonic GABA conductance (conductance of the miniature IPSPs) was varied based on the measured GABA levels in microdialysis experiments (mIPSPs were modified as 115%, 130% and 75% of awake stage for N2, N3 and REM stages, respectively), while phasic GABA conductance was remained fixed. (C) Assuming co-release of ACh with GABA, tonic GABA conductance was proportionally varied with ACh concentration (mIPSP for GABA conductance was scaled as 85%, 70% and 125% of awake stage for N2, N3 and REM stages respectively). Transition between sleep stages was observed in all these conditions, but spindles were less synchronous in C; in A and B alpha-bursts were less common.
Figure 11
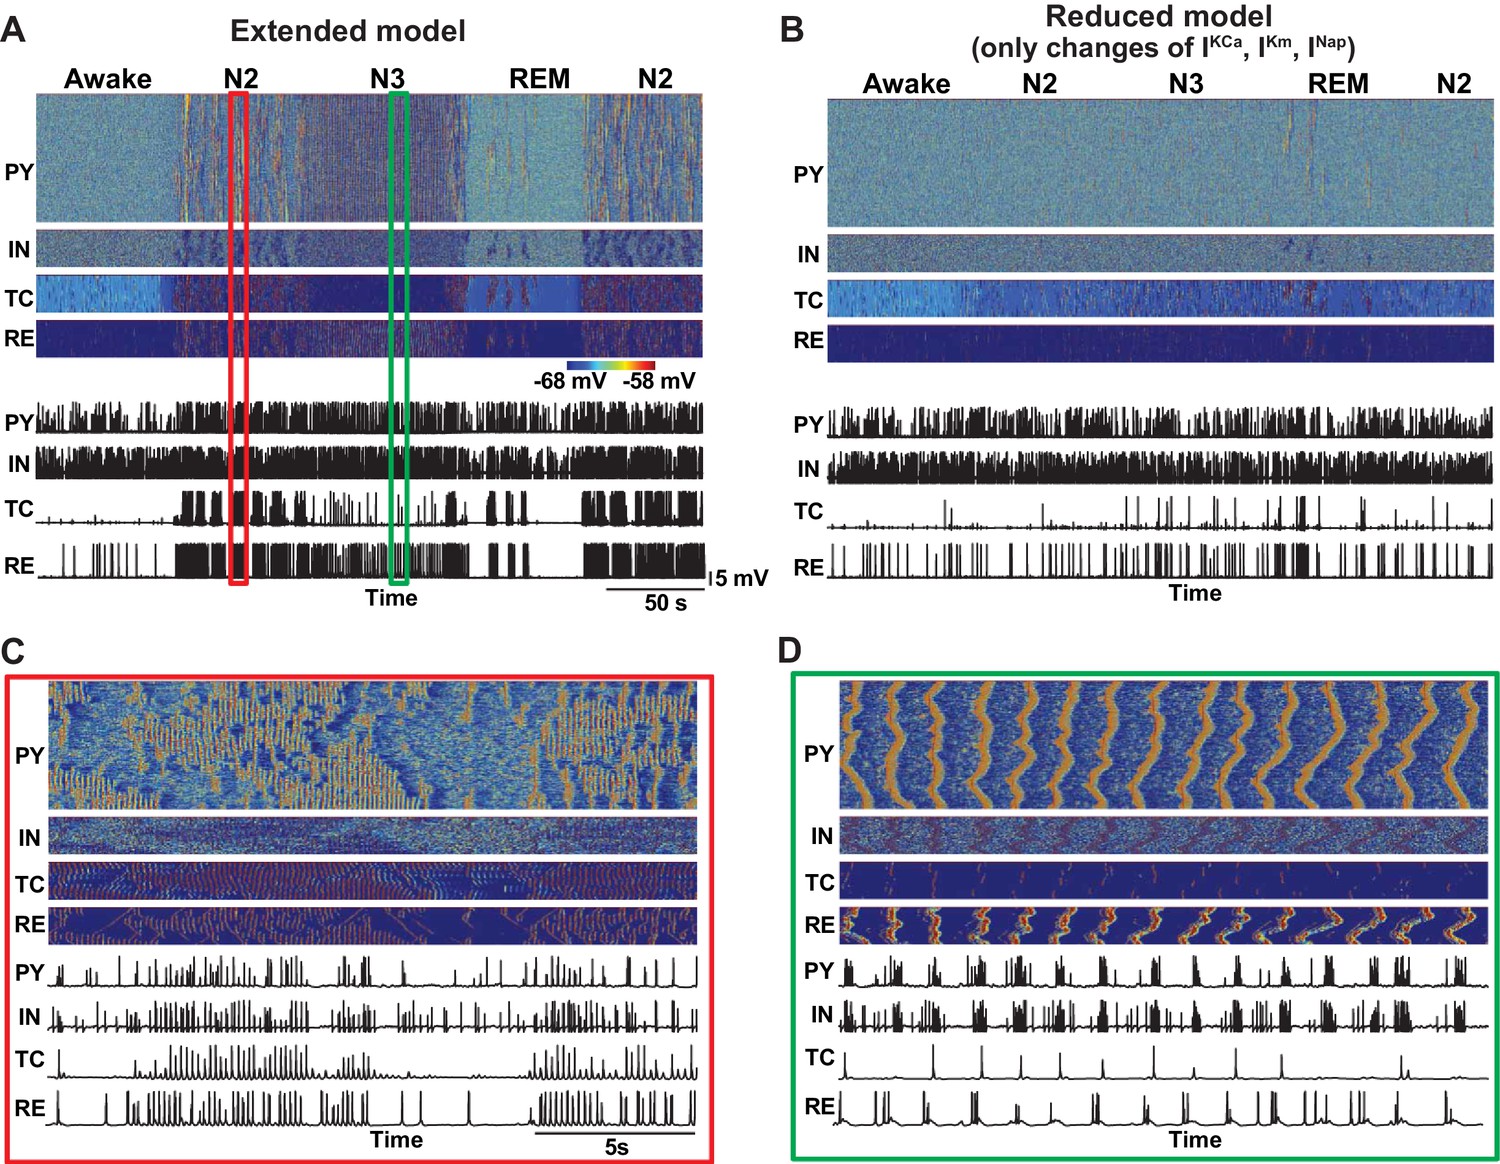
Effect of additional parameter changes on the stage transitions.
(A) Network activity in an extended model with ACh and HA having effects on the all K+ channels (Ca2+-dependent K+ current, M-current, K+ leak current), persistent Na+ current and H-current. (B) Network activity in the model implementing only additional effects of ACh and HA (Ca2+-dependent K+ current, M-current, persistent Na+ current) but having core intrinsic and synaptic properties (K+-leak, Ih, GABA and AMPA) fixed as in the awake model. This model failed to simulate transitions between sleep stages. (C and D) Zoom in of the periods during spindle (C) and slow oscillation (D) from panel A.
Author response image 1
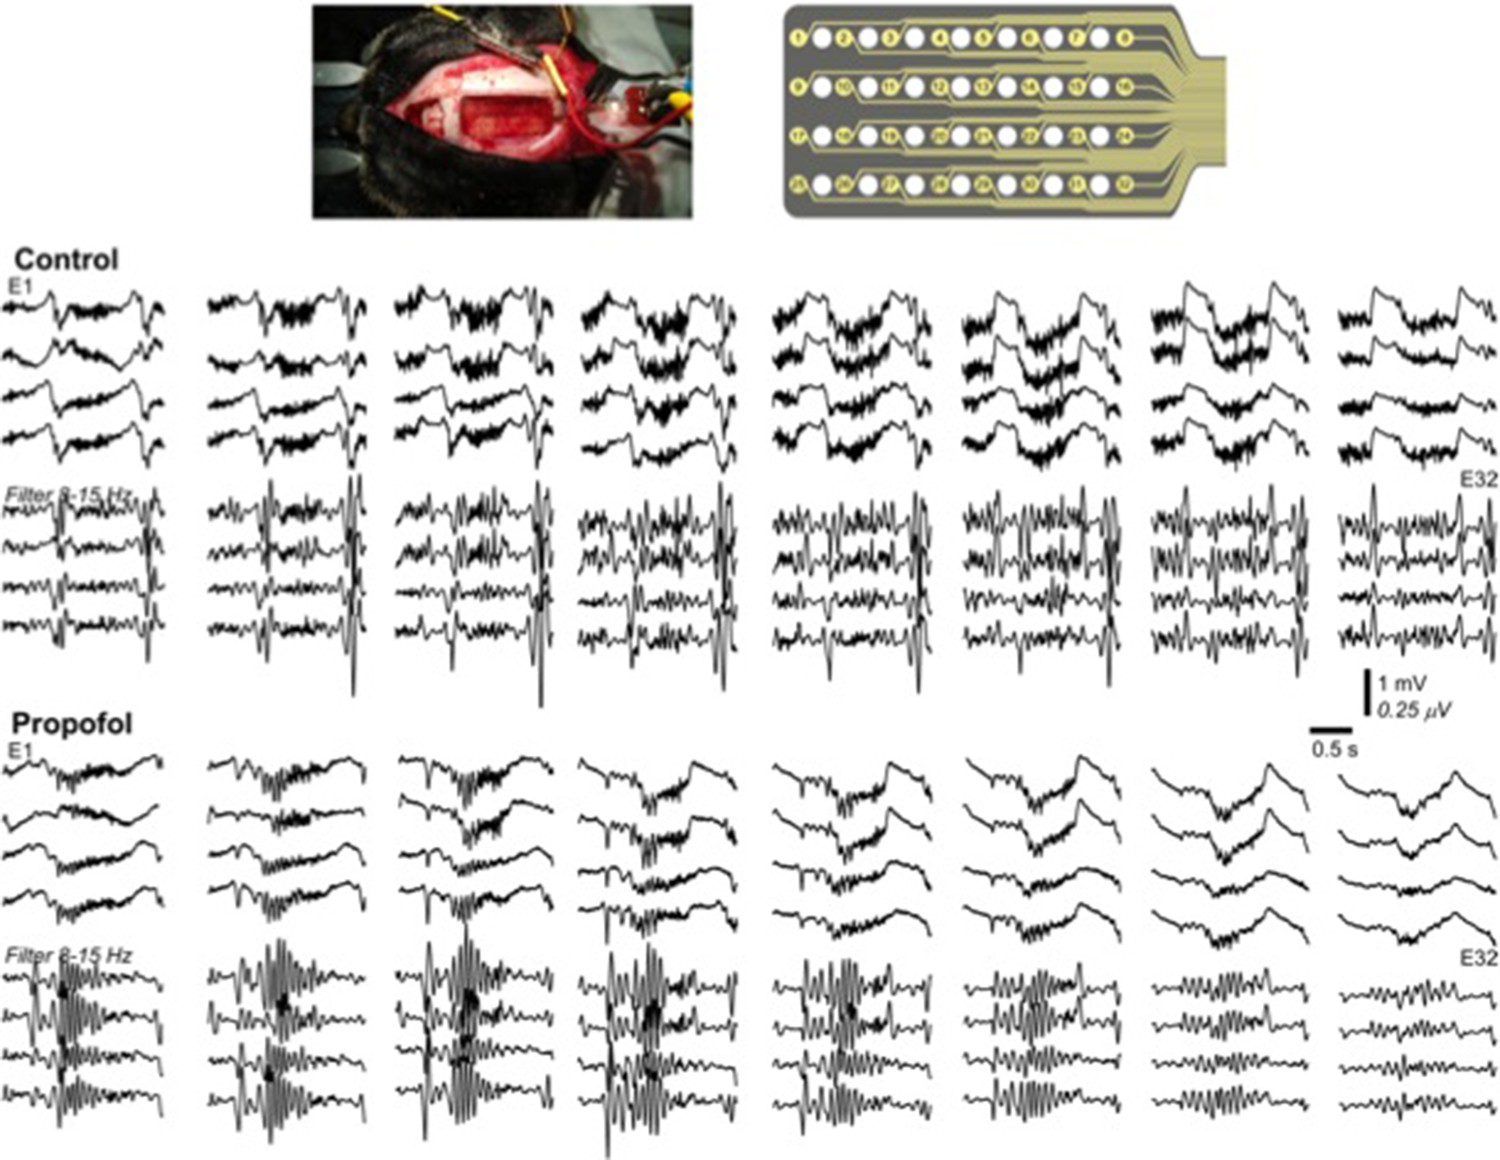
Multichannel recording from a cat during natural sleep (control) and propofol induced anesthesia condition.
Top plot shows the recording electrode and picture of the implanted electrode. Middle plot shows the activity during natural sleep (raw data on top and filtered activity on bottom). Bottom plot show the activity during propofol anesthesia.
Download links
A two-part list of links to download the article, or parts of the article, in various formats.
Downloads (link to download the article as PDF)
Open citations (links to open the citations from this article in various online reference manager services)
Cite this article (links to download the citations from this article in formats compatible with various reference manager tools)
Cellular and neurochemical basis of sleep stages in the thalamocortical network
eLife 5:e18607.
https://doi.org/10.7554/eLife.18607


