bMERB domains are bivalent Rab8 family effectors evolved by gene duplication
- Max Planck Institute of Molecular Physiology, Germany
- Technische Universität München, Germany
Figures
Figure 1

Domain architecture of human proteins containing bMERB domains.
Besides their C-terminal RBD (referred to as bivalent Mical/EHBP Rab binding (bMERB) domain), most Mical proteins contain an N-terminal Monooxygenase (red), a CH- and a LIM-domain (both orange). EHBPs also contain an actin binding CH-domain and an N-terminal membrane binding C2-domain (yellow) as well as a C-terminal prenylation motif (CaaX-box) following the bMERB domain. Two proteins predicted to contain only the bMERB domains (Mical-cL and C16orf45) are also shown. For proteins with multiple known splice variants, domain boundaries are indicated for isoform 1 (Mical-1: Uniprot ID Q8TDZ2, genomic location 6q21; Mical-L1: Uniprot ID Q8N3F8, genomic location 22q13.1; Mical-L2: Uniprot ID Q8IY33, genomic location 7p22.3; Mical-3: Uniprot ID Q7RTP6, genomic location 22q11.21; Mical-cL: Uniprot ID Q6ZW33, genomic location 11p15.3; EHBP1: Uniprot ID Q8NDI1, genomic location 2p15; EHBP1L1 Uniprot ID Q8N3D4, genomic location 11q13.1). The reader is referred to the main text for further details.
Figure 2 with 3 supplements
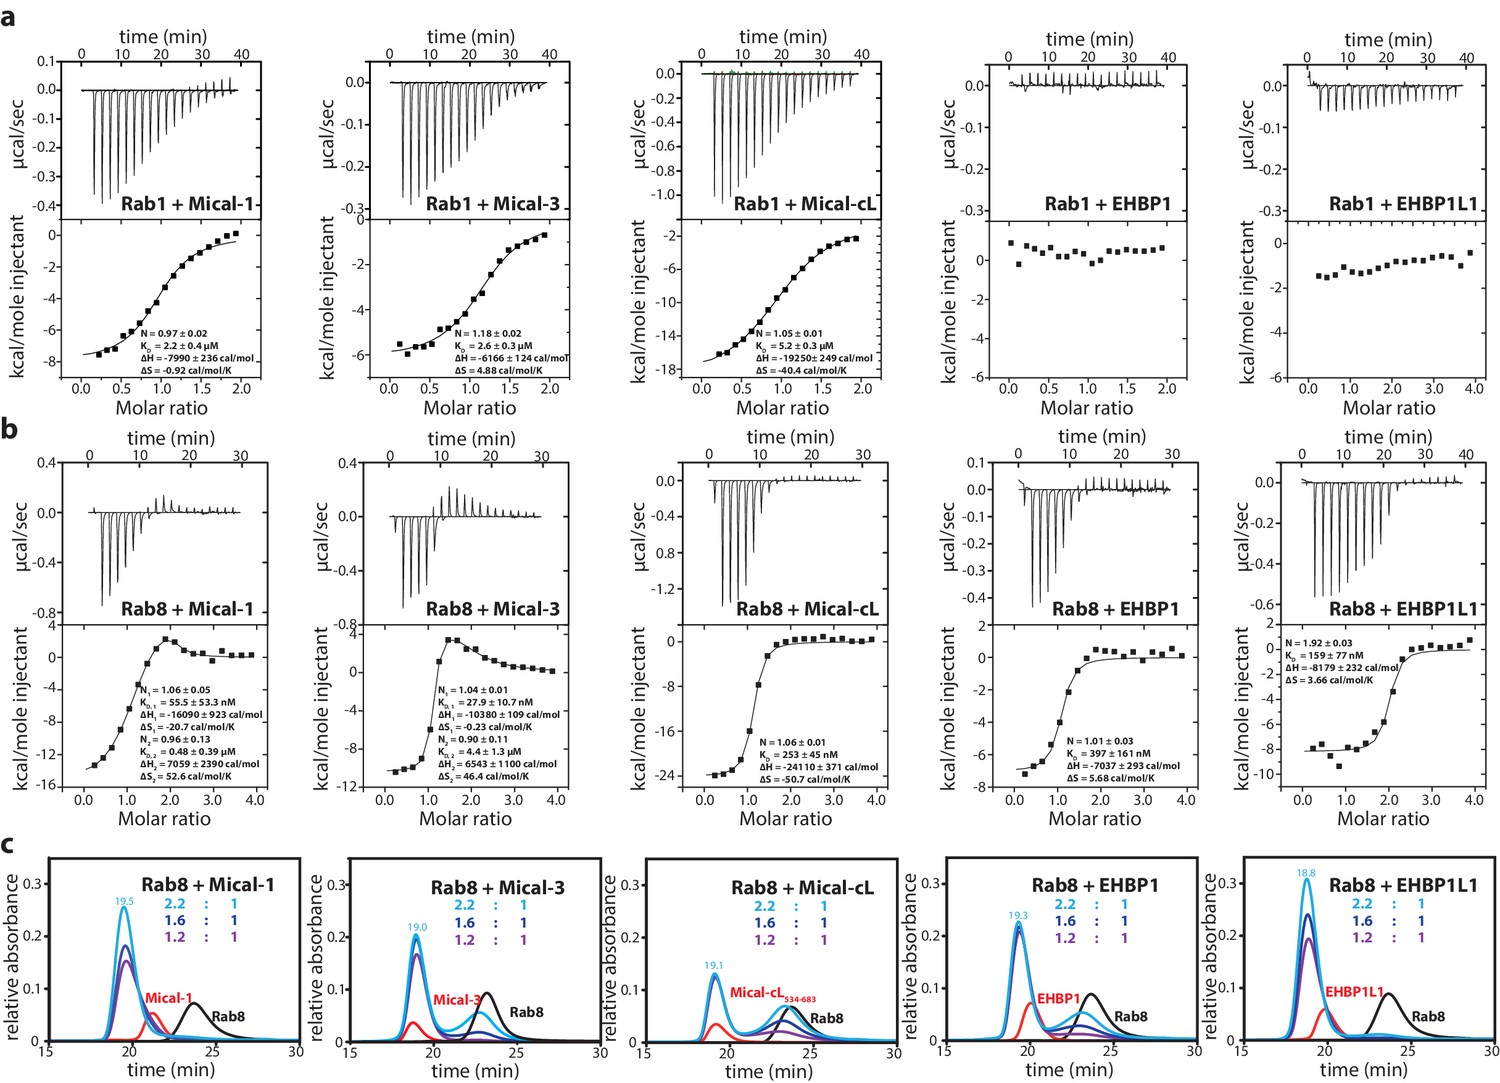
The bMERB domains preferentially interact with Rab8-family members.
(a) Whereas Rab1 binds to Mical-1, Mical-3 and Mical-cL with low affinity and does not show detectable binding to EHBPs, (b) Rab8 binds with high affinity to all effector domains tested. Additionally, we observed two separate binding sites in the ITC experiments for Rab8 and Mical-1, Mical-3 and EHBP1L1 (the results of the binding fit including the stoichiometry, the KD, the binding enthalpy and the binding entropy are shown within the ITC spectra). (c) Mixing different ratios of Rab8 and the RBDs (1.2:1, 1.6:1 and 2.2:1), the 2:1 stoichiometry of binding was confirmed by aSEC for Rab8:Mical-1 and Rab8:EHBP1L1, whereas a 1:1 stoichiometry was observed for Rab8:Mical-3, Rab8:Mical-cL and Rab8:EHBP1L1 as indicated by a second peak corresponding to free excess Rab8. Note that the second low affinity binding site present in Mical-3 observed via ITC could not be detected via gel filtration.
Figure 2—figure supplement 1
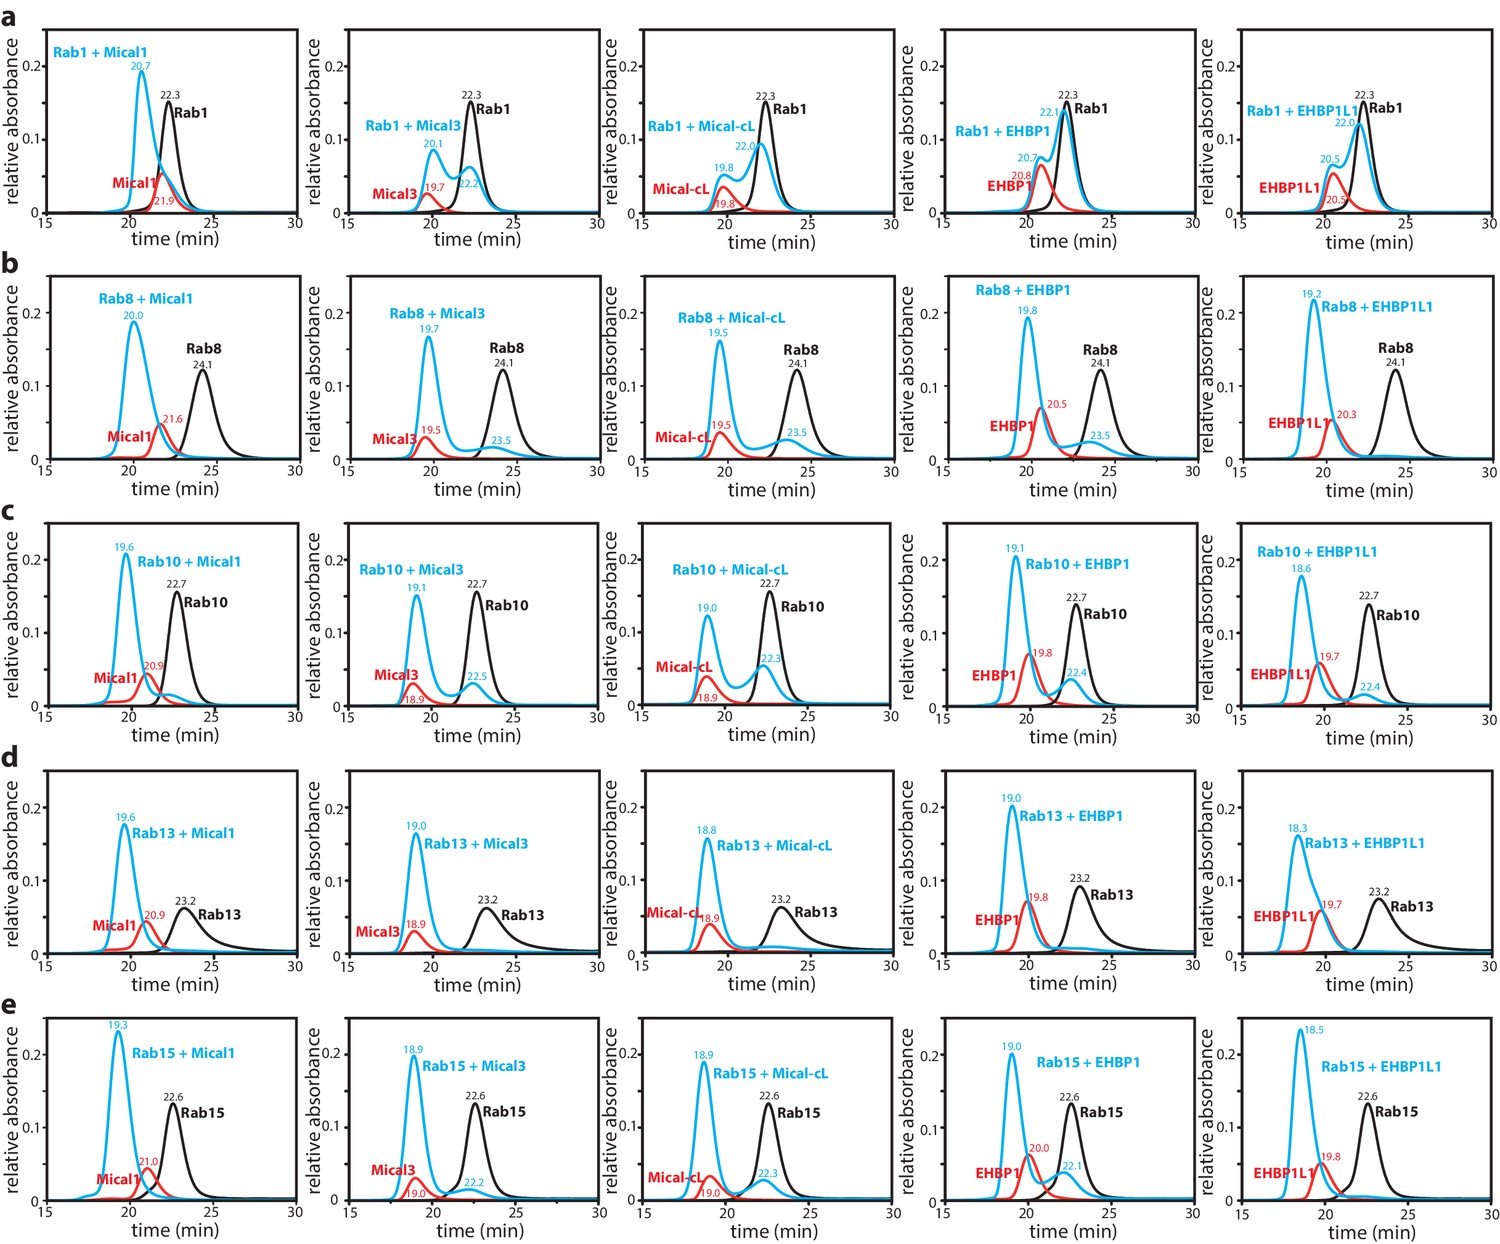
Interaction of Rab proteins with the RBD of Mical-1, Mical-3, Mical-cL, EHBP1 and EHBP1L1.
The Rab protein (130 µM, black) preparatively loaded with the non-hydrolyzable GTP-analogue GppNHp, the different bMERB domains (112.5 µM, red) and the mixture of both (130 µM Rab + 112.5 µM RBD) were subjected to analytical size exclusion chromatography (aSEC) and tested for complex formation between the RBDs (from left to right: Mical-1, Mical-3, Mical-cL, EHBP1, EHBP1L1) and the Rabs ((a) – Rab1, (b) – Rab8, (c) – Rab10, (d) – Rab13, (e) – Rab15). Note the missing (Rab1:EHBP1 and Rab1:EHBP1L1) or incomplete (Rab1:Mical-3 and Rab1:Mical-cL) complex formation in (a) indicating low-affinity binding.
Figure 2—figure supplement 2
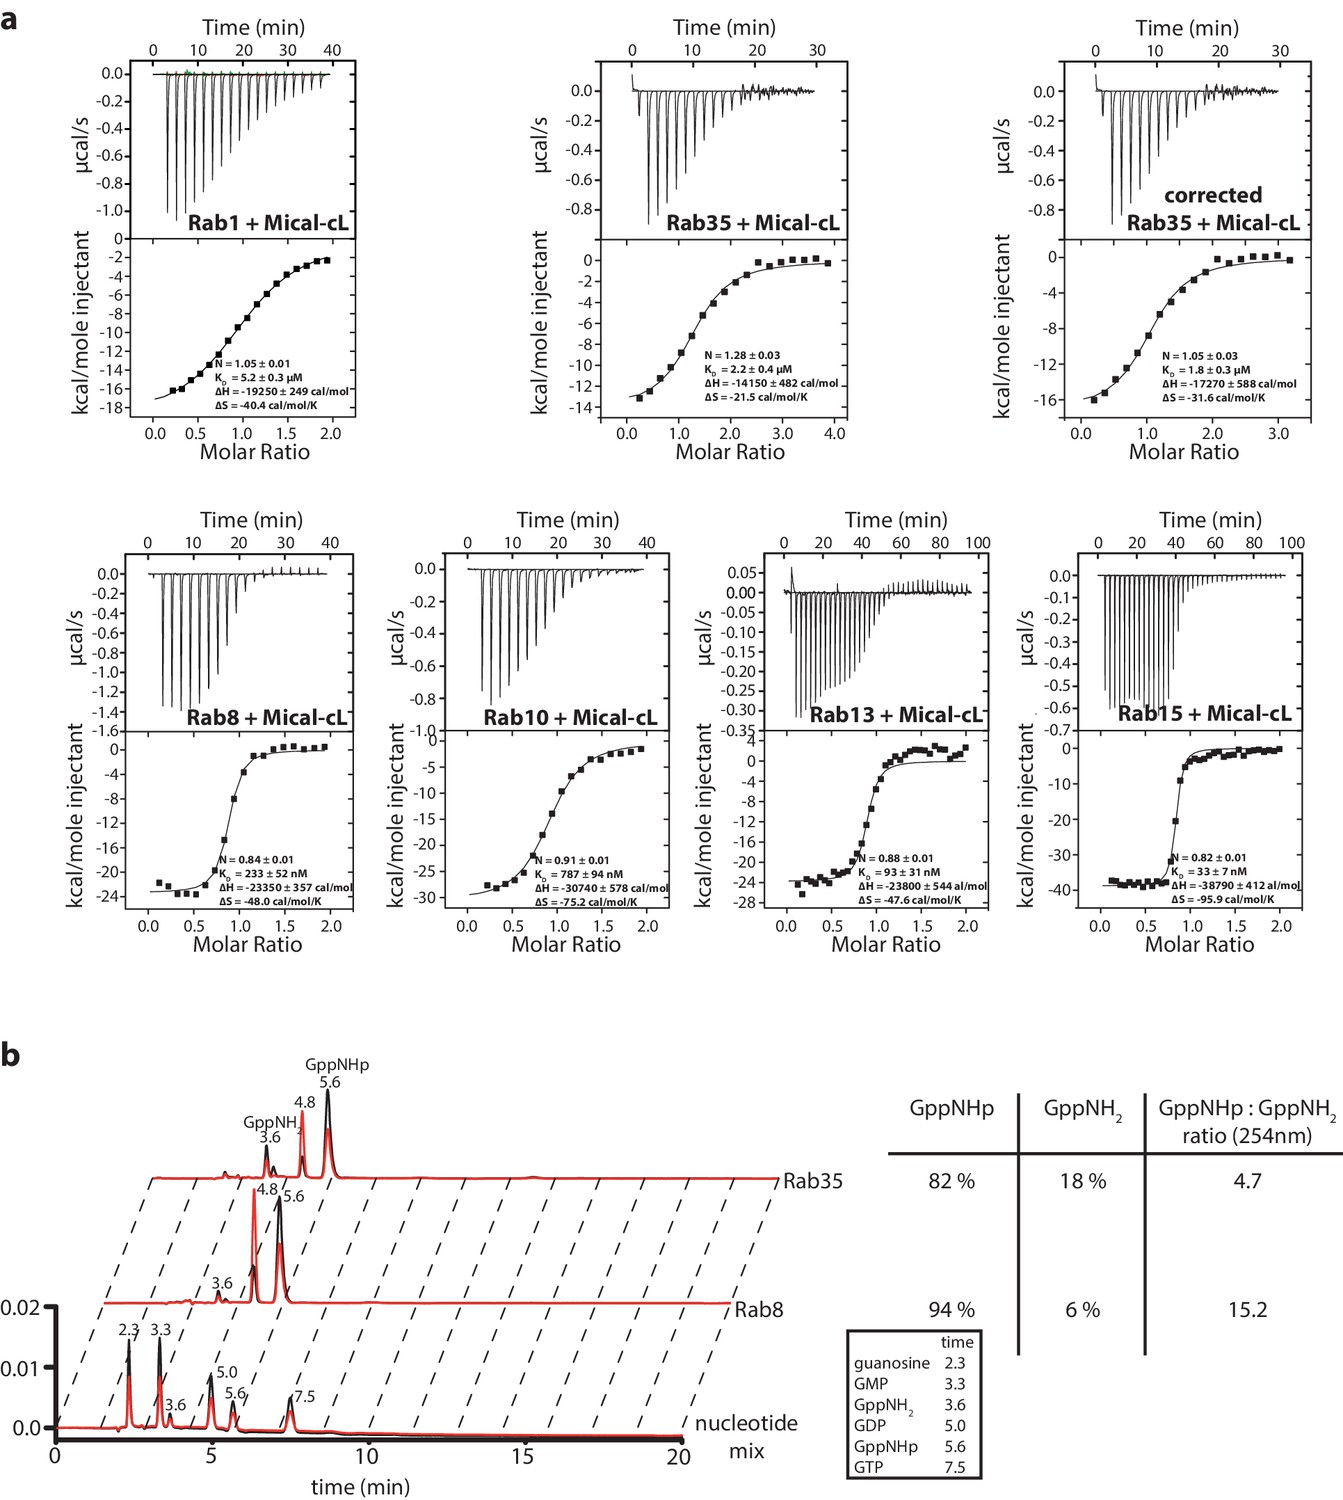
Interaction of Rab1, Rab35, Rab8, Rab10, Rab13 and Rab15 with Mical-cL.
(a) The ITC data nicely show the relatively weak affinity of Rab1 towards Mical-cL (KD = 5.2 µM) compared to Rab8 (KD = 233 nM), Rab10 (KD = 787 nM), Rab13 (KD = 93 nM) and Rab15 (KD = 33 nM). Rab35 (sometimes also referred to as Rab1c) has an intermediate affinity for Mical-cL (KD = 1.8 µM). Since preparative loading of Rab35 with GppNHp (see below) was not successful, the concentration of the Rab35 protein fraction in the active state was deduced from HPLC analysis (see below) and the ITC data was corrected accordingly. (b) Comparison of the nucleotide status of Rab8 and Rab35 by HPLC analysis (black trace – absorption at 254 nm, red trace – absorption at 280 nm). The lower lane shows the trace of a nucleotide mix consisting of guanosine, GMP, GDP, GppNHp and GTP and a small impurity of GppNH2 as a reference, the retention times (in minutes) for each nucleotide are shown above the peak and in the table on the right. Whereas Rab8 could be preparatively loaded with GppNHp and analysis showed approximately 94% bound GppNHp, Rab35 was only 82% GppNHp-bound and the trace shows a major impurity of GppNH2 (18%). For this reason, the Rab35 protein concentration used in the ITC data in (a) was corrected for this.
Figure 2—figure supplement 3
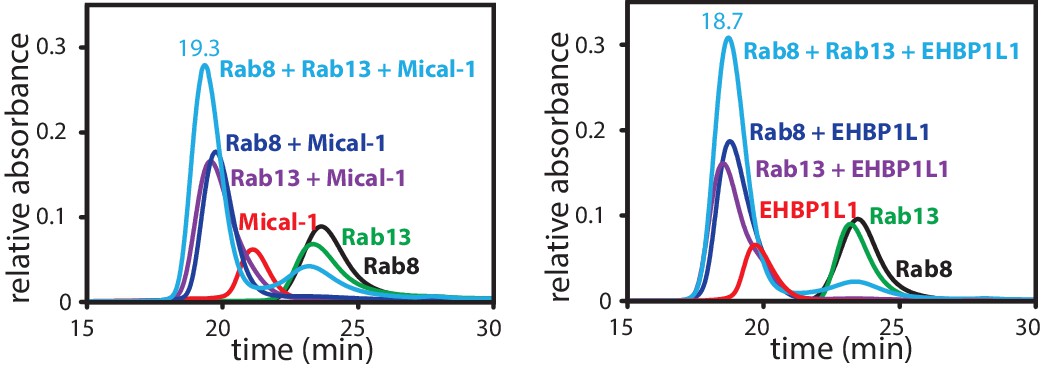
Formation of a ternary complex between Rab8, Rab13 and the RBD of Mical1 or EHBP1L1.
Rab8:GppNHp (130 µM, black), Rab13:GppNHp (130 µM, green) the different bMERB domains (112.5 µM, red) and the mixture of both (130 µM Rab + 112.5 µM RBD; dark blue for Rab8 and magenta for Rab13 in complex with the RBD) were subjected to analytical size exclusion chromatography (aSEC) and tested for complex formation between the Rabs and the RBDs. Additionally, the proteins were mixed in a ratio of 130 µM Rab8, 130 µM Rab13 and 112.5 µM RBD (light blue), clearly indicating that a 1:1:1 complex can be formed with 2 different Rab proteins bound to the respective RBDs.
Figure 3
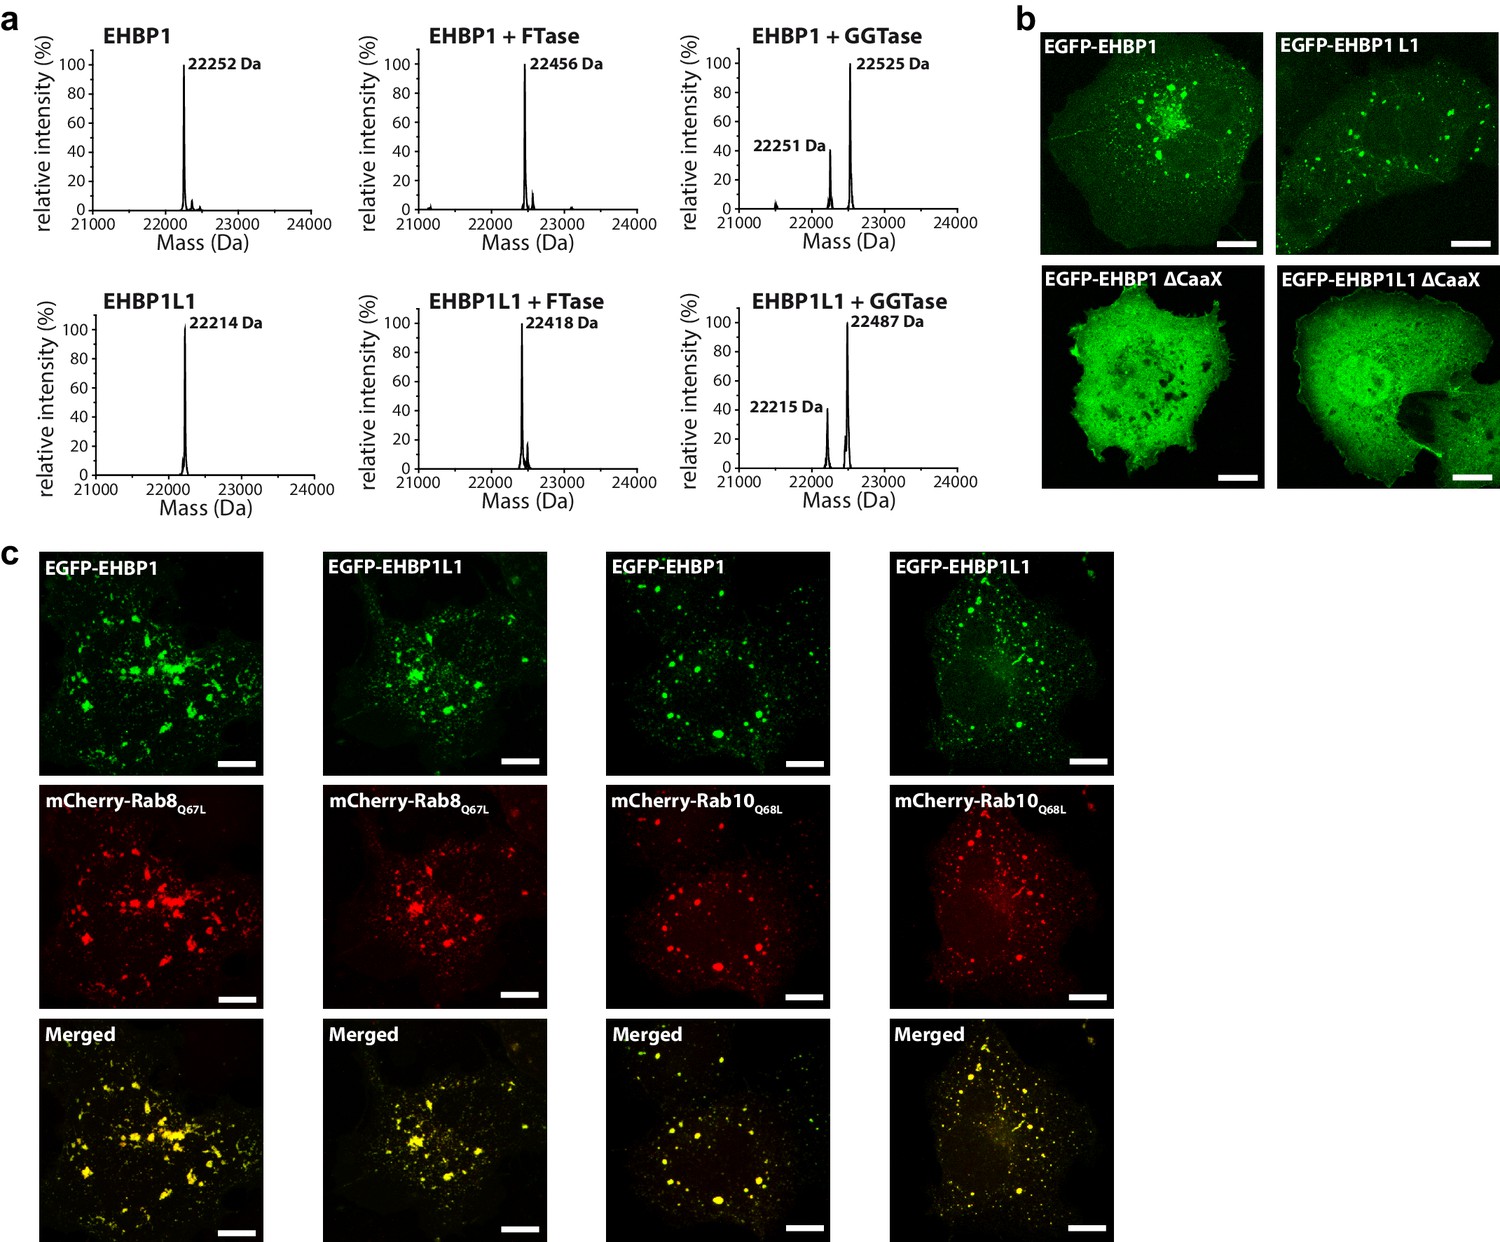
Prenylated EHBP1 and EHBP1L1 colocalize with Rab8 and Rab10.
(a) EHBP1 and EHBP1L1 can be prenylated in vitro as shown by mass spectrometry. After incubation of the purified proteins including the CaaX-motifs (theoretical masses of the purified proteins: 22253.3 Da (EHBP1); 22214.0 Da (EHBP1L1); left panel) with Farnesytransferase (FTase, middle panel) or Geranylgeranyltransferase (GGTase, right panel) farnesylation/geranylgeranylation lead to an increase in mass of 205.4/272.5 Da, respectively. Note that farnesylation, in contrast to geranylgeranylation, appears to be more efficient under similar conditions and goes to completion. This is in agreement with the sequence of the CaaX-motifs in both proteins containing a Gln/Ser at their C-terminus which has been shown to favor farnesylation. (b) Whereas the constructs containing the bMERB domain and the CaaX-motif (EHBP11047-1231, EHBP1L11340-1523) localize to intracellular structures resembling endosomes, deletion of the CaaX-motif (∆CaaX) leads to a cytosolic distribution for both EHBP1 and EHBP1L1 (Scale bars: 10 µm). (c) Both EGFP-EHBP11047-1231 and EGFP-EHBP1L11340-1523 (upper panel) show strong colocalisation with mCherry-Rab8Q67L and mCherry-Rab10Q68L (middle panel) as indicated in the merged images (lower panel). The localization pattern resembles that of endosomes (Scale bars: 10 µm).
Figure 4
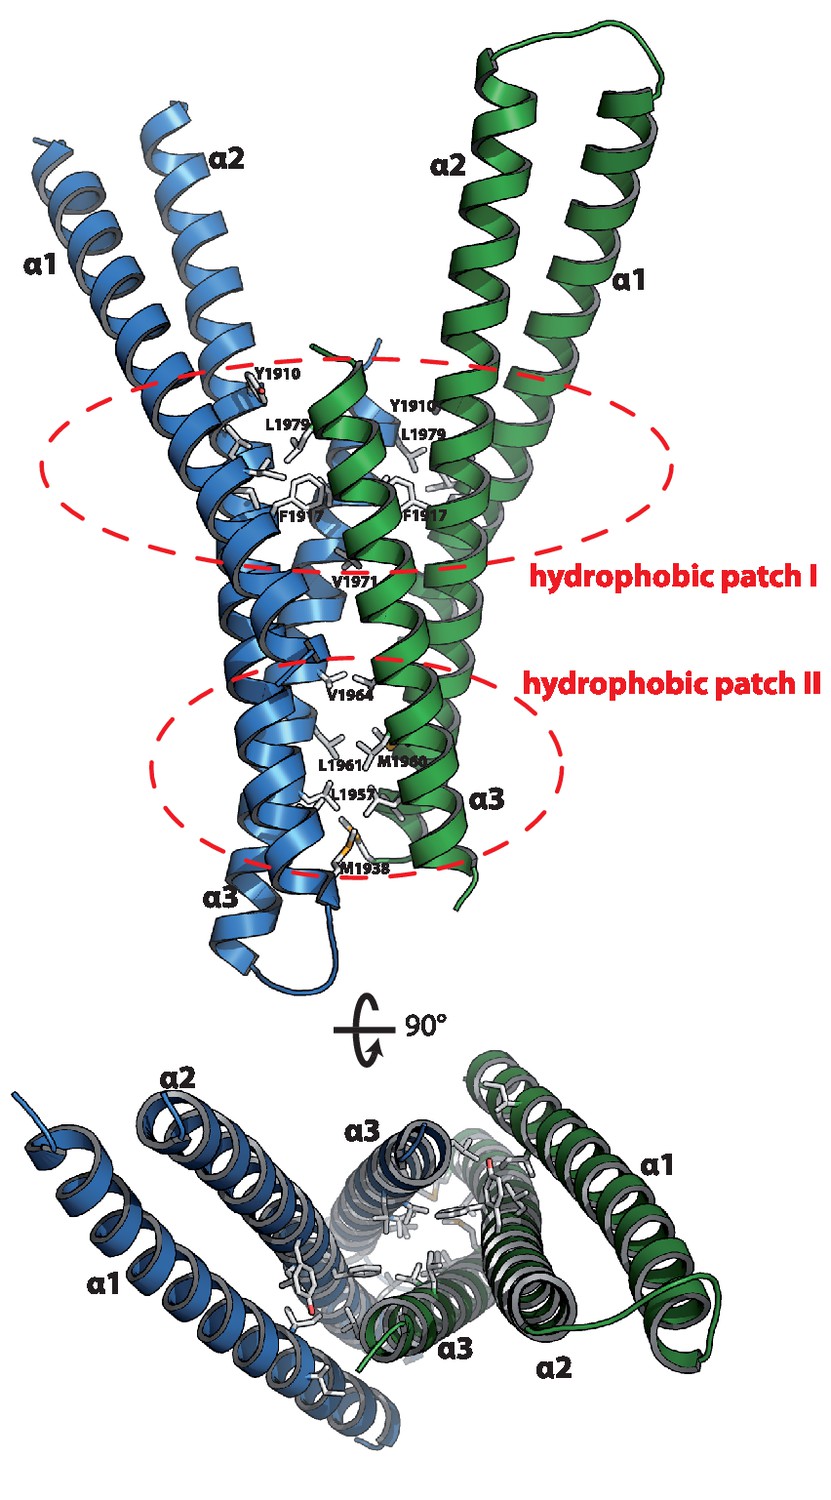
Structure of the Rab binding domain of Mical-3.
Mical-3 folds into three α-helices, the central α-helix 2 and α-helices 1 and 3 folding back on the central helix. The dimer observed in the asymmetric unit is formed mostly by hydrophobic interactions involving the same hydrophobic patches in both monomers, and α-helices 2 and 3 from each monomer form a central 4-stranded coiled-coil.
Figure 5 with 2 supplements
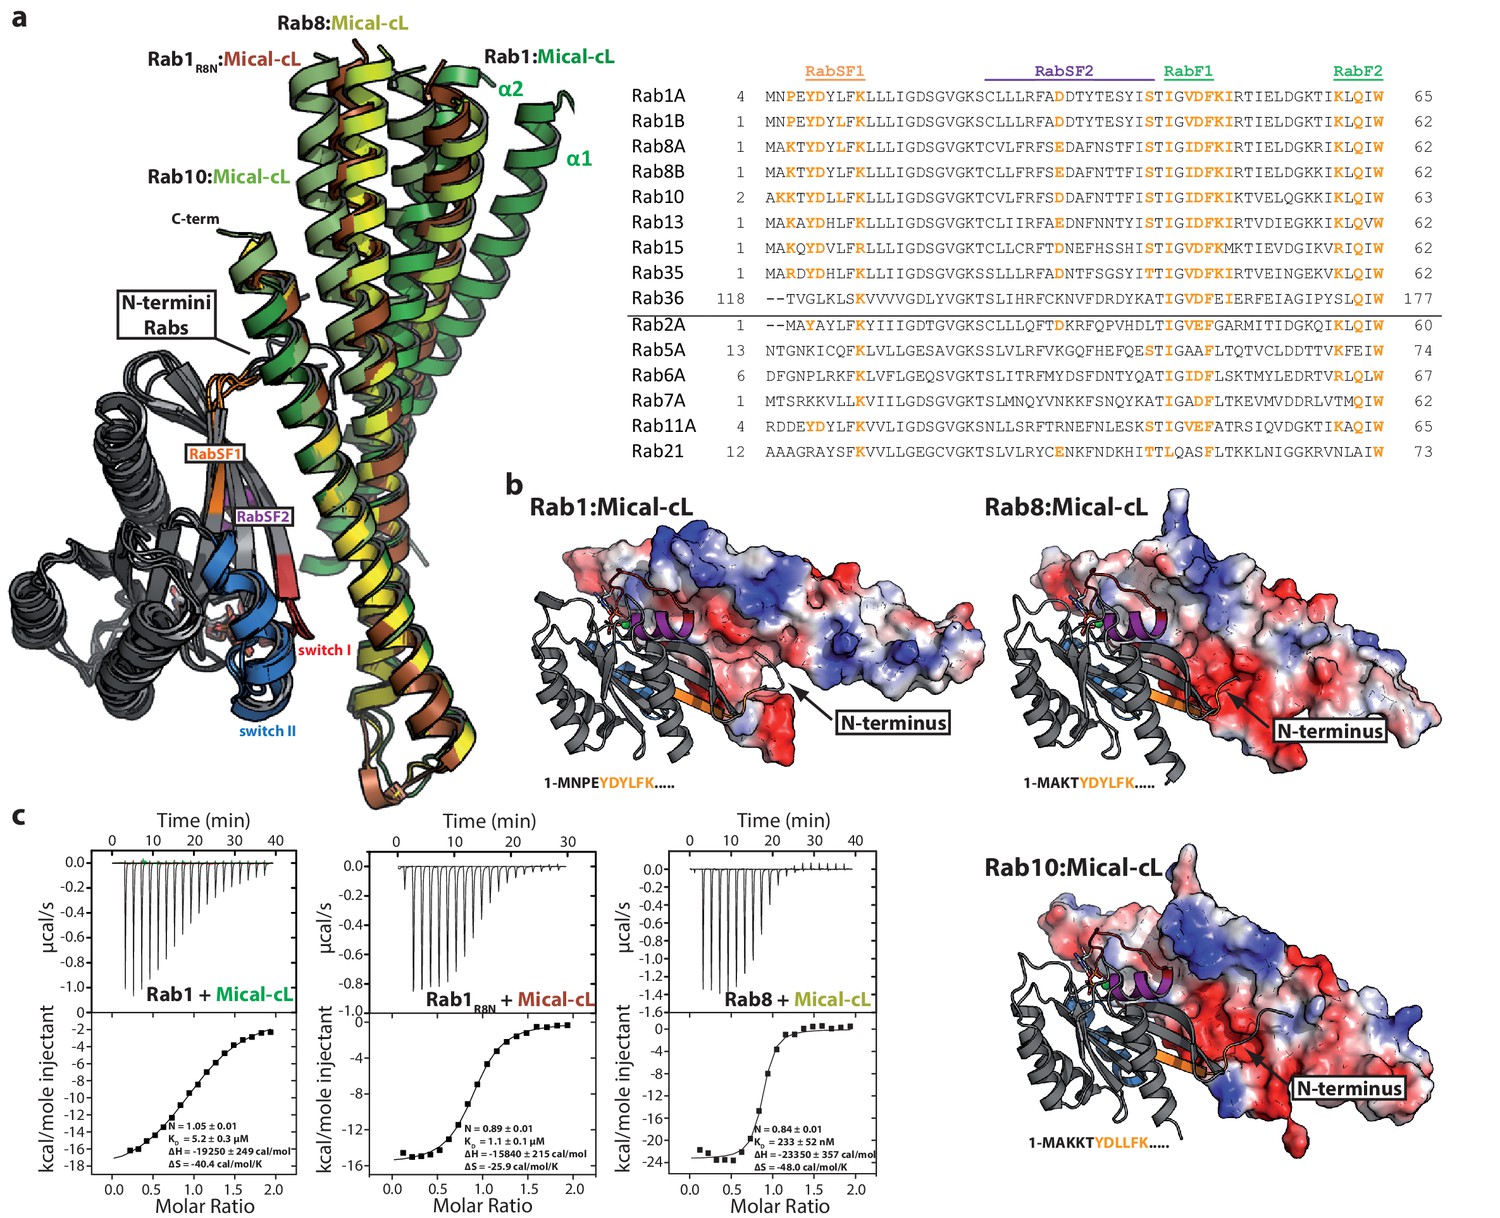
The specificity of Rab proteins binding to bMERB domains.
(a) A superposition of the complex structures of Rab1:Mical-cL, Rab8:Mical-cL, Rab10:Mical-cL and Rab1R8N:Mical-cL shows that Rabs bind Micals via their N-terminus (including RabSF1), RabSF2 as well as the switch regions (Rabs are shown in cartoon representation, switch I – red, switch II – blue, RabSF1 – orange, RabSF2, magenta; Micals are shown in cartoon representation and colored in dark green (Mical-cL interacting with Rab1), yellow (Mical-cL interacting with Rab8), light green (Mical-cL interacting with Rab10) or brown (Mical-cL interacting with Rab1R8N). The sequence alignments of different Rab proteins clearly shows that the interacting residues of Rab proteins with Micals (red residues) are highly conserved (orange residues) in Rab1 and Rab8 family members (Rab1a, Rab1b, Rab35, Rab8, Rab10, Rab13, Rab15), but not in other Rabs (below the black line). (b) In all structures of Rab proteins in complex with Mical-cL, the N-termini of the Rab proteins point towards a negatively charged patch of Mical-cL (Rabs are shown in cartoon representation as above; the surface of Mical-cL is colored by charge, red – negative charge, blue – positive charge). The sequence of the N-terminal residues of each Rab protein is shown below the corresponding structure: Whereas Rab1 contains a negatively charged glutamate at position 4, Rab8 and Rab10 contain one or two lysine residues at position 3 or at position 3 and 4, respectively. Consistently, the negatively charged N-terminus of Rab1 seems to repel α-helices 1 and 2 of Mical-cL and they adopt a conformation slightly further away from Rab1 compared to Rab8 and Rab10 (also see (a)). However, after mutating the 4 N-terminal residues of Rab1 to the corresponding sequence of Rab8 (the resulting chimera is called Rab1R8N), the structure of Rab1R8N:Mical-cL shows a similar conformation of α-helices 1 and 2 as in the structure of Rab8:Mical-cL. (c) Consistently, ITC measurements show that the affinity of binding increases approximately five-fold after mutating the N-terminal residues (Rab1:Mical-cL: KD = 5.2 µM; Rab1R8N:Mical-cL: KD = 1.1 µM; Rab8:Mical-cL: KD = 0.23 µM).
Figure 5—figure supplement 1
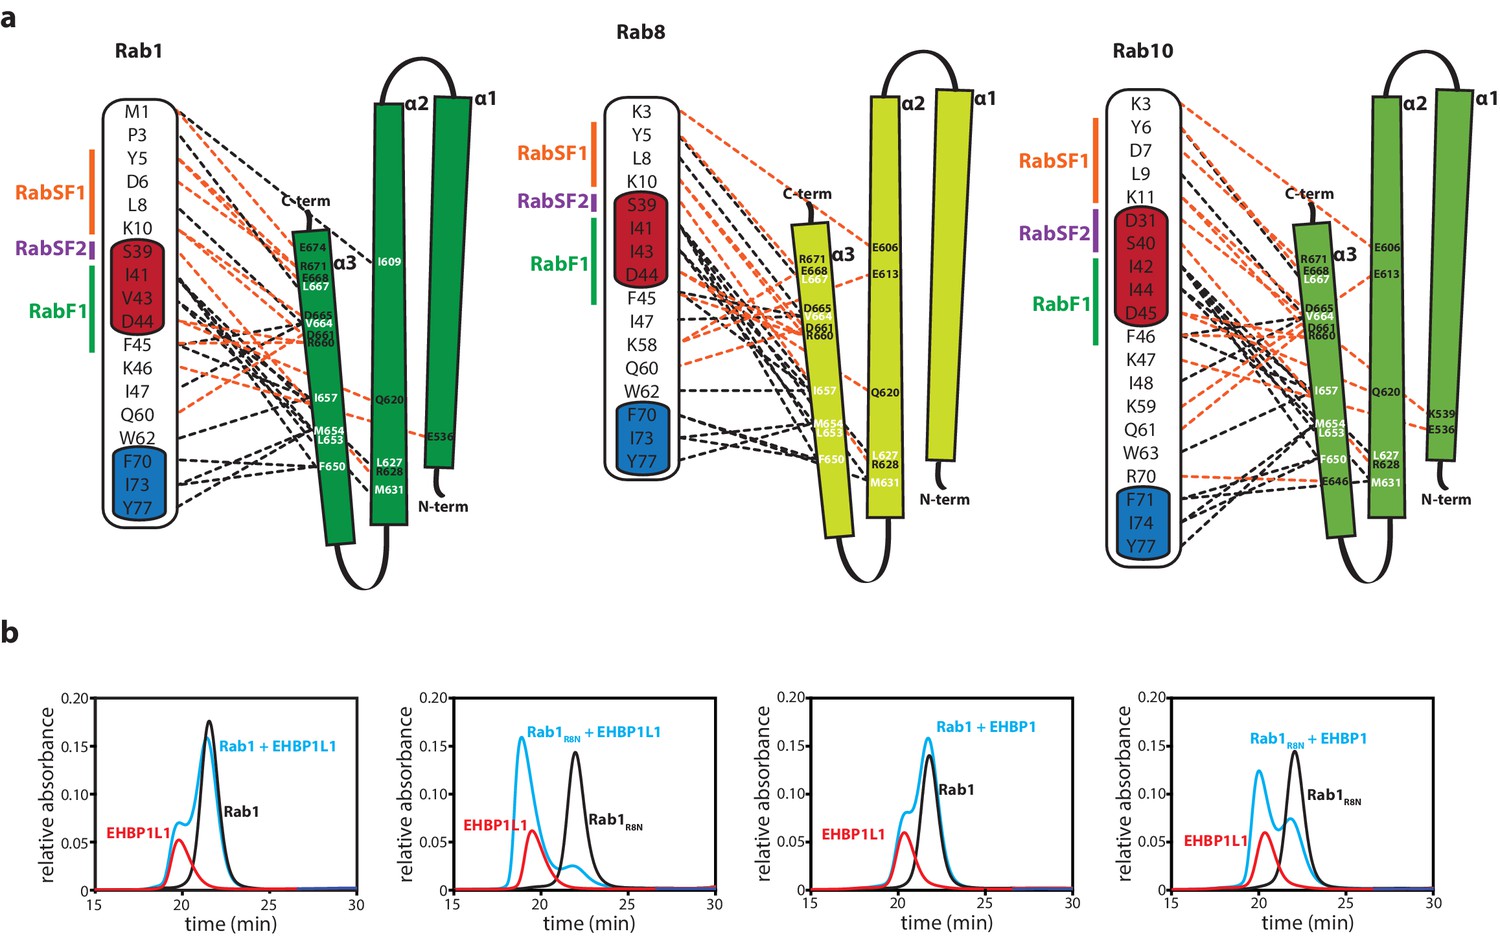
The N-termini of Rabs determine the specificity towards bMERB domains.
(a) Schematic presentation of the interactions between Rabs and Mical-cL (Switch I and II are shown in red and blue respectively; RabSF1, RabSF2 and RabF1 are shown in orange, magenta and green; Hydrophobic interactions are indicated by black dashed lines, ionic interactions and h-bonds are indicated by orange dashed lines). (b) Mutating the four N-terminal residues of Rab1 (1-MNPE…) to the sequence corresponding to Rab8 (1-MAKT…) leads to increased binding of EHBPs: Whereas Rab1 does not form a complex with EHBP1L1 (left) and EHBP1 (second from the right), the chimeric protein Rab1R8N forms a complex with both (EHBP1L1, second from the left; EHBP1, right) as assessed by aSEC.
Figure 5—figure supplement 2
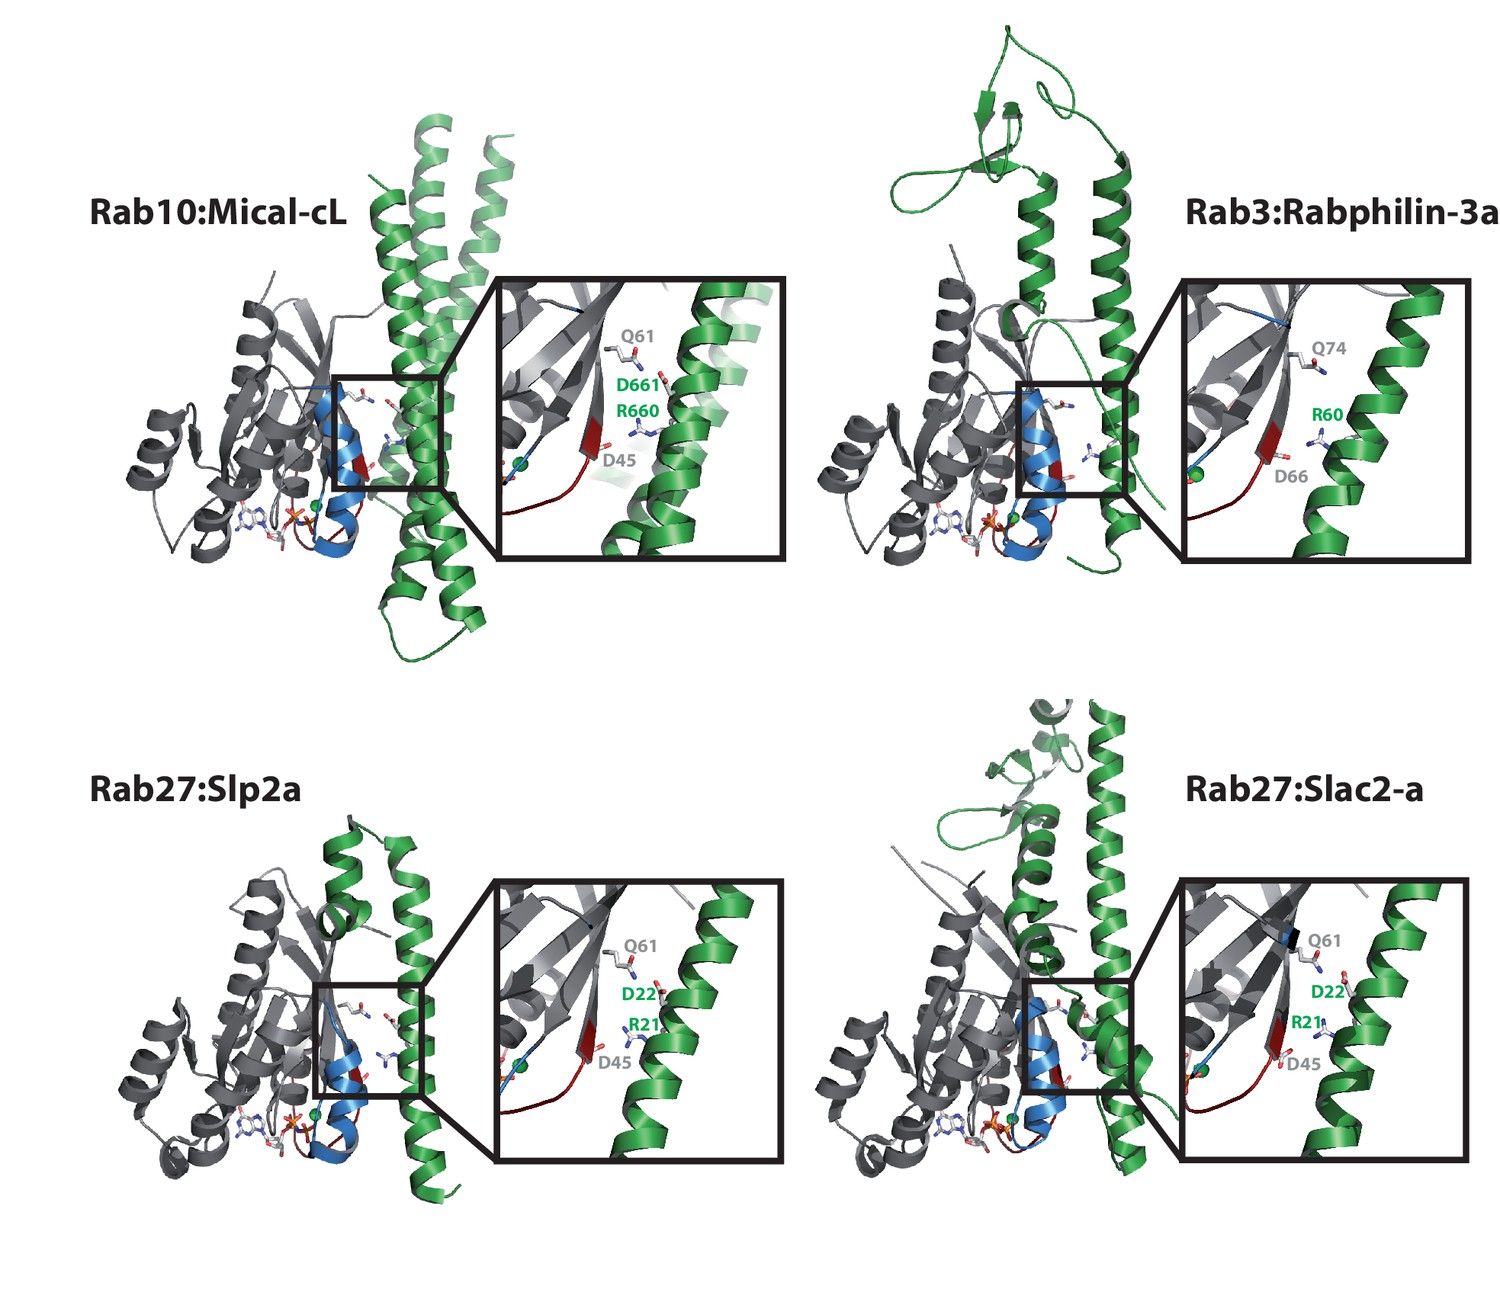
Comparison with other Rab:effector structures.
The main interacting helix (α3) in the structure of Rab10:Mical-cL adopts a very similar relative position as the main interacting helices of the effector proteins in the structures of Rab3:Rabphilin-3a (pdb 1ZBD) (Ostermeier and Brunger, 1999), Rab27:Slp2a (pdb 3BC1) (Chavas et al., 2008) and Rab27:Slac2-a (pdb 2ZET) (Kukimoto-Niino et al., 2008). Furthermore, a basic Arg and an acidic Asp are conserved in all structures (in Rab3:Rabphilin-3a, only the Arg is conserved) and contact the residues corresponding to Asp45 and Gln61 in Rab10.
Figure 6 with 3 supplements
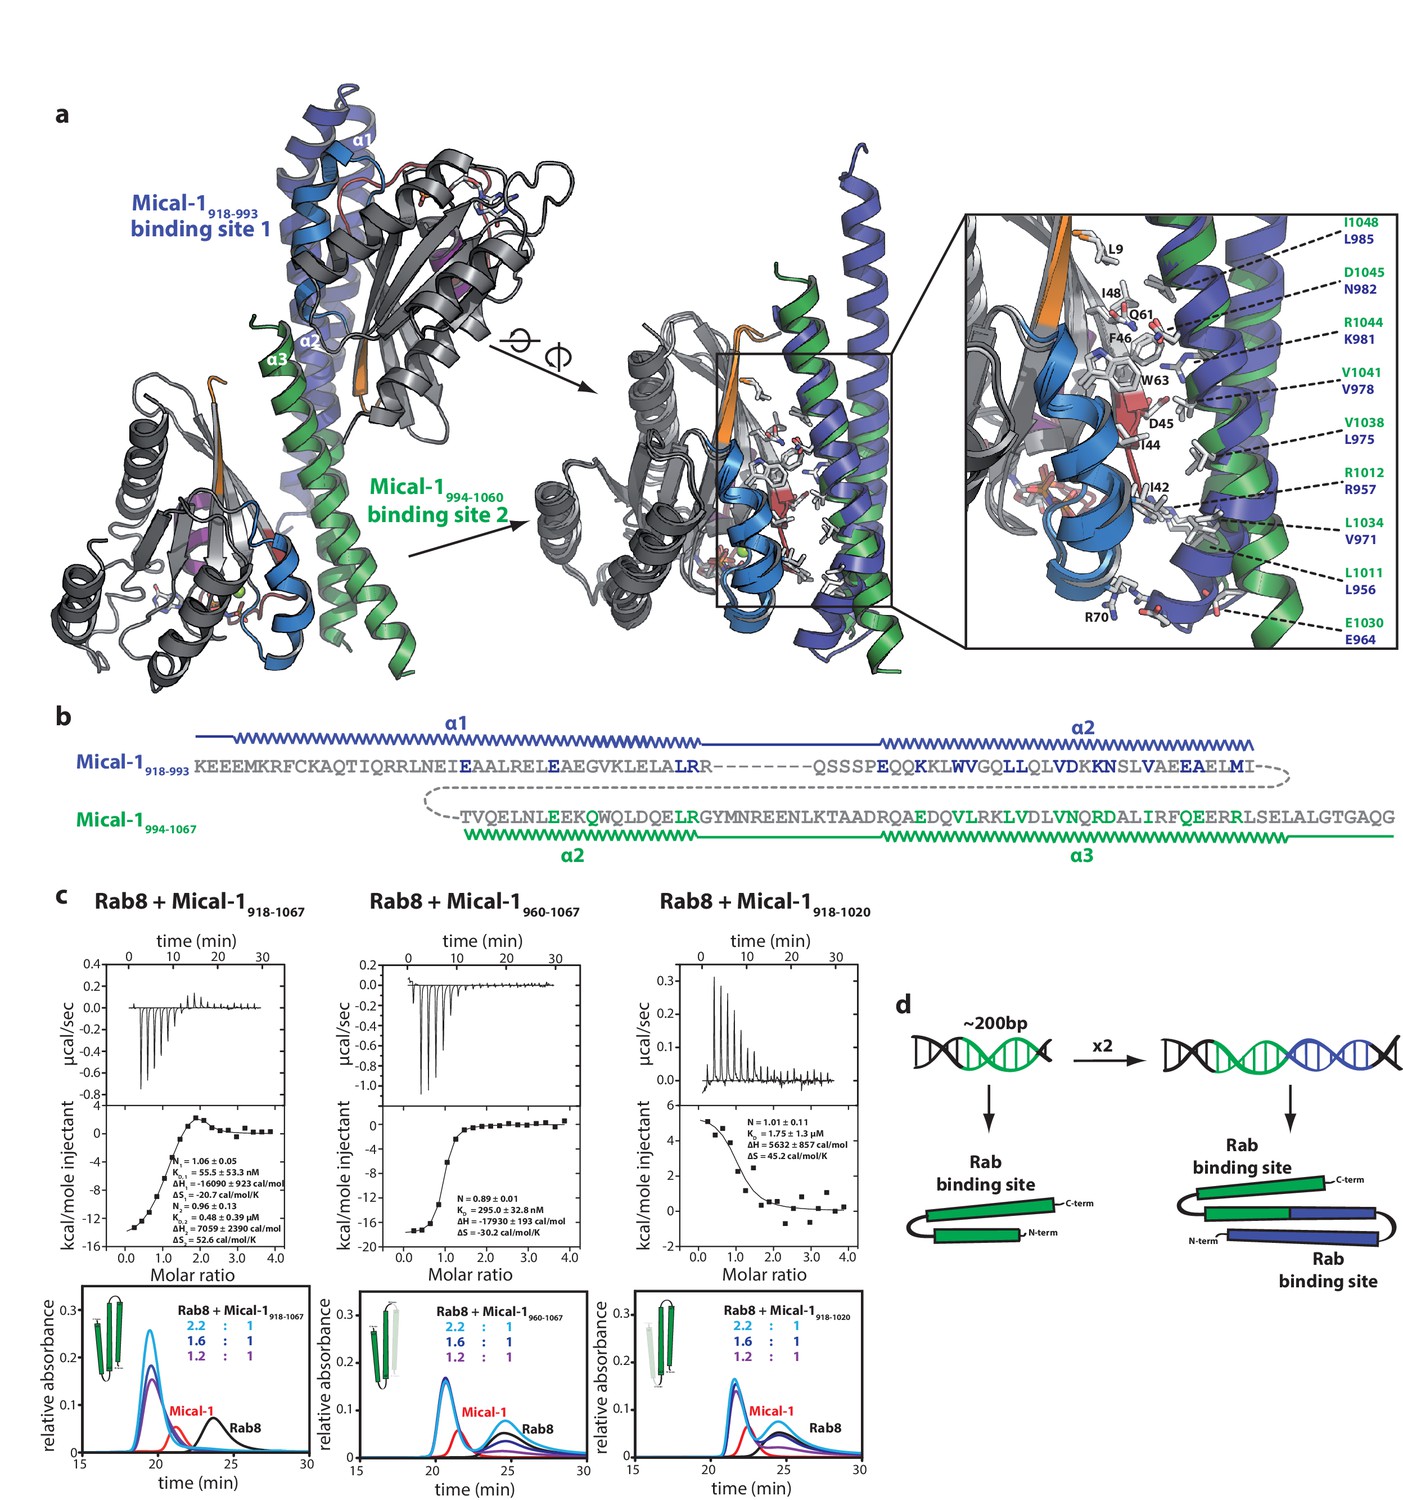
The two Rab binding sites are highly similar.
(a) The structure of Mical-1 in complex with Rab10 shows two molecules of Rab10 bound to Mical-1 at different sites. Whereas one Rab protein binds to α-helix 1 and the first half of α-helix 2 (Mical-1918-991, binding site 1, blue), the second molecule of Rab10 binds the second half of α-helix 2 and α-helix 3 (Mical-1994-1060, binding site 2, green). Upon superimposition of both binding sites, the strong similarity becomes obvious and the helices from both binding sites adopt very similar positions. Furthermore, the interactions are highly similar in both cases as can be seen in the close-up view on the right (similar Rab-interacting residues within binding site 1 and 2 are shown in blue and green, respectively). (b) The strong conservation of interacting residues within both halves of the Mical-1 bMERB domain can also be seen in the sequence alignment of the N- and C-terminal halves. Additionally, the alignment shows that α-helix 1 and the first half of α-helix 2 (binding site 1) correspond to the second half of α-helix 2 and α-helix 3 (binding site 2), respectively (the secondary structure is indicated above and below the corresponding sequences, interacting and conserved residues within binding site 1 and 2 are highlighted in blue and green). (c) Whereas the whole bMERB domain of Mical-1 can bind two Rab molecules (left), deletion of either α-helix 1 (middle) or α-helix 3 (right) impairs binding to binding site 1 or 2, respectively. This effect could be shown both by aSEC and ITC (note the enthalpy-driven high-affinity binding site 2 and the entropy-driven lower-affinity binding site 1 that can be clearly distinguished, a schematic drawing of the different constructs is shown within the aSEC graphs). (d) Based on the observations made above, we propose that both binding sites must have evolved from a common ancestor by gene duplication of a 200 bp DNA fragment coding for the original gene product, a single α-hairpin. The fusion lead to the arrangement of the α-helices observed in bMERB domains, with the central α-helix 2 as a continuous connecting helix of both repeats, similar to the architecture of spectrin repeats.
Figure 6—figure supplement 1
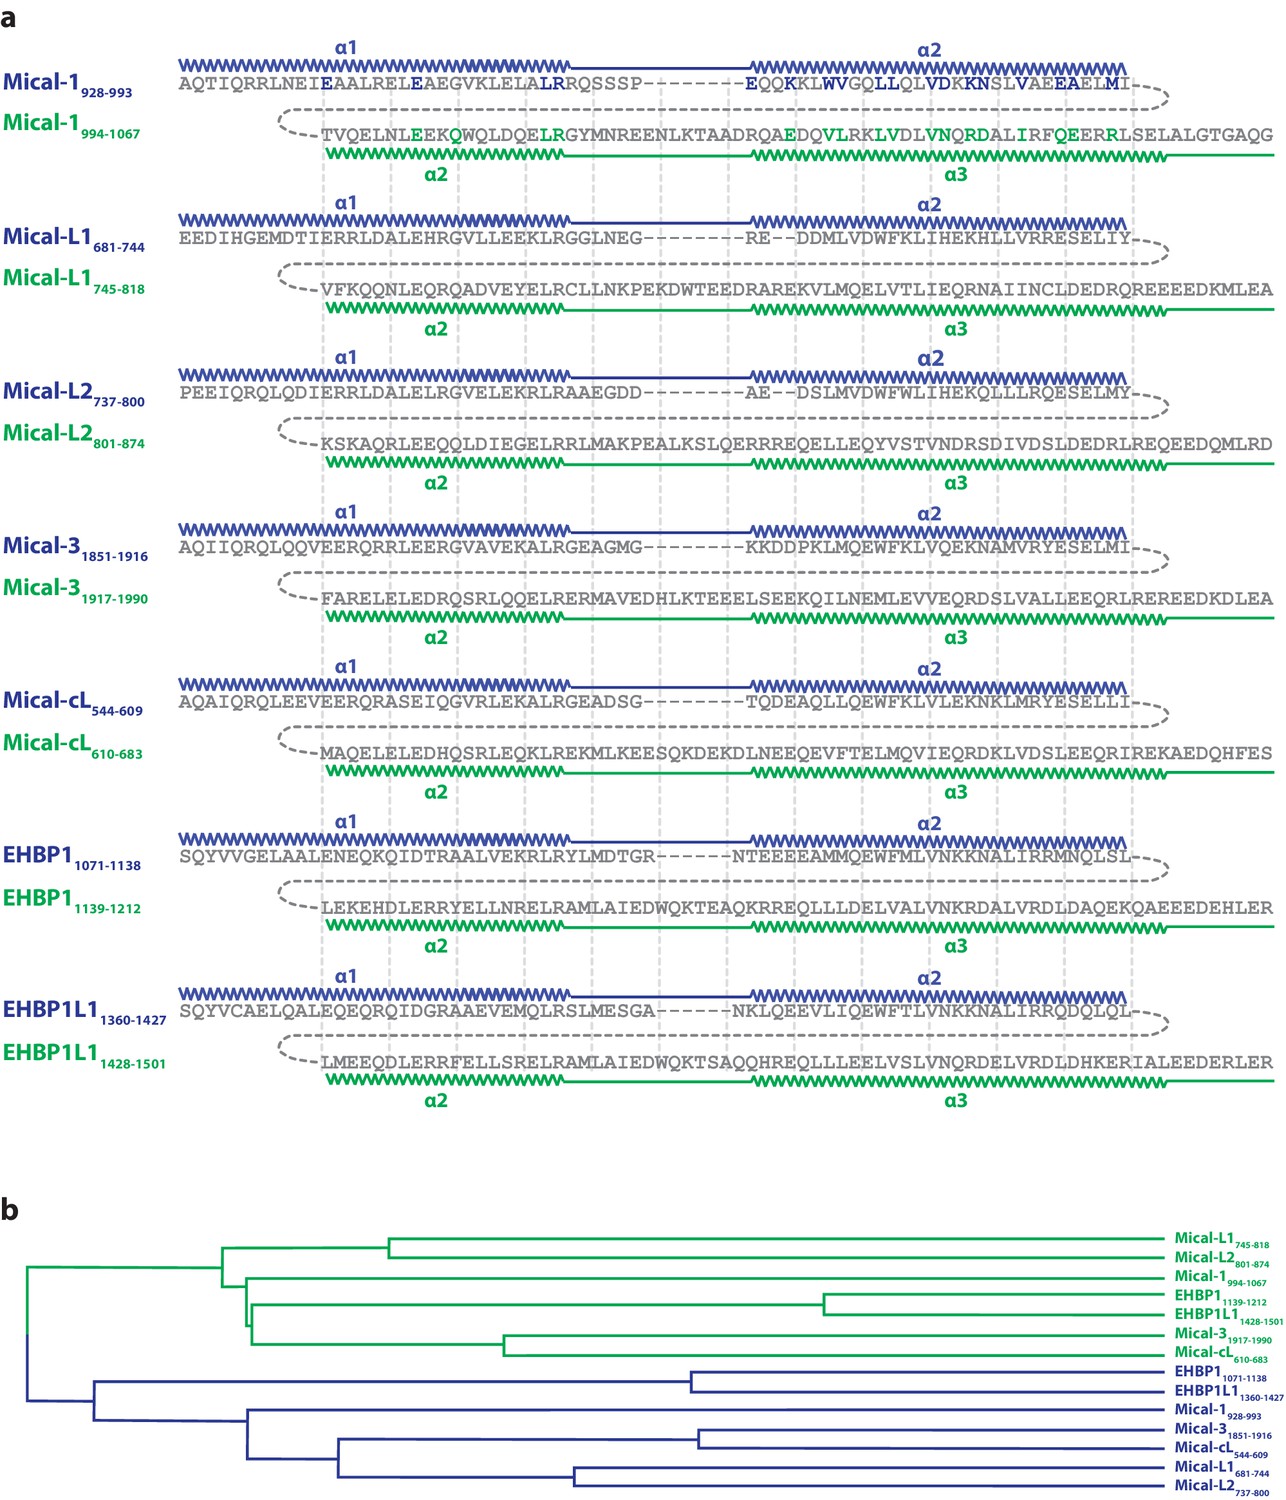
Evolution of the second binding site.
(a) Sequence alignments of the N- (blue) and C-terminal (green) halves of human bMERB domains made with Clustal Omega (Sievers et al., 2011). The residues in Mical-1 involved in binding Rab10 are shown in bold letters and the corresponding colors blue and green for binding site 1 and 2, respectively. In order to simplify comparison of the sequences, vertical lines are shown. The approximate positions of α-helices 1, 2 and 3 are also indicated. (b) Phylogenetic tree of the aligned sequences (the N- and C-terminal halves are again colored in blue and green, respectively). Uniprot accession IDs are Q8TDZ2 (Mical-1), Q8N3F8 (Mical-L1), Q8IY33 (Mical-L2), Q7RTP6 (Mical-3), Q6ZW33 (Mical-cL), Q8NDI1 (EHBP1) and Q8N3D4 (EHBP1L1).
Figure 6—figure supplement 2
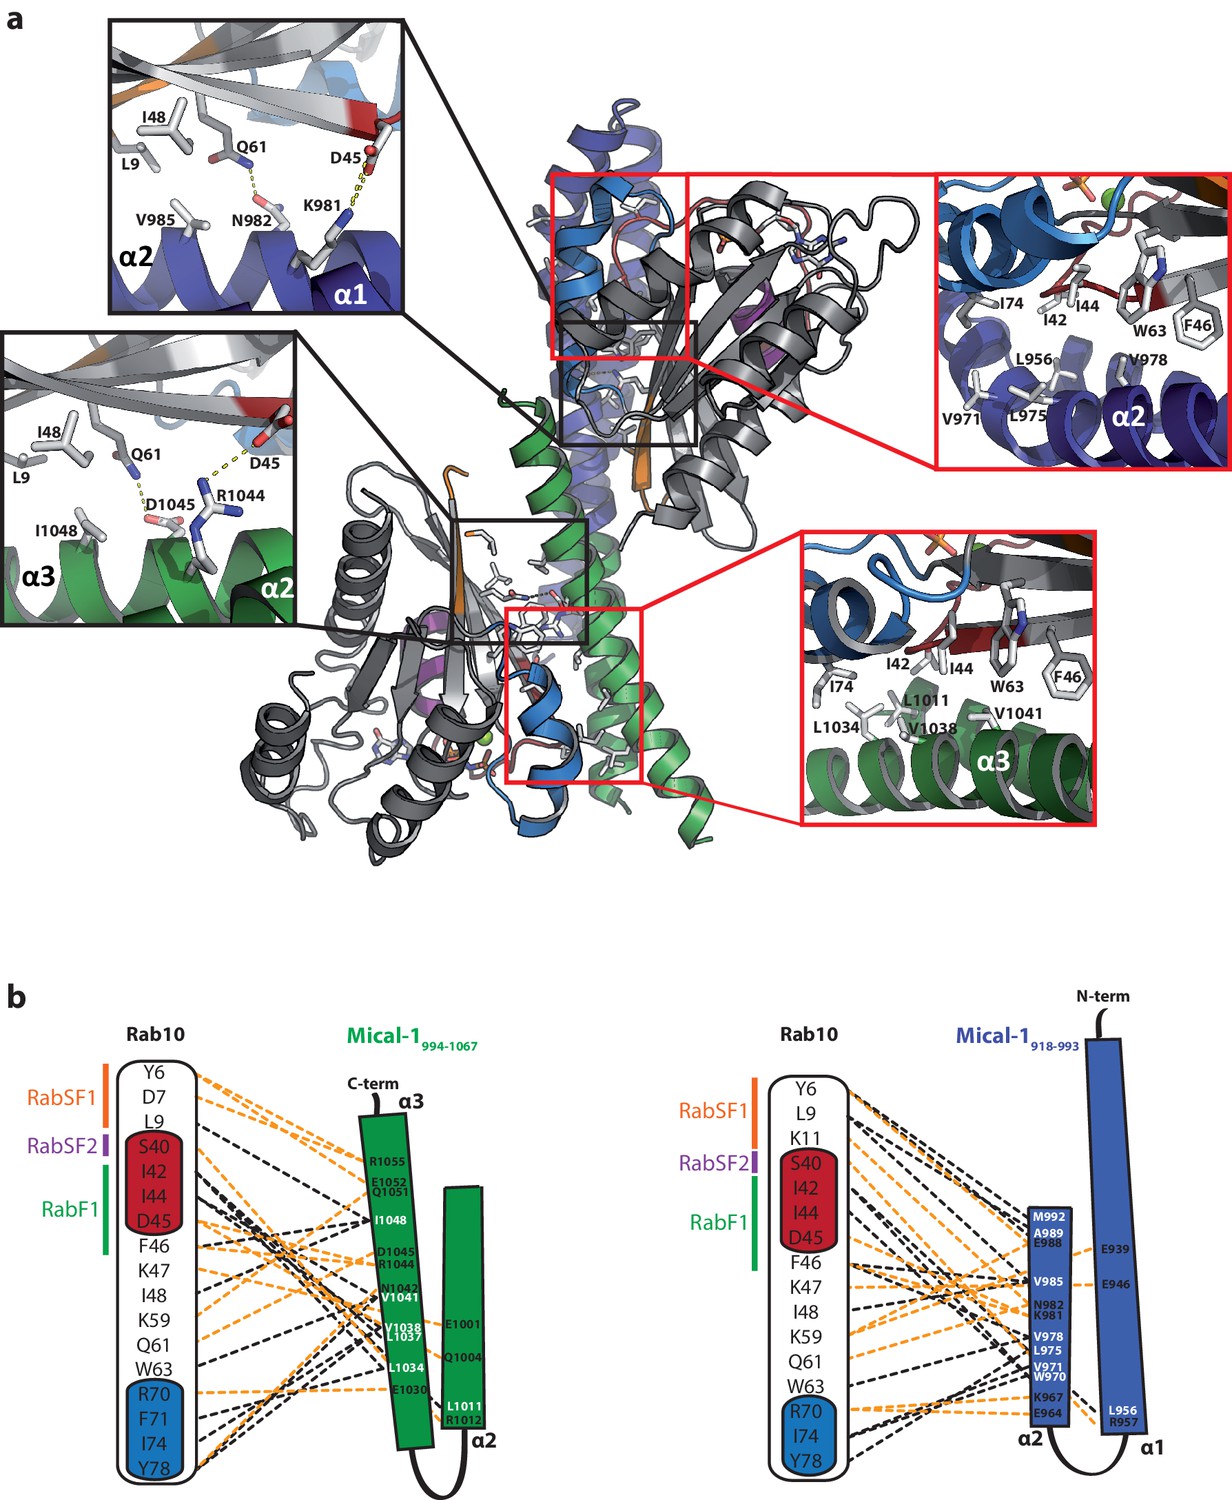
Structural comparison of the individual Rab binding sites in Mical-1.
(a) Cartoon representation of the Rab10:Mical-1:Rab10 complex (centre) and selected close-up views (left and right). Left: Whereas Lys981 and Asn982 within the binding site (BS) 1 contact Asp45 and Gln61 in Rab10, the same residues in the other Rab10 molecule are contacted by Arg1044 and Asp1045 from BS2. Right: The hydrophobic residues Leu956BS1/Leu1011BS2, Val971BS1/Leu1034BS2, Leu975BS1/Val1038BS2 and Val978BS1/Val1041BS2 contacting Ile42Rab10, Ile44Rab10, Phe46Rab10, Trp63Rab10 and Ile74Rab10 (BS1, BS2 and Rab10 denote residues within binding site 1, binding site 2 or Rab10, respectively). (b) Schematic presentation of contacts between Rab10 and BS2 (left) or BS1 (right). Hydrophobic interactions are indicated by black dashed lines, ionic interactions and h-bonds are indicated by orange dashed lines.
Figure 6—figure supplement 3
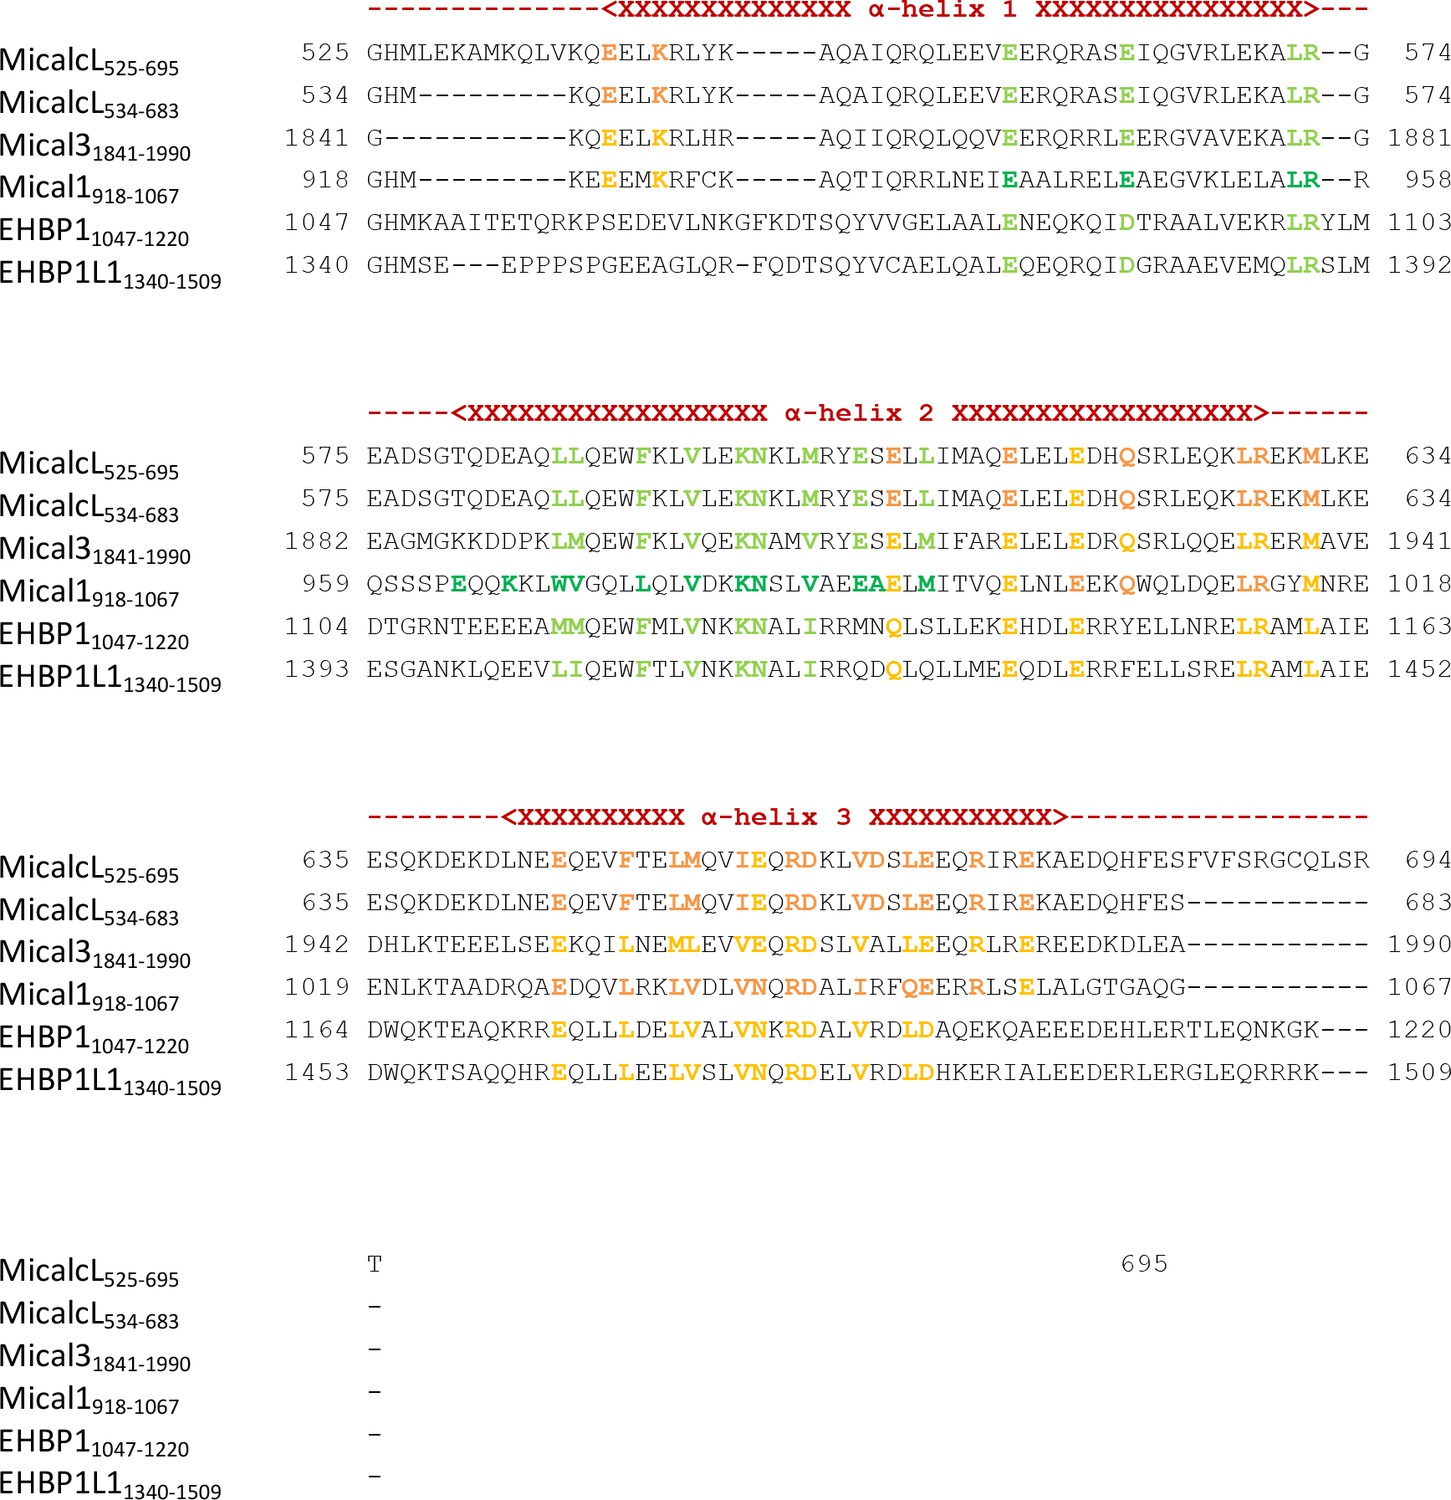
Sequence alignment of the bMERB domains examined in this work.
Residues known from the structures of Rab:bMERB complexes to make contacts with Rab proteins are highlighted in dark green (binding site 1) or dark orange (binding site 2). Conserved residues in other bMERB domains are colored light green or light orange, respectively. The approximate position of α-helices 1, 2 and 3 are indicated above the sequences. Uniprot accession IDs are Q8TDZ2 (Mical-1), Q8N3F8 (Mical-L1), Q8IY33 (Mical-L2), Q7RTP6 (Mical-3), Q6ZW33 (Mical-cL), Q8NDI1 (EHBP1) and Q8N3D4 (EHBP1L1).
Tables
Table 1
Systematic analysis of interactions between Rab proteins and the bMERB domains of different proteins. Binding was systematically tested by analytical size exclusion chromatography (+ indicates binding in these experiments, − indicates that no complex formation was observed) and affinities were determined by ITC.
| Mical-1 | Mical-3 | Mical-cL | EHBP1 | EHBP1L1 | |
|---|---|---|---|---|---|
| Rab1 KD | + 2.2 µM | + 2.6 µM | + 5.2 µM | − > 10 µM | − > 10 µM |
| Rab35 KD | n.d. | n.d | + 1.8 µM | n.d | n.d |
| Rab8 KD,1 KD,2 | + 55.5 nM 480 nM | + 27.9 nM 4.4 µM | + 253 nM | + 397 nM | + 159 nM 159 nM |
| Rab10 KD | + n.d. | + n.d. | + 790 nM | + n.d. | + n.d. |
| Rab13 KD | + n.d. | + n.d. | + 94 nM | + n.d. | + n.d. |
| Rab15 KD | + n.d. | + n.d. | + 33 nM | + n.d. | + n.d. |
Table 2
Data-collection and processing statistics (values in parentheses are for the outer shell).
| SeMet Mical-31841-19902† | Rab1:Mical-cL534-683 | Rab8:Mical-cL534-683 | |
|---|---|---|---|
| Data collection* | |||
| X-Ray Source | X10SA at SLS | X10SA at SLS | X10SA at SLS |
| Wavelength (Å) | 0.978956 | 0.99992 | 1.00009 |
| Resolution range (Å) | 47.8–2.7 (2.8–2.7) | 45.8–2.3 (2.4–2.3) | 46.0–2.85 (2.95–2.85) |
| Space group | P 21 21 21 | I 2 2 2 | C 2 2 21 |
| Unit cell a, b, c (Å) α, β, γ (°) | 51.9, 78.8, 95.6 90.0, 90.0, 90.0 | 61.75, 129.38, 129.85 90.0, 90.0, 90.0 | 62.4, 122.4, 139.15 90.0, 90.0, 90.0 |
| No. of reflections Total Unique | 272679 (28873) 20544 (2119) | 308332 (36902) 23530 (2760) | 162311 (16579) 12810 (1224) |
| Multiplicity | 13.3 | 13.1 | 12.7 |
| Completeness | 99.1 (98.5) | 100.00 (100.00) | 99.9 (100.0) |
| Rmerge (%) | 13.8 (114.6) | 10.5 (74.3) | 8.9 (77.6) |
| Rmeas (%) | 14.4 (119.1) | 10.9 (77.2) | 9.2 (80.6) |
| I/σ(I) | 16.8 (3.6) | 16.27 (3.89) | 16.45 (3.19) |
| f’ / f’’ | -7.29 / 3.84 | - | - |
| Refinement | |||
| Resolution range (Å) | 47.8–2.7 (2.77–2.7) | 45.8–2.3 (2.4–2.3) | 46.0–2.85 (3.07–2.85) |
| No. of reflections (work set) | 10553 | 23521 | 12808 |
| Rwork (%) | 25.1 (20.5) | 17.9 (26.9) | 23.7 (31.1) |
| Rfree (%) | 28.2 (36.2) | 20.7 (29.8) | 28.8 (35.0) |
| No. of atoms Protein Ligands Water | 2095 14 - | 2552 33 27 | 2426 33 2 |
| B-factors Protein Ligands Water | 72.9 65.2 - | 76.7 49.8 73.1 | 101.2 111.2 122.6 |
| R.m.s deviations Bond length (Å) Bond angles (°) | 0.016 1.809 | 0.008 1.104 | 0.009 1.175 |
| Ramachandran plot Favored Additionally allowed Outliers | 98.8 1.2 0 | 98.4 1.6 0 | 96.1 3.3 0.7 |
| PDB entry code | 5SZG | 5SZH | 5SZI |
| Rab10:Mical-cL534-683 | Rab101-175:Mical-1918-1067 | Rab1R8N:Mical-cL534-683 | |
|---|---|---|---|
| Data collection | |||
| X-Ray Source | X10SA at SLS | X10SA at SLS | X10SA at SLS |
| Wavelength (Å) | 1.00009 | 0.99997 | 0.91908 |
| Resolution range (Å) | 48.2–2.66 (2.7–2.66) | 44.0–2.8 (2.9–2.8) | 44.8–2.8 (2.85–2.8) |
| Space group | P 21 21 2 | P 21 21 21 | C 2 2 21 |
| Unit cell a, b, c (Å) α, β, γ (°) | 153.7, 61.9, 55.6 90.0, 90.0, 90.0 | 58.4, 59.0, 198.2 90.0, 90.0, 90.0 | 62.2, 117.0, 139.4 90.0, 90.0, 90.0 |
| No. of reflections Total Unique | 187267 (6488) 15861 (676) | 222905 (21259) 17508 (1689) | 170436 (8892) 12904 (645) |
| Multiplicity | 11.8 | 12.7 | 19.2 |
| Completeness | 99.9 (100.0) | 99.6 (99.9) | 100.0 (100.0) |
| Rmerge (%) | 13.7 (158.6) | 11.8 (72.3) | 7.6 (110.6) |
| Rmeas (%) | 14.3 (167.8) | 12.3 (75.4) | 7.9 (114.9) |
| I/σ(I) | 12.2 (1.4) | 14.1 (3.3) | 22.8 (2.45) |
| f’ / f’’ | - | - | - |
| Refinement | |||
| Resolution range (Å) | 48.2–2.66 (2.83–2.66) | 44.0–2.8 (2.98–2.80) | 44.8–2.8 (3.0–2.80) |
| No. of reflections (work set) | 15857 | 17499 | 12904 |
| Rwork (%) | 22.4 (30.2) | 23.7 (29.4) | 20.8 (30.8) |
| Rfree (%) | 26.6 (36.9) | 28.8 (35.6) | 26.1 (38.4) |
| No. of atoms Protein Ligands Water | 2559 40 39 | 3676 66 4 | 2565 33 3 |
| B-factors Protein Ligands Water | 77.8 77.9 70.2 | 88.6 85.4 68.7 | 86.2 81.2 73.8 |
| R.m.s deviations Bond length (Å) Bond angles (°) | 0.004 0.756 | 0.013 1.506 | 0.010 1.178 |
| Ramachandran plot Favored Additionally allowed Outliers | 98.1 1.9 0 | 96.7 3.3 0 | 98.1 1.6 0.3 |
| PDB entry code | 5SZJ | 5LPN | 5SZK |
-
*All data sets were collected from one single crystal on beamline X10SA of the Swiss Light Source (Paul Scherrer Institute, Villigen, Switzerland)
-
†Data collections statistics for SAD data refer to unmerged Friedel pairs.
Table 3
Non-exhaustive list of conserved interactions between Rab10 and the separate binding sites in Mical-1.
| Mical-1 | Rab10 | |
|---|---|---|
| Binding site 1 | Binding site 2 | |
| Glu964 | Glu1030 | Arg70 |
| Lys981 | Arg1044 | Asp45 |
| Asn982 | Asp1045 | Gln61 |
| Leu956 | Leu1011 | Ile42 |
| Val971 | Leu1034 | Ile42 |
| Leu975 | Val1038 | Ile44, Ile74 |
| Val978 | Val1041 | Ile44, Phe46, Trp63 |
| Val985 | Ile1048 | Leu9, Phe46, Ile48 |
Download links
A two-part list of links to download the article, or parts of the article, in various formats.
Downloads (link to download the article as PDF)
Open citations (links to open the citations from this article in various online reference manager services)
Cite this article (links to download the citations from this article in formats compatible with various reference manager tools)
bMERB domains are bivalent Rab8 family effectors evolved by gene duplication
eLife 5:e18675.
https://doi.org/10.7554/eLife.18675


