A computational interactome and functional annotation for the human proteome
- Columbia University, United States
- Central South University, China
Figures
Figure 1
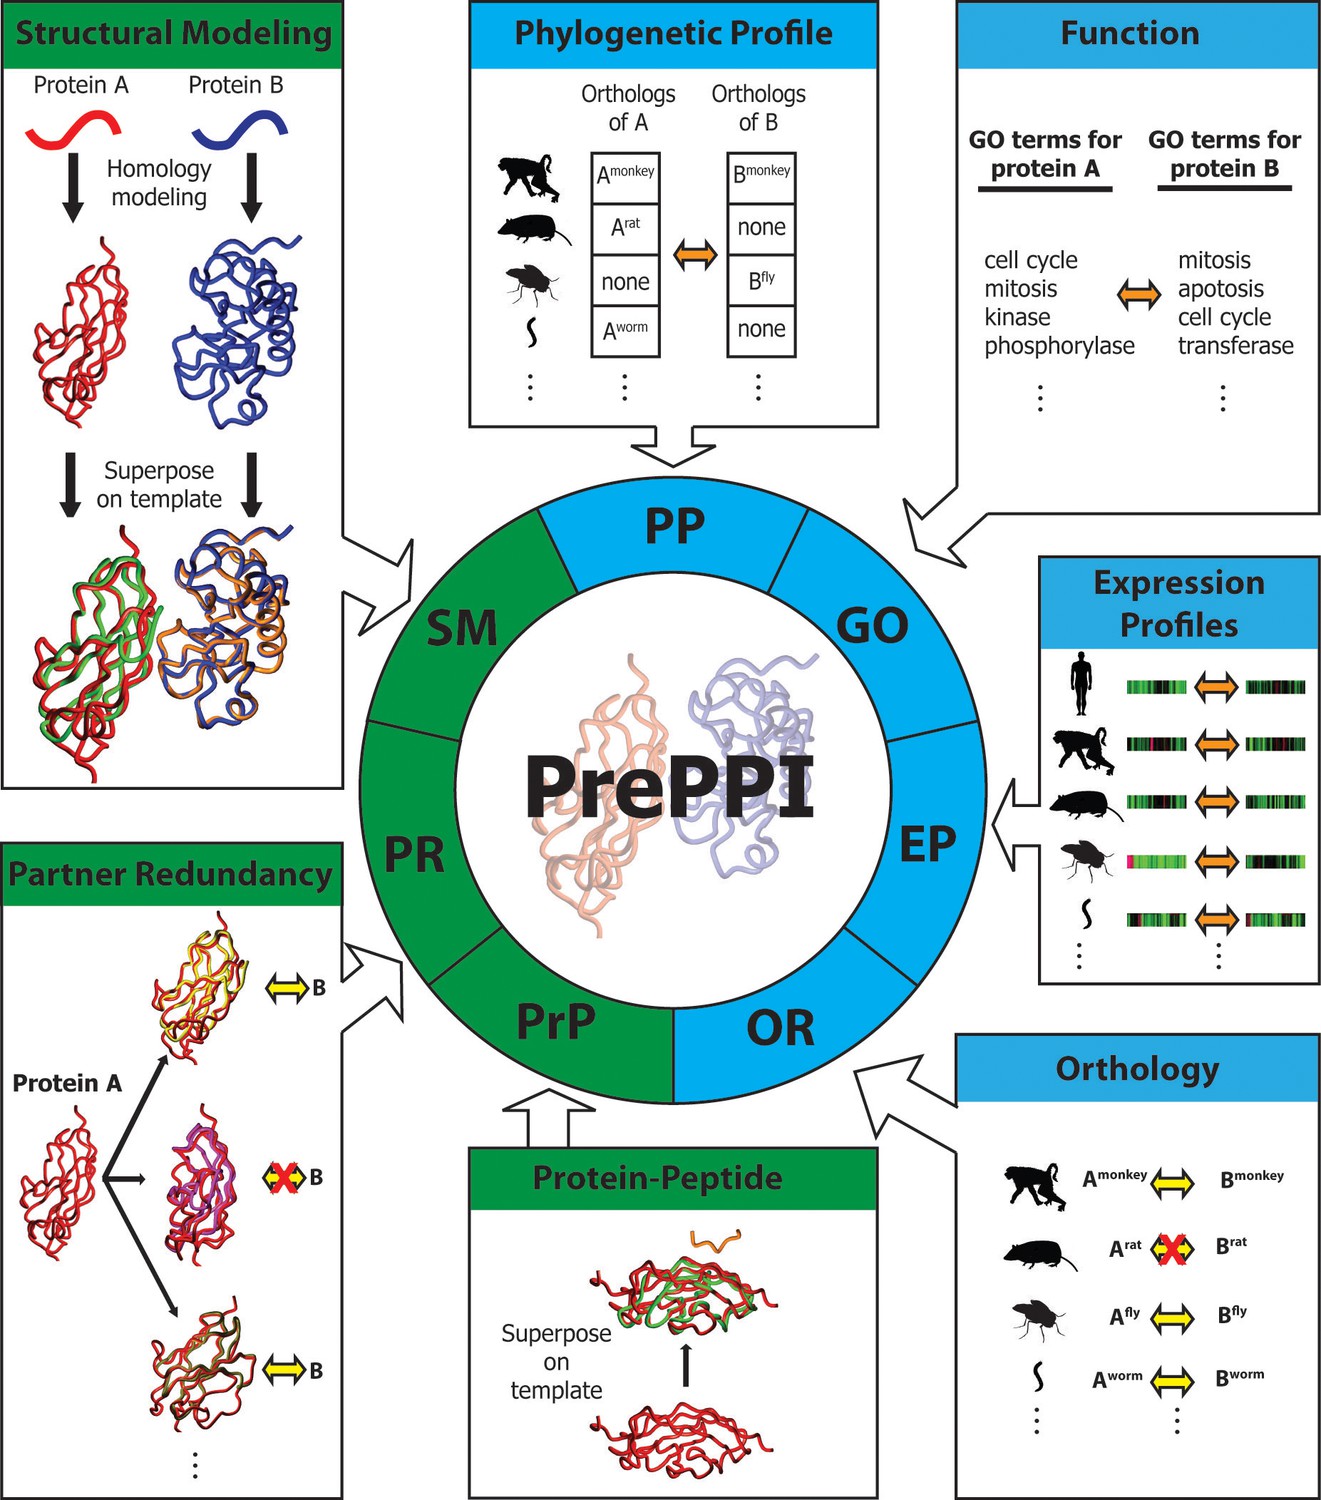
Overview of PrePPI prediction evidence and methodology.
Each box represents a type of interaction evidence used in PrePPI. Those titled with a green background use structural information and those with a blue background do not. Contained in each box is a visual outline of how that type of evidence is used (details are provided in the text and Materials and methods). Overall, an interaction between two given proteins A and B is inferred based on some similarity to others that are known to interact (yellow double arrows) or if they have other properties that correlate in some way (orange double arrows). A red 'X' indicates that an interaction between two proteins does not exist.
Figure 2
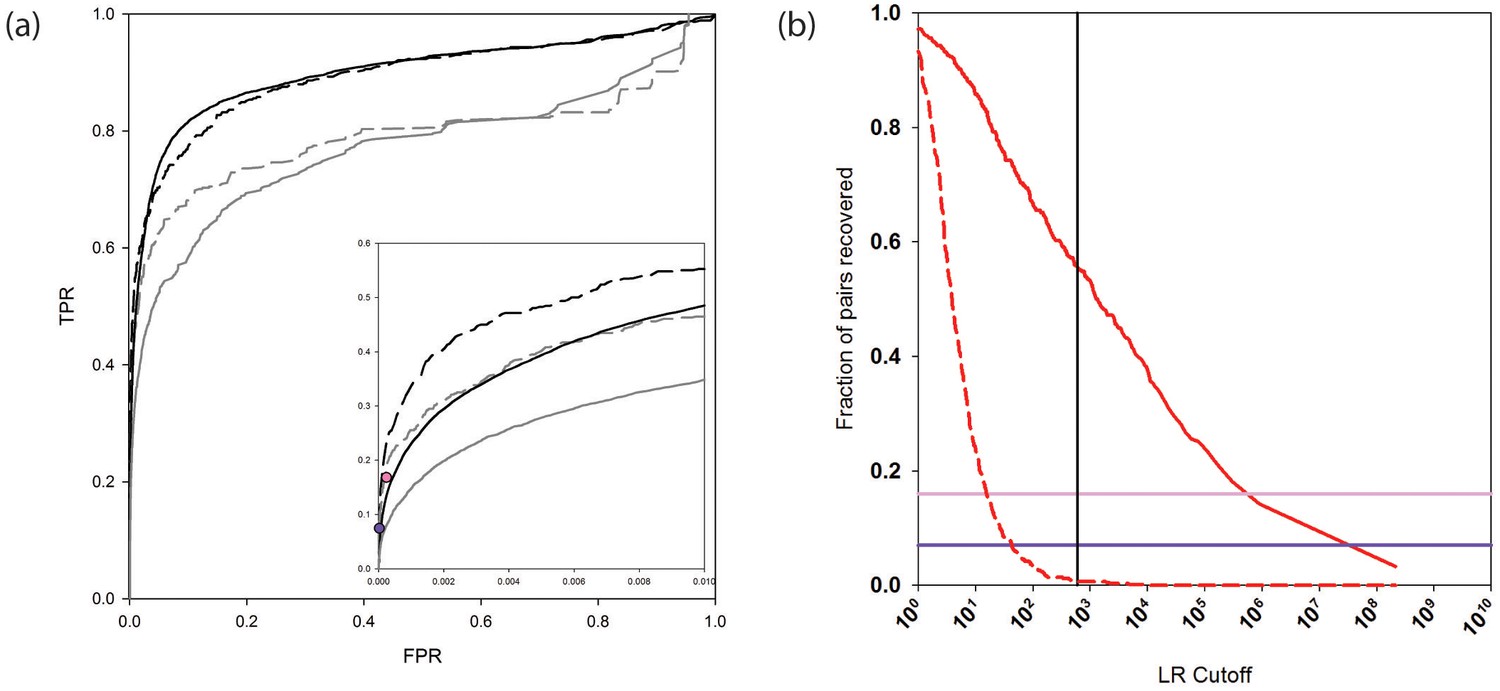
PrePPI prediction performance.
(a) ROC curves assessing PrePPI prediction performance using different reference sets. The y-axis shows the fraction of interactions recovered from a positive reference set (TPR, true positive rate) vs. the fraction recovered from a corresponding negative reference set (FPR, false positive rate). The solid grey and black lines are based on the human HC and N reference sets defined in Materials and methods and compare performance based only on the sources of evidence used in the previous version of PrePPI (grey) and incorporating the new sources of evidence (black). The dashed lines are based on the PRS/RRS reference sets described in the text. The inset shows recovery in the low FPR region. (b) Fraction of PRS (solid line) and RRS (dashed line) interactions recovered with an LR above the cutoff shown on the x-axis. Solid horizontal lines show the fraction of the PRS sets recovered by the Y2H (dark purple) and BioPlex (light purple) databases.
-
Figure 2—source data 1
PrePPI LRs for interactions in the HC, PRS and RRS reference interaction sets.
- https://doi.org/10.7554/eLife.18715.004
Figure 3
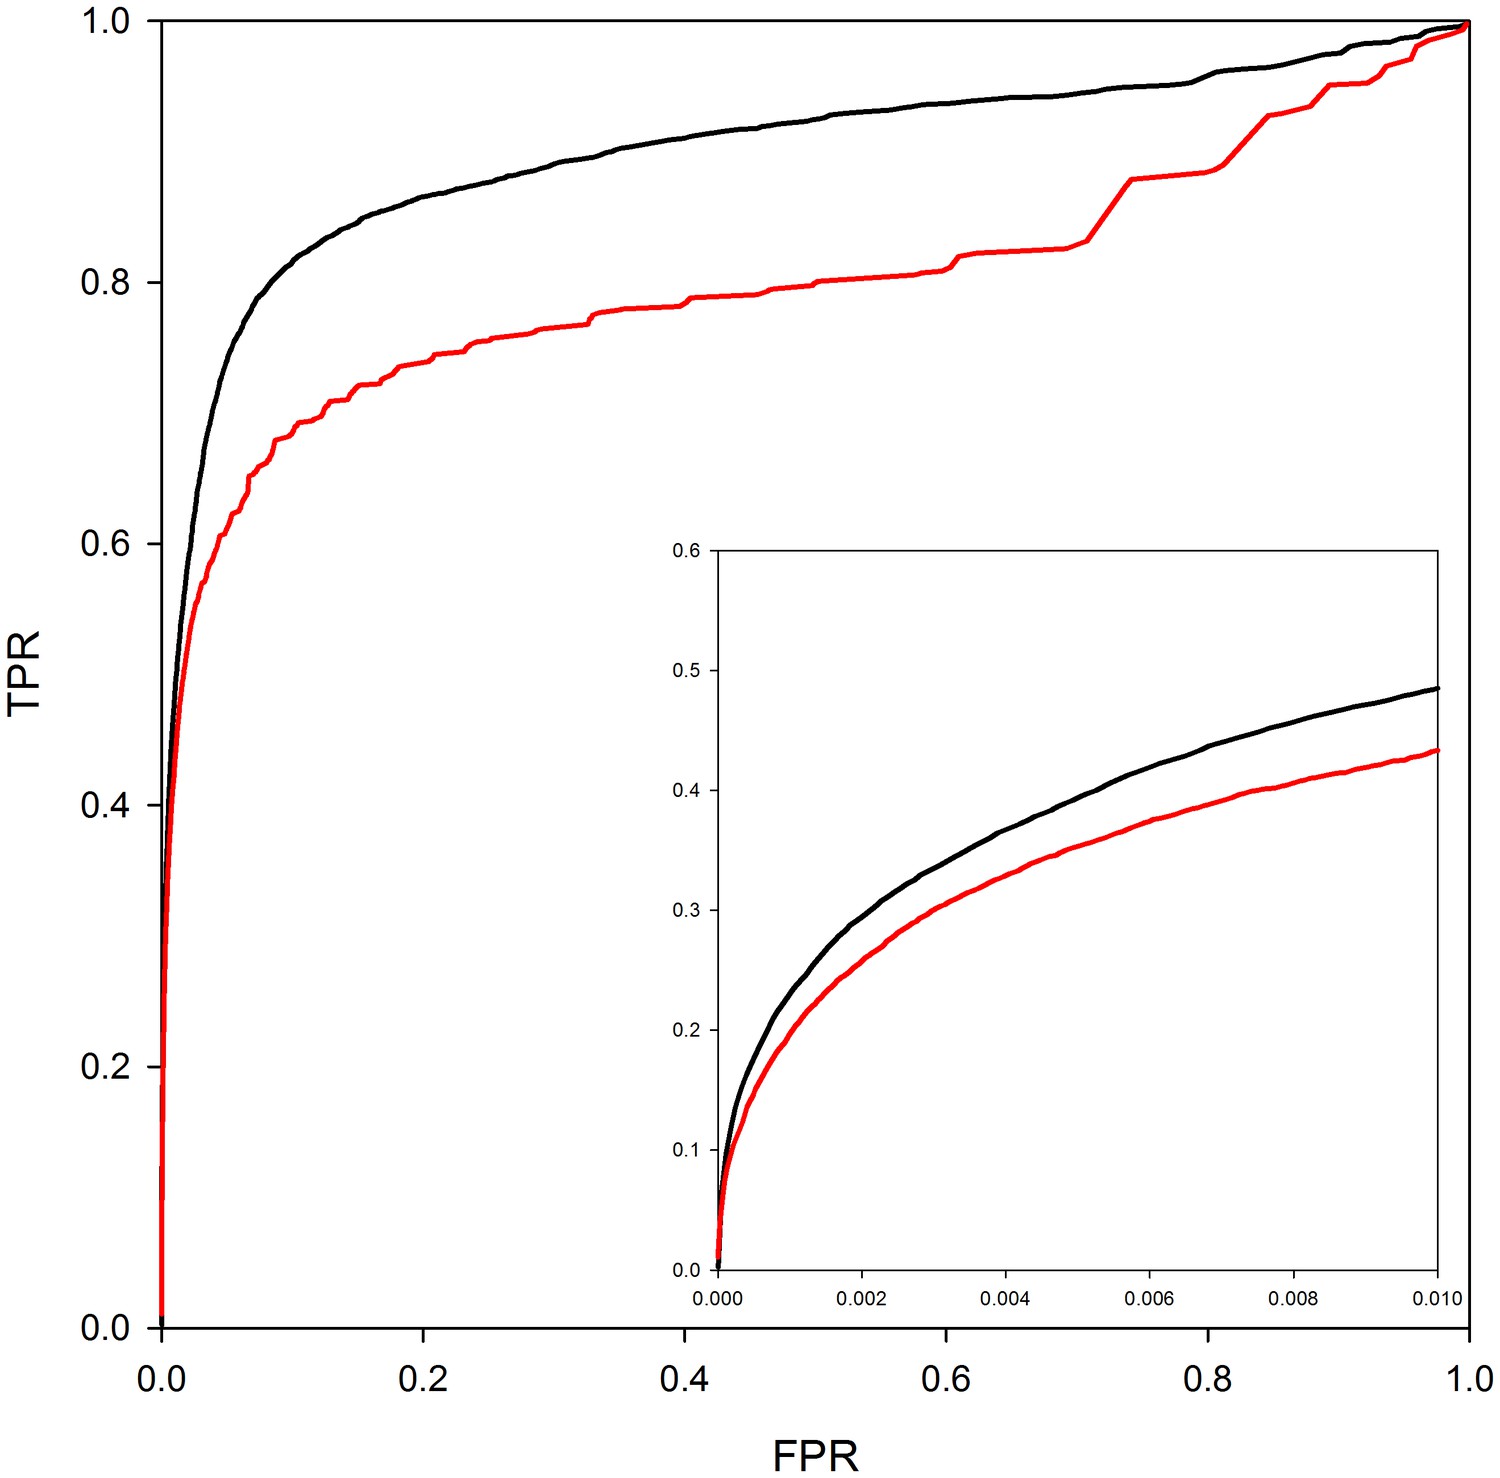
PrePPI performance with and without homology models.
The red line shows PrePPI performance using only crystal structures available in the PDB for individual proteins. The black line shows the performance if both homology models and crystal structures are used.
Figure 4
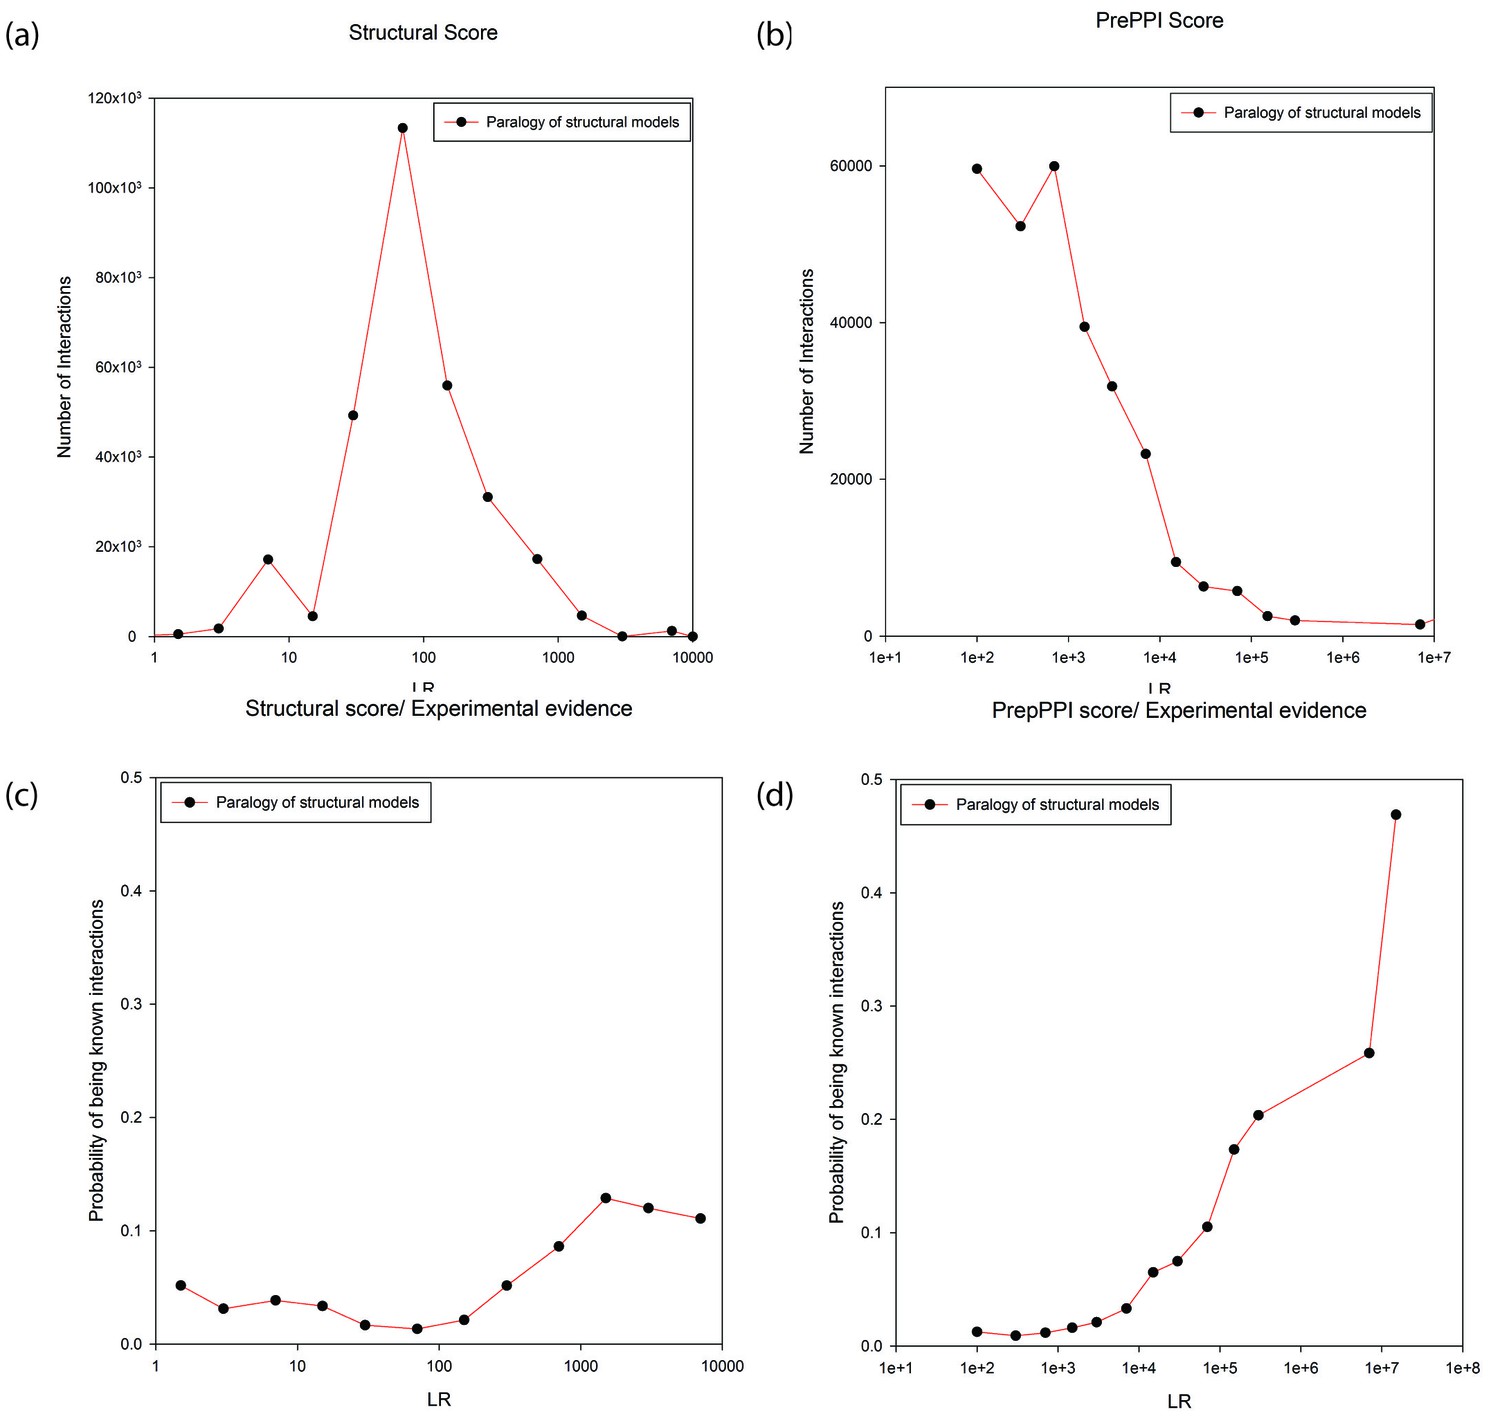
Predictions between proteins annotated as paralogs of proteins in the template.
Panels (a) and (b) show the numbers of predictions (y-axis) as a function of LR (x-axis). In Panel (a) the LR is based only on the SM term and in Panel (b) is based on all sources of evidence. Panel (c) and (d) show the probability (y-axis) of interactions being in the HC set as a function of LR (x-axis). In Panel (c) the LR is based only the SM score and in Panel (d) it is based on all sources of evidence.
Figure 5
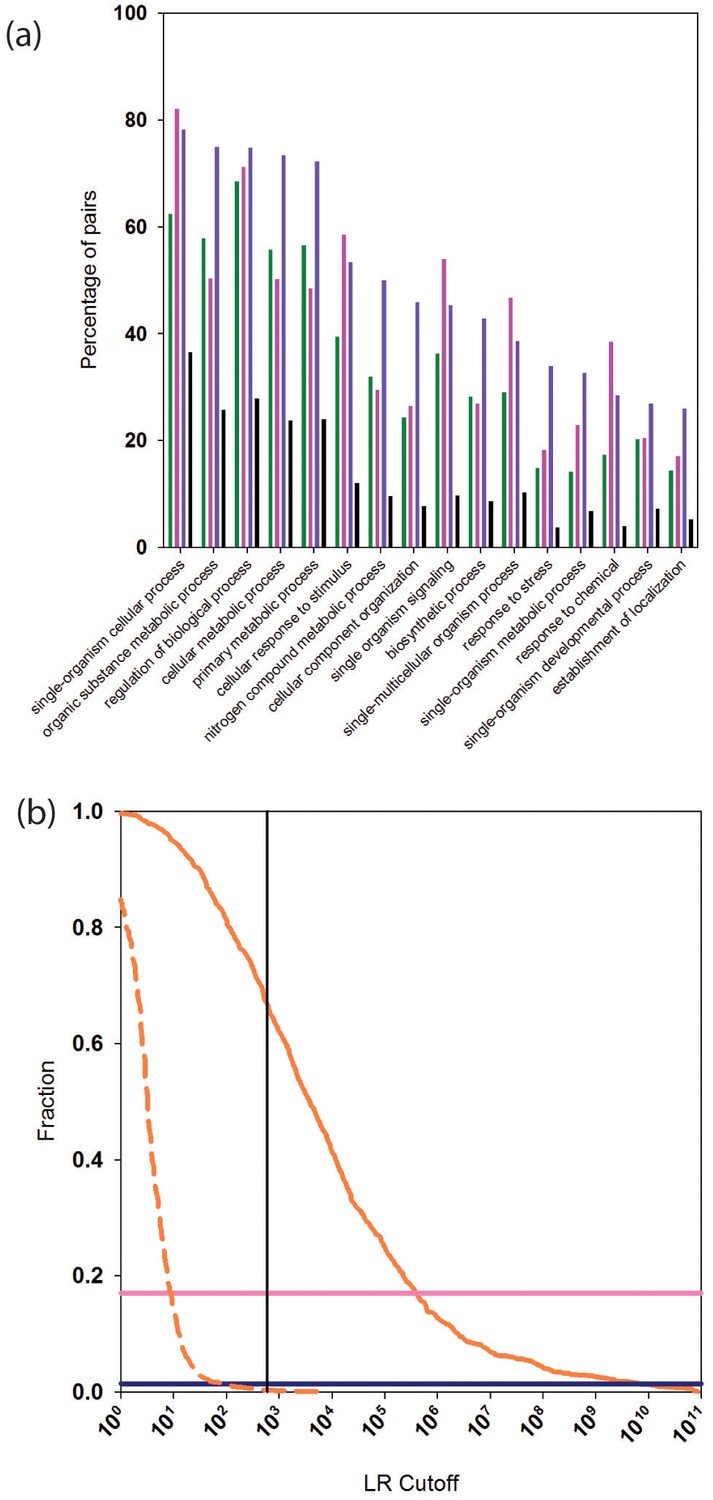
Functional relationships of PrePPI predicted interaction partners.
(a) Percentage of pairs of proteins (y-axis) that are predicted to interact and that share the GO biological process term on the x-axis. Green bars are for PrePPI predictions, pink for the STRING database, purple for the human HC reference set, and black bars are for a random set of protein pairs. (b) The solid orange line shows the fraction of CORUM complexes (y-axis) recovered as a function of LR (x-axis). The dashed line shows the recovery of randomly generated complexes with the same number of subunits as those in CORUM. The horizontal lines show the percentage of CORUM complexes recovered by the Y2H (dark purple) and BioPlex (light purple) interaction sets. The vertical line shows the point on the x-axis with LR=600.
-
Figure 5—source data 1
List of interactions in the HC reference set that share a GO biological process term at the second level.
- https://doi.org/10.7554/eLife.18715.009
-
Figure 5—source data 2
List of PrePPI predicted interactions that share a GO biological process term at the second level.
- https://doi.org/10.7554/eLife.18715.010
-
Figure 5—source data 3
List of interactions in the STRING database that share a GO biological process term at the second level.
- https://doi.org/10.7554/eLife.18715.011
-
Figure 5—source data 4
List of CORUM complexes recovered by PrePPI.
- https://doi.org/10.7554/eLife.18715.012
Figure 6
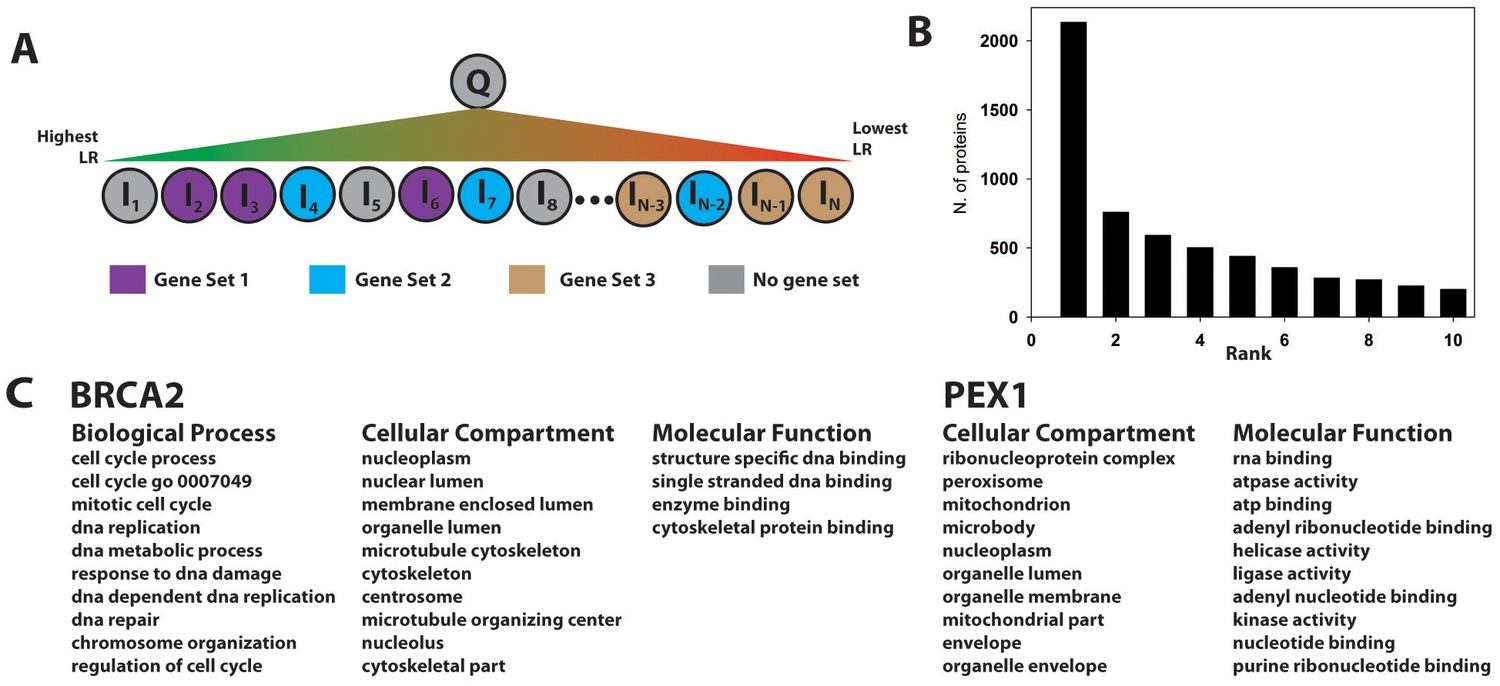
Gene set enrichment using the PrePPI interactome.
(A) To infer a function for a given protein, Q, all proteins in the human proteome, Ii, are placed in a list and sorted according to the interaction LR between Ii and Q. This list is then searched for gene sets associated with a given GO annotation enriched among the high-scoring interactors of Q. In the example in panel A, Gene Set 1 would be enriched whereas Gene Sets 2 and 3 would not be, since the proteins in those sets are either evenly distributed throughout the ranked list or clustered with proteins that are unlikely to interact with Q. (B) Histogram showing the position, in the list of enriched gene sets, of the first set associated with a known GO annotation for Q. Gene sets are ranked according to their enrichment at the top of LR-ranked list of interactors {Ii} of Q. (C) Top ranked gene sets found for two examples, BRCA2 and PEX1.
Figure 7

ROC plots comparing interaction prediction performance based on orthology for individual databases indicated in the legend.
Three bins are defined for any given database, representing whether there 0, 1 or >1 orthologs of two given proteins reported to interact in some other species. LR’s for each bin are trained using the yeast HC and N reference sets of interactions. ROC curves are plotted for the human HC and, for this analysis only, a negative reference set consisting of ~200M pairs of proteins for which there is no literature evidence of an interaction.
Tables
Table 1
Contributions of different sources of evidence to PrePPI performance. The second column shows the number of reliable predictions that can be made using only the evidence identified in the first column. The third column shows the number of predictions that can be made without the evidence shown in the first column, but including all other types of evidence. Note that excluding the OR evidence results in more interactions than using all evidence. This is because there are many interactions for which the LR based on orthology is less than 1. Rows with a green background indicate evidence types that use structural information and rows with a blue background evidence types that are based on non-structural information.
Evidence | Number of interactions from this source alone | Number of interactions from all other sources |
|---|---|---|
All | 1,354,008 | 0 |
SM | 48,090 | 675,965 |
PrP | 1396 | 1,041,951 |
SM,PrP | 49,457 | 192,315 |
PR | 0 | 1,022,829 |
SM,PrP,PR | 127,140 | 114,970 |
OR | 624 | 1,388,341 |
PP | 0 | 802,762 |
CE | 0 | 726,592 |
GO | 0 | 732,198 |
OR,PP,CE,GO | 114,970 | 127,140 |
Table 2
Interaction database overlap. Each cell shows the number of interactions shared by the databases indicated in blue at the top and right. Green boxes along the diagonal show the total number of interactions in a single database.
PrePPI | Y2H | BioPlex | PIP | I2D Ophid | HumanNet | String | Comp. All | Hum.Exp. | |
1,354,007 | 972 | 5364 | 17,639 | 67,556 | 76,905 | 123,457 | 212,463 | 44,864 | PrePPI |
13,584 | 425 | 140 | 13,470 | 804 | 918 | 13,584 | 1777 | Y2H | |
56,553 | 918 | 5689 | 4361 | 5549 | 56,553 | 4763 | BioPlex | ||
44,148 | 6253 | 10,324 | 703 | 44,148 | 5154 | PIP | |||
296,008 | 56,584 | 53,178 | 296,008 | 160,581 | I2D Ophid | ||||
458,518 | 58,512 | 458,518 | 44,047 | HumanNet | |||||
311,635 | 311,635 | 45,890 | String | ||||||
1,004,622 | 162,065 | Comp. All | |||||||
169,368 | Hum. Exp. |
Table 3
Unique database interactions. Each cell shows the number of interactions contained in the database indicated on the left in blue, but not in the database indicated at the top in blue. Green boxes show the total number of interactions in a single database
PrePPI | Y2H | BioPlex | PIP | I2D Ophid | HumanNet | String | Comp.All | Human Exp. | |
PrePPI | 1,354,007 | 1,353,035 | 1,348,643 | 1,336,368 | 1,286,451 | 1,277,102 | 1,230,550 | 1,141,544 | 1,309,143 |
Y2H | 12,612 | 13,584 | 13,159 | 13,444 | 114 | 12,780 | 12,666 | 0 | 11,807 |
BioPlex | 51,189 | 56,128 | 56,553 | 55,635 | 50,864 | 52,192 | 51,004 | 0 | 51,790 |
PIP | 26,509 | 44,008 | 43,230 | 44,148 | 37,895 | 33,824 | 36,245 | 0 | 38,994 |
I2d Ophid | 228,452 | 282,538 | 290,319 | 289,755 | 296,008 | 239,424 | 242,830 | 0 | 135,427 |
HumanNet | 381,613 | 457,714 | 454,157 | 448,194 | 401,934 | 458,518 | 400,006 | 0 | 414,471 |
String | 188,178 | 310,717 | 306,086 | 303,732 | 258,457 | 253,123 | 311,635 | 0 | 265,745 |
Comp. All | 792,159 | 991,038 | 948,069 | 960,474 | 708,614 | 546,104 | 692,987 | 1,004,622 | 842,557 |
Human Exp. | 124,504 | 167,591 | 164,605 | 164,214 | 8787 | 125,321 | 123,478 | 7303 | 169,368 |
Table 4
Accession numbers, species, Affymetrix ID and source database for the expression profile datasets used for the expression profile evidence.
Accession | Species | Affymetrix ID | Source |
|---|---|---|---|
Hsa.c4-0 | Human | HG-U133_Plus_2 | Coxpressdb |
Hsa2.c1-0 | Human | HuGene-1_0-st-v1 | Coxpressdb |
E-MTAB-62 | Human | HG-U133A | ArrayExpress |
Mmu.c3-0 | Mouse | Mouse430_2 | Coxpressdb |
Rno.c2-0 | Norway rat | Rat230_2 | Coxpressdb |
Gga.c2-0 | Chicken | Chicken | Coxpressdb |
Dre.c2-0 | Zebrafish | Zebrafish | Coxpressdb |
Dme.c2-0 | Fruit fly | Drosophila_2 | Coxpressdb |
Cel.c2-0 | Nematoda | Celegans | Coxpressdb |
Mcc.c1-0 | Rhesus monkey | Rhesus | Coxpressdb |
Cfa.c1-0 | Dog | Canine_2 | Coxpressdb |
Sce.c1-0 | Budding yeast | Yeast_2 | Coxpressdb |
Spo.c1-0 | Fission yeast | Yeast_2 | Coxpressdb |
Table 5
Contingency tables for analyzing enrichment of SNPs in modeled interfaces. For both the disease-associated and benign sets, the numbers in parentheses are as follows: n11 is the number of SNPs that are interfacial, n10 is the number that are not interfacial, n01 is the number of interfacial unmutated residues and n00 is the number of non-interfacial, unmutated residues. These numbers are used in the odds-ratio and Z-score calculation as described in the 'SNP Analysis' section.
Disease | ||
|---|---|---|
Interfacial | Non-interfacial | |
Mutated | 12,151 (n11) | 61,401 (n10) |
Non-mutated | 298,442 (n01) | 2,387,146 (n00) |
Benign | ||
|---|---|---|
Mutated | 3554 (n11) | 64,656 (n10) |
Non-mutated | 845,876 (n01) | 8,221,708 (n00) |
Additional files
-
Supplementary file 1
UniProt codes for interacting proteins that are related to the same disease.
Each line shows a pair of proteins annotated as associated with the same disease in the ClinVar database.
- https://doi.org/10.7554/eLife.18715.019
-
Supplementary file 2
LRs for orthology, partner redundancy and expression profile interaction evidence.
- https://doi.org/10.7554/eLife.18715.020
Download links
A two-part list of links to download the article, or parts of the article, in various formats.
Downloads (link to download the article as PDF)
Open citations (links to open the citations from this article in various online reference manager services)
Cite this article (links to download the citations from this article in formats compatible with various reference manager tools)
A computational interactome and functional annotation for the human proteome
eLife 5:e18715.
https://doi.org/10.7554/eLife.18715


