Direct screening for chromatin status on DNA barcodes in yeast delineates the regulome of H3K79 methylation by Dot1
- Netherlands Cancer Institute, Netherlands
- VU University Medical Center, Netherlands
- Utrecht Institute for Pharmaceutical Sciences, University of Utrecht, Netherlands
Figures
Figure 1 with 1 supplement
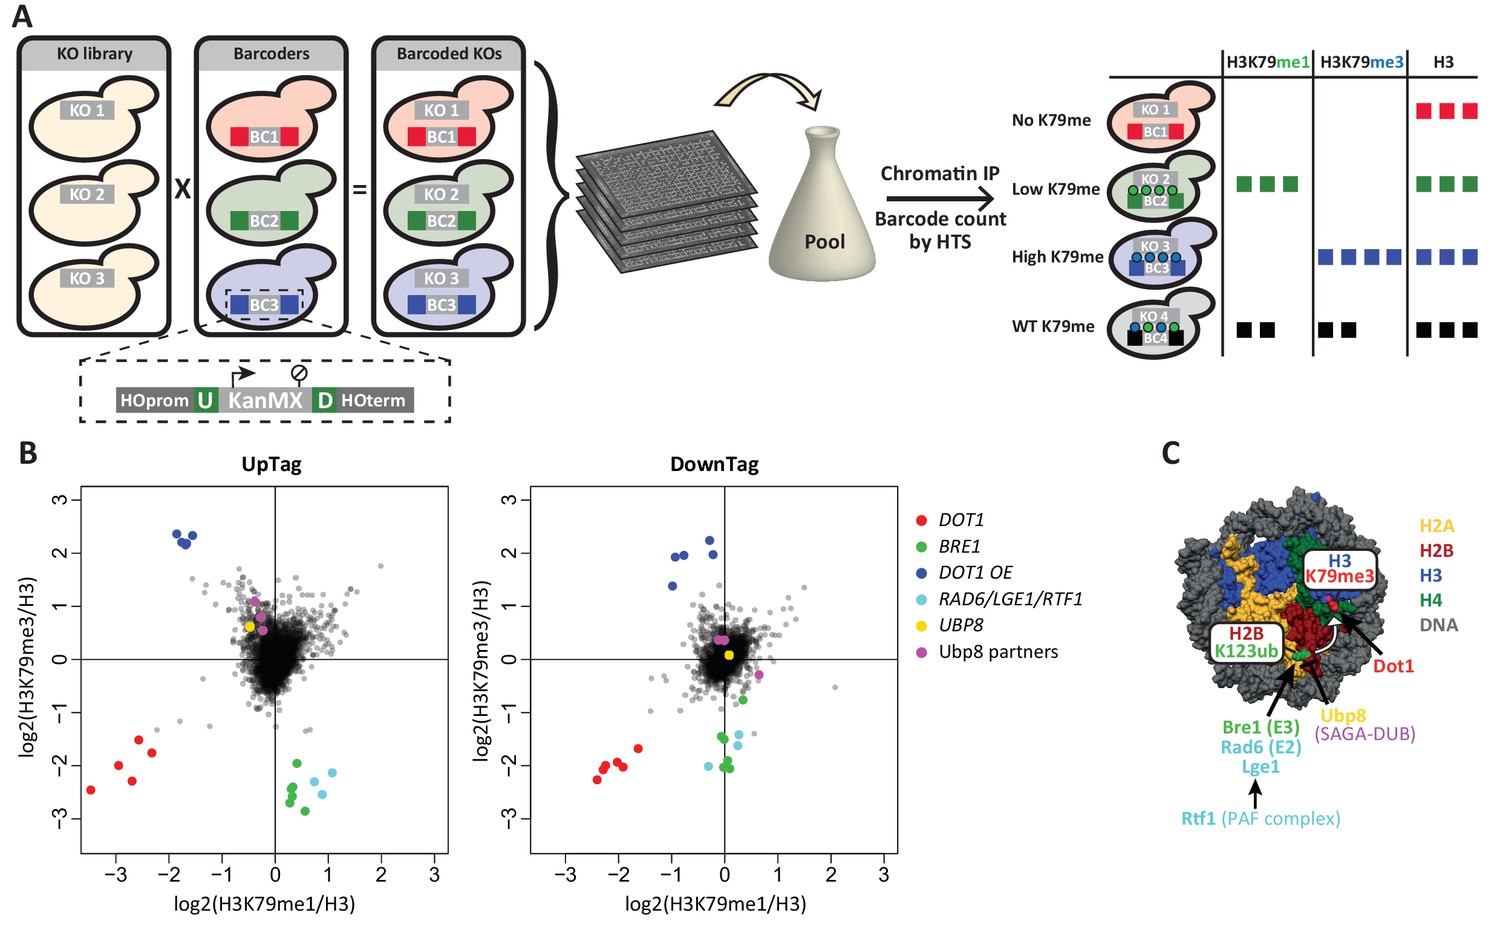
Outline and proof-of-concept of Epi-ID.
(A) The barcoded knock-out library used for Epi-ID was created by crossing the NatMX knock-out library (Tong and Boone, 2006) with the Barcoder collection (Yan et al., 2008). Two 20-base-pair barcodes (UpTag (U) and DownTag (D)) flank a KanMX selection marker replacing the HO gene. For an Epi-ID experiment, barcoded mutant strains are pooled and ChIP experiments are performed on the pool. The barcodes of the different mutant strains can be counted by high-throughput sequencing and serve as a read-out for the amount of epitope present at the barcode. (B) Average data of two Epi-ID screens on approximately 4100 yeast deletion strains. Each dot represents a deletion strain, with the exception of the Dot1 overexpression strain (Dot1 OE). Control strains and some known regulators are highlighted. (C) Schematic depiction of the H2Bub pathway regulating H3K79 methylation.
-
Figure 1—source data 1
Epi-ID data.
- https://doi.org/10.7554/eLife.18919.004
Figure 1—figure supplement 1
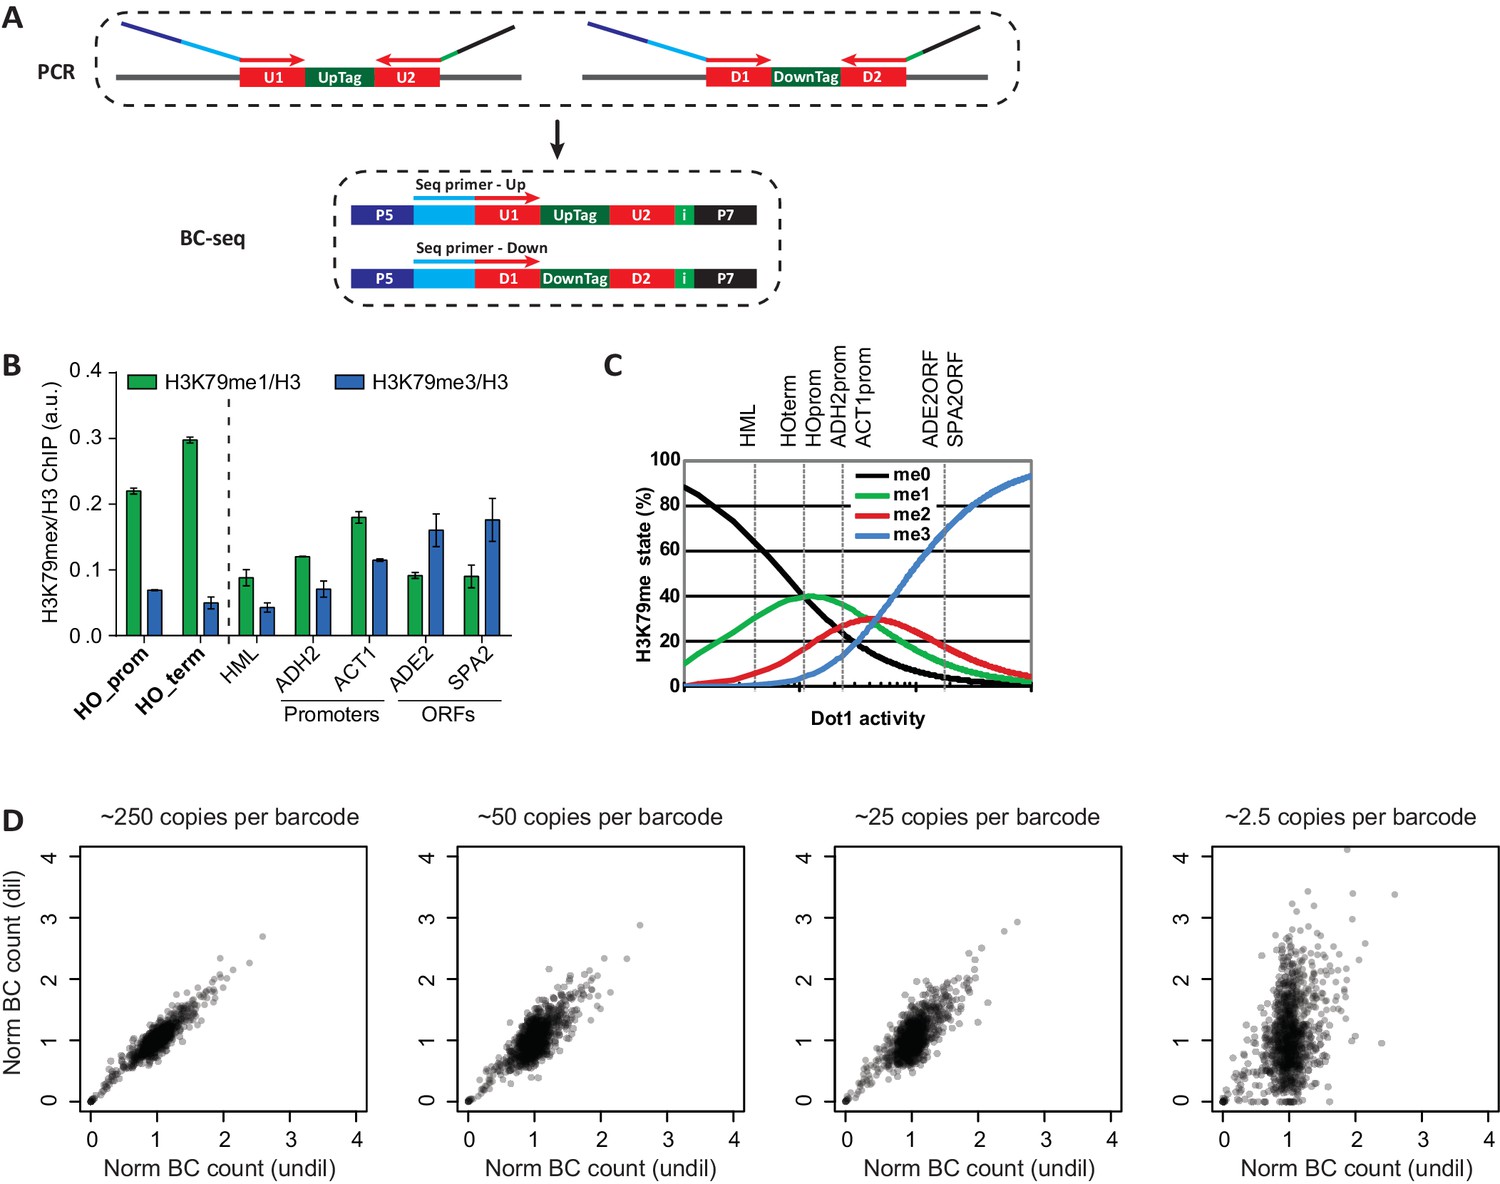
Technical details on Epi-ID.
(A) PCR set-up, introducing sequencing adapters and an index in a single PCR. Two custom sequencing primers were designed to include the U1/D1 sequence just upstream of the UpTag and DownTag. Starting the reads with the barcode yields maximum complexity in the first base pairs, which is good for clustering efficiency. These sequencing primers are compatible with standard Illumina sequencing conditions and can be mixed together to sequence UpTag and DownTag in one lane. A 6-base-pair index is introduced in the reverse primer, to allow for multiplexing. (B) ChIP-qPCR data of the different methylation states, normalized to H3, at several loci. HO promoter and HO terminator are near the UpTag and DownTag, respectively. Error bars show the range of two biological replicates. (C) Dependence of H3K79me levels on Dot1 activity, modified from De Vos et al. (2011). Although this is a model based on global H3K79 methylation, qualitatively similar changes in methylation can be expected on lowly versus highly methylated loci. Dashed lines indicate estimated levels of H3K79 methylation at the loci tested in the qPCR. HML, a silent mating type locus, has very low levels of methylation, the two promoters have intermediate levels and the two ORFs have high levels of methylation. HO promoter and HO terminator have a low to intermediate level of H3K79 methylation, both an increase and a decrease of methylation are possible, making these loci suitable for a regulator screen. (D) It is important to start the PCR with sufficient material to minimize jackpot effects. Scatter plots showing the correlation between barcode counts after a PCR starting with approximately 2500 copies per barcode (on the x axis), with barcode counts of PCRs on diluted sample. The correlation decreases with dilution, 250 copies per barcode seems to be sufficient to have minimal jackpot effect.
Figure 2 with 2 supplements
H3K79 methylation regulation by growth and acetyltransferases.
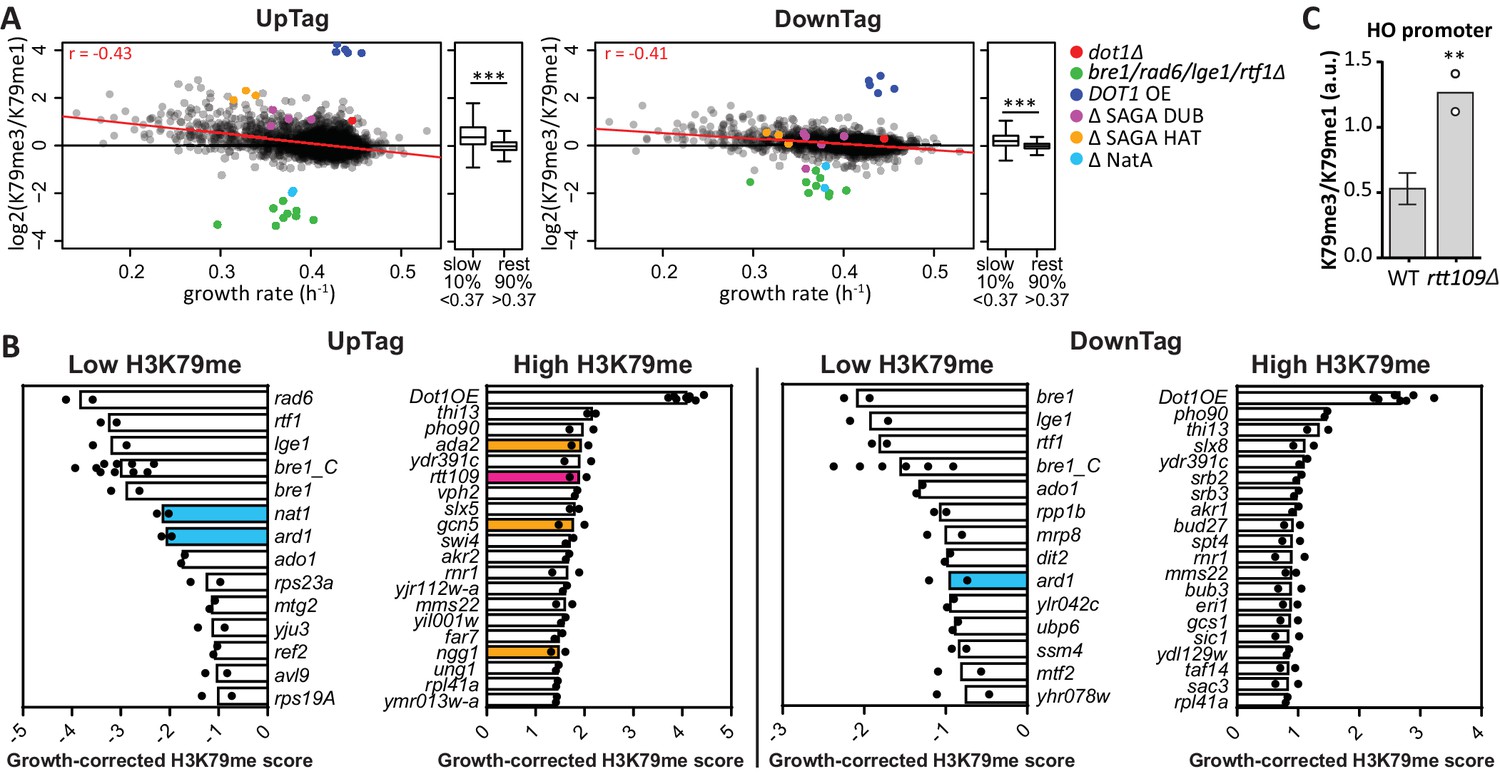
(A) Scatter plots of growth rate and H3K79 methylation (me3/me1) for UpTag and DownTag, each dot representing a mutant strain. The Pearson correlation coefficient is shown in the plot. The red line is the linear model fitting the data best and was used for correcting the H3K79 methylation score. Highlighted strains were ignored in the analysis, because they lacked validated H3K79me regulators. Alongside the scatter plot is a Tukey box plot to compare the median and spread of H3K79 methylation for the bottom-10% slowest growers, compared to the other 90%. These populations are highly significantly different, as determined by a T test. (B) Bar charts of growth-corrected H3K79 methylation scores of deletion strains, showing the strongest positive and negative outliers on UpTag and DownTag. Because individual outliers are shown, a cutoff was applied on variation between the two biological replicates (c.o.v. <0.35) to increase confidence. Mean and individual data points of two experiments are shown. Strain bre1_C is the control bre1Δ strain that was taken along multiple times in each experiment, whereas the other bre1Δ strain was part of the library. Strain rtt109Δ and NatA complex mutants have been highlighted, as well as mutants of the SAGA HAT module that will be discussed later on. (C) ChIP-qPCR analysis at the HO promoter, near the UpTag. Plotted is the ratio between H3K79me3 and H3K9me1 IP values. Four wild-type (mean with SD) and two rtt109Δ strains (individual data points shown) were compared by an unpaired T test.
-
Figure 2—source data 1
Growth rates calculated for all deletion strains.
- https://doi.org/10.7554/eLife.18919.007
-
Figure 2—source data 2
Growth-corrected H3K79me scores.
- https://doi.org/10.7554/eLife.18919.008
-
Figure 2—source data 3
ChIP-qPCR data at the HO promoter, WT vs rtt109Δ.
- https://doi.org/10.7554/eLife.18919.009
Figure 2—figure supplement 1
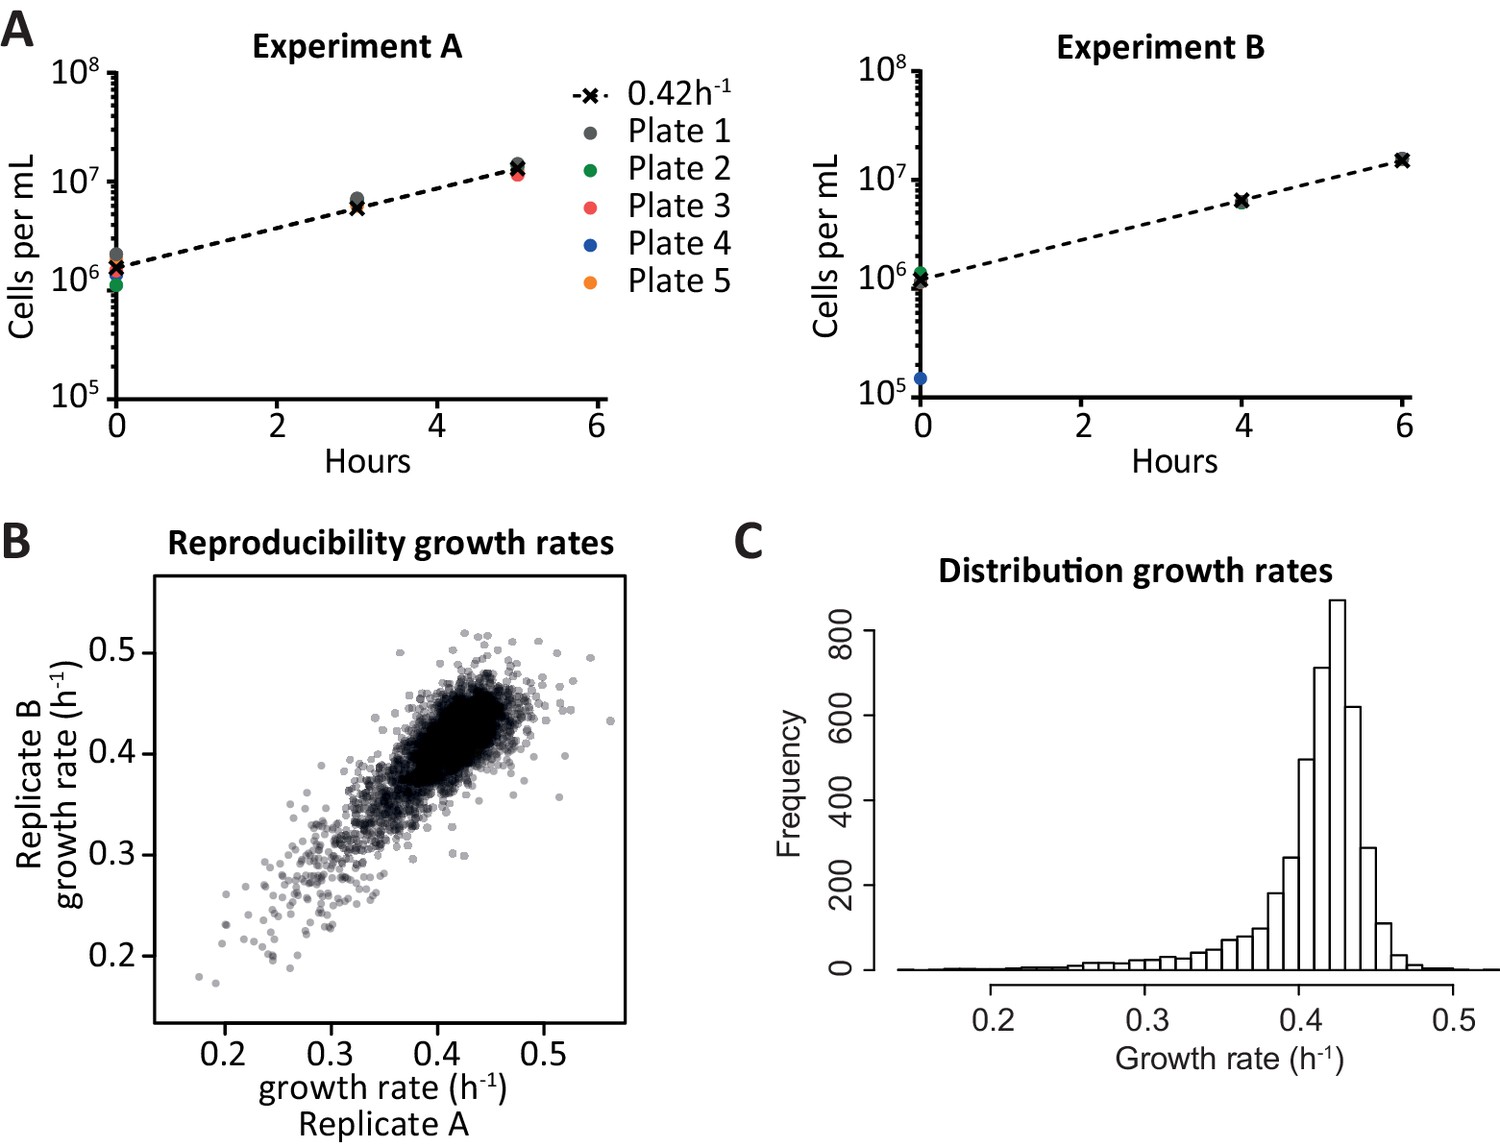
Growth rate determination.
(A) Approximate cell counts at different time points, for each of the pools of cells. t = 0 is after scraping the cells off an agar plate on which they had grown for approximately 16 hr. The coloured dots indicate the cell counts estimated by optical density, the dashed line starts from the average cell count at t = 0 (disregarding 4B) and increases with the standard logarithmic growth rate of 0.42 h−1 (Di Talia et al., 2007). Since the measurements were close to the dashed line throughout the experiment, it was fair to assume logarithmic growth. When calculating individual growth rates, the assumption of a median growth rate of 0.42 h−1 in each pool was used rather than the cell counts, since it was deemed more robust. (B) Comparison of the growth rates obtained from two replicate experiments; each dot is a deletion strain. The growth rates per strain can be found in Figure 2—source data 1. (C) Distribution of calculated growth rates for over 4000 knock-out strains.
Figure 2—figure supplement 2
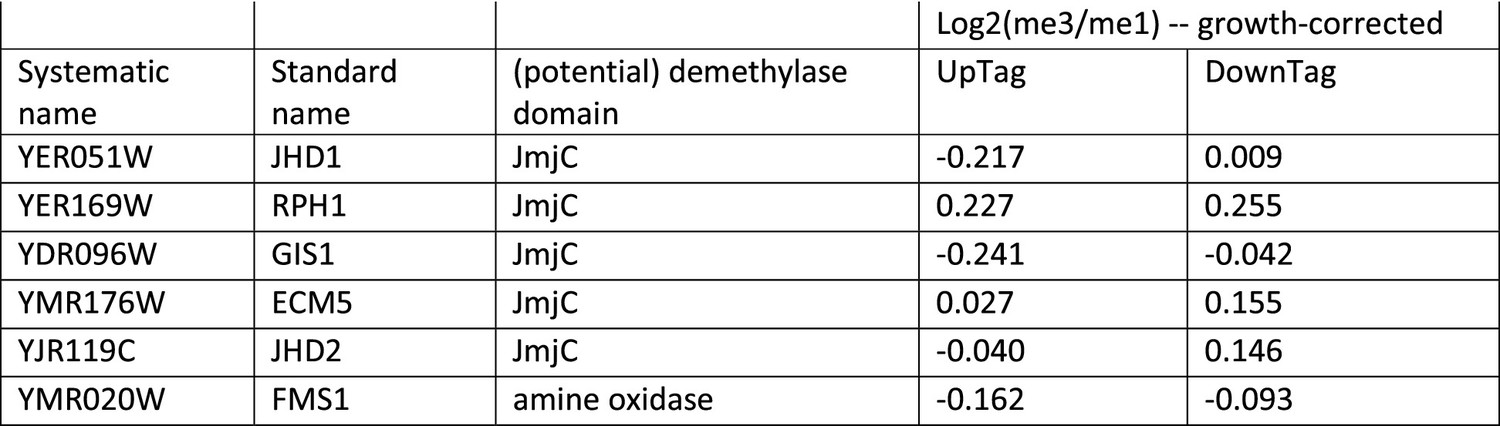
Growth-corrected H3K79me scores of genes that contain potential demethylase domains.
Data taken from Figure 2—source data 2.
Figure 3 with 2 supplements
Positive regulators of H3 methylation.
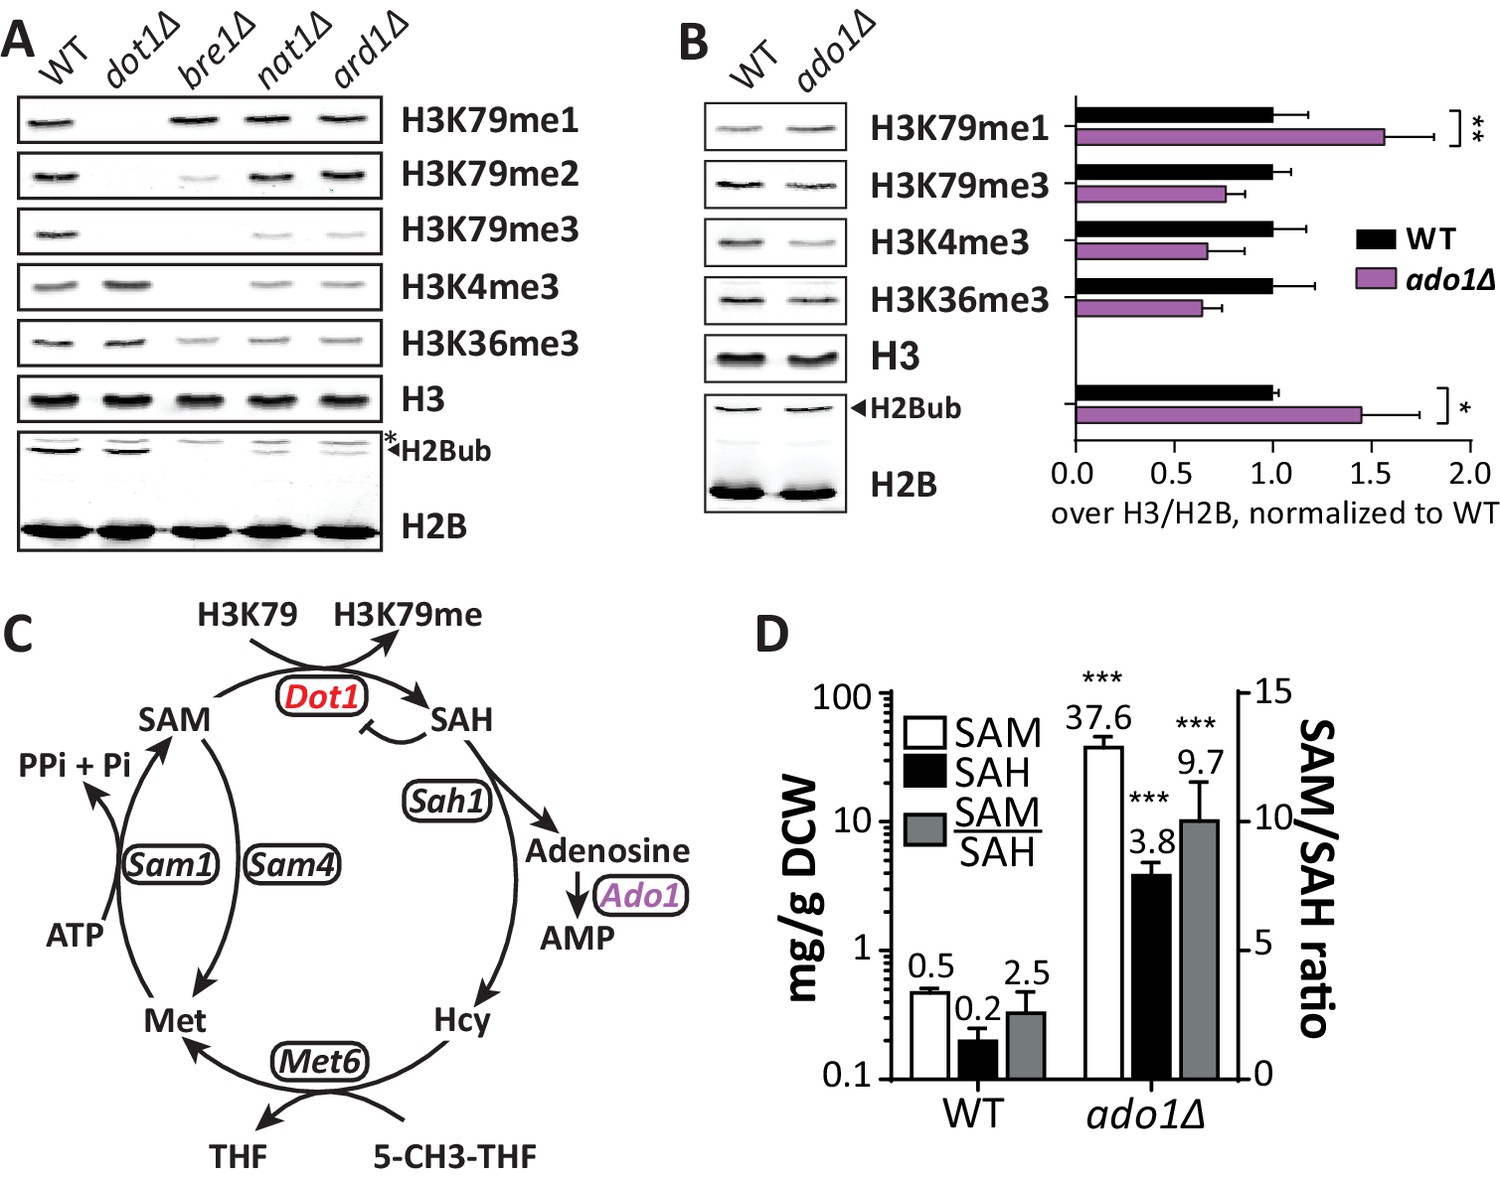
(A) Immunoblots of H3 methylation and H2B in the indicated strains. Biological replicates are shown in Figure 3—figure supplement 1A. (B) Representative image of immunoblots of H3 methylation and H2B in wild-type and ado1Δ strains. Alongside is the quantification of the three biological replicates run on these gels. Uncropped blots are shown in Figure 3—figure supplement 2A, more replicates in 2B. (C) Schematic depiction of the methionine cycle in budding yeast. Dot1 and Ado1 have been highlighted. In addition to Dot1, SAM is utilized by many other methyltransferases. (D) Levels of SAM and SAH on a logarithmic scale, and their ratio on a linear scale. n = 7–8, comparison by multiple T test.
-
Figure 3—source data 1
Raw SAM and SAH measurements and calculations.
- https://doi.org/10.7554/eLife.18919.013
Figure 3—figure supplement 1
NatA immunoblots.
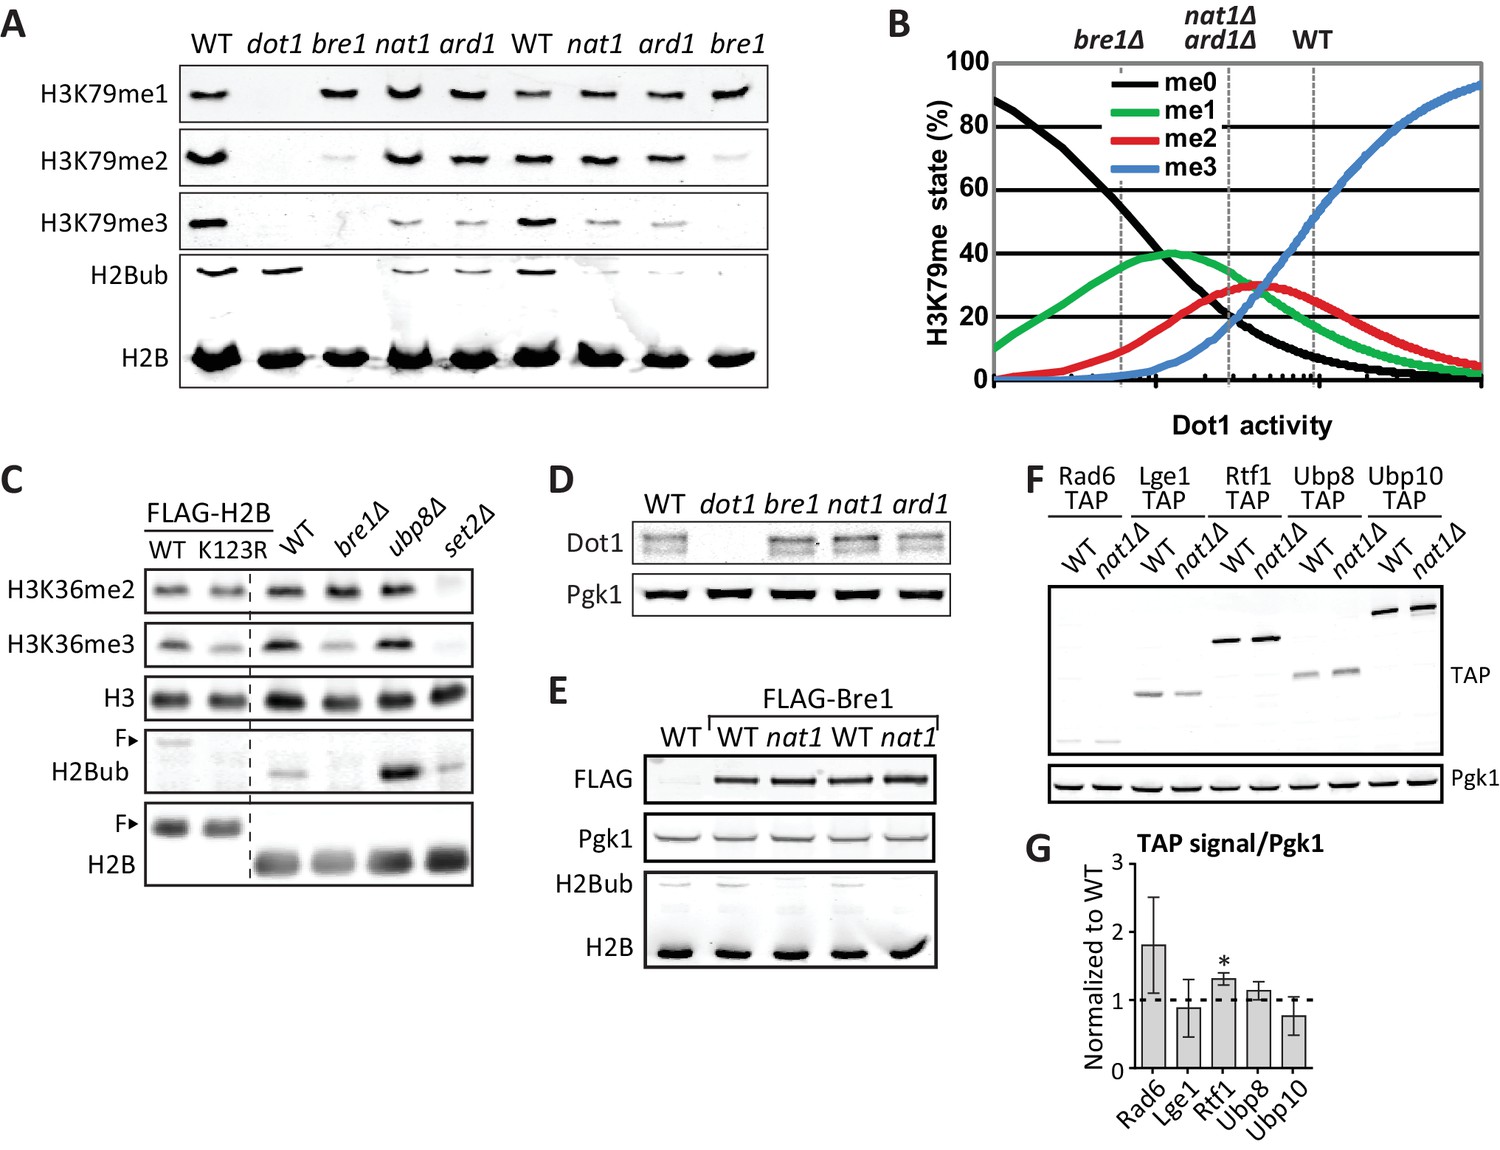
(A) Immunoblots of H3 methylation and H2B in the indicated deletion strains. Biological replicates of Figure 3A. (B) Model of the dependence of H3K79 methylation on Dot1 activity (modified from De Vos et al., 2011), with dashed lines indicating the estimated Dot1 activities in the indicated strains. The decrease in H3K79me3 and increase in K79me1 fit with lower overall Dot1 activity, but the effect of deletion of the NatA complex is not as strong as BRE1 deletion. (C) Immunoblots showing the effect of an H2B-K123R mutation and BRE1 deletion on H3K36me2 (no effect) and H3K36me3 (decrease). Bands shifted by the extra weight of the FLAG tagged have been marked with an F. (D) Dot1 expression levels are unaltered in nat1Δ and ard1Δ strains. (E) Because a C-terminal tag on Bre1 disrupts its function (Wood et al., 2003) and an N-terminal tag interferes with potential N acetylation of the native N terminus of Bre1, we performed an epistasis experiment to address whether the role of NatA in H2B ubiquitination was mediated by N-acetylation of Bre1. FLAG-Bre1 has a normal activity that is still NatA dependent, which demonstrates that the NatA complex does not act though N-acetylation of Bre1. (F) TAP blots were used to measure the expression levels of C-terminally TAP-tagged versions of the indicated proteins. Representative blot. (G) Quantification of the blot shown in panel F, as well as blots from two independent experiments. Only Rtf1 expression is significantly altered, but an increase in Rtf1 is not consistent with a decrease in H2Bub.
Figure 3—figure supplement 2
Ado1 immunoblots.
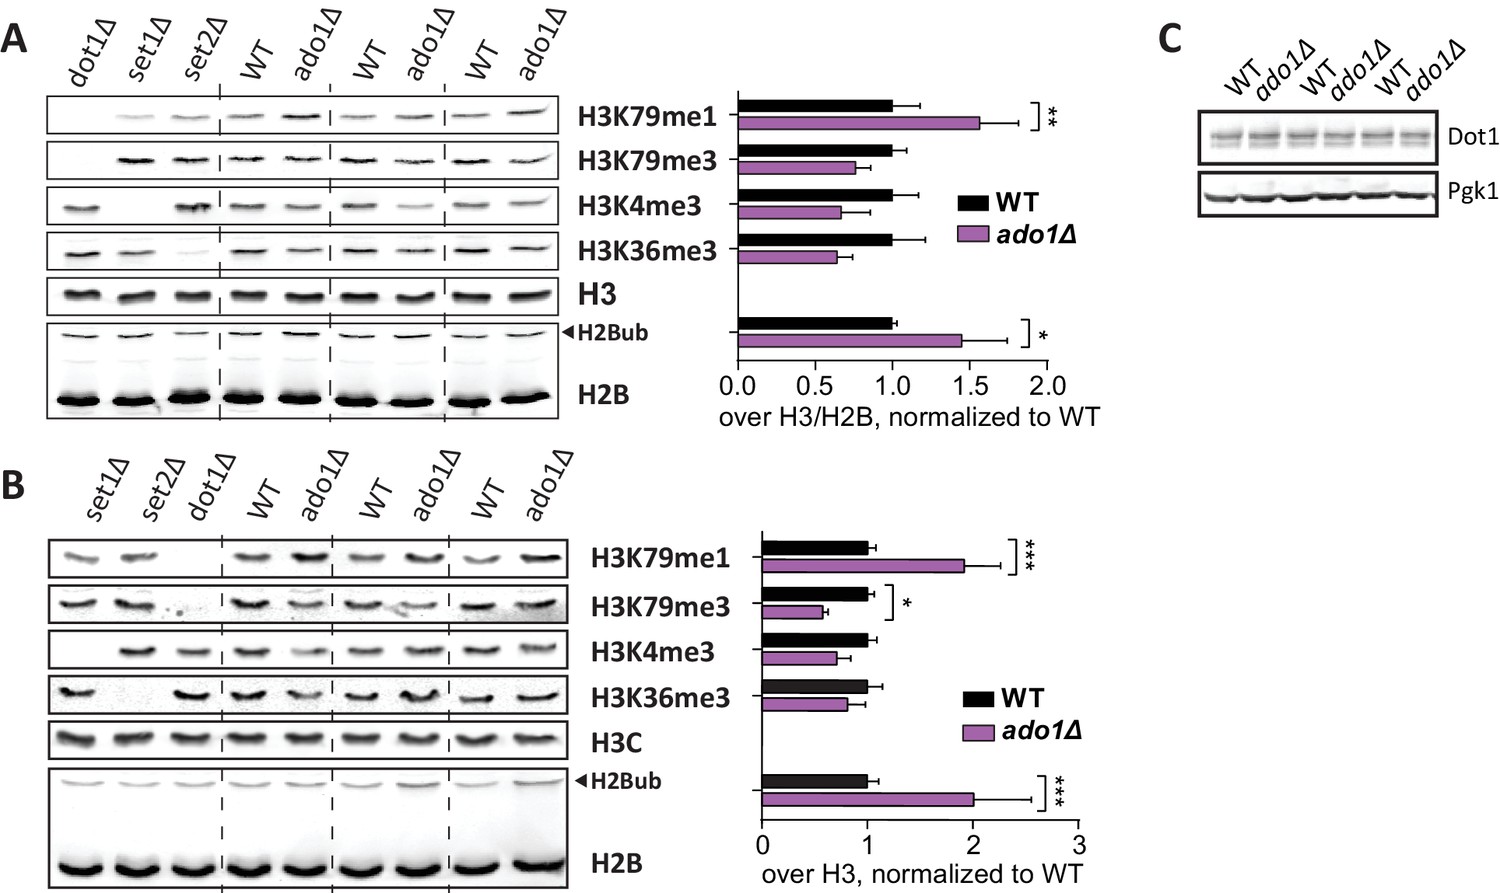
(A) Uncropped blots of Figure 3B, showing H3 methylation and H2B ubiquitination in wild-type and ado1Δ strains, as well as some controls. Alongside is the quantification of these blots. Replicates are independent samples of the same strains. Methylation of H3K79, H3K4 and H3K36 all decrease on average, but the decreases seem to be (partially) compensated by an increase in H2Bub, especially in the first sample. (B) Immunoblots like in A, from independent samples of one wild-type and one knock-out strain, with the quantification alongside. (C) Dot1 blots show that ADO1 deletion does not alter Dot1 expression.
Figure 4 with 2 supplements
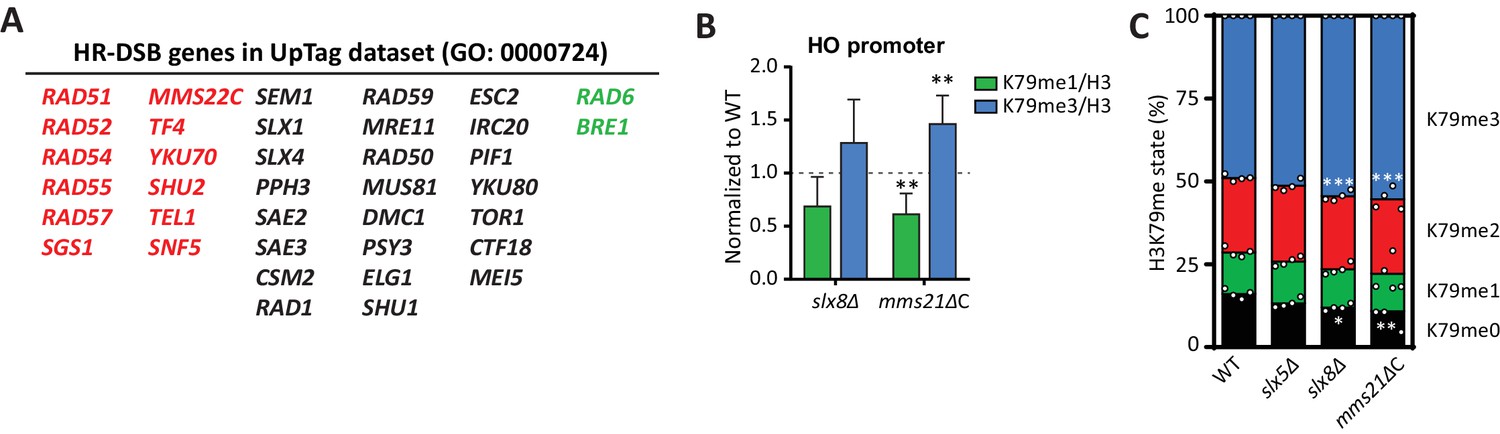
DNA repair genes are negative regulators of H3K79 methylation.
(A) Genes from the GO process of double-strand break repair by homologous recombination, which are present in the dataset. Genes from the CLIK group of negative regulators are on the left (in red), positive regulators on the right (in green). (B) ChIP-qPCR analysis of H3K79 methylation on the HO promoter, close to the UpTag. K79me IPs were normalized to H3; mutants were normalized to wild-type. 4–6 replicates per strain, compared to one by one-sample T test. (C) MS analysis of H3K79 methylation levels in wild type and mutants. Mean and individual data points are shown.
-
Figure 4—source data 1
Normalized ChIP-qPCR data on HO promoter.
- https://doi.org/10.7554/eLife.18919.020
-
Figure 4—source data 2
Raw mass spectrometry data.
- https://doi.org/10.7554/eLife.18919.021
Figure 4—figure supplement 1
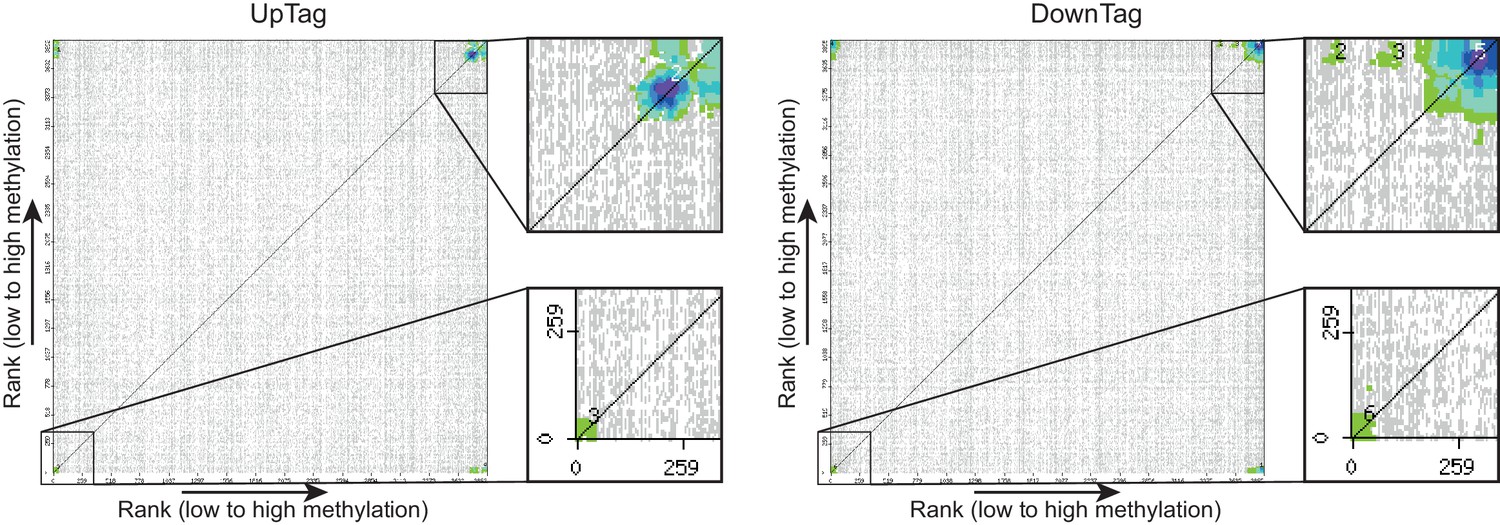
CLIK plots.
This figure is related to the data displayed in Table 1. Plots were generated by the CLIK web tool (http://www.rothsteinlab.com/tools/clik; Dittmar et al., 2013) using lists of ORFs ranked on growth-corrected H3K79me score as input. The main clusters shown in the magnifications were analysed for enriched complexes, and the results of this analysis can be found in Table 1 and Table 1—source data 1.
Figure 4—figure supplement 2
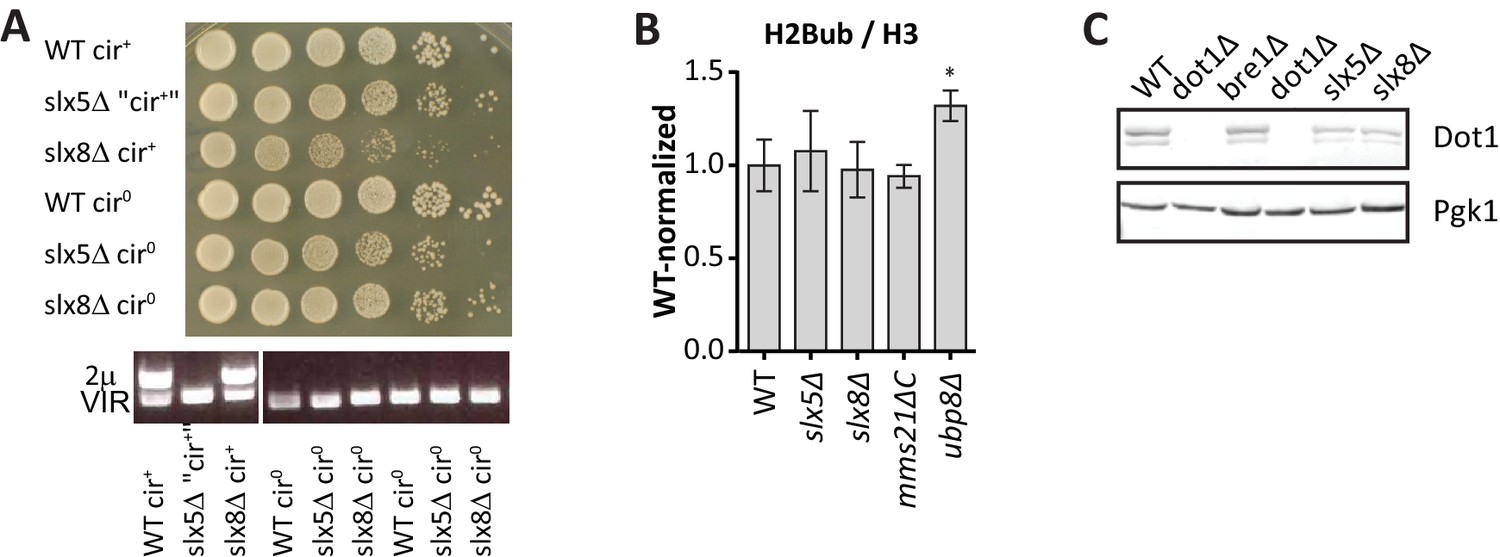
Excluding mechanisms of H3K79me regulation by Slx5, Slx8 and Mms21.
(A) Growth assay after serial dilution on solid media of strains before and after removal of the (endogenous) 2µ plasmid. PCR shows that the plasmid was indeed lost after curing, and that in this case the plasmid had already spontaneously been lost in the slx5Δ strain. Removal of the over-replicated 2µ plasmid relieves the growth defect in slx5Δ and slx8Δ strains, as described previously (Burgess et al., 2007).(B) Mini Epi-ID experiment for ubiquitinated H2B on the indicated strains. H2Bub/H3 was normalized to wild-type. 3–9 replicates each. Comparison with wild-type was done using one-way ANOVA, ubp8Δ is shown for comparison. WT and ubp8Δ data is the same as in Figure 2G. H2Bub level at the UpTag was unaltered in the SUMO-ubiquitin pathway mutants, suggesting that H3K79me regulation occurs through another mechanism. (C) Immunoblot analysis of Dot1 levels in the indicated strains, Pgk1 serves as a loading control. Slx5 and Slx8 do not regulate Dot1 expression level, suggesting that H3K79me regulation occurs through another mechanism.
Figure 5 with 3 supplements

Gcn5 regulates H2B ubiquitination and H3 methylation.
(A) MS analysis of H3K79 methylation levels in wild-type and gcn5Δ strains. Mean and individual data points of two biological replicates. (B) Custom Epi-ID experiment on strains harboring empty or GCN5-encoding CEN plasmids, grown in YC-LEU. Gcn5* contains the F221A mutation, abrogating catalytic activity. H3K79me1/H3 and H3K79me3/H3 are normalized to the mean of ten wild-types, five or six replicates per mutant. (C) Custom Epi-ID results for H2Bub, H3K4me3 and H3K36me3, from the same experiment as shown in panel B. (D) ChIP-qPCR analysis of H2Bub and H3K9ac, normalized to H2B, at the HO promoter near the UpTag. n = 3 each, the wild-type average was set to 1. (E) Immunoblots of a GCN5+ and gcn5Δ strain, showing the levels of (ubiquitinated) H2B, Dot1 and Pgk1 as a loading control. The FLAG blot shows expression levels of Bre1, which was N-terminally FLAG-tagged in these strains. Replicate blots can be found in Figure 5—figure supplement 2A. (F) TAP blots were used to measure the expression levels of C-terminally TAP-tagged versions of the indicated proteins. Representative blot; note that the Rad6-TAP band is only just above the non-specific band indicated with an asterisk. (G) Quantification of the FLAG and TAP blots shown in panels E and F, as well as two TAP blots from independent experiments.
-
Figure 5—source data 1
Raw mass spectrometry data.
- https://doi.org/10.7554/eLife.18919.025
-
Figure 5—source data 2
Data from custom Epi-ID experiment.
- https://doi.org/10.7554/eLife.18919.026
-
Figure 5—source data 3
Data from H2Bub and H3K9ac ChIP-qPCR experiment.
- https://doi.org/10.7554/eLife.18919.027
Figure 5—figure supplement 1
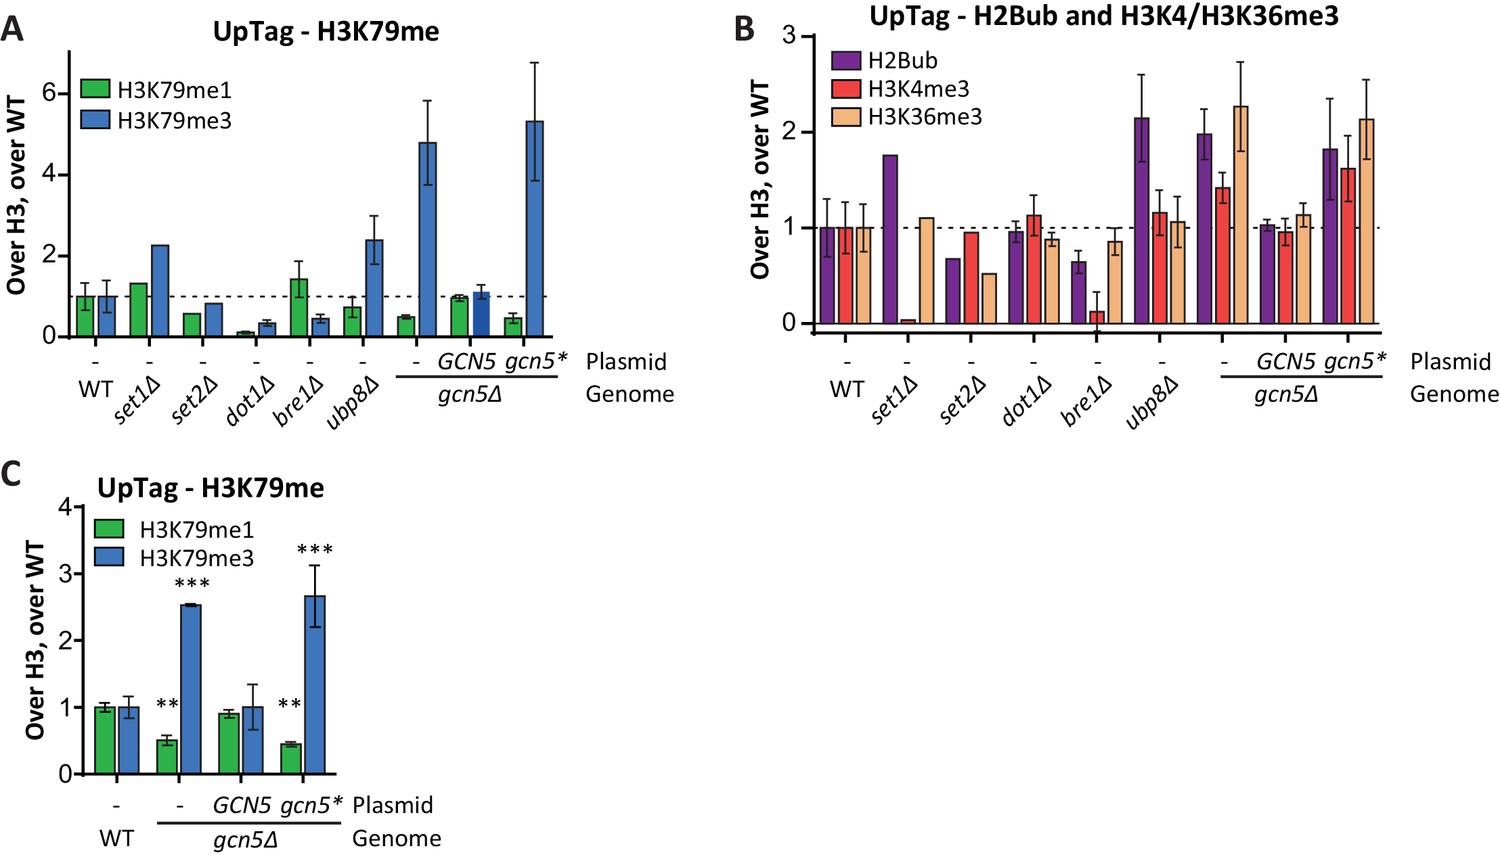
Custom Epi-ID experiments with controls.
(A) Custom Epi-ID experiment shown in Figure 5B, with the control strains included in the experiment. All strains harbored a LEU2 CEN plasmid (empty, or containing GCN5, as indicated) and were grown up in a pool in YC-LEU. Gcn5* bears the F221A mutation, which abrogates catalytic activity. One replicate for set1Δ and set2Δ, three replicates for dot1Δ, bre1Δ and ubp8Δ, 5 or six replicates per gcn5Δ mutant and ten replicates of wild type. (B) Custom Epi-ID results for H2Bub, H3K4me3 and H3K36me3, from the same experiment as shown in panel A. Gcn5 data as shown in Figure 5C. H2Bub and H3K36me3 are expected to be low at this intergenic (promoter-like) locus, explaining why the controls for these marks show smaller decreases than for H3K4me3, which is enriched around the transcription start site. (C) Independent custom Epi-ID experiment. Like in panel A, but with five wild types and three replicates per GCN5 mutant.
Figure 5—figure supplement 2
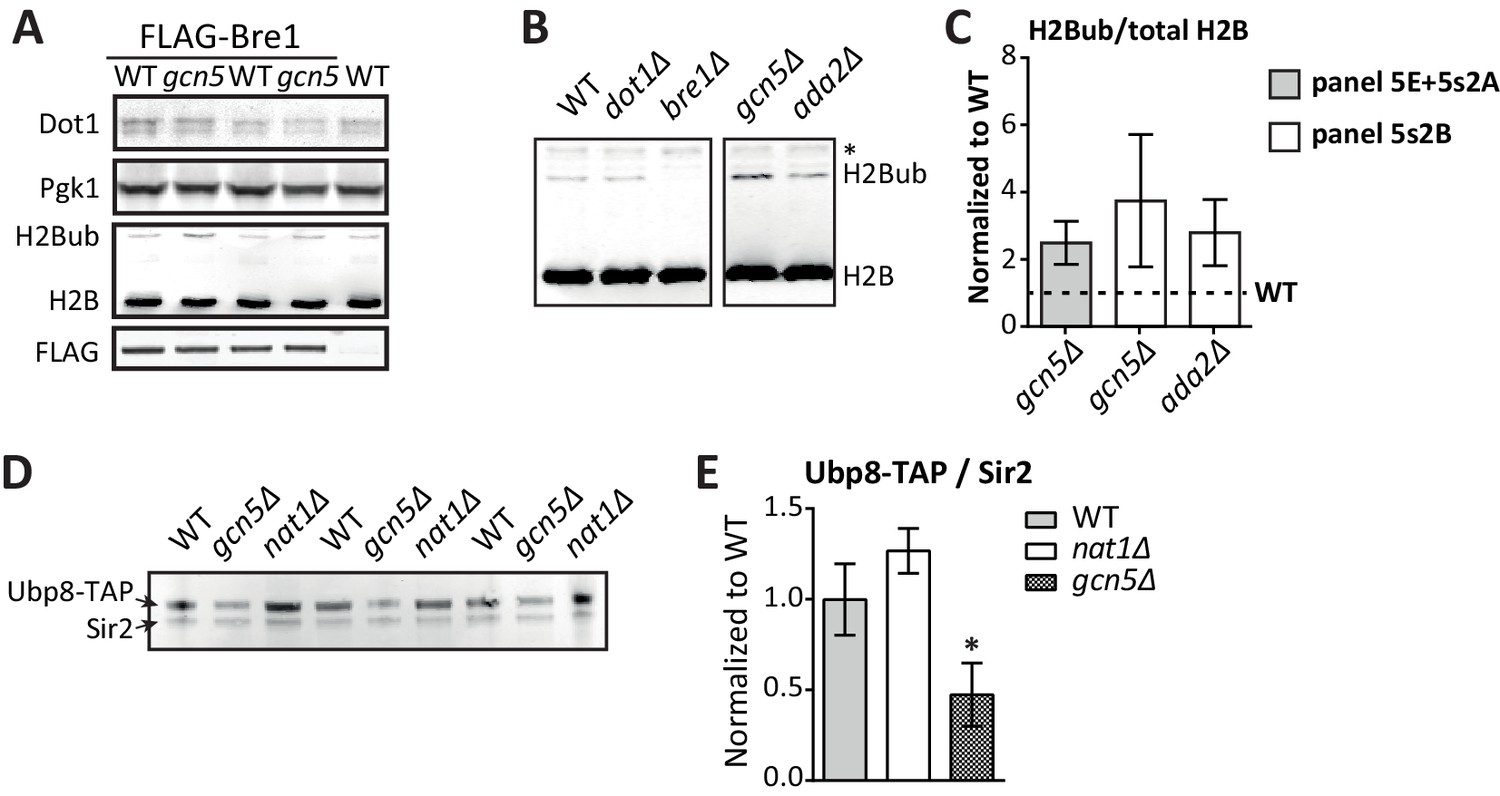
Immunoblots confirming the effect of Gcn5 on global H2Bub and Ubp8 levels.
(A) Replicates of Figure 5E. Immunoblots showing that Gcn5 does not alter Dot1 expression, and causes a global increase in H2Bub. BRE1 harbors an N-terminal FLAG tag in these strains. (B) Immunoblot showing H2B ubiquitination in the indicated strains. All strains were on the same blot, but the blot was cropped to remove irrelevant samples. The asterisk indicates an aspecific band. (C) Immunoblot quantification of H2Bub/H2B levels in mutant strains, normalized to wild-type (1, indicated with a dashed line). (D) Immunoblot showing the effects of GCN5 or NAT1 deletion on Ubp8-TAP abundance in chromatin. Sir2 was used as a loading control. (E) Quantification of the blot shown in D.
Figure 5—figure supplement 3
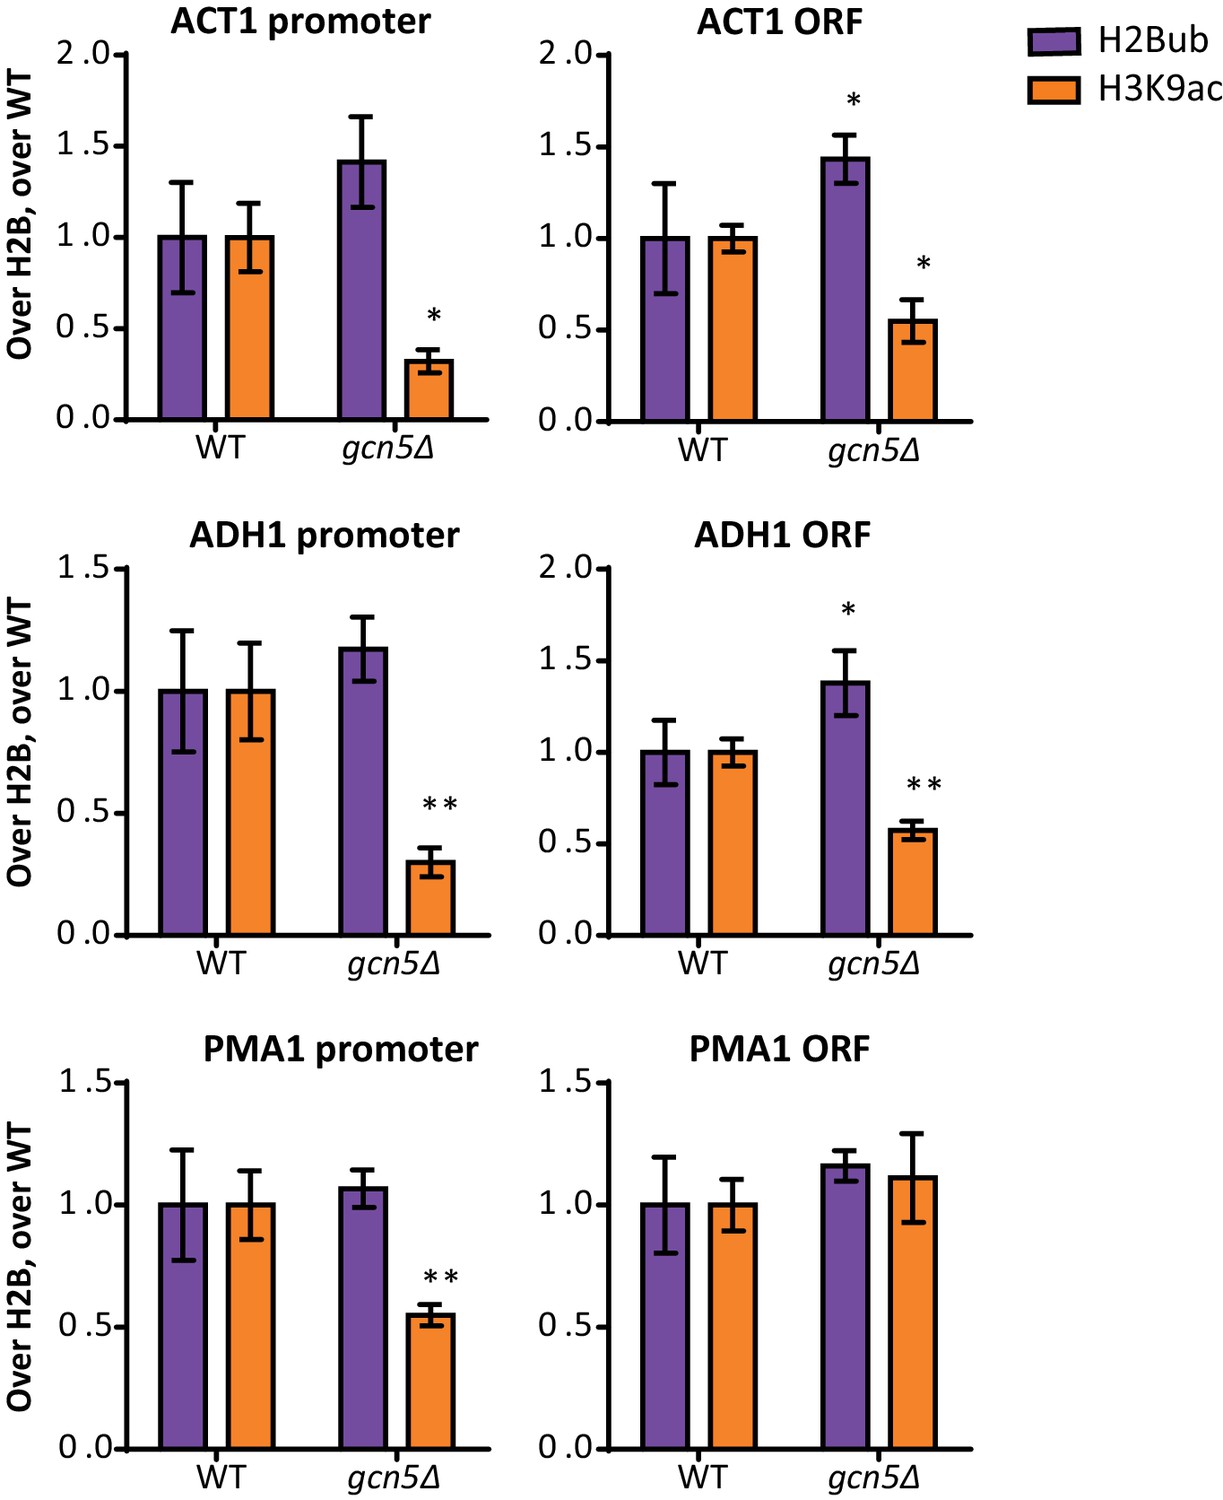
Gcn5 regulates H2Bub and H3K9ac at several loci.
ChIP-qPCR analysis of H2Bub and H3K9ac, normalized to H2B, at several loci. n = 3 each, the wild-type average was set to 1.
Tables
Table 1
Enriched complexes in the candidate regulator groups (thresholds determined by the CLIK tool), on UpTag and DownTag. Complex enrichment was determined by the built-in complex enrichment tool on the CLIK website. Within each group, enriched complexes are ranked by p value, only complexes with a p value below 0.01 are shown. For complexes with an asterisk, all components present in the data were found in the CLIK group.
Complex | Candidate regulators | Not in candidate regulator group | Not in dataset | P value |
|---|---|---|---|---|
Low methylation (positive regulators) on UpTag (top-49 of 4231) | ||||
Lge1/Bre1 complex * | 2 | 0 | 0 | 1.2E-04 |
Low methylation (positive regulators) on DownTag (top-64 of 4238) | ||||
Lge1/Bre1 complex * | 2 | 0 | 0 | 2.1E-04 |
Proteasome complex | 2 | 8 | 3 | 0.009 |
H+-transporting ATPase | 2 | 8 | 3 | 0.009 |
High methylation (negative regulators) on UpTag (top-247 of 4231) | ||||
Rad51-Rad57 * | 5 | 0 | 0 | 4.9E-07 |
SAGA complex | 4 | 5 | 13 | 9.2E-04 |
Slx5/Slx8 complex * | 2 | 0 | 0 | 0.003 |
Mms22/Rtt101/Mms1 complex * | 2 | 0 | 1 | 0.003 |
Mdm12/Mmm1/Mdm10 complex * | 2 | 0 | 1 | 0.003 |
ER V-ATPase assembly complex * | 2 | 0 | 0 | 0.003 |
DNA-directed RNA polymerase II, holoenzyme | 3 | 4 | 8 | 0.005 |
SWI/SNF complex | 3 | 4 | 5 | 0.005 |
High methylation (negative regulators) on DownTag (top-274 of 4238) | ||||
Mediator complex | 6 | 4 | 14 | 1.3E-05 |
Kornberg's mediator (SRB) complex | 6 | 5 | 14 | 2.7E-05 |
Rpd3L complex | 5 | 4 | 3 | 1.2E-04 |
Slx5/Slx8 complex * | 2 | 0 | 0 | 0.004 |
Mms22/Rtt101/Mms1 complex * | 2 | 0 | 1 | 0.004 |
Actin cytoskeleton-regulatory complex * | 2 | 0 | 1 | 0.004 |
Bub1/Bub3 complex * | 2 | 0 | 0 | 0.004 |
Kinetochore | 3 | 4 | 11 | 0.008 |
-
Table 1—source data 1
CLIK groups and complexes enriched in each group.
- https://doi.org/10.7554/eLife.18919.017
Table 2
Enriched processes in the group of candidate negative regulators on the UpTag. Enrichment determined by PANTHER (Mi et al., 2016). Terms are organized by hierarchy; daughter terms are indented. P values were Bonferroni-corrected.
| GO biological process complete | Enrichment | p value |
|---|---|---|
| DNA metabolic process (GO:0006259) | 2.3 | 5.2E-03 |
| cellular response to DNA damage stimulus (GO:0006974) | 2.9 | 1.8E-04 |
| > DNA repair (GO:0006281) | 3.2 | 4.6E-05 |
| > > double-strand break repair (GO:0006302) | 4.4 | 8.8E-04 |
| > > recombinational repair (GO:0000725) | 5.9 | 1.2E-04 |
| > > > double-strand break repair via homologous recombination (GO:0000724) | 5.5 | 5.2E-03 |
| chromosome organization (GO:0051276) | 2.3 | 6.3E-04 |
| macromolecular complex subunit organization (GO:0043933) | 1.8 | 7.7E-03 |
Additional files
-
Supplementary file 1
Yeast strains used in this study.
- https://doi.org/10.7554/eLife.18919.031
-
Supplementary file 2
Plasmids used in this study.
- https://doi.org/10.7554/eLife.18919.032
-
Supplementary file 3
Primers used in the study.
- https://doi.org/10.7554/eLife.18919.033
-
Supplementary file 4
Statistical tests performed in the study.
- https://doi.org/10.7554/eLife.18919.034
Download links
A two-part list of links to download the article, or parts of the article, in various formats.
Downloads (link to download the article as PDF)
Open citations (links to open the citations from this article in various online reference manager services)
Cite this article (links to download the citations from this article in formats compatible with various reference manager tools)
Direct screening for chromatin status on DNA barcodes in yeast delineates the regulome of H3K79 methylation by Dot1
eLife 5:e18919.
https://doi.org/10.7554/eLife.18919


