KEAP1 loss modulates sensitivity to kinase targeted therapy in lung cancer
- Dana-Farber Cancer Institute, United States
- Broad Institute of Harvard and MIT, United States
- Brigham and Women’s Hospital and Harvard Medical School, United States
- Novartis Institute for Biomedical Research, United States
- Massachusetts General Hospital, Harvard Medical School, United States
- Beth Israel Deaconess Medical Center, Harvard Medical School, United States
Figures
Figure 1 with 6 supplements
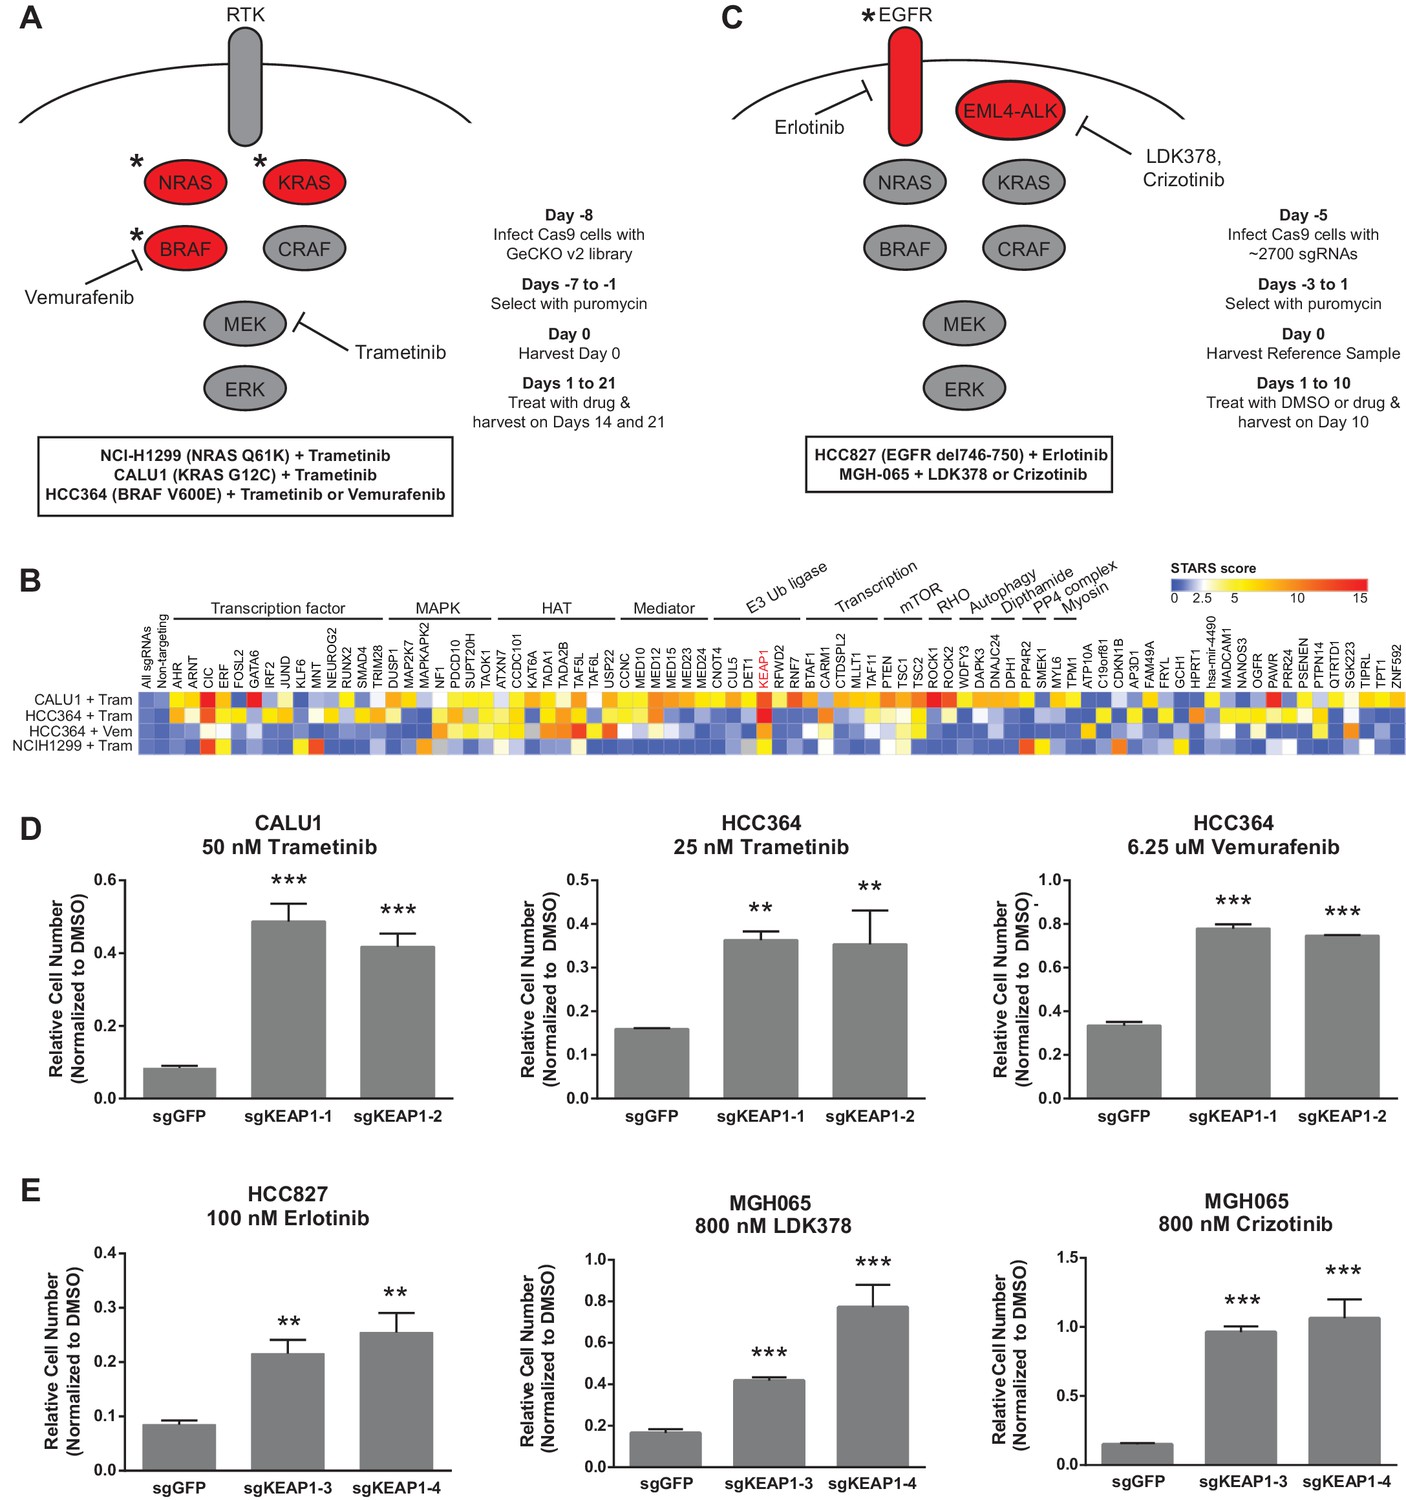
CRISPR-Cas9 genome scale drug resistance screens and validation that KEAP1-KO confers resistance.
(A,C) Pathway schematics and screening timelines. (B) Heatmap showing the STARS score for each gene with a score of at least five in at least one screen. (D–E) Crystal violet colony formation assays. (D) 5000 CALU1 cells were treated with 50 nM trametinib for 17 days. 2000 HCC364 cells were treated with 25 nM trametinib or 6.25 uM vemurafenib for 21 days. (E) 10,000 HCC827 cells were treated with 100 nM erlotinib for 10 days. 10,000 MGH065 cells were treated with 800 nM LDK378 or 800 nM crizotinib for 10 days. Error bars represent the SD of the mean of triplicate wells. Experiments were performed two independent times and one representative experiment is shown. ***p=0.0001, **p<0.005.
Figure 1—figure supplement 1
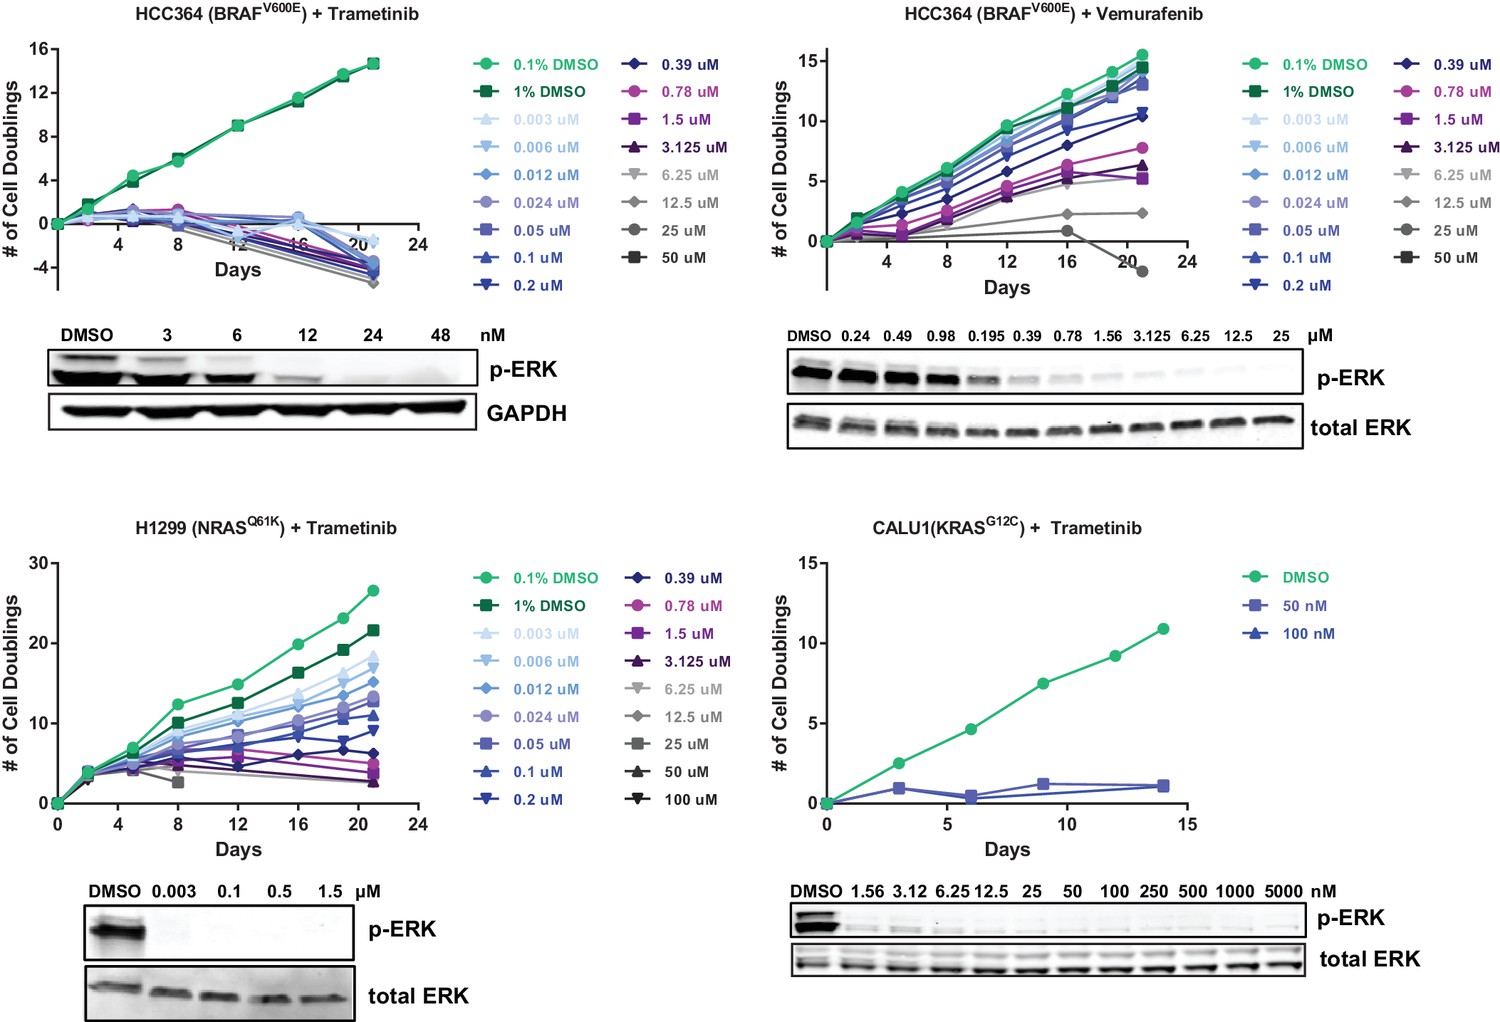
Optimization of genome scale screening conditions.
Cells were treated with the indicated concentration of drug. Cells were passaged or fresh media containing drug was added every 3–4 days. Cells were counted at each passage, and the number of population doublings is shown. In parallel, cells were treated with the indicated concentrations of drug for 90 min. Cell lysates were blotted with p-ERK antibody as a marker of BRAF/MEK inhibition. For the CRISPR-Cas9 screens, HCC364 cells were treated with 24 nM trametinib or 6.25 µM vemurafenib, H1299 cells were treated with 1.5 µM trametinib, and CALU1 cells were treated with 50 nM trametinib.
Figure 1—figure supplement 2
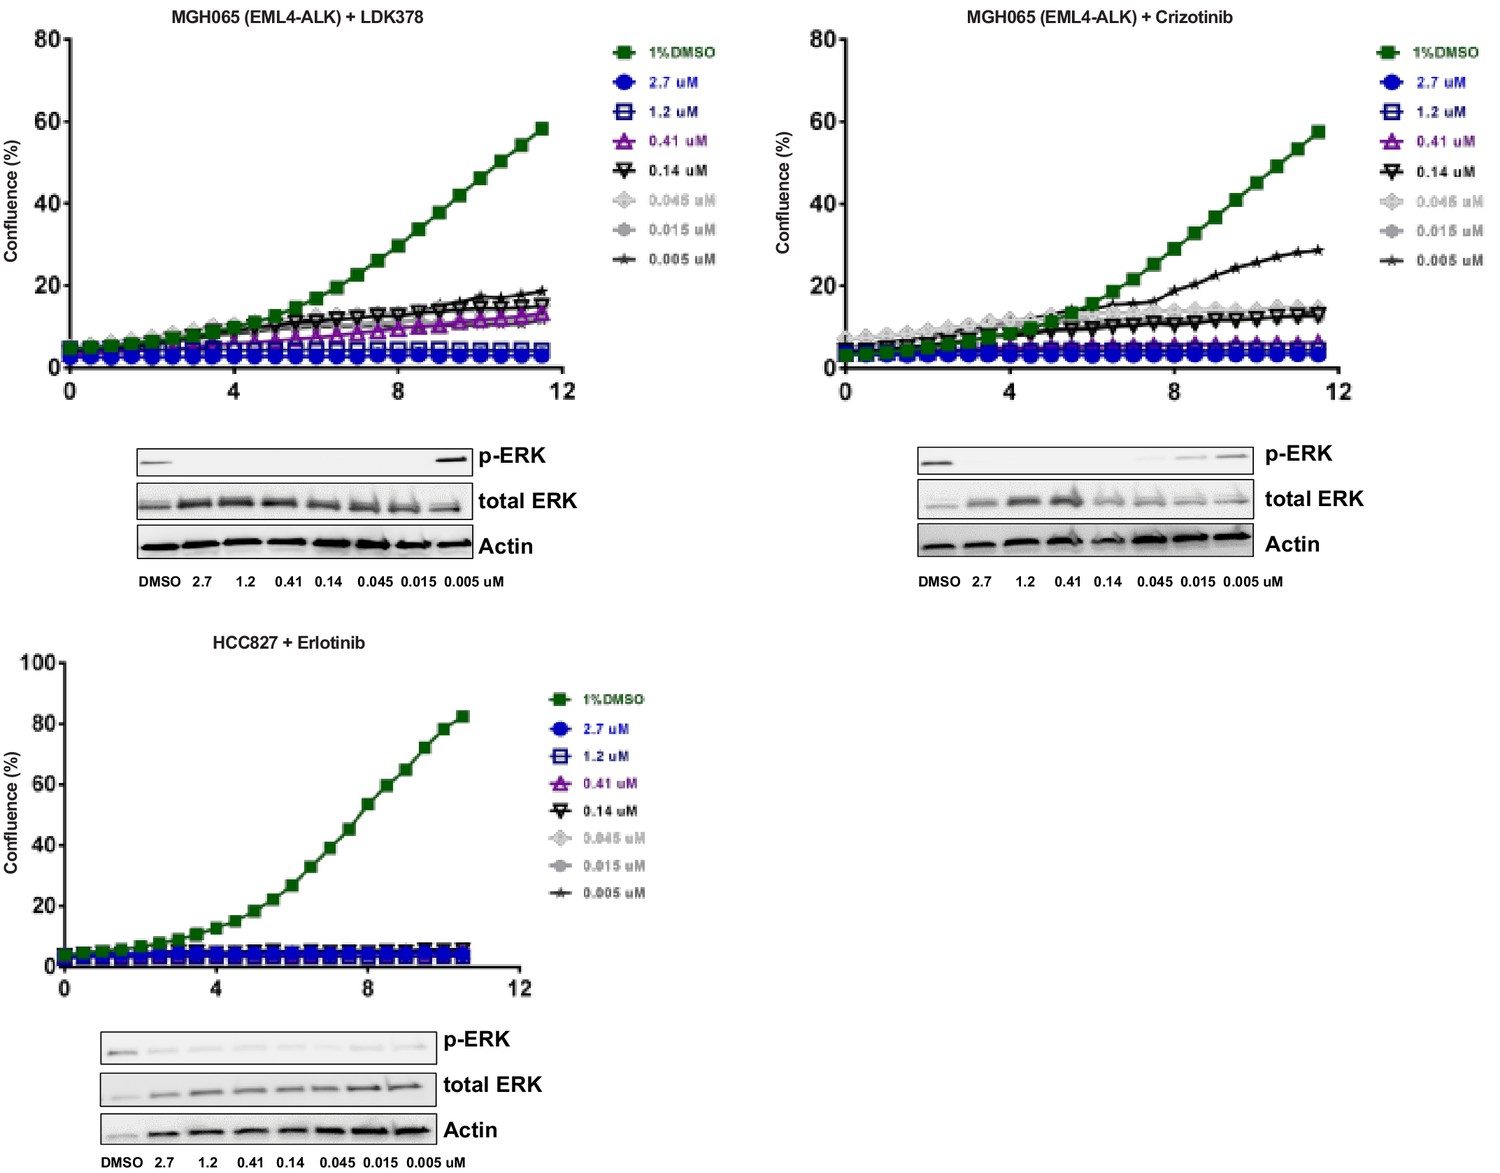
Optimization of focused sgRNA library screening conditions.
Cells were treated with the indicated concentration of drug. Live cell time-lapse imaging was used to measure cell confluence to determine optimal drug concentrations. In parallel, cells were treated with the indicated concentrations of drug for 90 min. Cell lysates were blotted with p-ERK antibody as a marker of ALK or EGFR inhibition. For the CRISPR-Cas9 screens, MGH-065 cells were treated with 500 nM LDK378 or crizotinib. HCC827 cells were treated with 10 nM erlotinib.
Figure 1—figure supplement 3
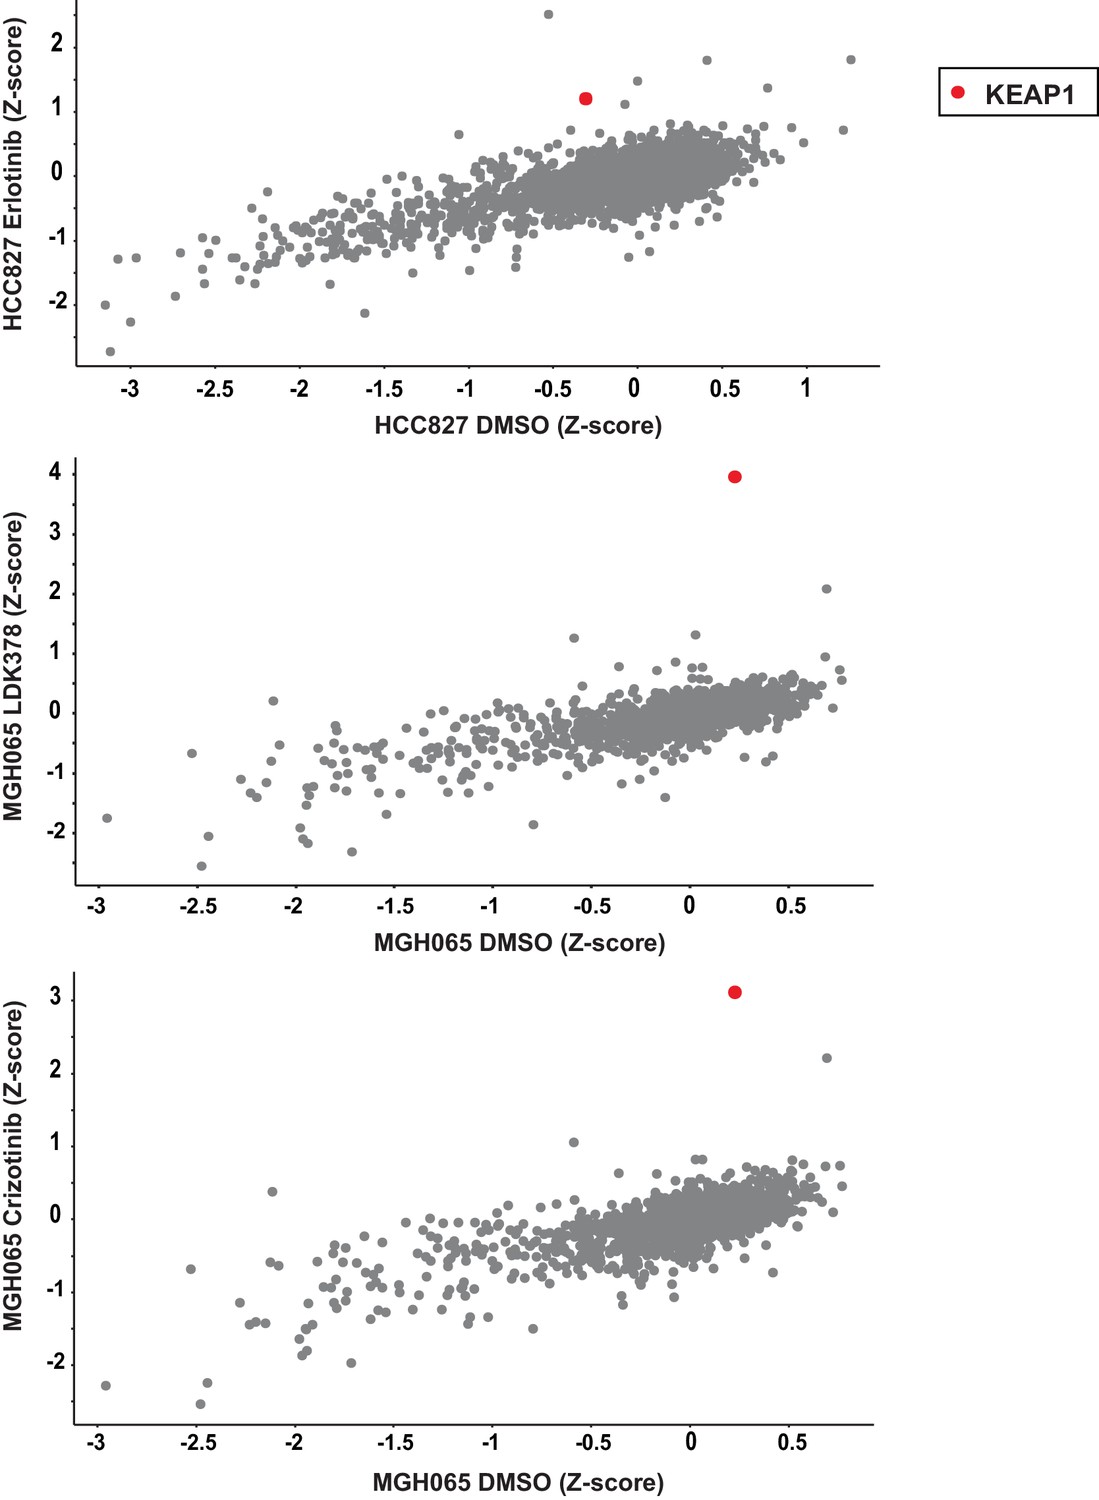
EGFR and ALK inhibitor resistance screens.
HCC827 cells were treated with 10 nM erlotinib. MGH-065 cells were treated with 500 nM LDK378 or crizotinib.
Figure 1—figure supplement 4
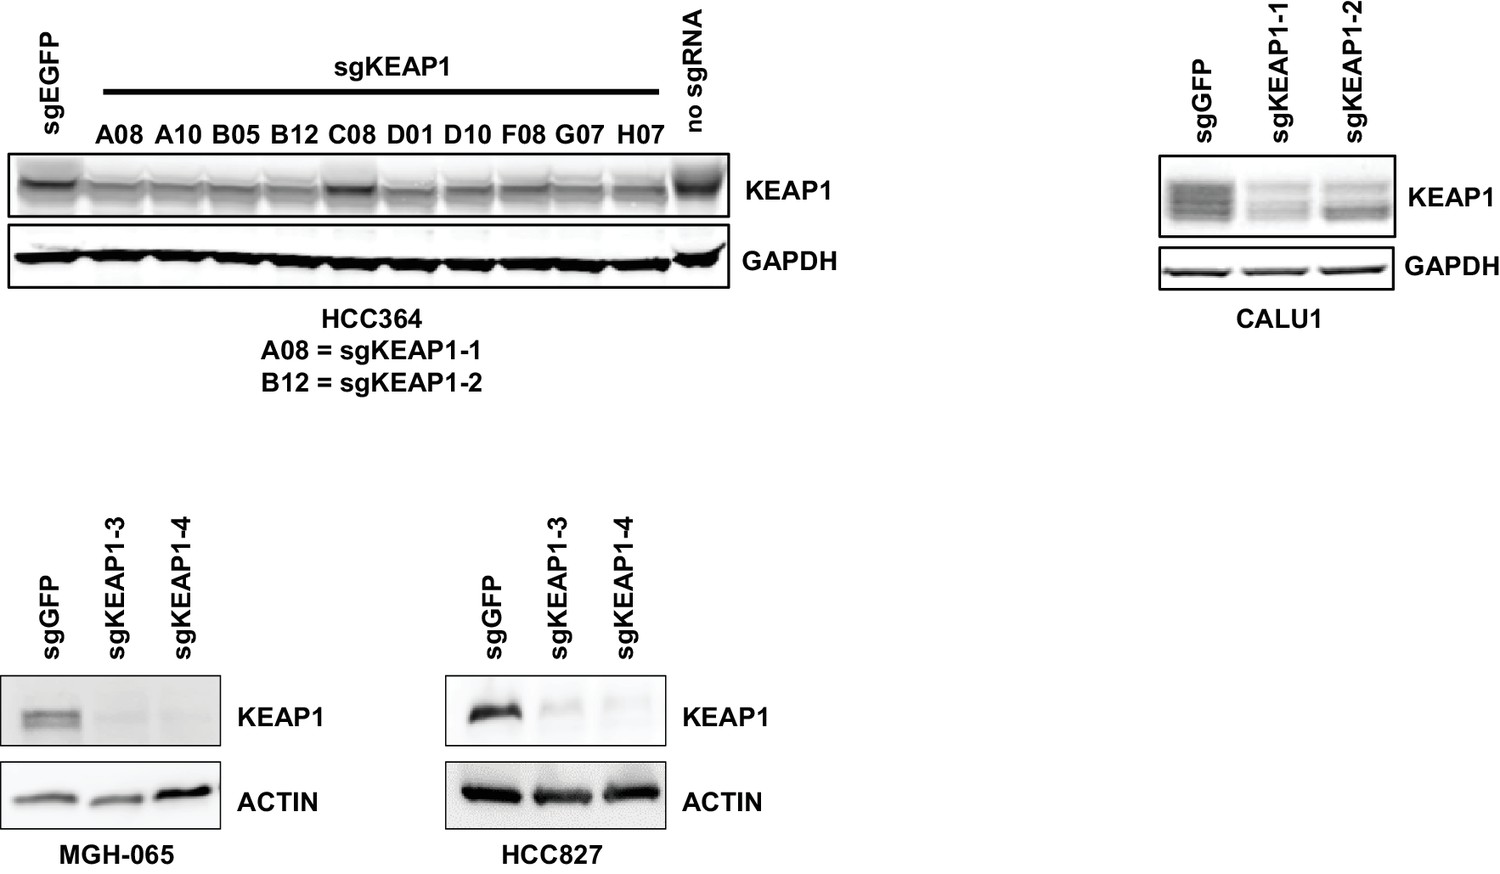
Immunoblots showing deletion of KEAP1 by sgRNAs in HCC364, CALU1, MGH-065, and HCC827.
https://doi.org/10.7554/eLife.18970.006
Figure 1—figure supplement 5

Crystal violet assays showing that KEAP1 loss confers resistance to afatinib and crizotinib.
1000 H1975 cells were treated with 100 nM afatinib for 10 days. 1000 H3122 cells were treated with 200 nM crizotinib for 14 days. Error bars represent the SD of the mean of triplicate wells. Experiments were performed two independent times and one representative experiment is shown. ***p<0.0001, **p<0.005.
Figure 1—figure supplement 6
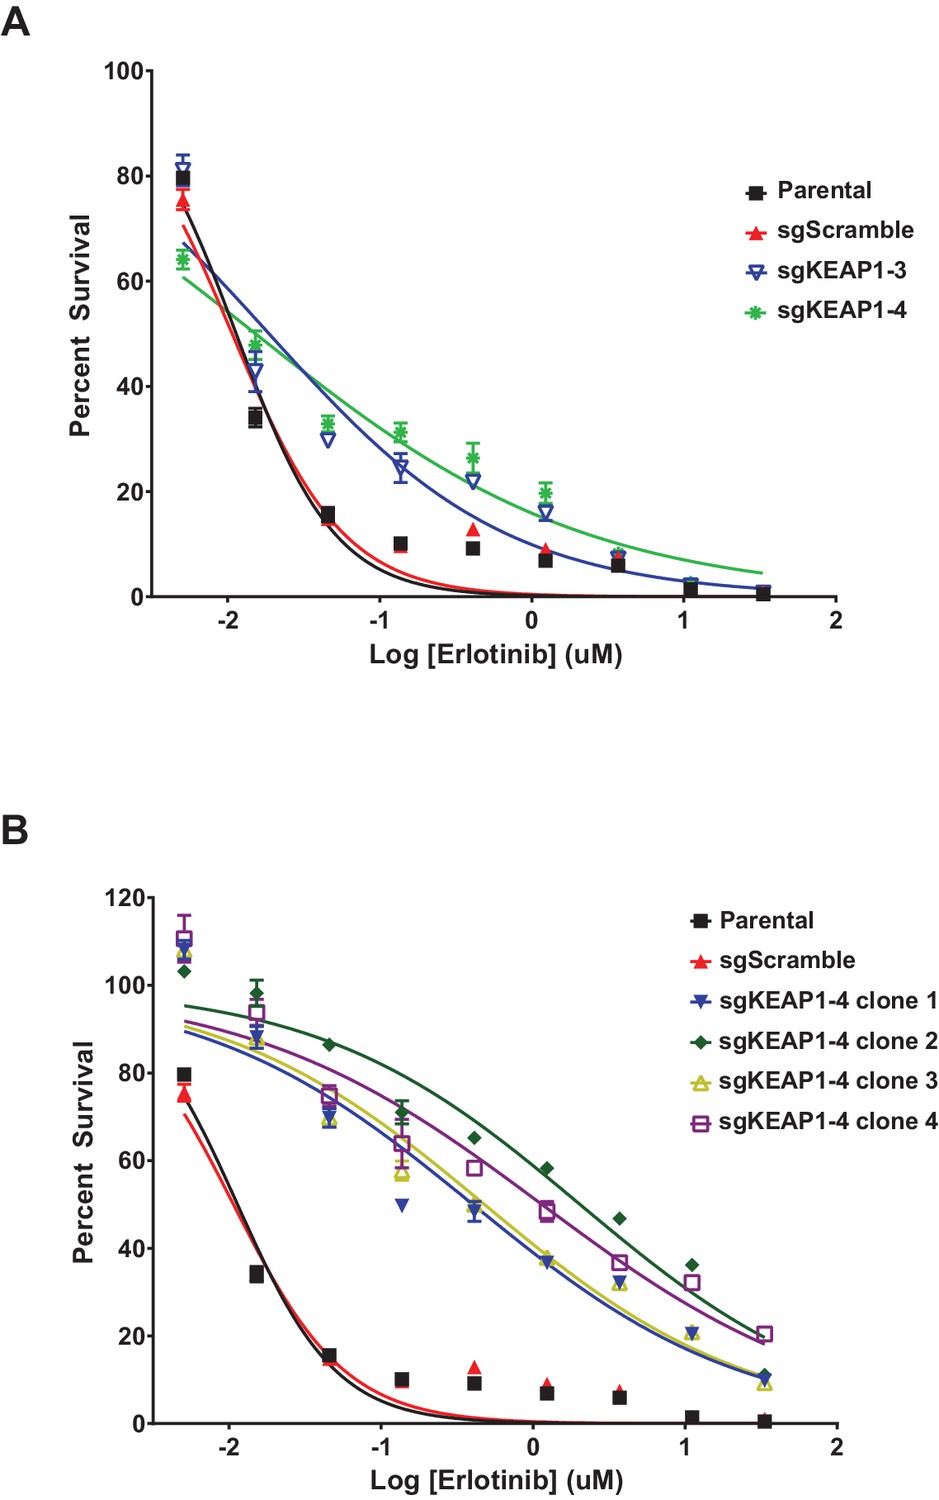
Erlotinib dose-response curves in HCC827.
(A) Dose-response curves were performed in HCC827 parental cells or the bulk population of sgKEAP1 cells. (B) Dose-response curves were performed in HCC827 parental cells or single-cell clones derived from sgKEAP1–4 cells.
Figure 2 with 2 supplements
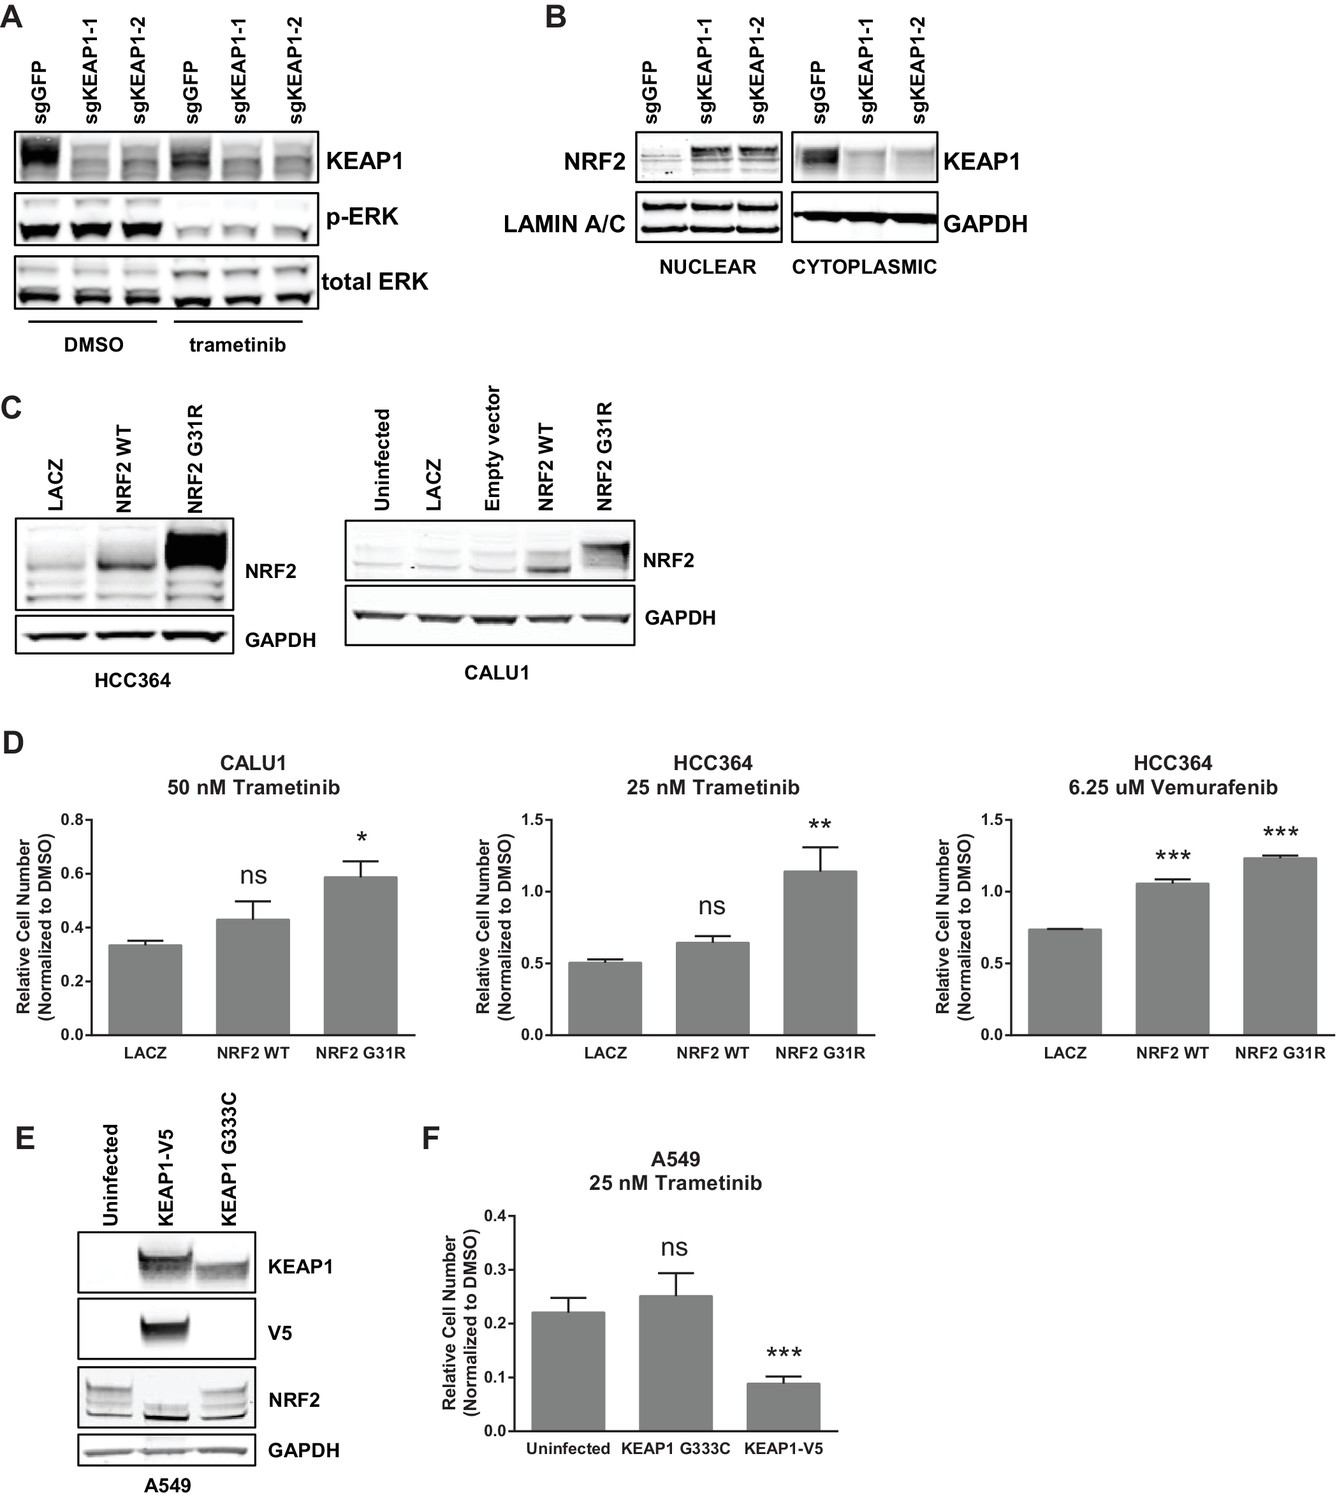
KEAP1-KO alters NRF2 levels.
(A) KEAP1-KO does not affect p-ERK. Whole cell lysates of HCC364-Cas9 cells with the indicated sgRNAs treated with DMSO or trametinib for 48 hr. (B) KEAP1-KO increases NRF2 levels. Nuclear and cytoplasmic fractions of HCC364 cells. (C) Immunoblot showing NRF2 expression in CALU1 and HCC364. (D) Crystal violet colony formation assays. 10,000 CALU1 cells expressing the indicated ORFs were treated with DMSO for 8 days or trametinib for 10 Days. 10,000 HCC364 cells expressing the indicated ORFs were treated with DMSO for 10 days or trametinib/vemurafenib for 21 days. Error bars represent the SD of the mean of triplicate wells. (E) Immunoblot showing expression of wildtype KEAP1 or KEAP1 G333C in A549 cells. (F) Expression of wildtype KEAP1 resensitized A549 cells to trametinib. 5000 cells were treated with 25 nM trametinib for 12 days. Error bars represent the SD of six wells. (A–F) Experiments were performed two independent times, and one representative experiment is shown. ***p=0.0001, **p=0.0005, *p<0.002.
Figure 2—figure supplement 1

KEAP1-KO alters NRF2 levels and does not activate ERK.
(A) Immunoblot showing p-ERK suppression in 72 hr erlotinib-treated sgKEAP1 HCC827 cells. (B) Immunoblot showing p-ERK suppression and BIM expression in 14 day trametinib-treated HCC364 and CALU1 cells. (C) Immunoblot showing increase in NRF2 upon KEAP1 knockout in CALU1, MGH-065, and HCC827. For MGH-065 and HCC827, loading controls are the same as in Figure 1—figure supplement 4.
Figure 2—figure supplement 2
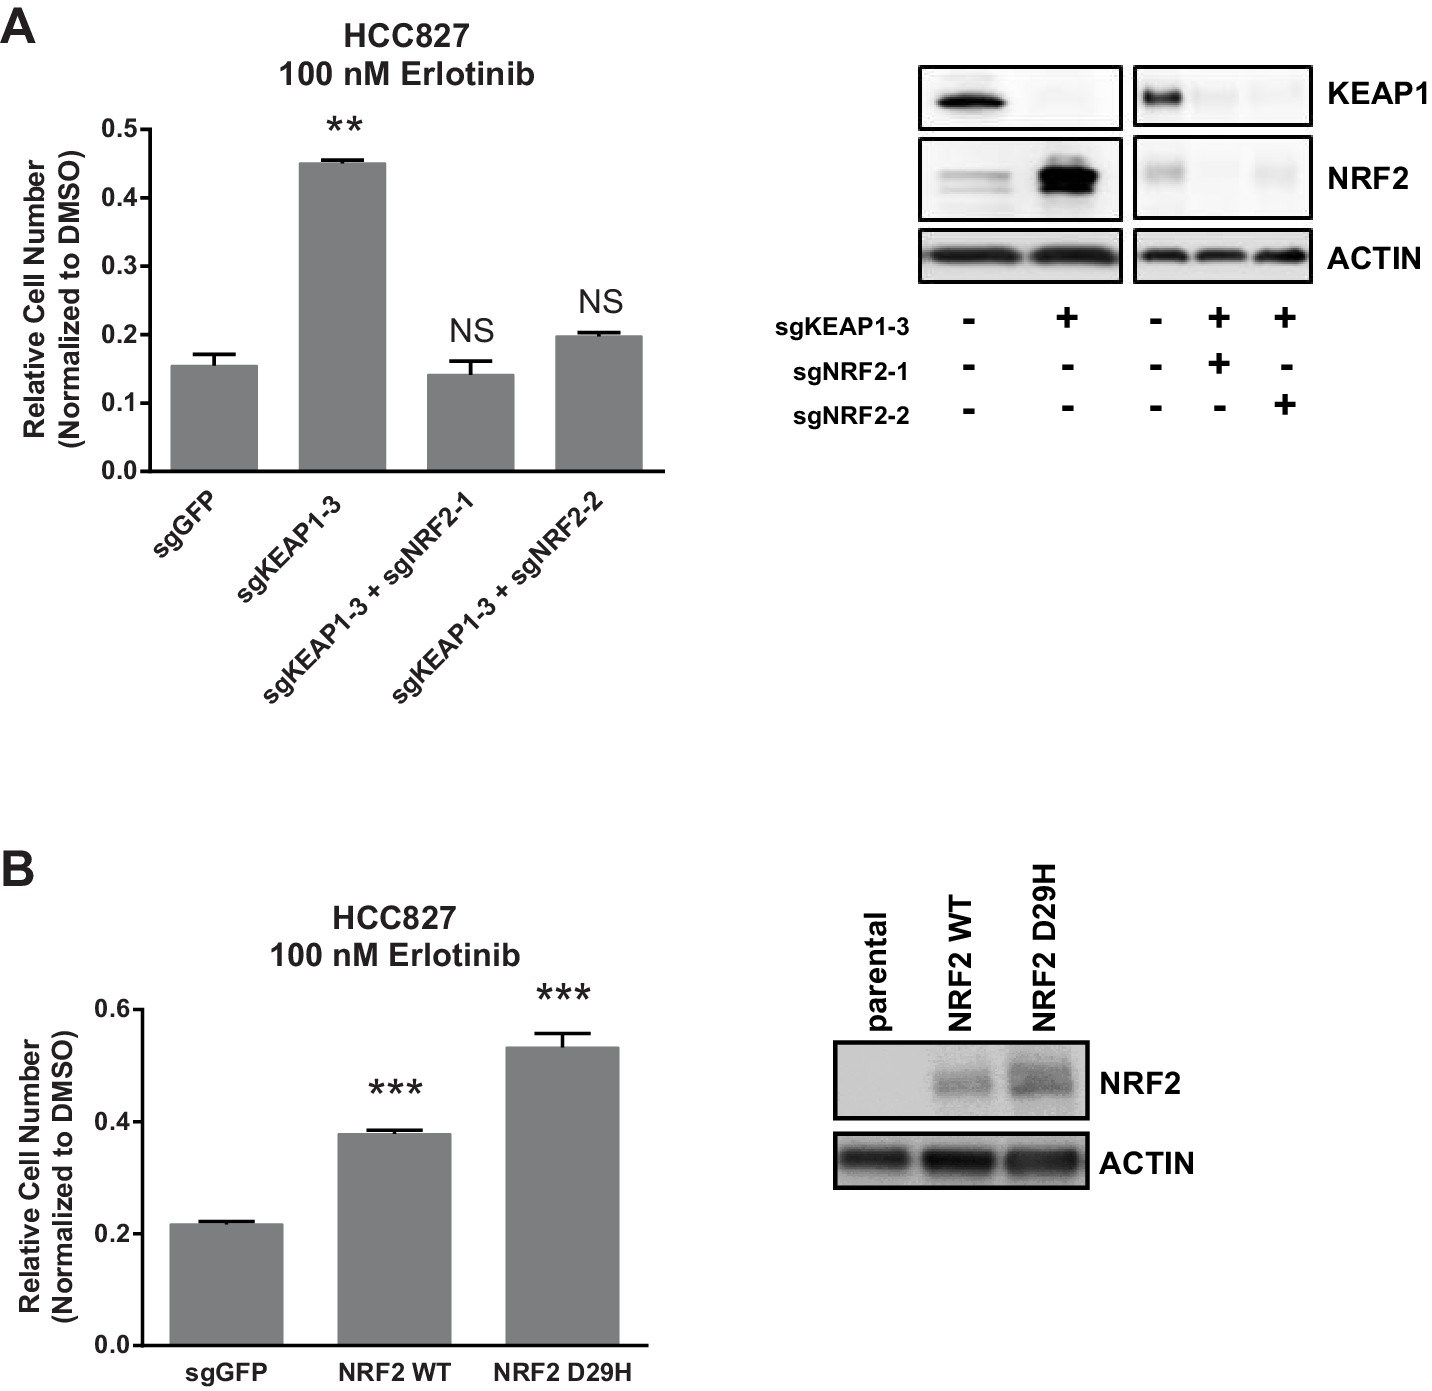
NRF2 is necessary and sufficient for resistance.
10,000 HCC827 cells were treated with 100 nM erlotinib for 10 days. Error bars represent the SD of the mean of triplicate wells. ***p<0.0001, **p<0.005.
Figure 3 with 2 supplements
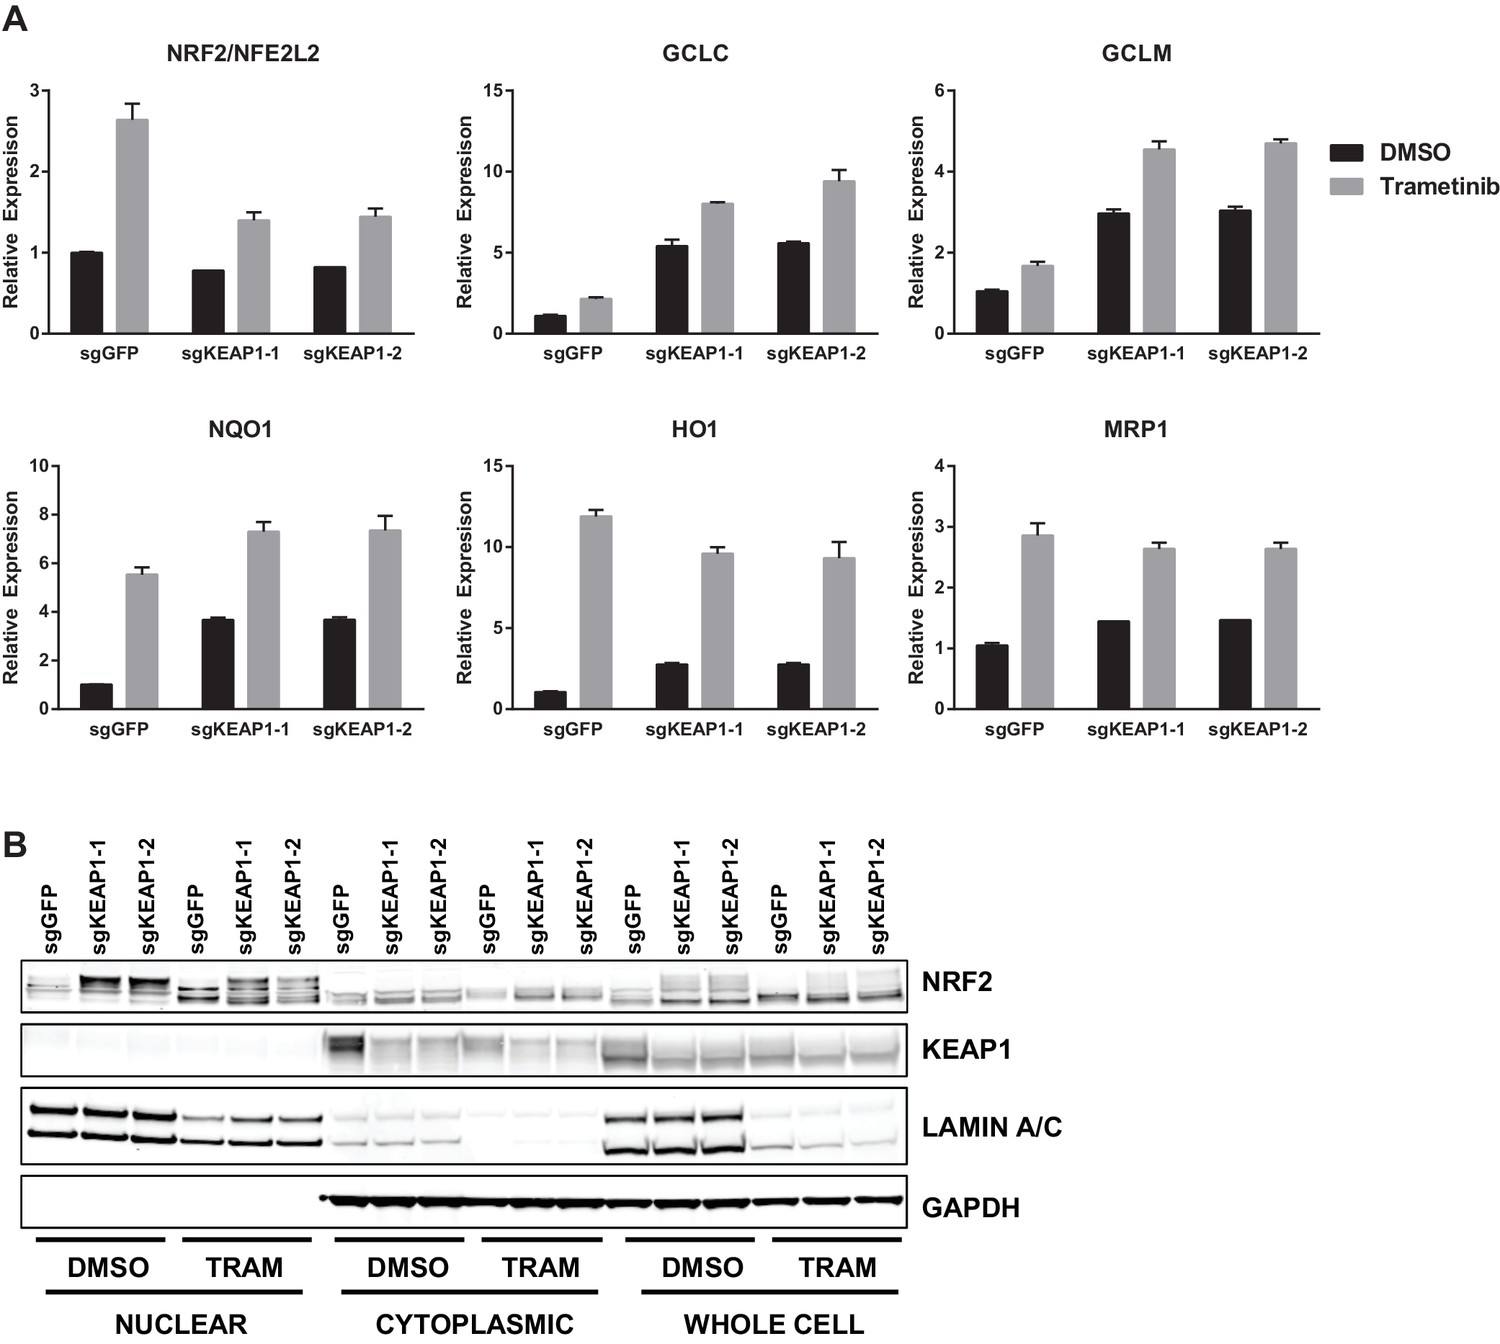
Trametinib treatment and KEAP1-KO increase NRF2 activity.
(A) Expression of NFE2L2/NRF2 mRNA and NRF2 target genes in HCC364 treated with DMSO or trametinib for 72 hr. Error bars represent the SD of the mean of three biological replicates. (B) HCC364 cells treated with DMSO or trametinib for 72 hr. TRAM, trametinib. (A,B) Experiments were performed two independent times, and one representative experiment is shown.
Figure 3—figure supplement 1
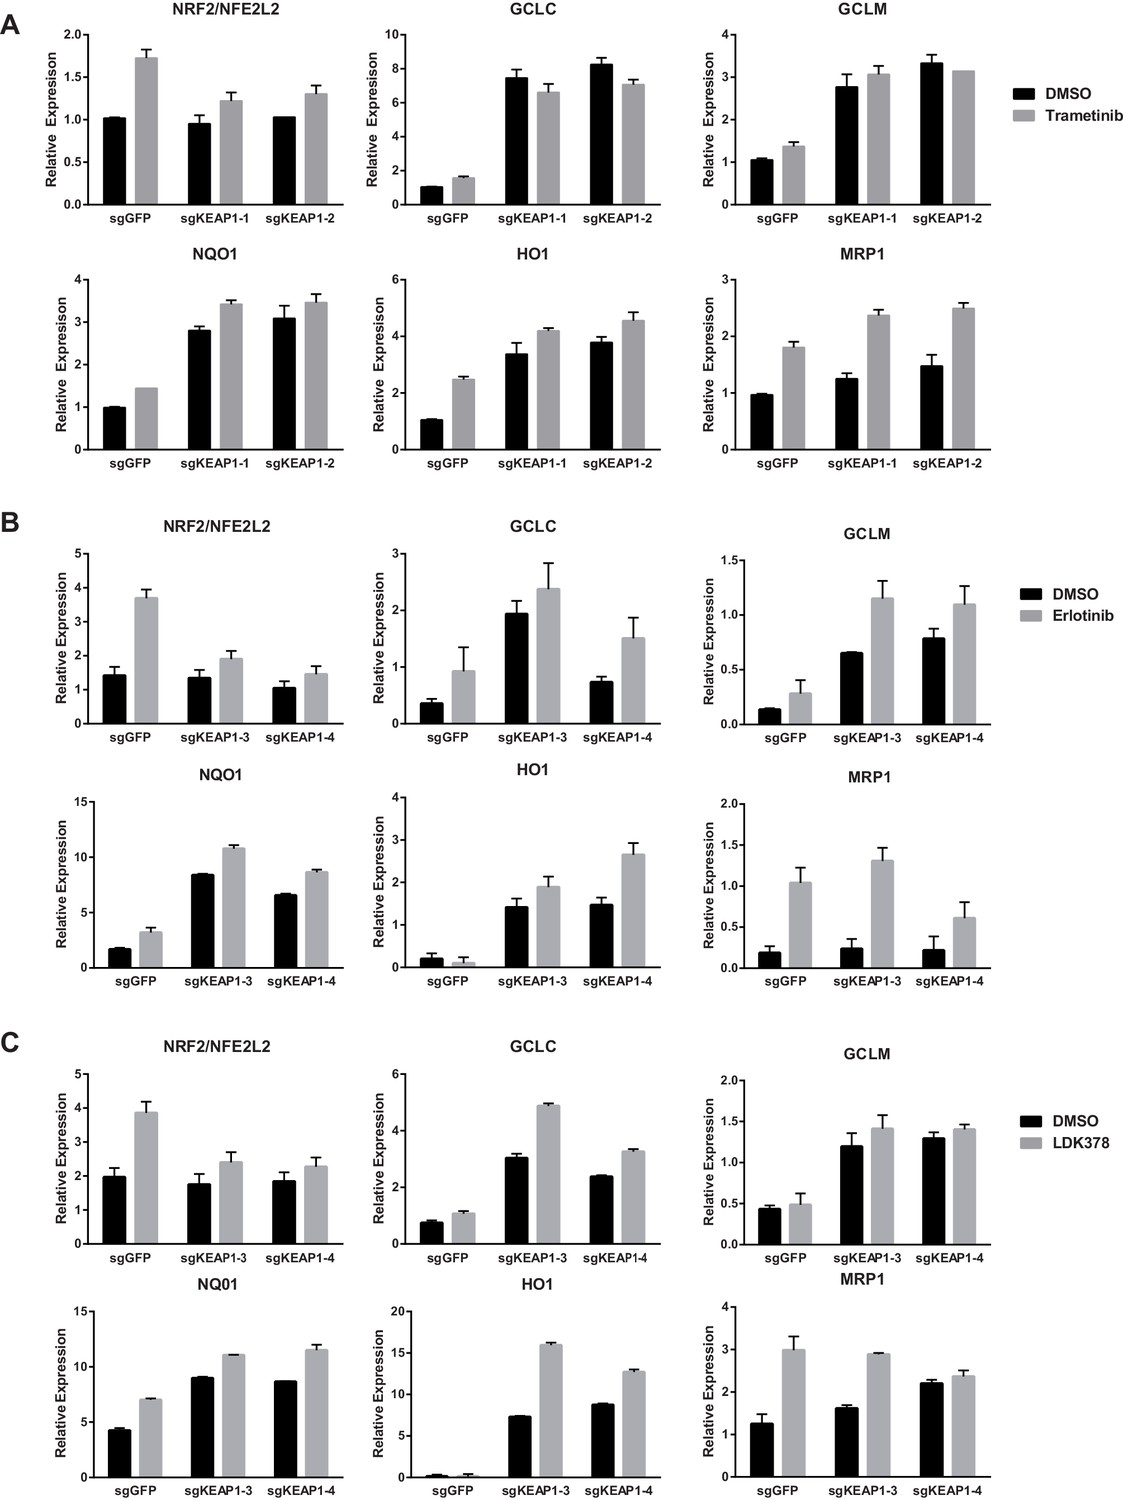
Expression of NFE2L2/NRF2 mRNA and NRF2 target genes in (A) CALU1 cells, (B) HCC827 cells, or (C) MGH-065 cells treated with DMSO or the indicated drug for 72 hr.
Error bars represent the SD of the mean of biological triplicates.
Figure 3—figure supplement 2
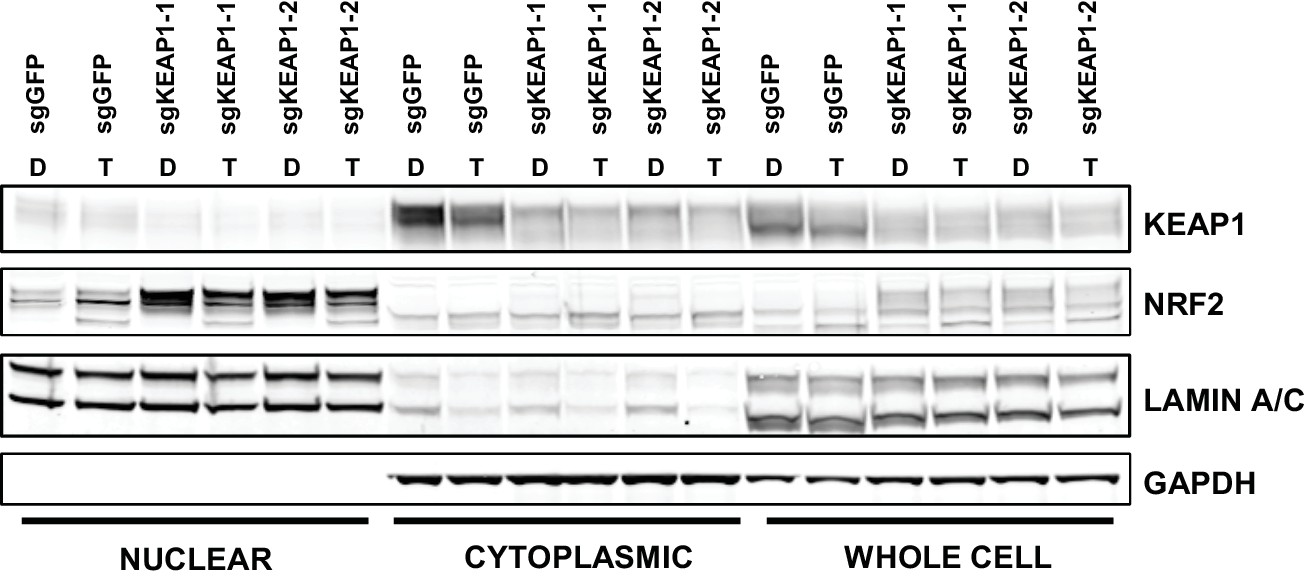
CALU1 cells treated with DMSO or trametinib for 72 hr.
D, DMSO; T, trametinib.
Figure 4 with 4 supplements
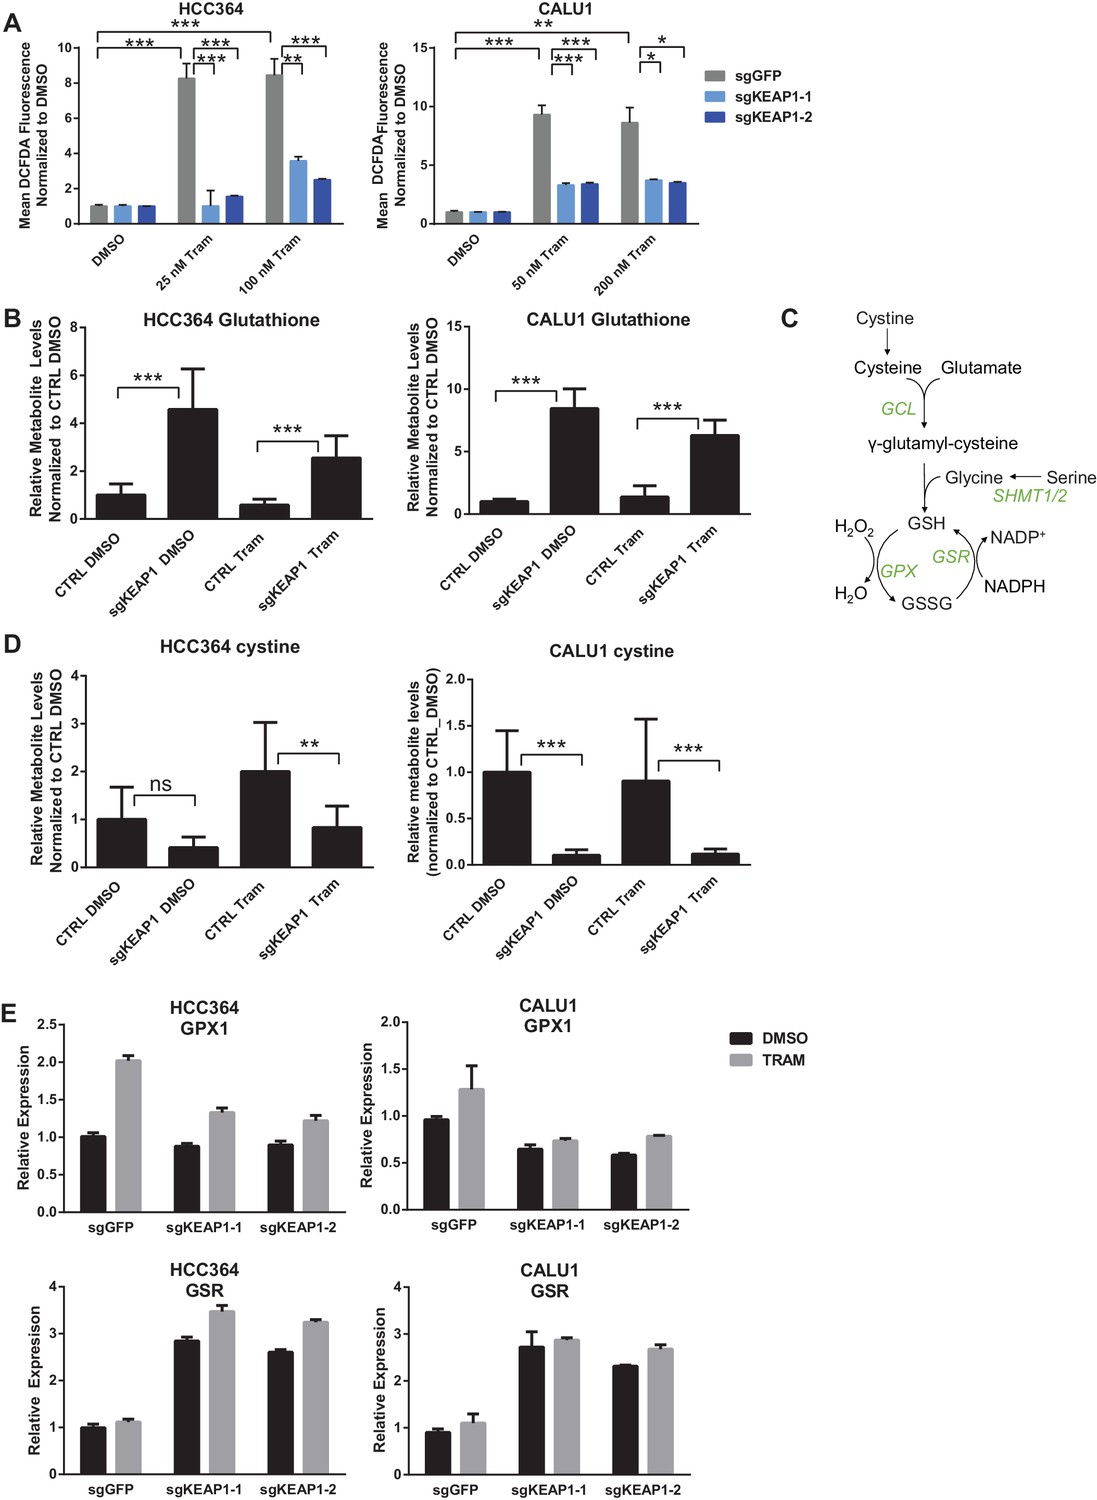
KEAP1-KO reduces trametinib-induced ROS through increased glutathione synthesis.
(A) HCC364 or CALU1 cells were treated with DMSO or trametinib for 72 hr. ROS was measured by DCFDA fluorescence. Error bars represent SD of the mean of two biological replicates. (B, D) CALU1 or HCC364 cells were treated with DMSO or trametinib for 72 hr and metabolites were measured by liquid chromatography tandem mass spectrometry. Error bars represent SD of eight replicates. (C) Glutathione synthesis pathway. (E) Expression of GPX1 and GSR in HCC364 and CALU1 cells treated with DMSO or trametinib for 72 hr. Error bars represent the SD of the mean of three biological replicates. ***p<0.005, **p<0.01, *p<0.02.
Figure 4—figure supplement 1
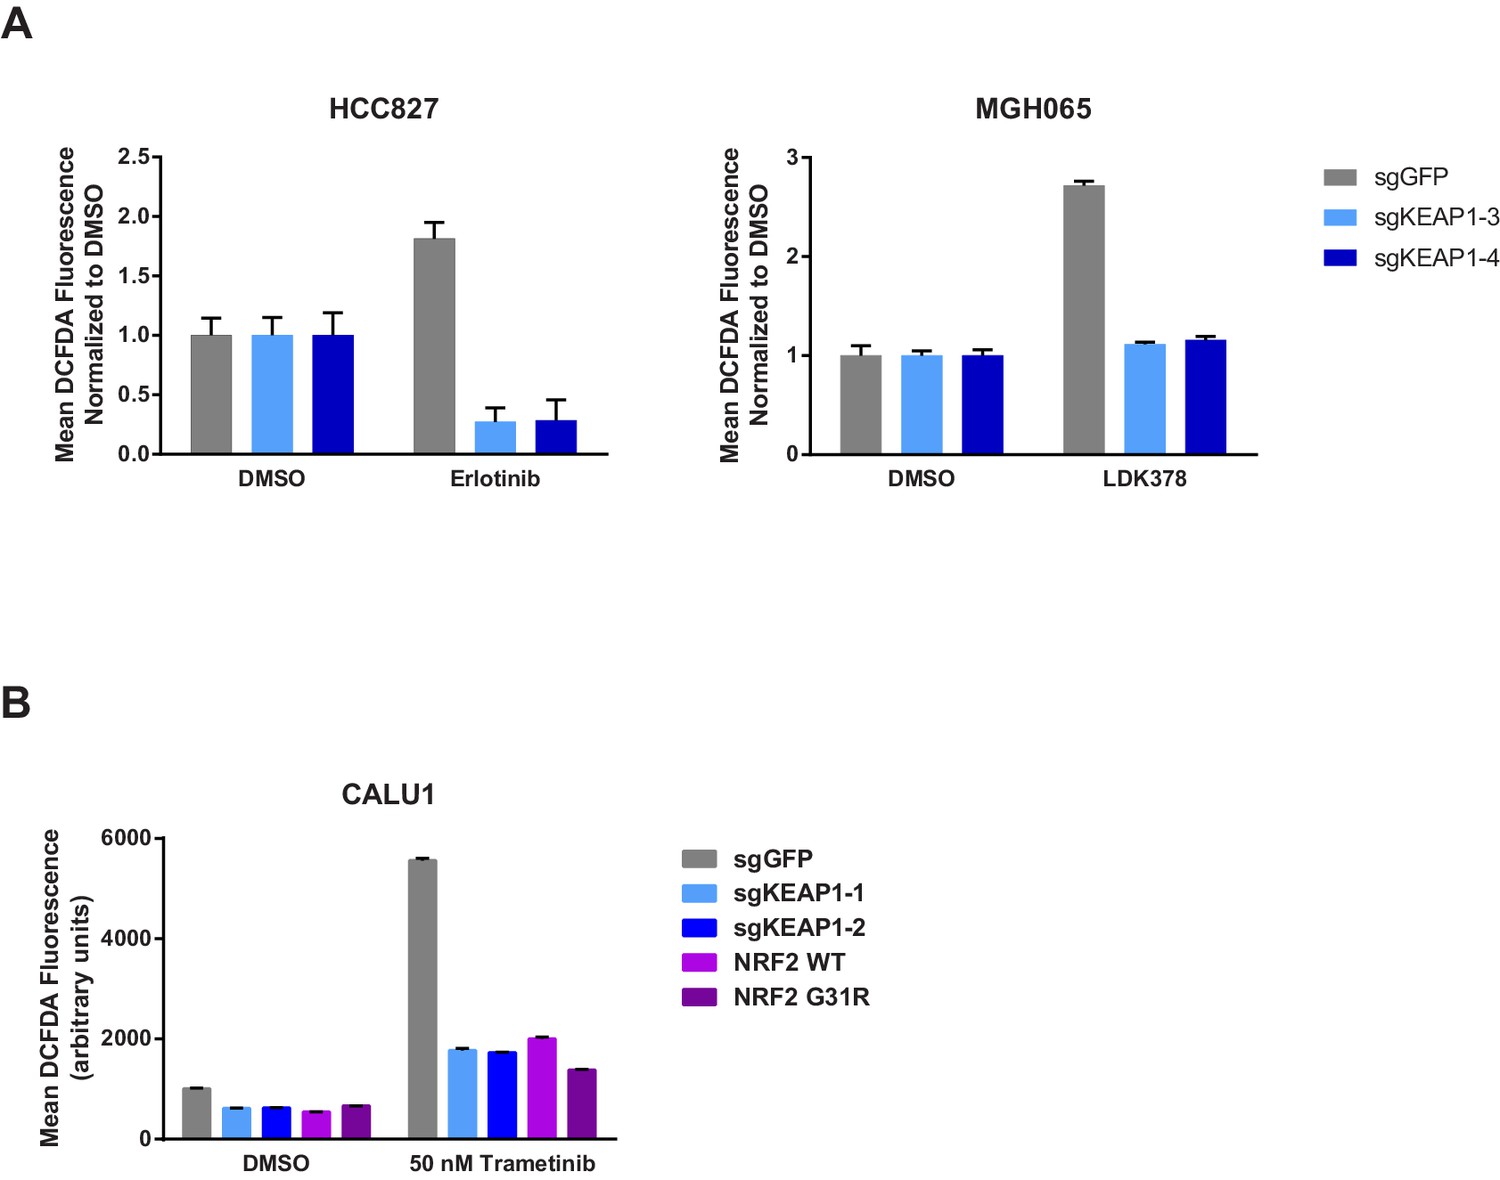
KEAP1-KO reduces drug-induced ROS.
(A) HCC827 or MGH065 cells or (B) CALU1 cells were treated with DMSO or drug for 72 hr. ROS was measured by DCFDA fluorescence. Error bars represent SD of the mean of two biological replicates.
Figure 4—figure supplement 2
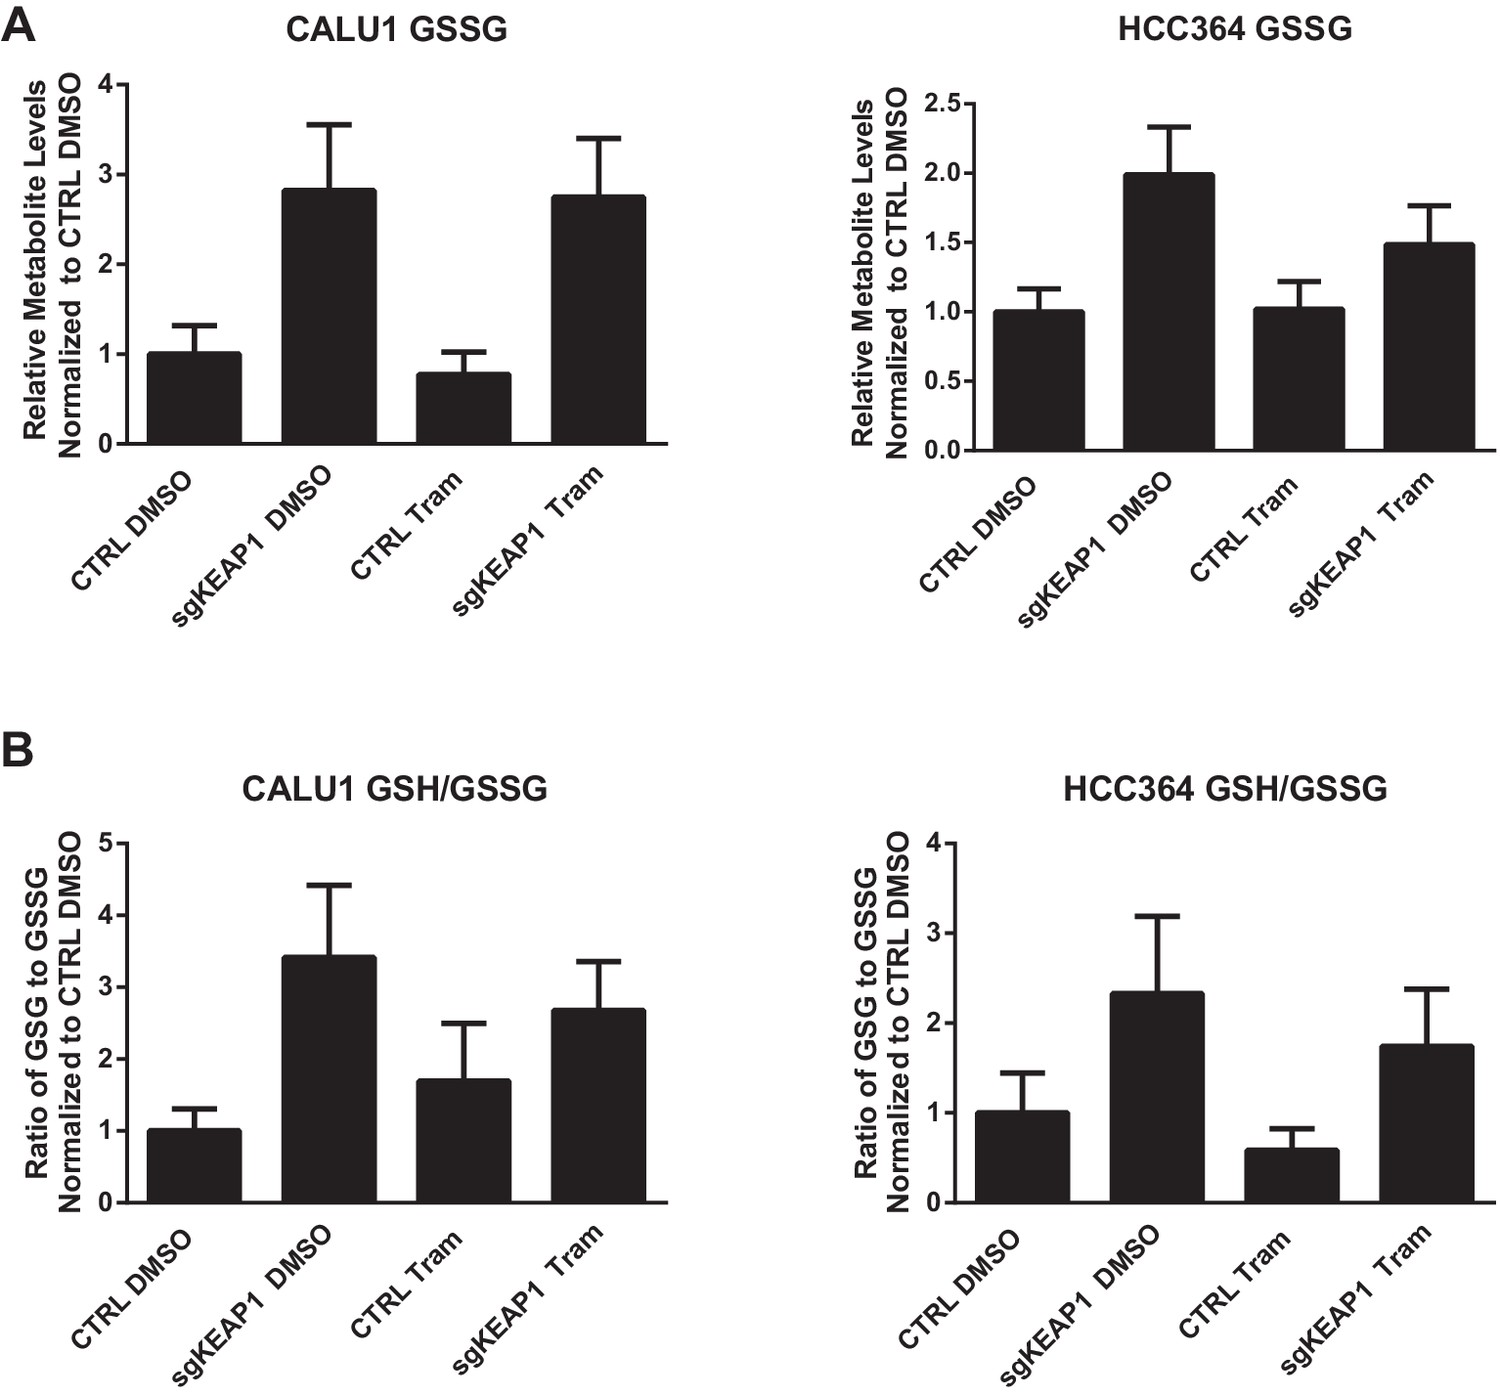
Glutathione levels in HCC364 and CALU1 cells.
Oxidized glutathione (glutathione disulfide, GSSG) is increased in KEAP1-KO cells, but the ratio of reduced to oxidized glutathione (GSH/GSSG) is higher in KEAP1-KO cells. CALU1 and HCC364 cells were treated with DMSO or trametinib for 72 hr, and metabolites were measured by liquid chromatography tandem mass spectrometry. Error bars represent SD of eight replicates.
Figure 4—figure supplement 3
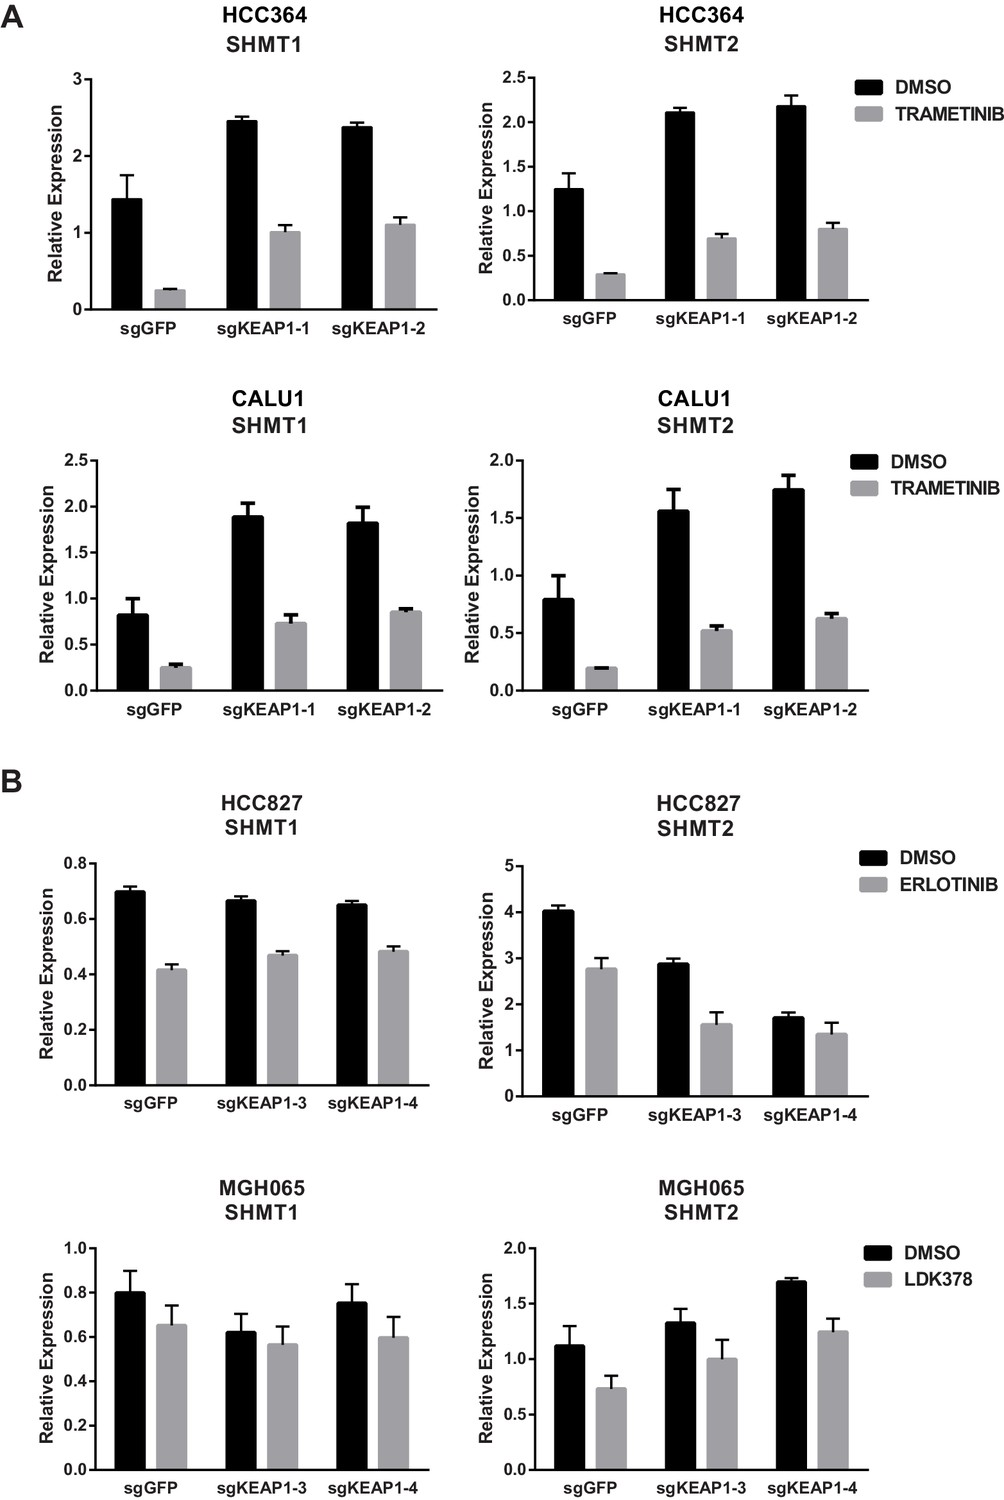
KEAP1-KO alters expression of SHMT1/2 in some cell lines.
(A) Expression of SHMT1/2 in HCC364 and CALU1 cells treated with DMSO or trametinib for 72 hr. (B) Expression of SHMT1/2 in HCC827 or MGH-065 cells treated with erlotinib or LDK378 for 72 hr. Error bars represent SD of the mean of three biological replicates.
Figure 4—figure supplement 4
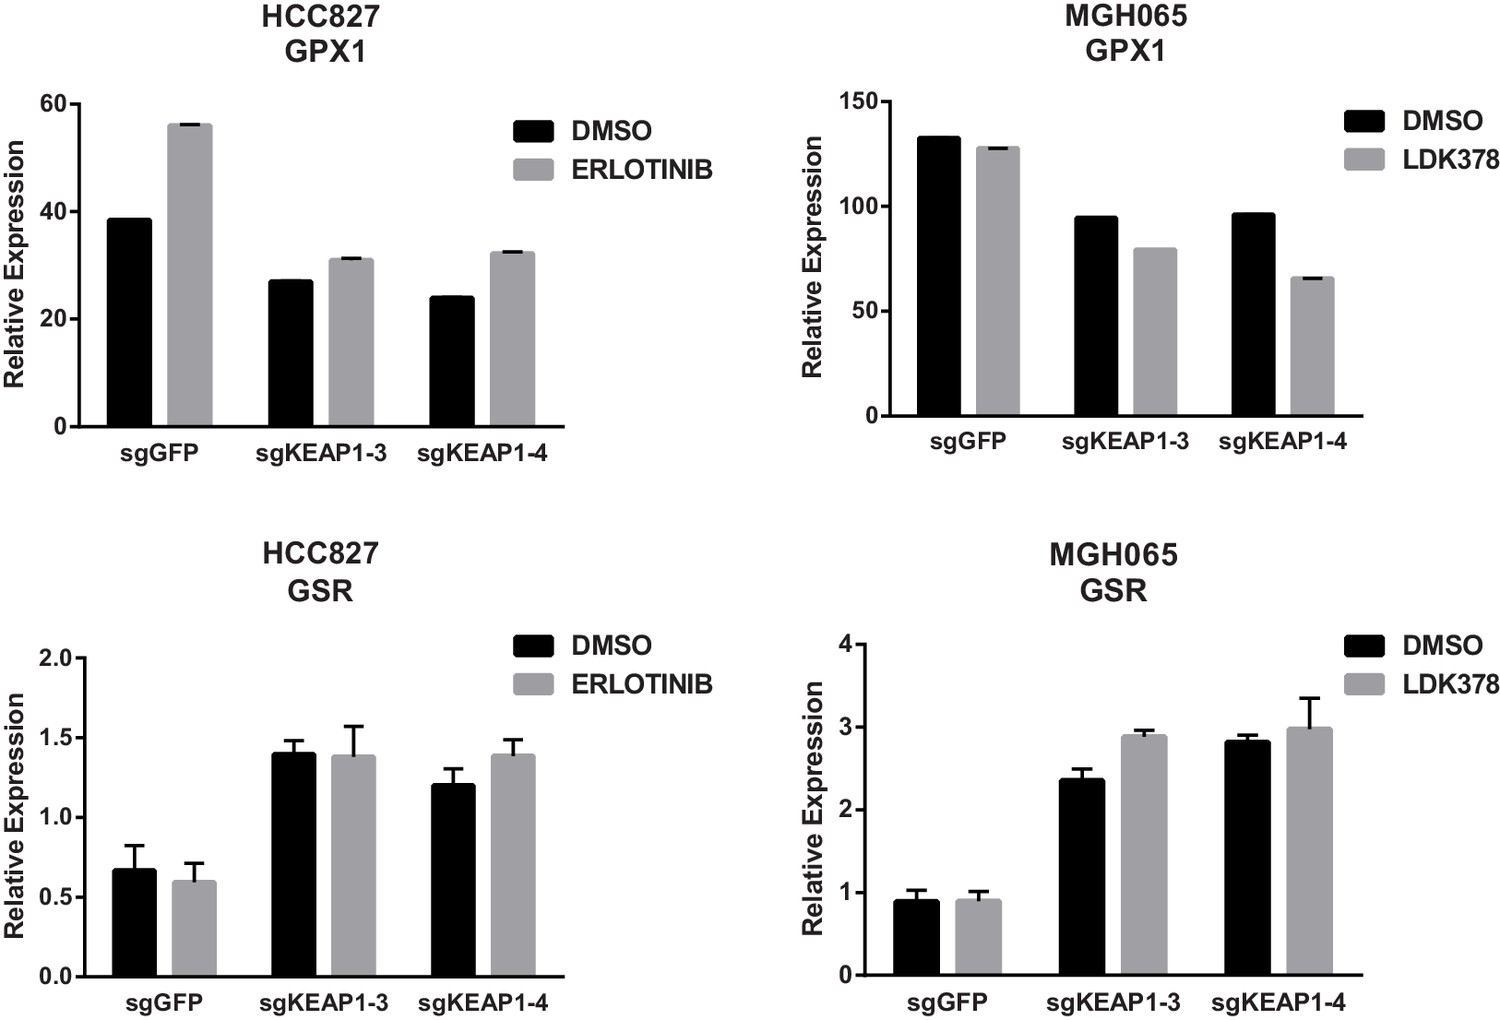
KEAP1-KO alters expression of GPX1 and GSR.
Expression of GPX1 and GSR in HCC827 or MGH-065 cells treated with erlotinib or LDK378 for 72 hr. Error bars represent SD of the mean of three biological replicates.
Figure 5 with 3 supplements
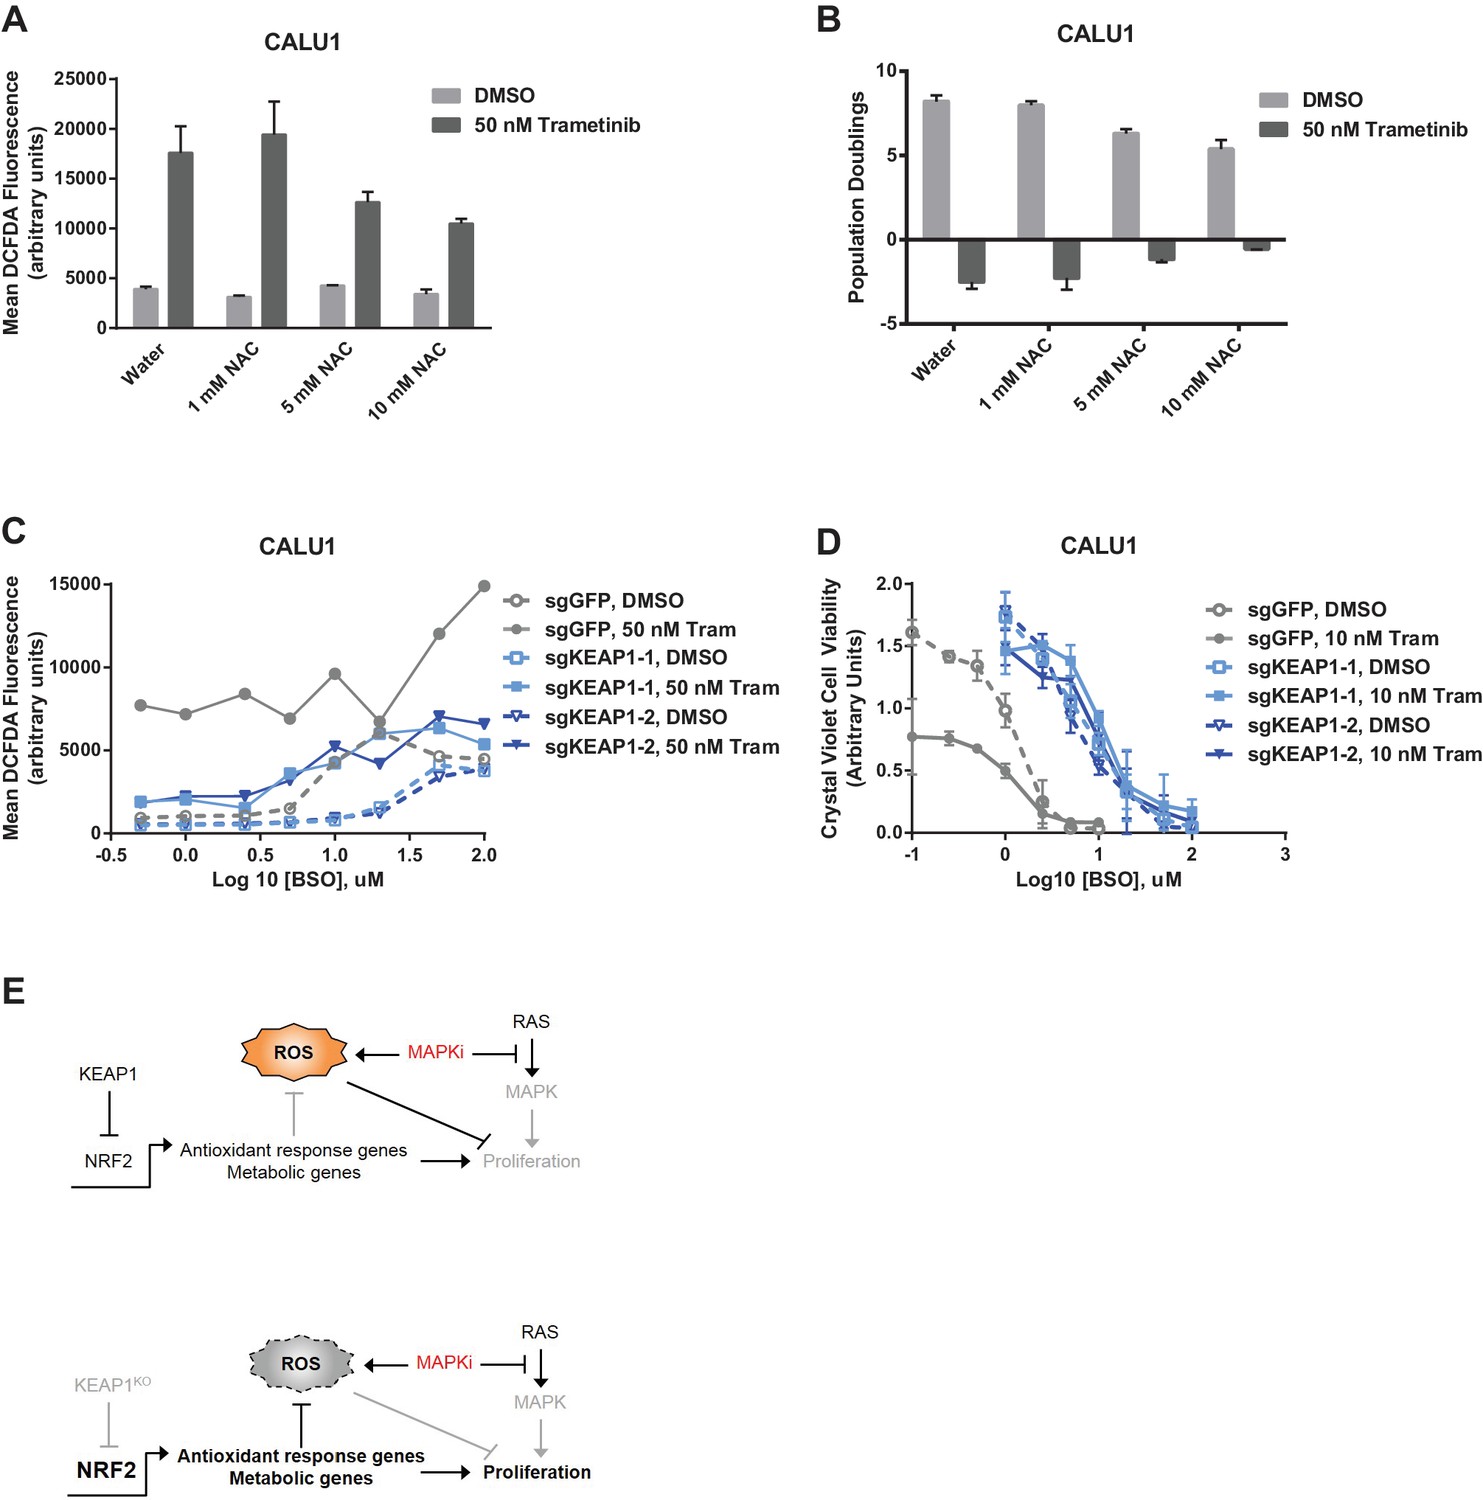
Altering ROS levels affects cell survival.
(A, B) CALU1 cells were treated with DMSO or 50 nM trametinib and the indicated concentration of N-acetyl cysteine (NAC) for 16 days. (A) ROS was measured by DCFDA assay. Error bars represent SD of two replicates. (B) Population doublings of trametinib-treated cells compared to DMSO-treated cells. Error bars represent SD of two replicates. (C) KEAP1-KO reduces trametinib- and BSO-induced ROS in CALU1 cells. Cells were treated for 72 hr, and ROS was measured by DCFDA assay. Error bars represent SD of two replicates. (D) KEAP1-KO increases cell viability in CALU1 cells treated with trametinib and BSO. 20,000 CALU1 cells were treated with DMSO plus BSO for 7 days or trametinib plus BSO for 12 days. Error bars represent SD of triplicate wells. (E) Model of how KEAP1-KO confers resistance to trametinib. MAPK pathway inhibitors turn off MAPK signaling and also induce ROS, leading to low level activation of NRF2. Upon KEAP1 loss, NRF2 activity further increases, altering expression of genes involved in the antioxidant response and metabolism, allowing for proliferation in the absence of MAPK signaling.
Figure 5—figure supplement 1
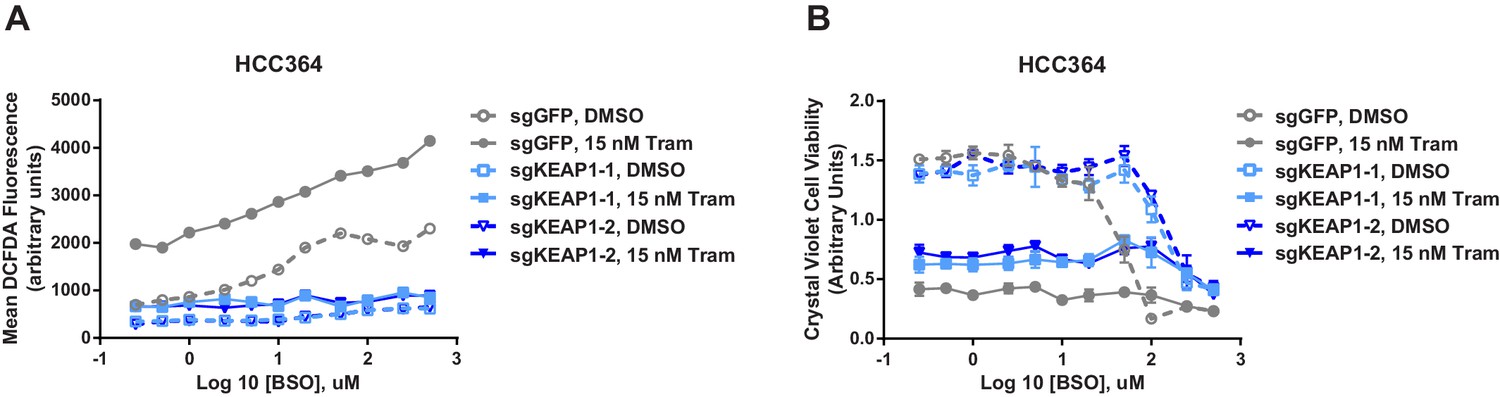
KEAP1-KO reduces ROS and increases viability in the presence of BSO.
(A) KEAP1-KO reduces trametinib- and BSO-induced ROS in HCC364 cells. Cells were treated for 72 hr, and ROS was measured by DCFDA assay. Error bars represent SD of two replicates. (B) KEAP1-KO increases cell viability in HCC364 cells treated with trametinib abd BSO. Cells were treated with DMSO plus BSO for 6 days or trametinib plus BSO for 10 days. Error bars represent SD of triplicate wells.
Figure 5—figure supplement 2
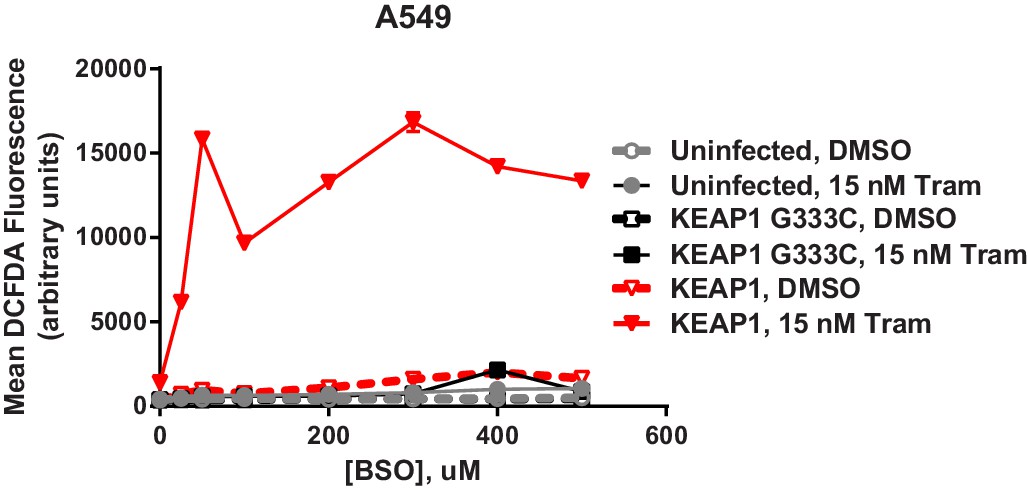
Expression of WT KEAP1 but not G333C in KEAP1-null A549 cells increases trametinib- and BSO-induced ROS.
Cells were treated for 72 hr. Error bars represent SD of two replicates.
Figure 5—figure supplement 3
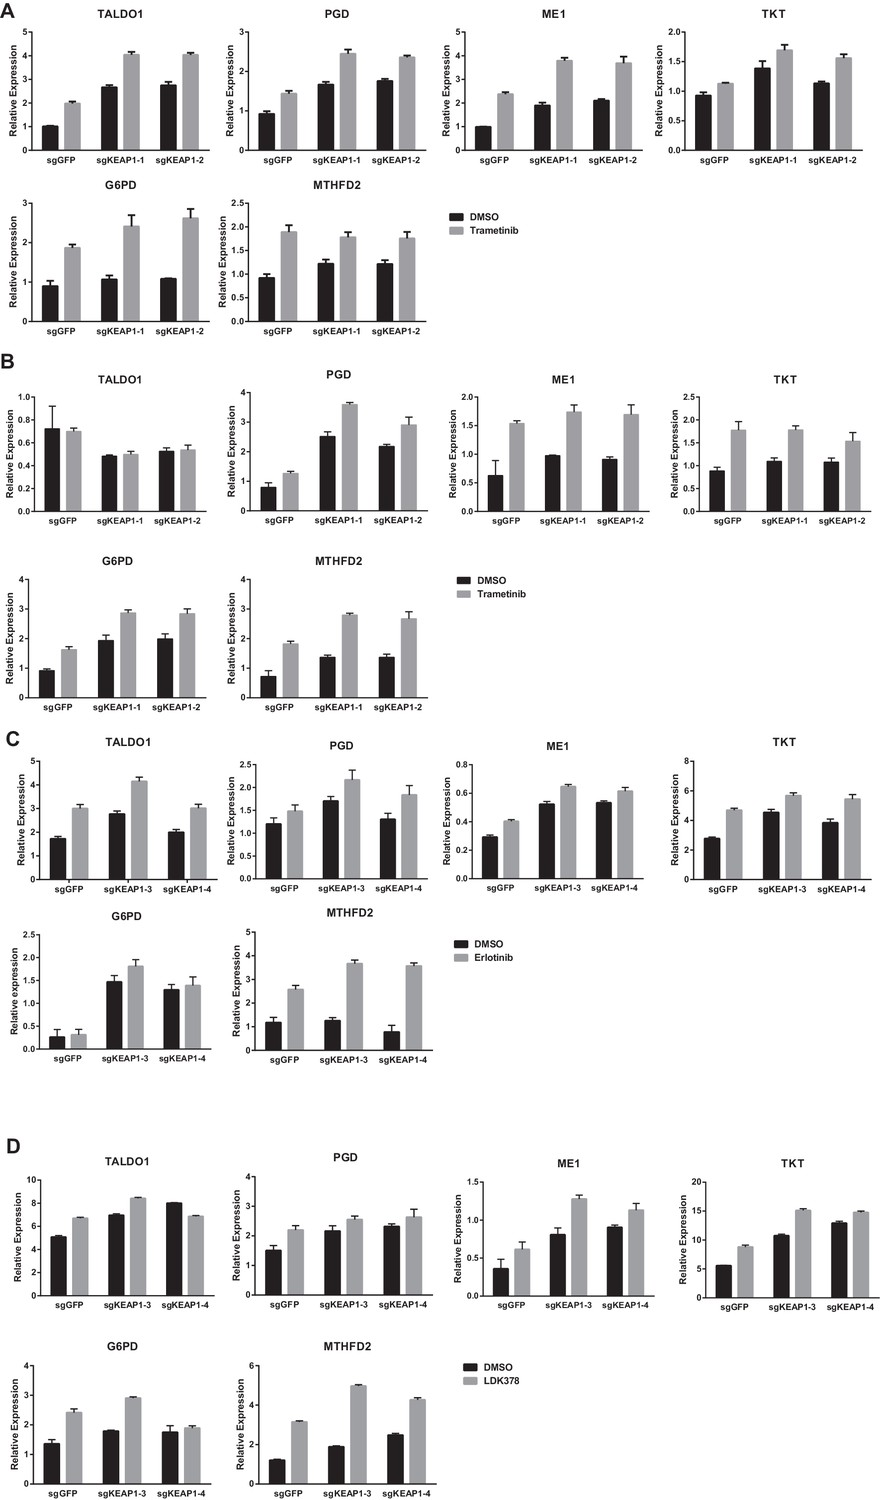
KEAP1-KO alters cell metabolism.
Expression of NRF2 metabolic target genes in (A) CALU1 cells treated with DMSO or trametinib for 72 hr, (B) HCC364 cells treated with DMSO or trametinib for 72 hr, (C) HCC827 cells treated with DMSO or erlotinib for 72 hr and (D) MGH-065 cells treated with DMSO or LDK378 for 72 hr. Error bars represent SD of three biological replicates.
Figure 6

Alterations in the KEAP1/NRF2 pathway alter tumor growth in vivo.
Growth of HCC827 sgGFP and sgKEAP1 cells in vivo. HCC827 sgGFP or sgKEAP1 cells were implanted bilaterally and treatment was initiated when average tumor volume reached 100–200 mm3. Data represent mean ± SD (n = 12).
Additional files
-
Supplementary file 1
Genome scale CRISPR-Cas9 screens in CALU1, HCC364, and NCIH1299 cells.
For each sgRNA, the average log2 fold-change (LFC) between drug-treated samples and Day 0 samples is shown. The hits from each screen, as determined by LFC or by STARS score, are also summarized.
- https://doi.org/10.7554/eLife.18970.025
-
Supplementary file 2
Focused sgRNA library screens in HCC827 and MGH065 cells.
Raw counts and Z-scores are shown for each sgRNA in DMSO- or drug-treated samples.
- https://doi.org/10.7554/eLife.18970.026
-
Supplementary file 3
Metabolite Profiling of KEAP1 knockout cells.
Metabolite levels are shown for DMSO- or drug-treated samples. Metabolite differences were analyzed by normalizing samples by total levels and comparing replicate samples in groups that satisfy significance of p<0.05 using an unpaired two-tailed t-test.
- https://doi.org/10.7554/eLife.18970.027
Download links
A two-part list of links to download the article, or parts of the article, in various formats.
Downloads (link to download the article as PDF)
Open citations (links to open the citations from this article in various online reference manager services)
Cite this article (links to download the citations from this article in formats compatible with various reference manager tools)
KEAP1 loss modulates sensitivity to kinase targeted therapy in lung cancer
eLife 6:e18970.
https://doi.org/10.7554/eLife.18970


