Pan-neuronal screening in Caenorhabditis elegans reveals asymmetric dynamics of AWC neurons is critical for thermal avoidance behavior
- University of Toronto, Canada
Figures
Figure 1 with 3 supplements

Pan-neuronal calcium signals in response to thermal ramp.
(A) A maximum-projection image of nuclear fluorescence in the head region of C. elegans. Pan-neuronally expressed G-GECO1.1 and DsRed2 are psuedocolored in green and red, respectively. glr-1p::mNeptune (psuedocolored in blue), among other markers, was used to help identify some of the head neurons. (B) A heat-map representation of the whole-brain calcium transients. Calcium activities are shown in color: the larger indicator ratio is expressed as reddish color while smaller is in blue. Each row is a calcium recording from a single neuron, and the time-series are sorted by correlation coefficient to AFD activity. Neurons identified for this study are labeled on the left side. (C) Thermotactic calcium responses during a temperature ramp (bottom) in AFD (top, n = 38, see also Figure 1—figure supplement 1), AIY (second panel, n = 14), and RIS (third panel, n = 18) neurons in adult worms which had been cultivated at 23°C. The intensity of the calcium indicator (G-GECO1.1) was divided by the intensity of the bicistronically coexpressed reference (DsRed2), and the ratios (G/R ratio) were plotted as a function of time. All measurements were made in the nuclei. Note that y-scale is different among the neurons. Error bars indicate standard errors (shaded areas in light blue). Source data are available in Figure_1-source_data_1.mat.
Figure 1—figure supplement 1
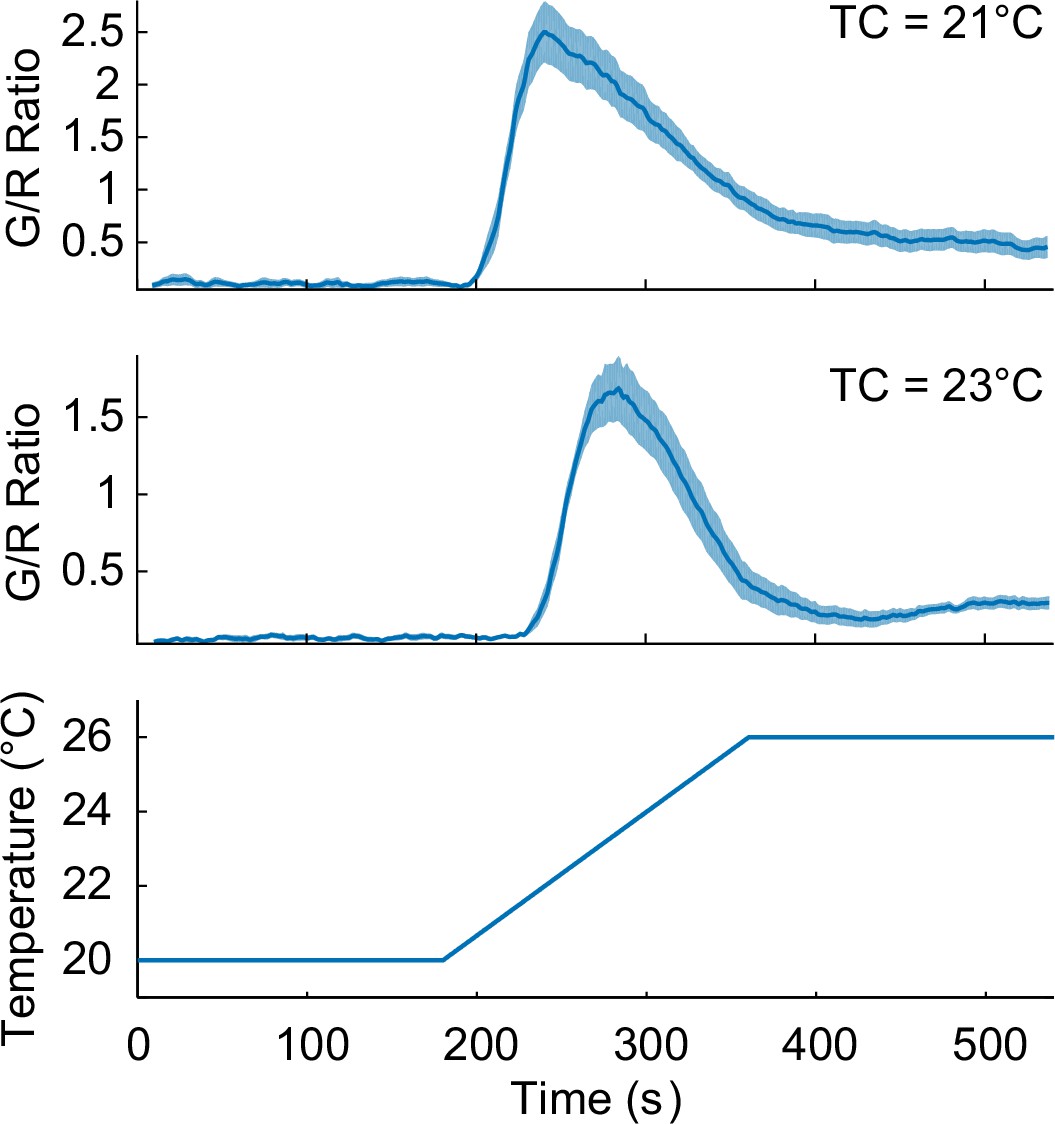
TC-dependent thermosensory calcium responses in the nuclei of AFD neurons, extracted from the pan-neuronal recordings.
The worms were cultivated at 21°C (top, n = 11, Figure_1-source_data_2.mat) and 23°C (middle, n = 8, Figure_1-source_data_3.mat) prior to the calcium imaging.
Figure 1—figure supplement 2
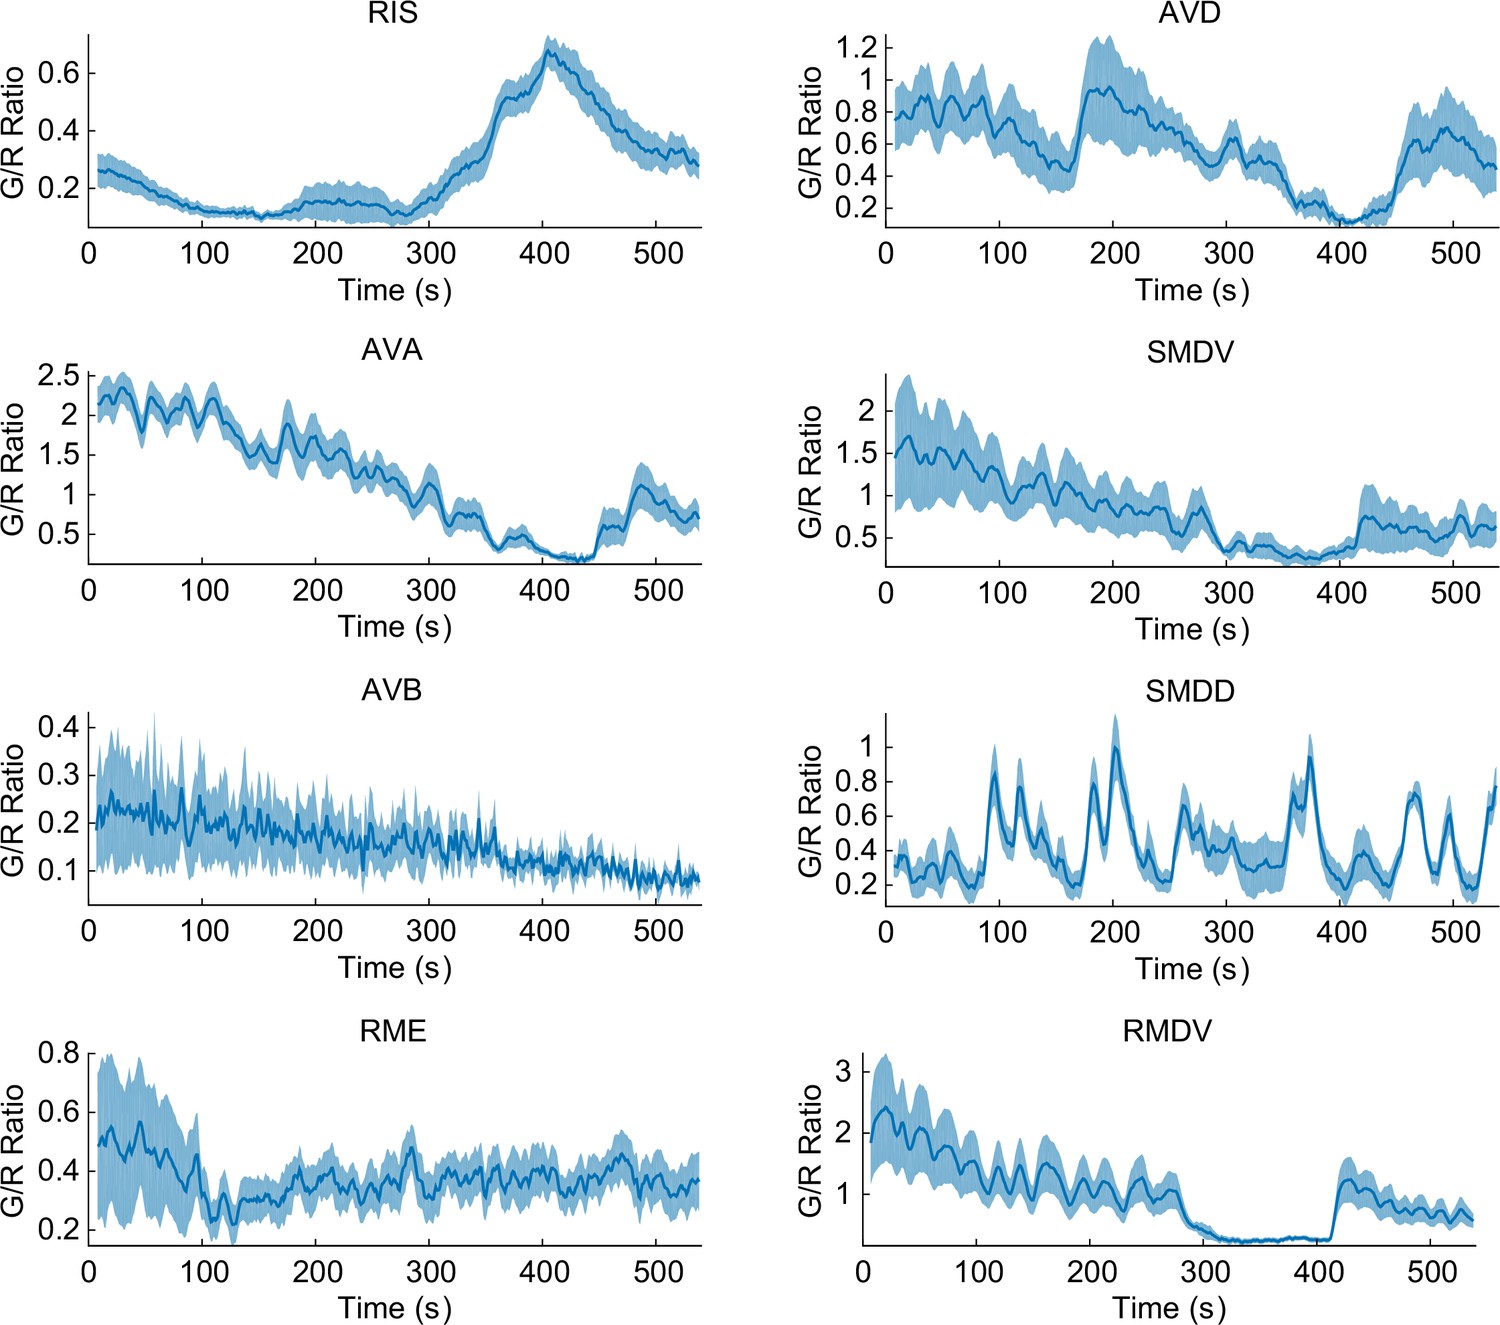
Some of the representative calcium transients in the pan-neuronal measurements in response to a temperature ramp (same as Figure 1—figure supplement 1).
RIS neuron (top left, n = 18) showed AFD-like TC-dependent calcium transients in response to the temperature rise ~3 degrees above TC. Command neurons such as AVA (left, second from top, n = 17) and AVD (right, top) have one of the strongest signals in C. elegans. These neurons usually show spontaneous activities regardless of external perturbations. Some motor neurons (RMDV, bottom, right, n = 12) and SMDV (right, second from top) have an oscillatory pattern; some of them also have negative correlation to AFD or RIS. Some neurons such as AVB (right, fourth from top, n = 5) and RME (bottom, right, n = 11) do not show any activity throughout the assay. Error bars indicate standard errors (shaded area in light blue). Source data are available in Figure_1-source_data_4.mat
Figure 1—figure supplement 3
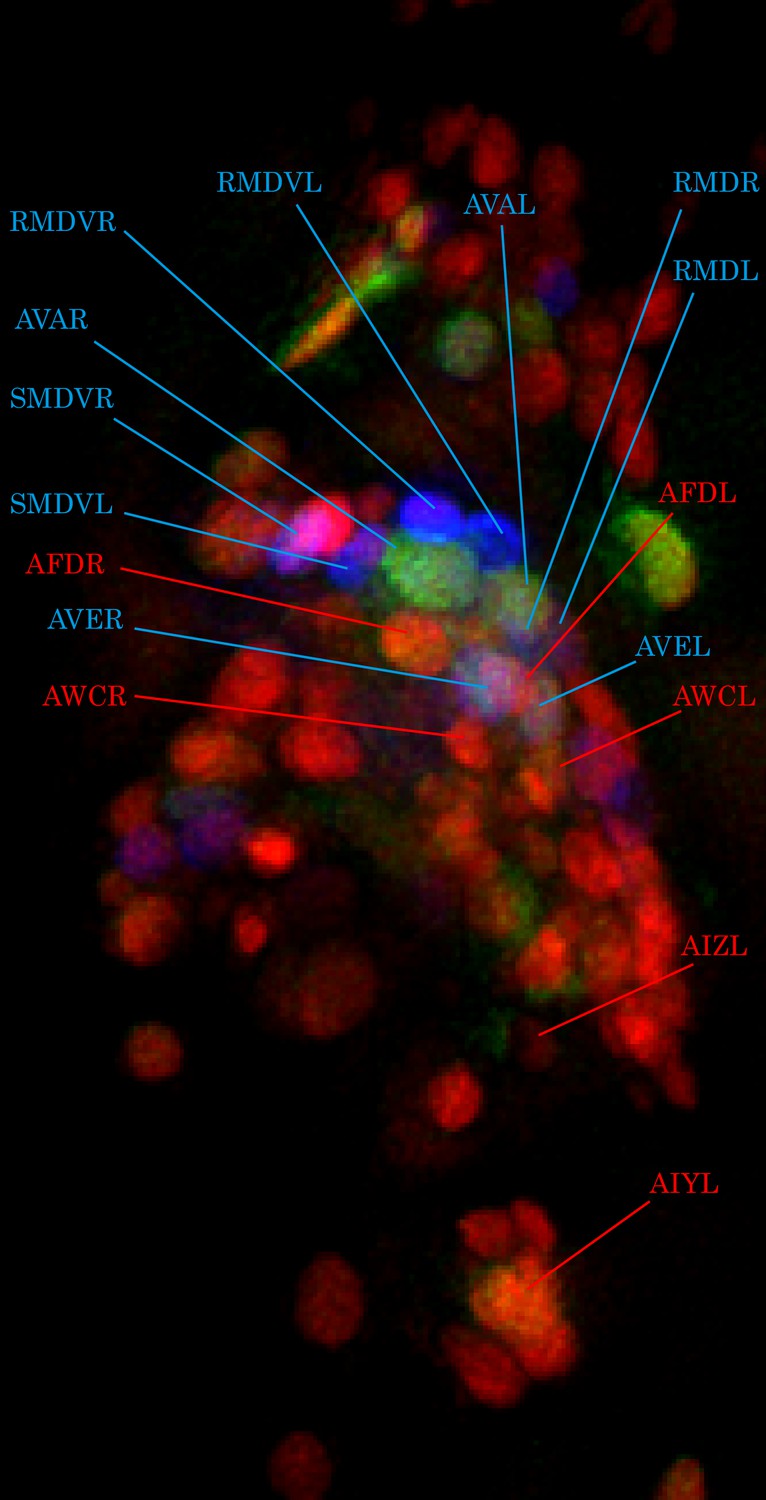
Cell identification by glr-1p::mNeptune marker.
Pan-neuronally expressed G-GECO1.1 and DsRed2 are pseudocolored in green and red, respectively. glr-1p::mNeptune (psuedocolored in blue) was used to help identify some of the head neurons (blue labels). Using glr-1p expression as reference, as well as relative location of surrounding neurons, some of the thermosensory neurons are identified (red labels).
Figure 2 with 1 supplement
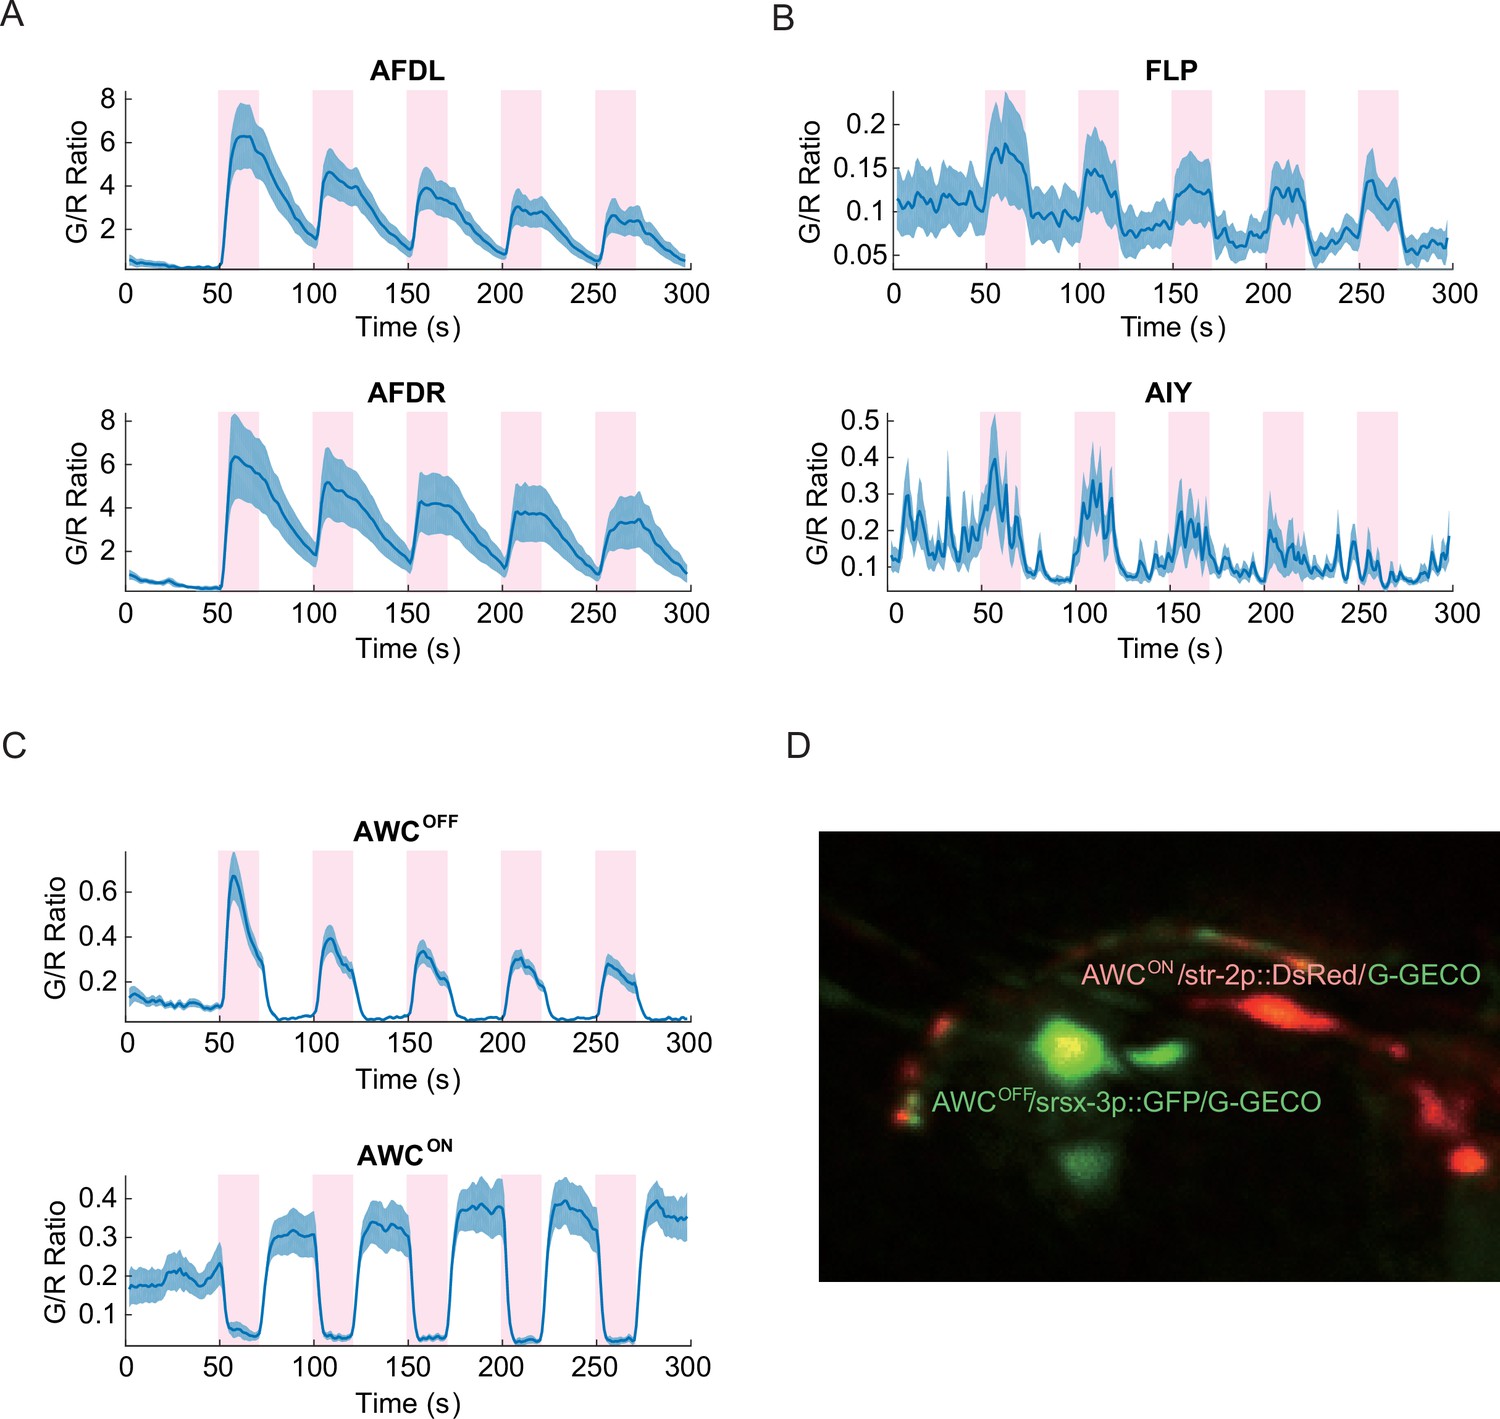
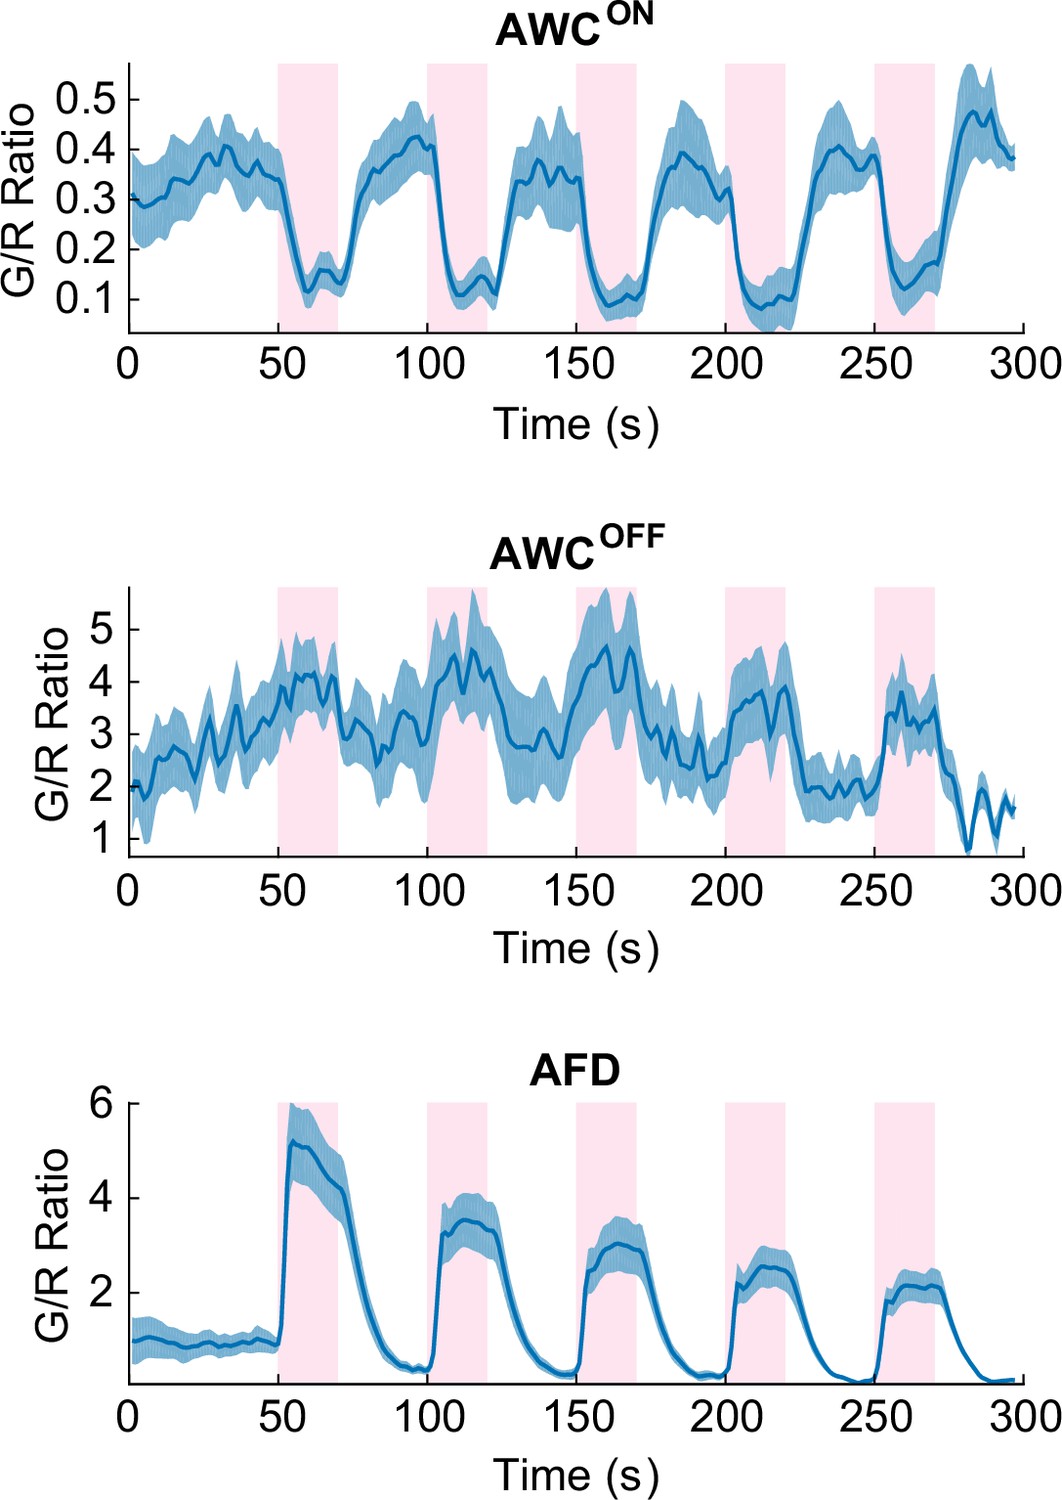
Noxious heat stimuli and neural activities in the thermosensory neurons.
The pink areas represent the time in which noxious heat stimuli were delivered by a 1440 nm laser. Calcium transients had positive correlation to the laser stimuli in AFDL (A, top, n = 6, Figure_2-source_data_1.mat), AFDR (A, bottom, n = 7, Figure_2-source_data_1.mat), FLPs (B, top, n = 10, Figure_2-source_data_2.mat), AIYs (B, bottom, n = 18, Figure_2-source_data_3.mat), and AWCOFF (C, top, n = 17, Figure_2-source_data_4.mat). AWCON (C, bottom, n = 19, Figure_2-source_data_4.mat) showed negative correlation to the stimuli. (D) Coexpression of the calcium indicators with AWCON/AWCOFF markers for the asymmetry identification. Calcium measurements were made in the nuclei in AFD, AWC, and FLP, and in the neurites in AIY. Error bars are standard errors (shaded areas in light blue).
Figure 2—figure supplement 1
Cellular identity of AWCON and AWCOFF were confirmed by coexpressing cell-fate markers (str-2p::DsRed and srsx-3p::GFP) along with the calcium indicator.
AWCON (top) had bright DsRed fluorescence throughout the neuron, which decreased the G/R ratio but did not significantly degrade the S/N. AWCOFF neuron (middle) had strong srsx-3p::GFP expression which significantly raised the G/R ratio and masked the green signals from G-GECO calcium indicator, however AWCOFF calcium signature was still detectable. Expression of such bright markers had no effect in the adjacent neurons such as AFD (bottom). Source data are available in Figure_2-source_data_5.mat
Figure 3 with 2 supplements

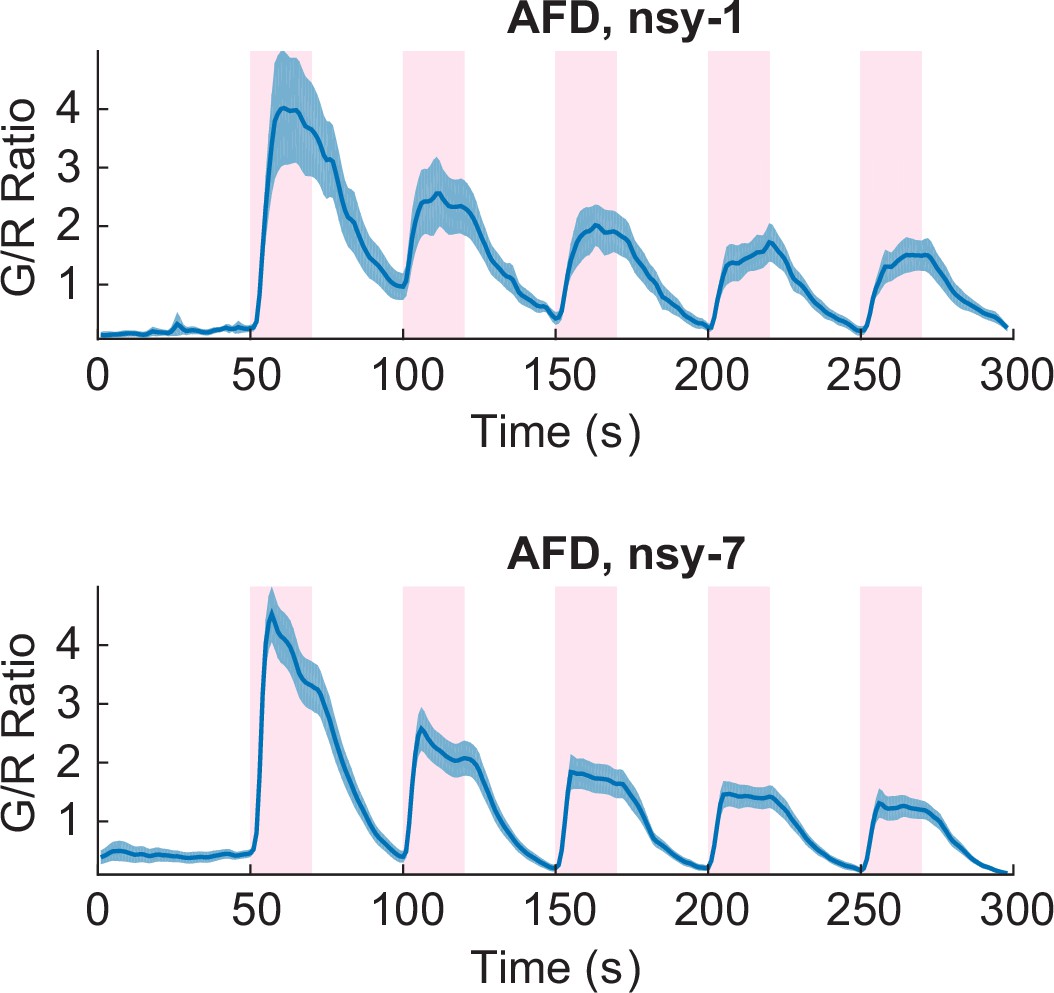
Asymmetric neuronal activities by the noxious heat stimulation disappeared in nsy-1 and nsy-7 mutants.
(A, Figure_3-source_data_1.mat) Left and right AWCs became functionally indistinguishable: both AWCL (top, n = 10) and AWCR (bottom, n = 11) showed calcium transients similar to AWCON in nsy-1. (B, Figure_3-source_data_2.mat) In nsy-7, AWCL (top, n = 20) and AWCR (B, bottom, n = 21) behaved similar to AWCOFF. Pink areas represent laser stimuli. Error bars indicate standard errors (shaded areas in light blue).
Figure 3—figure supplement 1
Both the nsy-1 (n = 6, Figure_3-source_data_3.mat) and nsy-7 (n = 17, Figure_3-source_data_4.mat) mutations do not affect the activity of AFD neurons in response to the noxious heat stimuli.
Error bars indicate standard errors (shaded area in light blue).
Figure 3—figure supplement 2
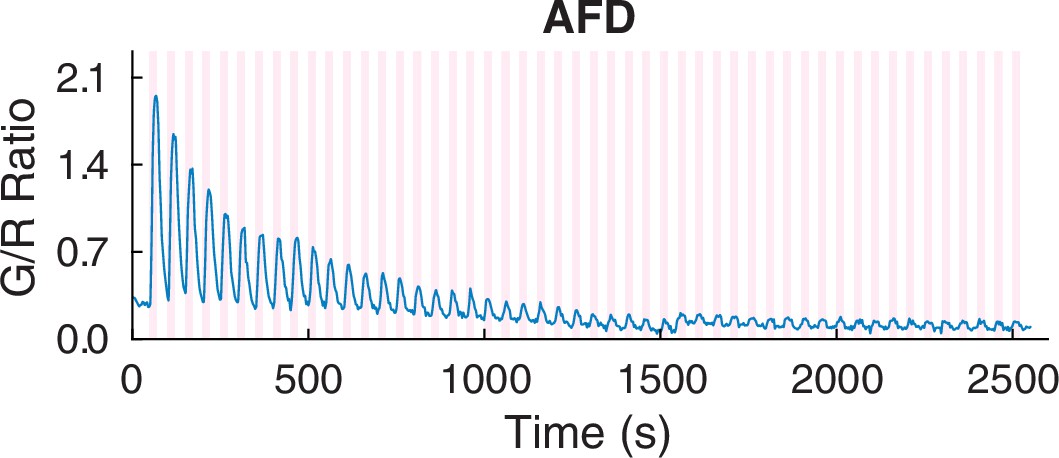
A 45 min calcium recording in AFD neurons using our pan-neuronal imaging system.
Source data are available in the supplementary mat file (Figure_3-source_data_6.mat).
Figure 4 with 3 supplements
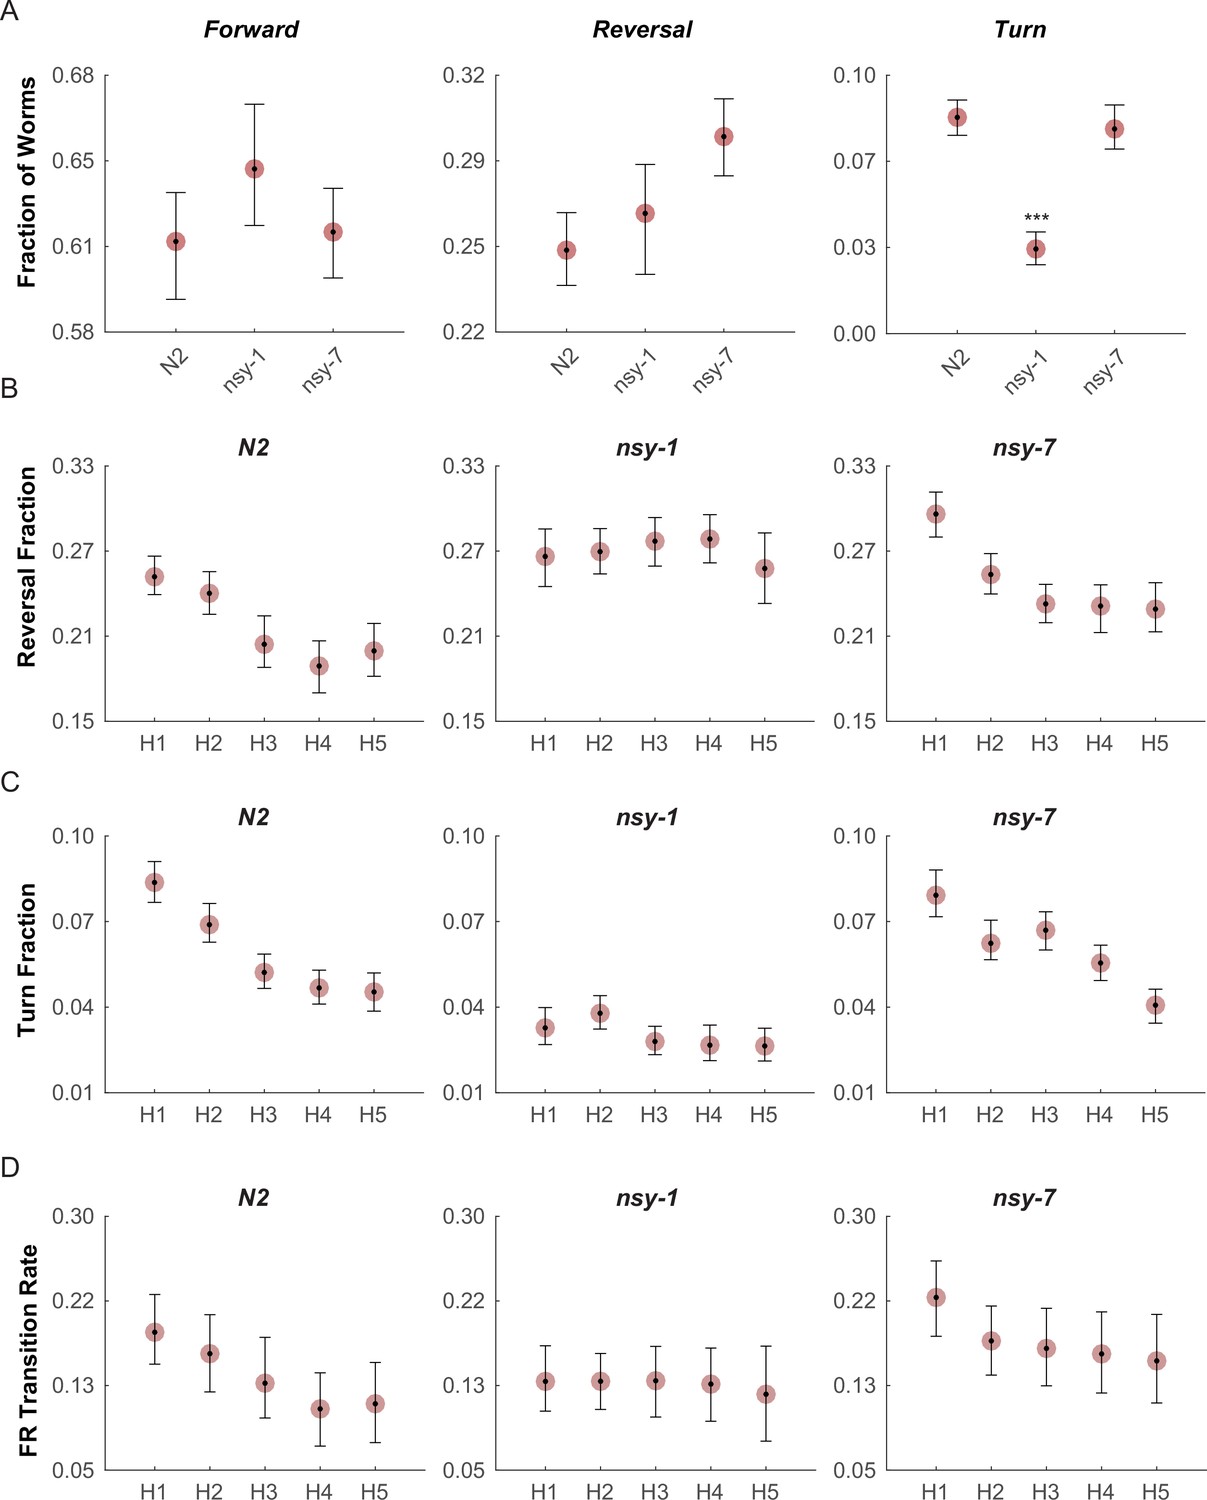
Multiple worms were placed on an assay plate, and the temperature of the plate was quickly changed from 23°C to 33°C and back to 23°C for 5 cycles.
After the acquisition, the behavior of each worm was carefully labeled as forward, reversal, omega turn, or pause. (A, Figure_4-source_data_1.mat) Fraction of worms engaged in each behavior during the first noxious heating phase. During this phase no difference is found in the forward behavioral fraction. A minor difference in the reversal fraction is found between nsy-7 and the N2. The fraction of turning behavior in nsy-1 is significantly smaller from that of other strains. *** indicates p ≤ 0.001 relative to N2. n = 131, 134, and 153 for N2, nsy-1, and nsy-7, respectively. (B, Figure_4-source_data_2.mat) Habituation of reversal and turning behaviors. In both behaviors N2 and nsy-7 but not nsy-1 display a pattern of habituation during the heating phases. (C, Figure_4-source_data_2.mat) Forward-to-reversal transition rates also exhibit habituation in N2 and nsy-7 but not in nsy-1. H1, H2, … H5 indicate the heating phases 1 to 5, during which the temperature of the assay plate was raised to 33°C from 23°C (D, Figure_4-source_data_3.mat). Error bars indicate 83.4% confidence intervals (non-overlapping error bars of 83.4% CIs indicate p is <0.05) calculated by bootstrapping with bias correlated percentile method and 1000 resampling iterations. Detailed statistics for each data point is provided in the supplementary mat files specified above.
Figure 4—figure supplement 1
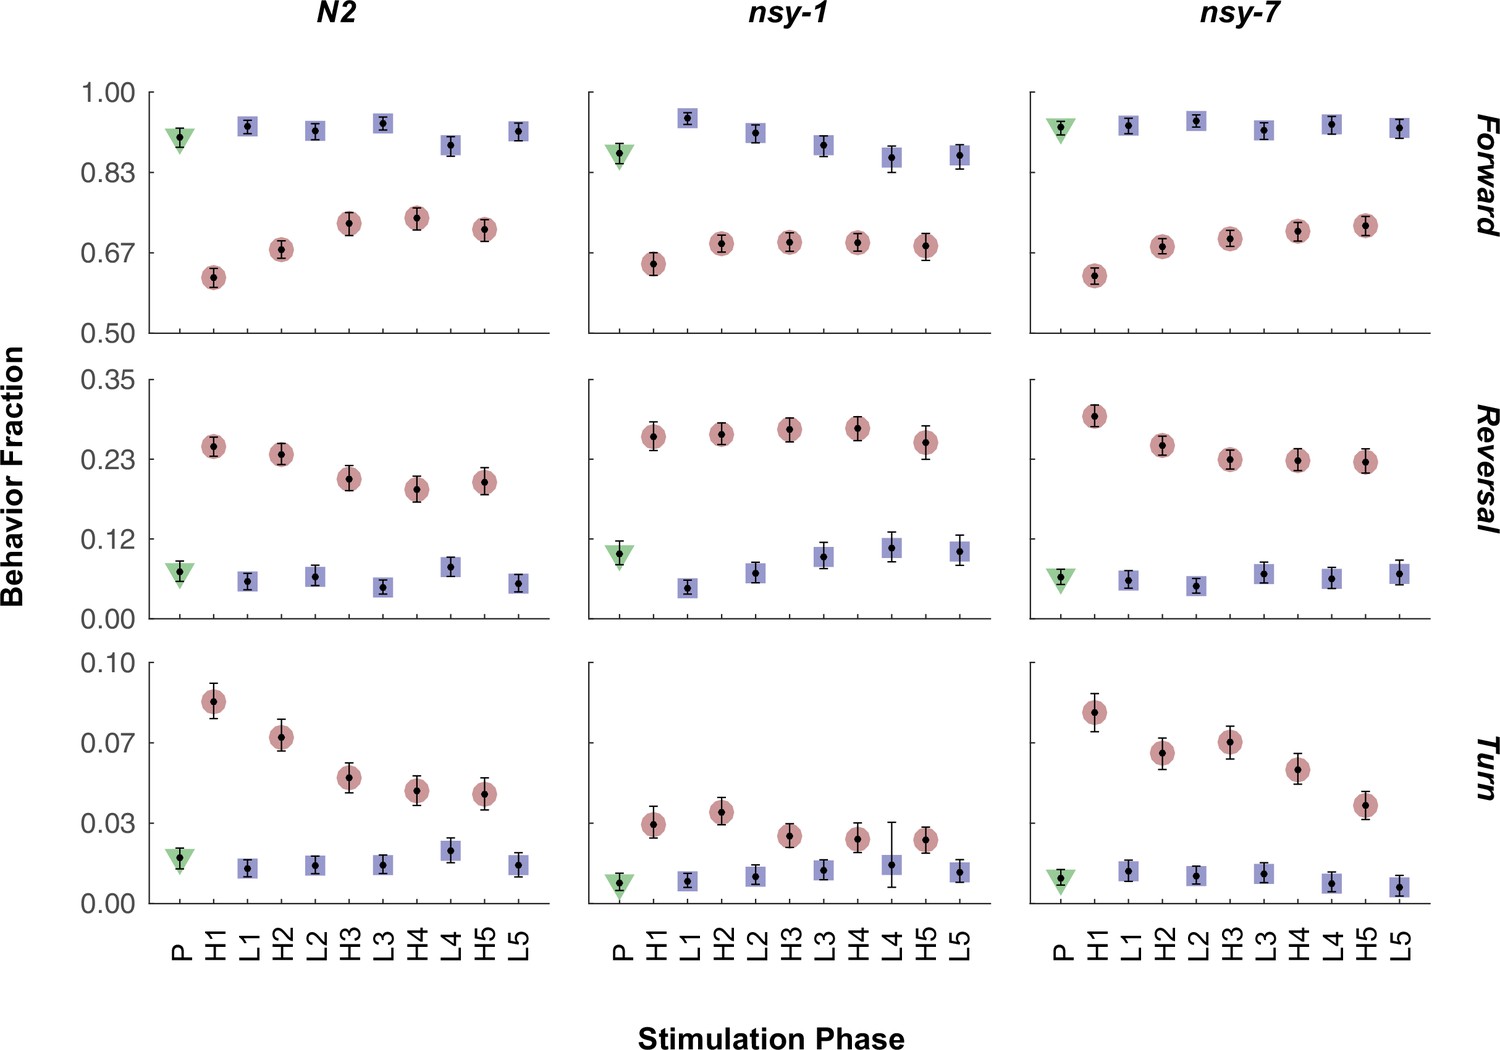
Fraction of all the behaviors in each stimulation phase for all the strains.
The mean fraction before the stimulation (green triangle), during the stimulation (red circle), and during the interval (blue square) is plotted for each behavior and strain. Abbreviations for the x-axis labels are as follows; P: pre-heating phase, H1-H5: heating phases (33°C), L1-L5: low temperature (23°C) intervals. Error bars indicate 83.4% confidence level by bootstrapping. Detailed statistics for each data point is provided in the supplementary mat file (Figure_4-source_data_4.mat). Minimum number of worms analyzed: 96, 105, and 119 for N2, nsy-1, and nsy-7, respectively.
Figure 4—figure supplement 2
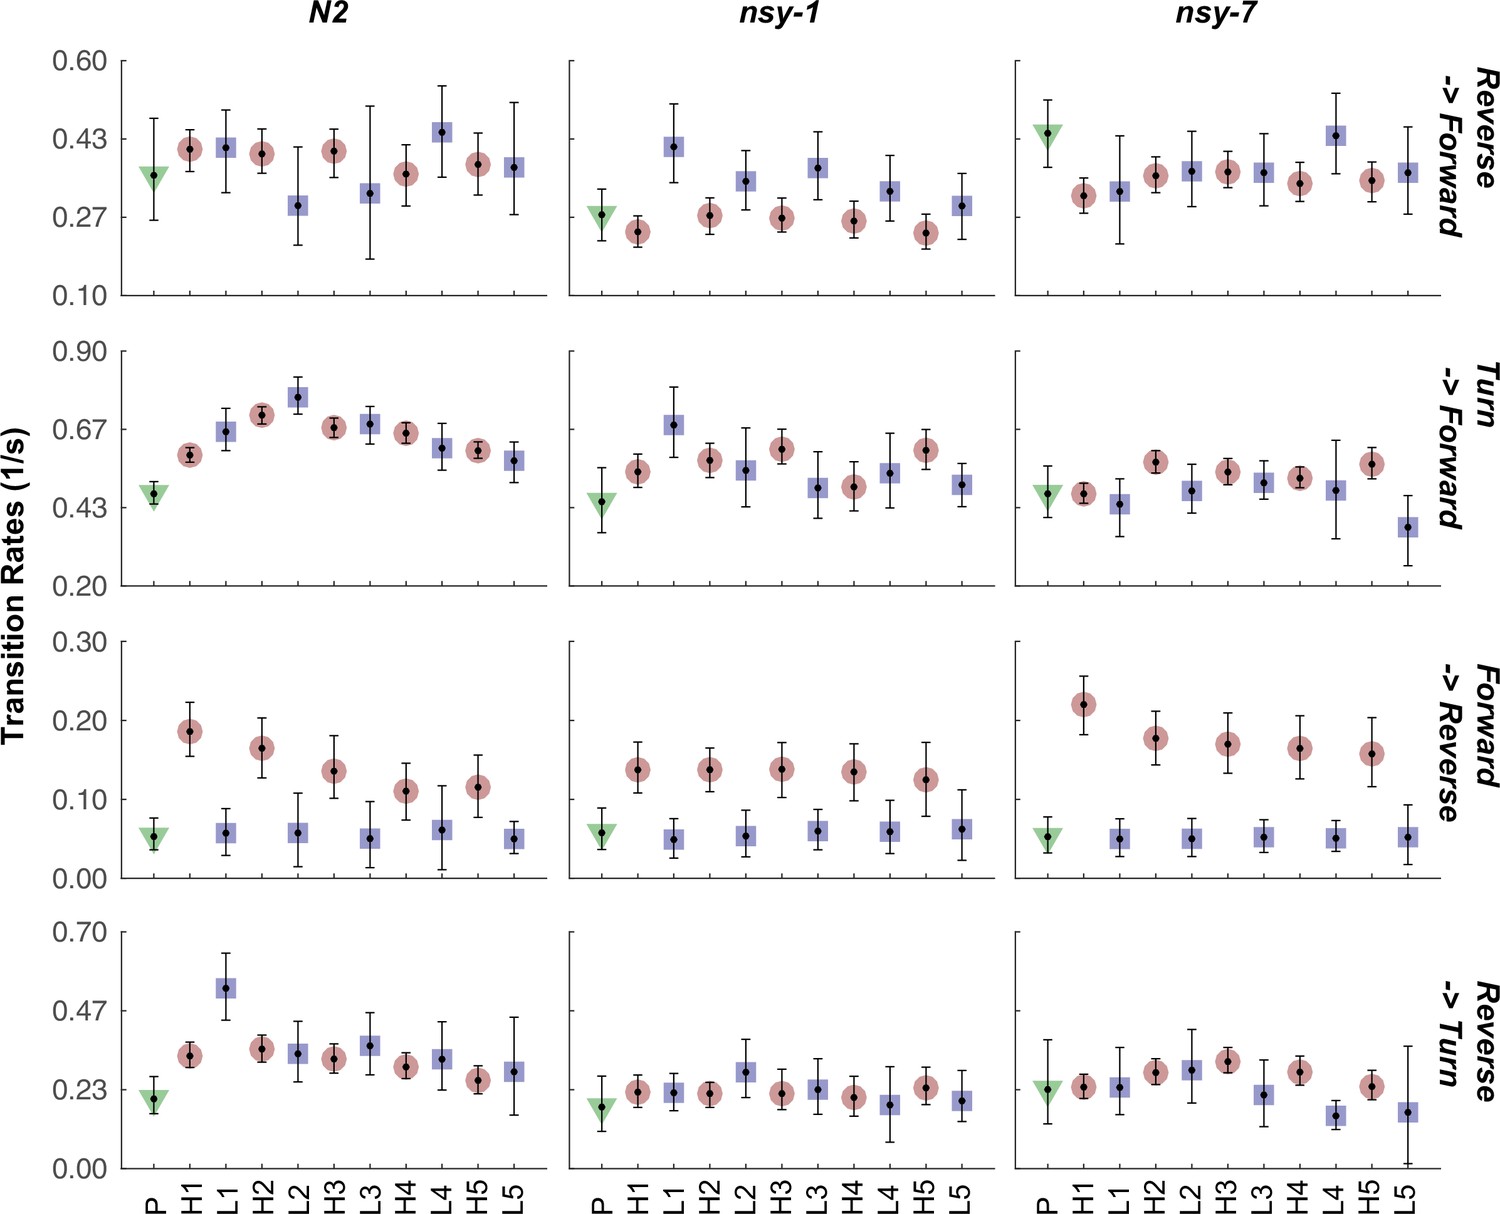
Transition rate of selected transitions in each stimulation phase for all the strains.
The mean transition rate before the stimulation (green triangle), during the stimulation (red circle), and during the interval (blue square) is plotted for each transition and strain. Abbreviations for the x-axis labels are as follows; P: pre-heating phase, H1-H5: heating phases (33°C), L1-L5: low temperature (23°C) intervals. Error bars indicate 83.4% confidence level by bootstrapping. Detailed statistics for each data point is provided in the supplementary mat file (Figure_4-source_data_5.mat). Minimum number of worms analyzed: 12, 9, and 6 for N2, nsy-1, and nsy-7, respectively.
Figure 4—figure supplement 3
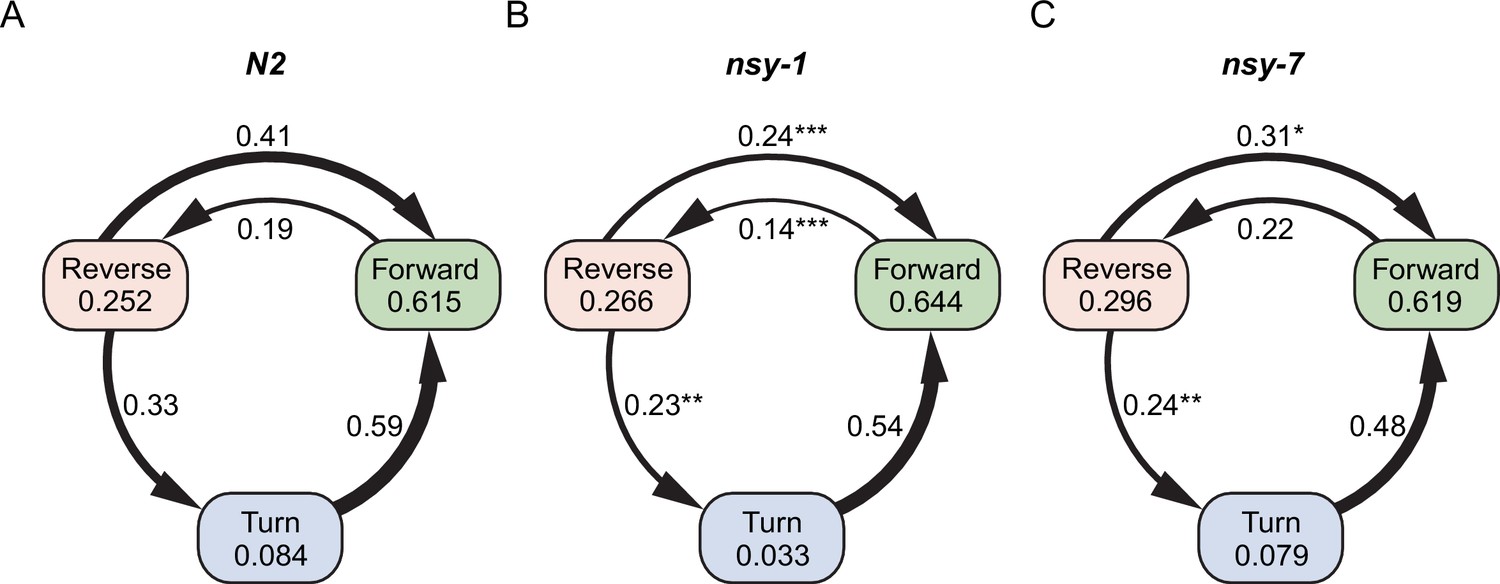
Graph representation of worm’s major behaviors and their transition rates during the first heating phase.
Each node represents fraction of behavior, while the edge represents transition rate between the behaviors in N2 (A), nsy-1 (B), and nsy-7 (C) strains. The width of the edges is proportional to the transition rates. Edges were omitted for transitions with zero rate. P-values in relative to the control transitions in N2 are indicated as follows: *p≤0.05; **p≤0.01; ***p≤0.001.
Figure 5
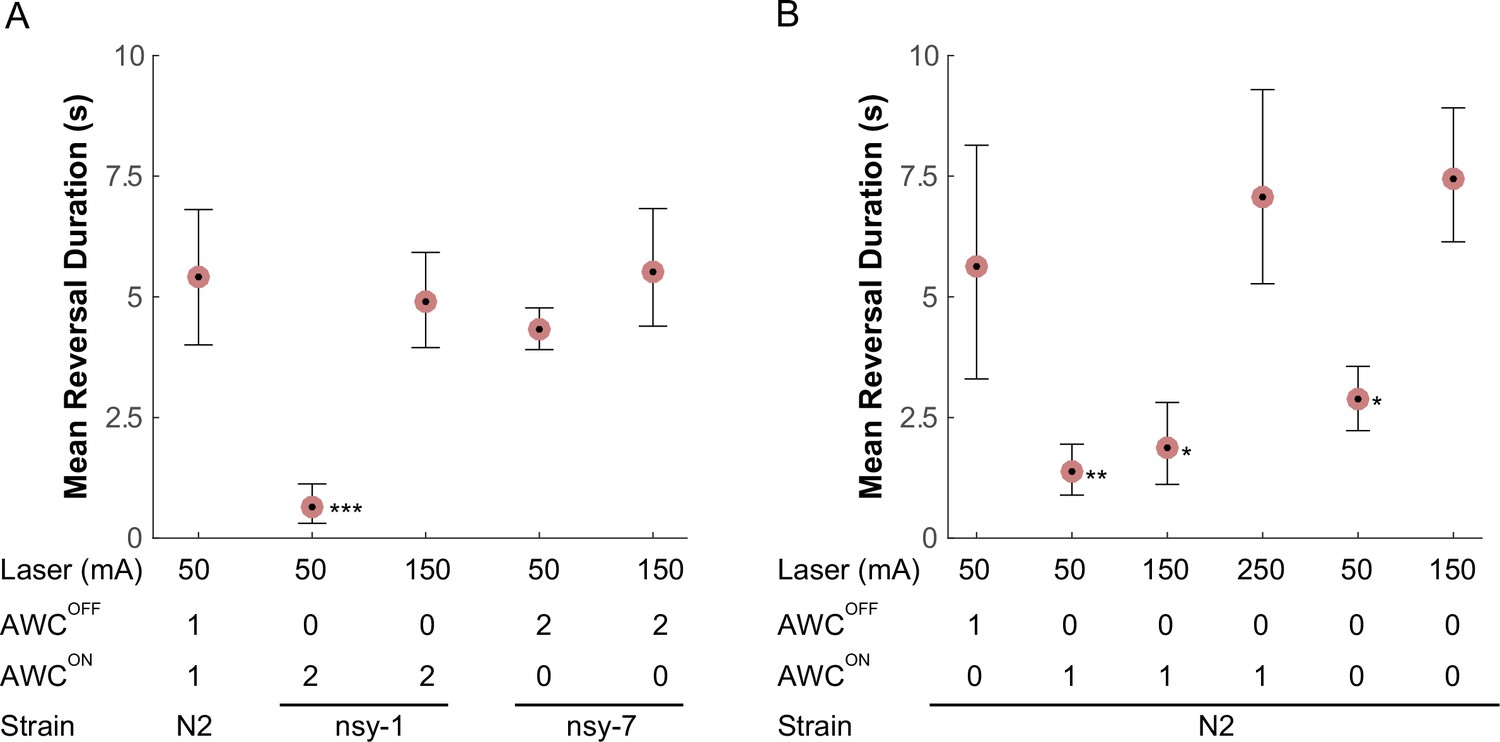
AWC asymmetry mutant strains (A) as well as AWC-ablated worms (B) were tested for the avoidance behavior right after a short pulse of noxious stimulation.
The acquired images were manually examined to determine the duration of the reversal behavior after a laser zap. The mean reversal duration was plotted for each combination of conditions. Applied laser power, number of functional AWCs either as a result of mutation or laser ablation, and strain names are displayed at the bottom of each plot. Error bars are the 83.4% confidence intervals calculated by bootstrapping. Mann-Whitney was used to compare two means. P-values in relative to the control (A, leftmost) are indicated as follows: *p≤0.05; **p≤0.01; ***p≤0.001. Number of samples from left (n = 12, 16, 5, 11, 14, 5, 19 11, 20, 11, 11). Detailed statistics for each data point is provided in the supplementary mat file (Figure_5-source_data_1.mat).
Tables
Table 1
A list of worm strains used in this study.
| Serial Number | Strain Name | RRID | Genotype | Note |
|---|---|---|---|---|
| 120 | CX10231 | kyIs408[srsx-3::GFP;str-2::dsRed2;elt-2::GFP]; nsy-7 (tm3080) | A gift from Bargmann lab | |
| 359 | WSR85 | RRID:WB_WSR85 | kyIs408; nsy-7(tm3080); rgaIs1; rgaIs2; rgaIs3 | Genotyped for tm3080, screened for transgenics |
| 360 | WSR86 | RRID:WB_WSR86 | kyIs408; nsy-7(tm3080); rgaIs1; rgaIs2; rgaIs3 | Genotyped for tm3080, screened for transgenics |
| 363 | VC390 | RRID:WB_VC390 | nsy-1(ok593) | CGC |
| 365 | AU3 | RRID:WB_AU3 | nsy-1(ag3) II | CGC |
| 366 | CX7894 | RRID:WB_CX7894 | kyIs408 | A gift from Bargmann lab |
| 370 | WSR90 | RRID:WB_WSR90 | kyIs408; rgaIs1[rgef-1p::NLS-G-GECO1.1-T2A-NLS-DsRed2]; rgaIs2[rgef-1p::NLS-G-GECO1.1-T2A-NLS-DsRed2]; rgaIs3[tax-4p::NLS-mNeptune] | Generated by crossing CX7894 and WSR90 |
| 372 | WSR92 | RRID:WB_WSR92 | rgaIs1[rgef-1p::NLS-G-GECO1.1-T2A-NLS-DsRed2]; rgaIs2[rgef-1p::NLS-G-GECO1.1-T2A-NLS-DsRed2]; rgaIs3[tax-4p::NLS-mNeptune] | Screened for transgenics |
| 373 | WSR93 | RRID:WB_WSR93 | rgaIs1[rgef-1p::NLS-G-GECO1.1-T2A-NLS-DsRed2]; rgaIs2[rgef-1p::NLS-G-GECO1.1-T2A-NLS-DsRed2]; rgaIs4[glr-1p::NLS-mNeptune] | Screened for transgenics |
| 384 | WSR99 | RRID:WB_WSR99 | kyIs140 [str-2::GFP + lin-15(+)]; nsy-1(ky397); rgaIs1; rgaIs2; rgaIs3 | Genotyped for ky397, screened for transgenics |
| 385 | WSR100 | RRID:WB_WSR100 | nsy-1(ok593); rgaIs1; rgaIs2; rgaIs3 | Genotyped for ok593, screened for transgenics |
| 406 | WSR120 | RRID:WB_WSR120 | rgaEx1[ttx-3p::G-GECO1.1-T2A-DsRed2]; rgaEx2[odr-1p::NLS-G-GECO1.1-T2A-NLS-DsRed2; lin-44p::DsRedT3] | Extra-chromosomal |
| 410 | WSR124 | RRID:WB_WSR124 | rgaIs5[ttx-3p::G-GECO1.1-T2A-DsRed2; odr1-p::NLS-G-GECO1.1-T2A-NLSDsRed2; lin-44p::DsRedT3] | 5033 cGy irradiation of strain WSR120 |
| 411 | WSR125 | RRID:WB_WSR125 | rgaIs6[ttx-3p::G-GECO1.1-T2A-DsRed2; odr1-p::NLS-G-GECO1.1-T2A-NLSDsRed2; lin-44p::DsRedT3] | 5033 cGy irradiation of strain WSR120 |
| 413 | WSR126 | RRID:WB_WSR126 | rgaIs5 | WSR124 was outcrossed 2X with N2, resulting in strain WSR126 |
| 414 | WSR127 | RRID:WB_WSR127 | kyIs408; rgaIs5 | Screened for transgenics |
| 415 | WSR128 | RRID:WB_WSR128 | kyIs408; rgaIs5 | Screened for transgenics |
| 416 | WSR129 | RRID:WB_WSR129 | nsy-7 (tm3080); rgaIs5 | Genotyped for tm3080, screened for transgenics |
| 418 | WSR131 | RRID:WB_WSR131 | kyIs408/+; rgaIs5/+ | Screened for transgenics |
| 420 | WSR133 | RRID:WB_WSR133 | nsy-1(ok593); rgaIs5 | Genotyped for ok593, screened for transgenics |
| 421 | WSR134 | RRID:WB_WSR134 | nsy-1(ok593); rgaIs5 | Genotyped for ok593, screened for transgenics |
Table 2
A list of plasmid constructs used in this study.
| Plasmid Name | Content | Plasmid Construction | Donor Vecotr #1/att-PCRP-att | Donor Vector #2 | Donor Vector #3 | Donor Vector #4 |
|---|---|---|---|---|---|---|
| pWRPN01 | {pENTR L1-odr-1 promoter-L5r} | BP reaction: att-odr-1 promoter-att + pDONR P1-P5r | attB1-odr-1 promoter-attB5r | pDONR P1-P5r | ||
| pWRPN02 | {pDEST R1-chloramphenicol-ccdB-R2/pPD95.75} | pPD95.75 was cut with AgeI and EcoRI to remove GFP, then Gateway cassette RfA was inserted; | ||||
| pWRPN03 | {pENTR L1-ttx-3 element-L4} | BP reaction: att-ttx-3 element-att + pDONR P1-P4 | attB1-ttx- 3 element-attB4 | pDONR P1-P4 | ||
| pWRPN04 | {pENTR L5-DsRedT3-L2} | BP reaction | ||||
| pWRPN05 | {pENTR L1-lin-44 promoter-L5} | BP reaction | ||||
| pWRPN06 | {pENTR L5-NLS-G-GECO1.1-T2A-NLS-DsRed2-L2} | BP reaction: att-NLS-G-GECO1.1-T2A-NLS-DsRed2-att + pDONR P5-P2 | attB5-NLS-G-GECO1.1-T2A-NLS-DsRed2-attB2 | pDONR P5-P2 | ||
| pWRPN07 | {pExp B1-lin-44 promoter-B5-DsRed.T3-B2/pP95.75} | LR reaction: pWRPN05 + pWRPN04 + pWRPN02 | pWRPN05 | pWRPN04 | pWRPN02 | |
| pWRPN08 | {pExp odr-1 promoter-NLS-G-GECO1.1-T2A-NLS-DsRed2/pP95.75} | LR reaction: pWRPN01 + pWRPN06 + pWRPN02 | pWRPN01 | pWRPN06 | pWRPN02 | |
| pWRPN09 | {pEXP ttx-3 element-G-GECO1.1-T2A-DsRed2/pPD95.75} | LR reaction: pWRPN03 + pENTR L4-G-GECO1.1-L3 + pENTR L3-DsRed2-L2 + pWRPN02 | pWRPN03 | pENTR L4-G-GECO-L3 | pENTR L3-DsRed2-L2 | pWRPN02 |
| pWRPN10 | {L3613 rgef-1 promoter-NLS-G-GECO1.1-T2A-NLS-DsRed2} | |||||
| pWRPN11 | {L3613 tax-4 promoter-mNeptune} | |||||
| pWRPN12 | {L3613 glr-1 promoter-mNeptune} |
Table 3
A list of genotyping performed in this study.
| Mutation to Genotype | Forward Primer 5' --> 3' | Reverse Primer 5' --> 3' | Sequencing Primer | PCR Conditions* | Wild-type | Mutant |
|---|---|---|---|---|---|---|
| gcy-8 (oy44) | (WRO245) gcctaccaaattatttcaaacatc | (WRO246) TTGATAATTAAAATGCAAGACGAAC | N/A | Phusion Hot Start II; 1. 98°C, 1:00; 2. 98°C, 0:15; 3. 58°C, 0:30; 4. 72°C, 1:45; 5. Go to 2, 34x; 6. 72°C, 10:00; 7. 4°C | 2225 bp band | 750 bp < band < 1 kb |
| gcy-18 (nj38) | (WRO247) GAATAGAATGAGACGAATGAAATTTG | (WRO248) TGTTACCTACCAAGTGCCTAACTTAC | N/A | Phusion Hot Start II; 1. 98°C, 1:00; 2. 98°C, 0:15; 3. 58°C, 0:30; 4. 72°C, 1:45; 5. Go to 2, 34x; 6. 72°C, 10:00; 7. 4°C | 1459 bp band | ~500 bp band |
| gcy-23 (nj37) | (WRO252) CATCTACGGCTACATCCATCTC | (WRO253) TCCATCATACGCATCATCTG | N/A | Phusion Hot Start II; 1. 98°C, 1:00; 2. 98°C, 0:15; 3. 65°C, 0:30; 4. 72°C, 1:45; 5. Go to 2, 34x; 6. 72°C, 10:00; 7. 4°C | 2141 bp band | 1 kb < band < 1.5 kb |
nsy-1 (ky397)(WRO243) agtcagccatcaagtcctattg | (WRO244) TTTCAACCAACCTGGCC | (WRO268) CGATGATACAAATCACC | Phusion Hot Start II; 1. 98°C, 1:00; 2. 98°C, 0:15; 3. 56.9°C, 0:30; 4. 72°C, 0:20; 5. Go to 2, 34x; 6. 72°C, 10:00; 7. 4°C | atagttcaagtcgattcttcatgcttCaaaaggattcagaacgtagaagatc | atagttcaagtcgattcttcatgcttTaaaaggattcagaacgtagaagatc | |
| nsy-1 (ok593) | (WRO269) agattcatcaatccgagttg | (WRO270) CGAACTCGTTCTTCACGAC | N/A | Phusion Hot Start II; 1. 98°C, 1:00; 2. 98°C, 0:15; 3. 58°C, 0:30; 4. 72°C, 1:45; 5. Go to 2, 34x; 6. 72°C, 10:00; 7. 4°C | ~2.5 kb band | ~280 bp band |
| nsy-7 (tm3080) | (WRO237) atgggataaggttggtaactagc | (WRO238) TACAGGTTGCGAAAGGATATTC | N/A | Phusion Hot Start II; 1. 98°C, 1:00; 2. 98°C, 0:15; 3. 65°C, 0:30; 4. 72°C, 1:30; 5. Go to 2, 34x; 6. 72°C, 10:00; 7. 4°C | ~700 bp band | ~225 bp band |
| osm-9(ky10) | (WRO235) GATTATATCAAATGGAAGAAGGGAG | (WRO236) GAGTCCTGGAGATTCGGG | (WRO255) AACAAGCGGCAAATGCTAGG | Phusion Hot Start II; 1. 98°C, 1:00; 2. 98°C, 0:15; 3. 58.8°C, 0:30; 4. 72°C, 1:30; 5. Go to 2, 34x; 6. 72°C, 10:00; 7. 4°C | ctttaggcCaatcagccctcc | ctttaggcTaatcagccctcc |
| ttx-1 (p767) | (WRO191) ccaaatttcaaaa tttgagcactcaaaactctgcct | (WRO193) GTAGATTCCGAATTTGCTAGTGGTAACGTCC | (WRO196) TTCTGGGATTTTTCAGACTTTCC | Phusion Hot Start II; 1. 98°C, 1:00; 2. 98°C, 0:15; 3. 72°C, 0:30; 4. 72°C, 0:40; 5. Go to 2, 34x; 6. 72°C, 10:00; 7. 4°C | atgaacagcggaaattttGtgggttttttaaaattaa | atgaacagcggaaattttAtgggttttttaaaattaa |
| tax-4 (p678) | (WRO194) CCTACGACGAAAAAATCAGGTGCATACGAC | (WRO195) GGTCCAATGAGATCGTTGAATACTTGTCGAGC | (WRO197) TCAGGTGCATACGACTACG | Phusion Hot Start II; 1. 98°C, 1:00; 2. 98°C, 0:15; 3. 72°C, 0:30; 4. 72°C, 0:40; 5. Go to 2, 34x; 6. 72°C, 10:00; 7. 4°C | gcggccaccggtggtCagccggcatcttccga | gcggccaccggtggtTagccggcatcttccga |
-
*Using Thermo Scientific Phusion Hot Start II High-Fidelity DNA Polymerase
Download links
A two-part list of links to download the article, or parts of the article, in various formats.
Downloads (link to download the article as PDF)
Open citations (links to open the citations from this article in various online reference manager services)
Cite this article (links to download the citations from this article in formats compatible with various reference manager tools)
Pan-neuronal screening in Caenorhabditis elegans reveals asymmetric dynamics of AWC neurons is critical for thermal avoidance behavior
eLife 5:e19021.
https://doi.org/10.7554/eLife.19021


