Cellular encoding of Cy dyes for single-molecule imaging
- University of Iowa Carver College of Medicine, United States
Figures
Figure 1 with 4 supplements

Experimental flow for synthesis and incorporation of Cy fluorophores as ncAAs for single-molecule imaging of plasma membrane proteins in X.
laevis oocytes. Dashed box (top) shows fluorophores used in this study. For details of the procedure see main text.
Figure 1—figure supplement 1
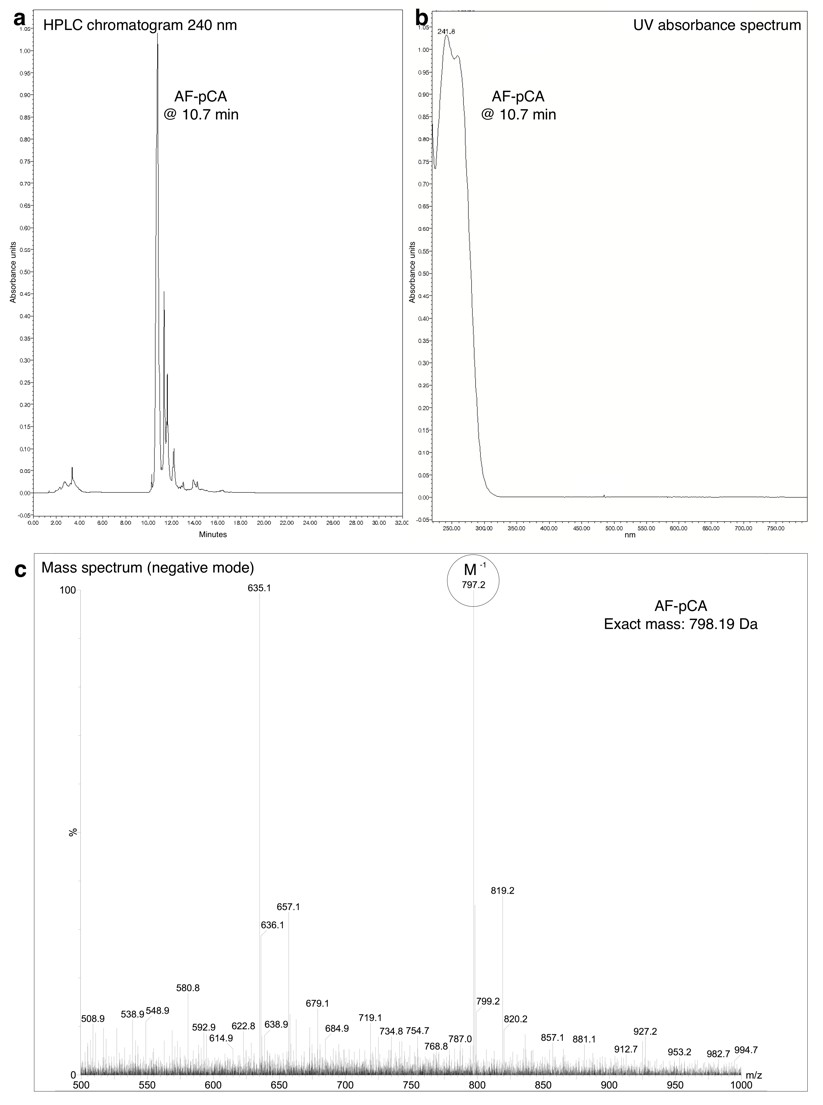
HPLC chromatogram (A), UV absorbance spectrum (B) and LRMS (C) of AF-pCA.
https://doi.org/10.7554/eLife.19088.004
Figure 1—figure supplement 2
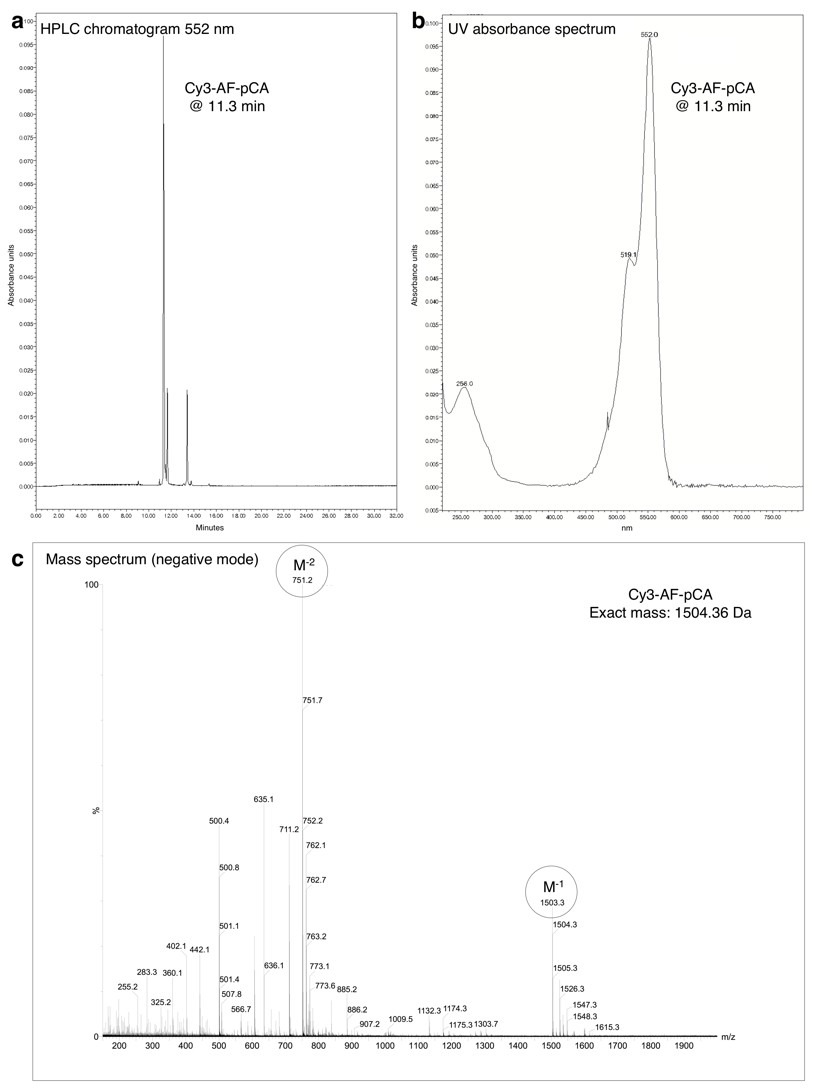
HPLC chromatogram (A), UV absorbance spectrum (B) and LRMS (C) of Cy3-AF-pCA.
https://doi.org/10.7554/eLife.19088.005
Figure 1—figure supplement 3
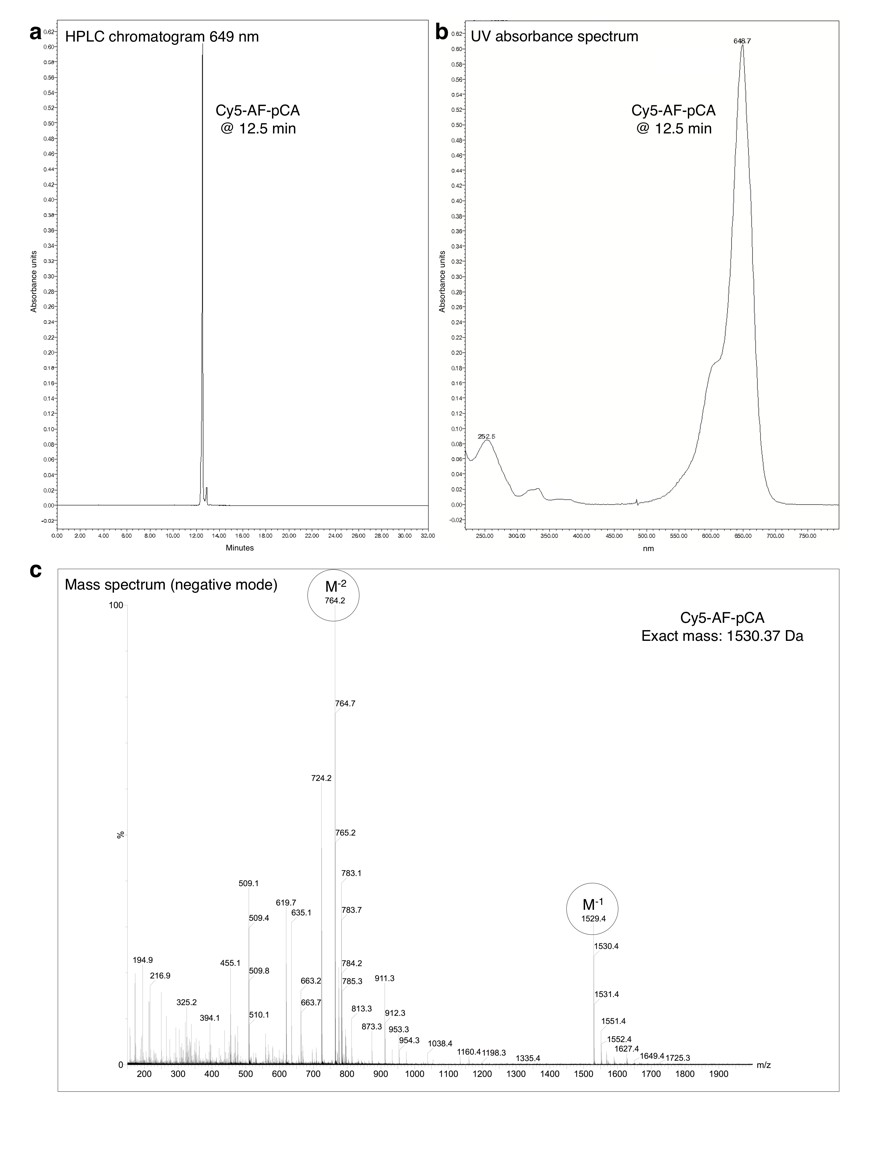
HPLC chromatogram (A), UV absorbance spectrum (B) and LRMS (C) of Cy5-AF-pCA.
https://doi.org/10.7554/eLife.19088.006
Figure 1—figure supplement 4
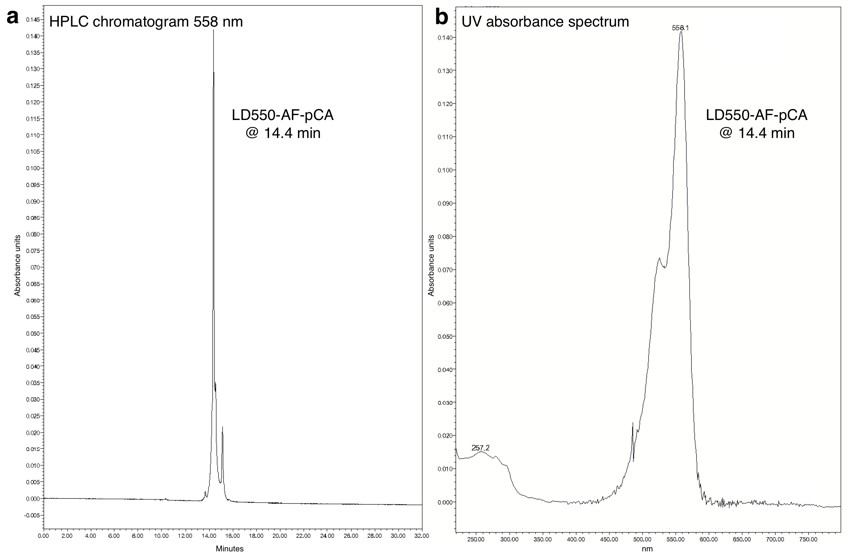
HPLC chromatogram (A) and UV absorbance spectrum (B) of LD550-AF-pCA.
https://doi.org/10.7554/eLife.19088.007
Figure 2 with 2 supplements
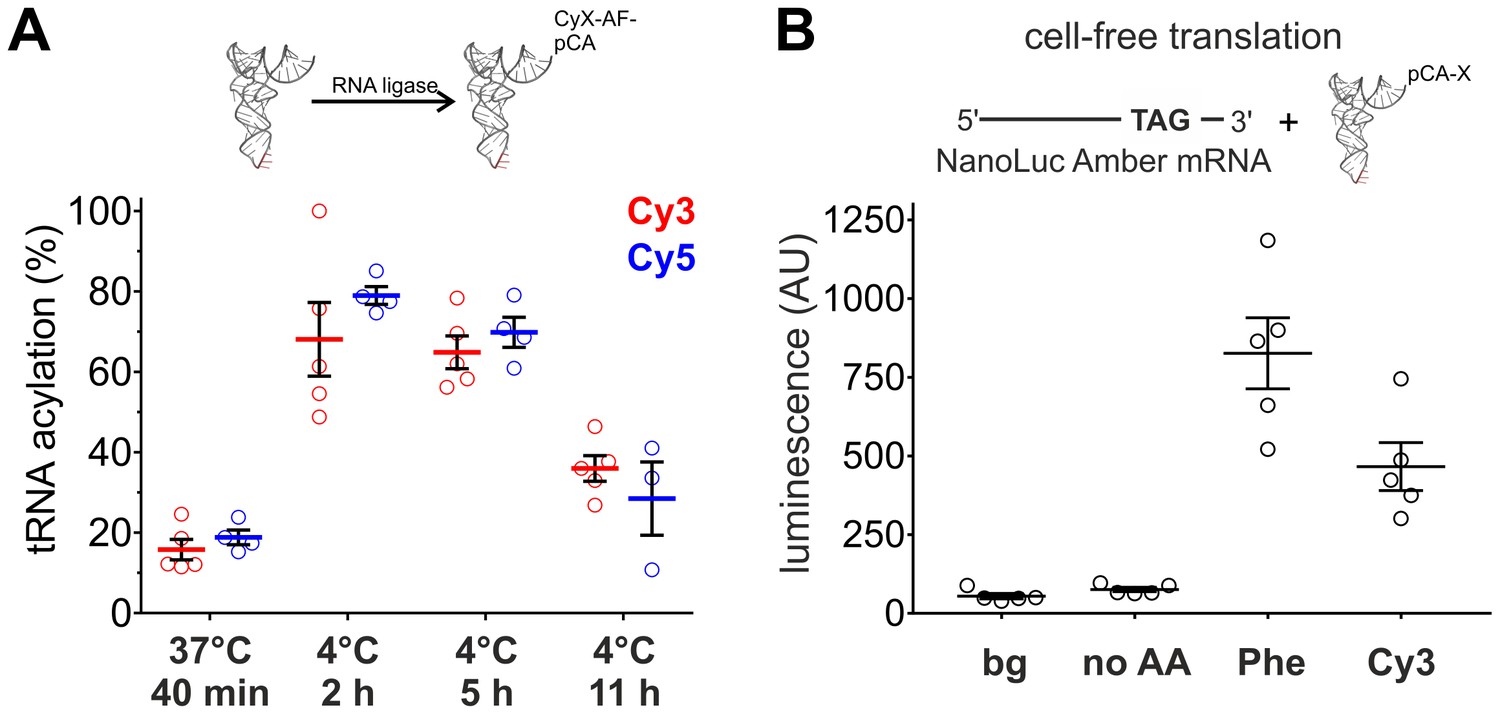
Optimization of tRNA acylation and genetically encoding Cy-ncAAs into soluble proteins in a eukaryotic cell-free expression system.
(A) In vitro acylation efficiency of tRNA with Cy3- or Cy5-AF was determined by absorbance measurements for different RNA ligation conditions (Cy3: N = 5; Cy5: N ≥ 3). Highest efficiencies were found at 4°C after 2 or 5 hr. 4°C, 2 hr was chosen as optimal reaction condition for all further experiments. (B) In a eukaryotic in vitro translation system, Luciferase activity of NanoLuc Amber was rescued by Cy3-AF-tRNA produced 56% of the Phe suppression signal (826 ± 126 AU versus 466 ± 85 AU for Phe and Cy3, respectively). Both of which were well above background (bg) signal or from the Nanoluc Amber plus empty tRNA (no AA). All were quantified by bioluminescence (AU, arbitrary units). The read-through control (no AA) was not significantly different from the background luminescence (bg; p>0.1). NanoLuc Amber Phe is ~11 fold above the no AA condition and Cy3-AF ~6 fold (N = 5, individual values with mean ± s.e.m.).
Figure 2—figure supplement 1
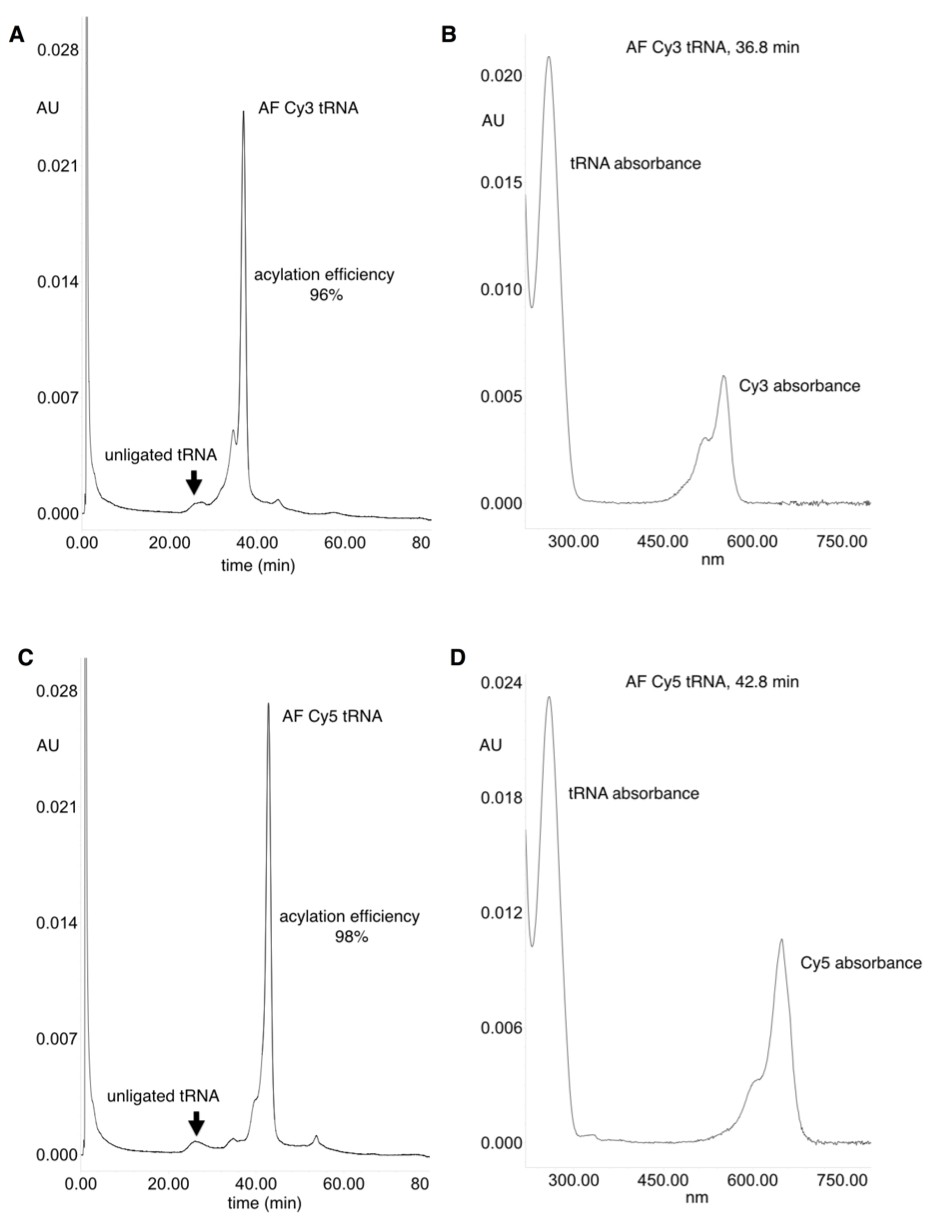
HPLC purification of acylated pyrrolysine tRNA (PylT).
(A) HPLC chromatogram at 260 nm showing a trace of non-acylated and Cy3-AF-acylated PylT at 36.8 min, with 96% acylation efficiency based on area-under-peaks. (B) UV absorbance spectrum of Cy3-AF-acylated PylT. (C) HPLC chromatogram at 260 nm showing a trace of non-acylated PylT and Cy5-AF-acylated PylT at 42.8 min, with 98% acylation efficiency based on area-under-peaks. (D) UV absorbance spectrum of Cy5-AF-acylated PylT. Utilizing a PylT ε260 value of 690,000 M-1cm-1 (http://www.idtdna.com/calc/analyzer) the ratio of tRNA to functionally ligated Cy dyes (using Cy3 ε550 of 150,000 M−1cm−1 and Cy5 ε650 of 250,000 M−1cm−1) was calculated. The ratios of the HPLC UV absorbances at 260 nm and 550/650 nm were compared to the ε260 and ε550/ ε650 values and were both found to be within 30% of the theoretical 1:1 tRNA:CyX ratio.
Figure 2—figure supplement 2
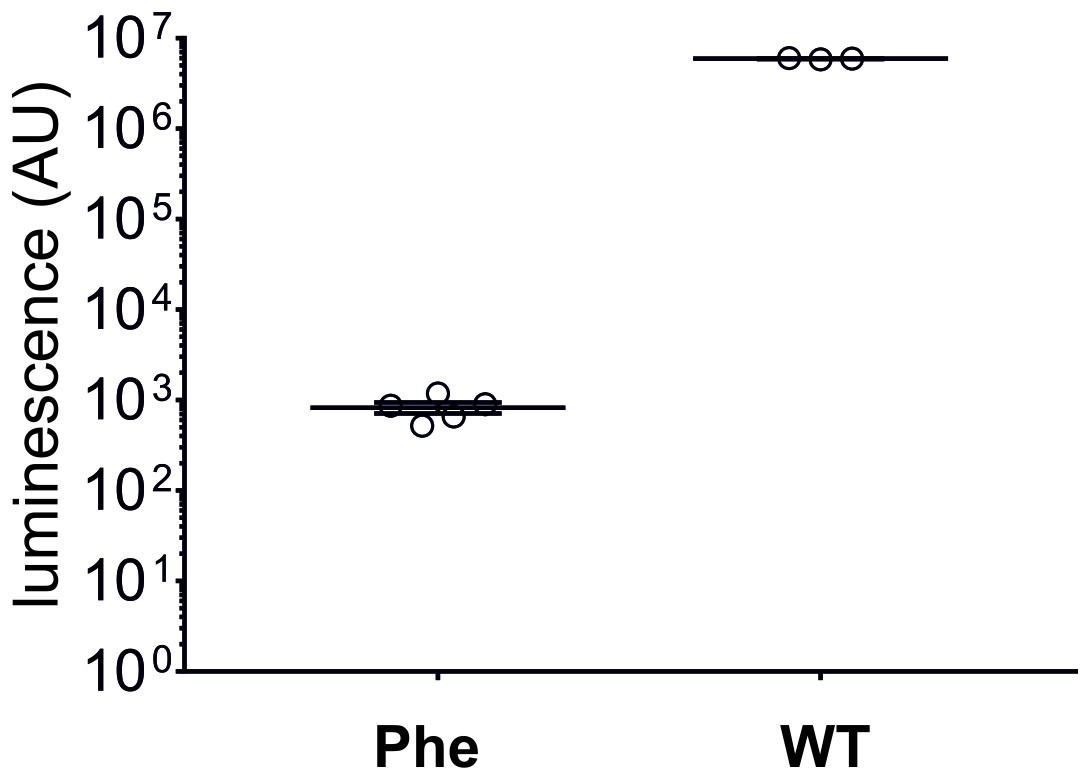
In eukaryotic cell-free translation system, the yield of nonsense suppressed NanoLuc Amber (Phe, N = 5, same data as in Figure 2B) is roughly 7000 times lower than for wild-type NanoLuc (WT, N = 3).
Individual values are shown with corresponding mean ± s.e.m.
Figure 3 with 2 supplements
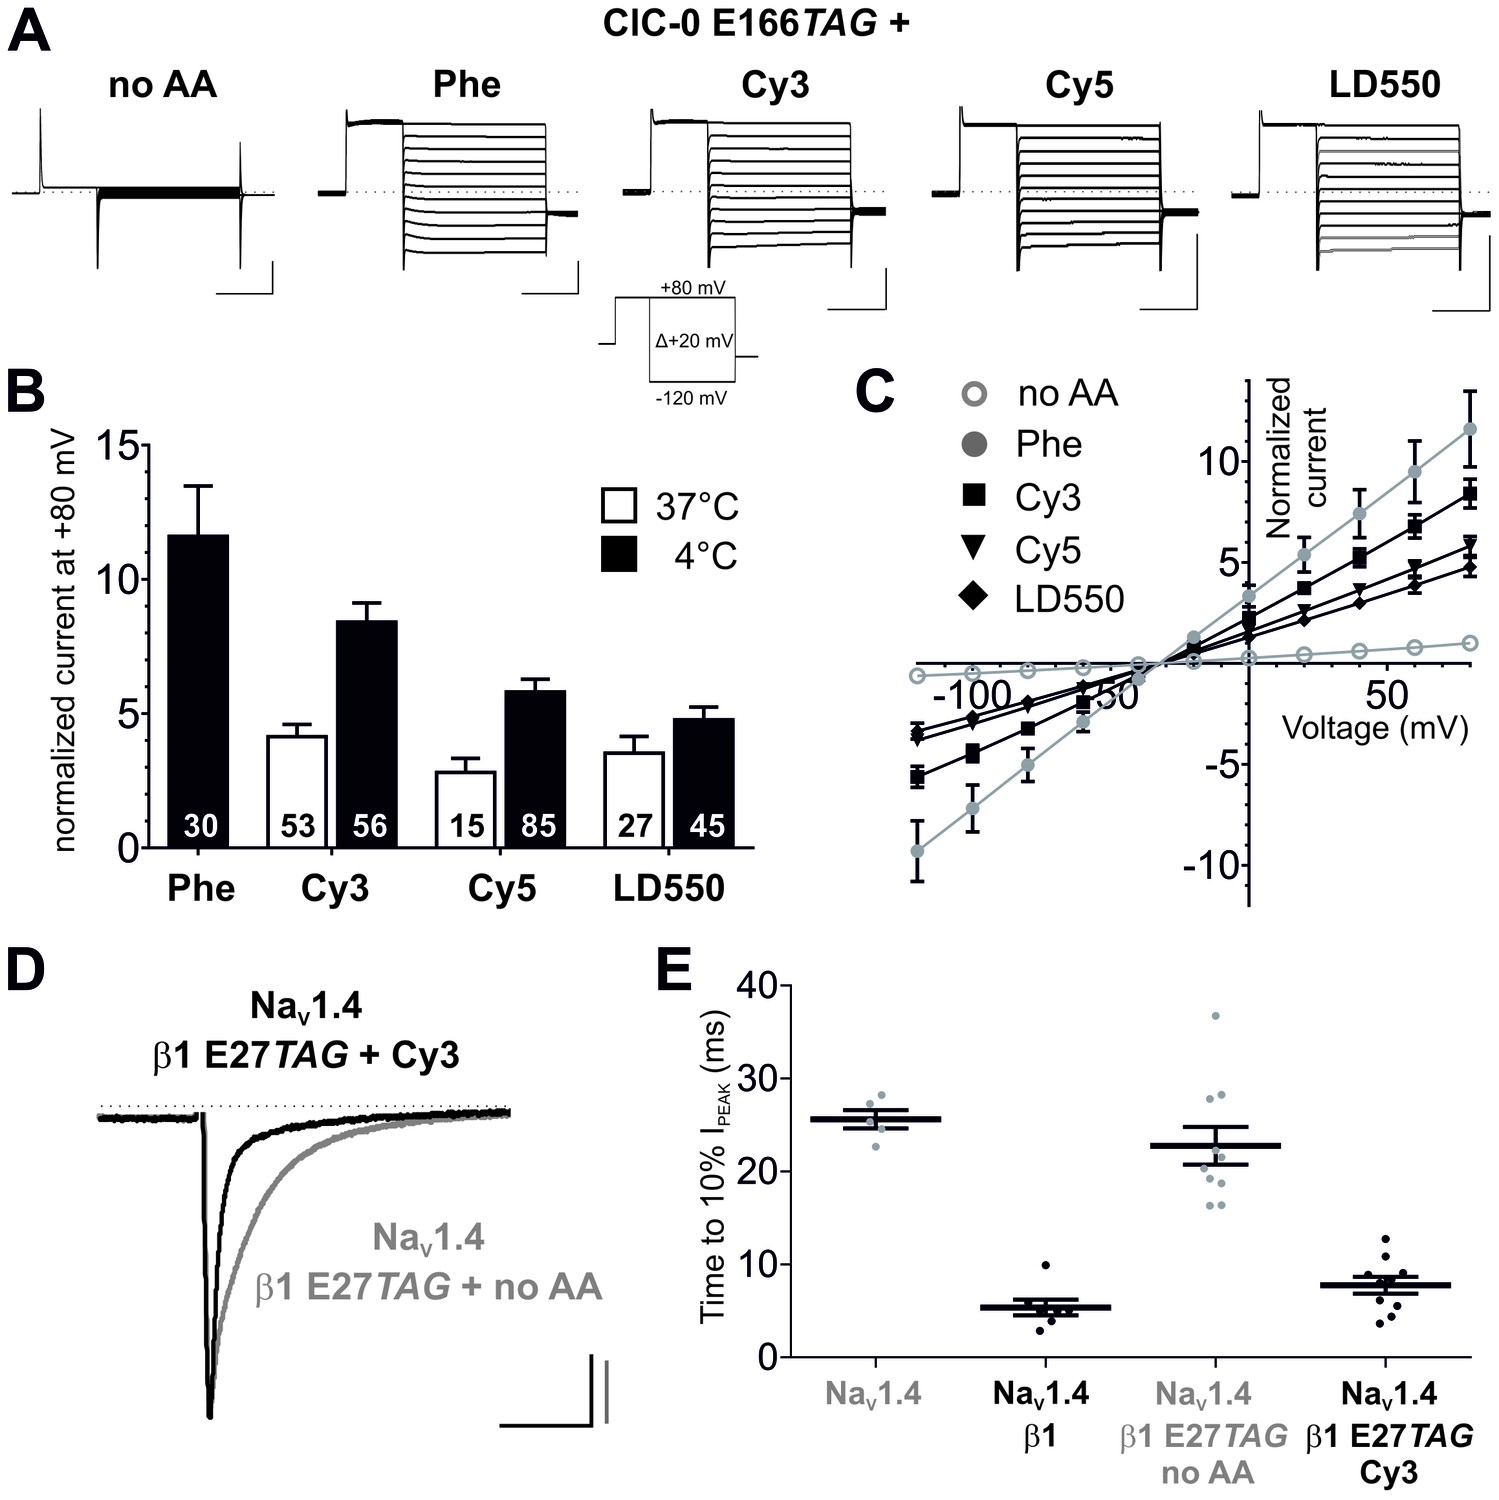
Genetic encoding of Cy-ncAAs into membrane proteins in Xenopus laevis oocytes.
(A) to (C) Nonsense suppression of ClC-0 E166TAG. (A) The chloride channel function of ClC-0 was successfully reconstituted with the misacylated tRNAs (Phe, Cy3, Cy5, LD550) while nonacylated tRNA (no AA) yielded no functional channels. Representative TEVC current recordings and the voltage clamp protocol are shown. Horizontal scale bars indicate time (50 ms), vertical scale bars the current amplitude (10 µA). Note that traces were scaled to unity for clearer presentation of current properties. (B) For quantification, currents elicited by a +80 mV pulse in oocytes expressing reconstituted chloride channels were normalized to currents of the background control (no AA). Black bars indicate rescue by suppressor tRNA acylated at 4°C for 2 hr, white bars show results for tRNA acylated at 37°C for 40 min. For Cy3 and Cy5, rescue of ClC-0 E166TAG has been significantly increased by using tRNAs acylated at 4°C (Cy3: p<0.001; Cy5: p=0.01; LD550: p=0.11). Values for the fold increase in conductance are shown as mean ± s.e.m.; numbers of individual oocytes tested are indicated (for 4°C results were pooled from 5–11 different batches of oocytes; for 37°C from 2–7 batches). (C) Steady-state current-voltage relationships for all conditions shown in (A) and recordings quantified in (B) for 4°C. As predicted, the reconstituted channels behave as voltage-independent, constitutively open conductances with a reversal potential around the chloride equilibrium potential, indicative of a chloride-selective channel. (D) and (E) Nonsense suppression of NaVβ1 E27TAG. (D) Representative TEVC recordings of oocytes coinjected with NaV1.4 and β1 E27TAG + Cy3-tRNA (black) or β1 E27TAG + nonacylated tRNA (grey). Accelerated NaV1.4 fast-inactivation kinetics (black) indicate successful incorporation of Cy3 into β1. Currents were elicited by a 50 ms test pulse to −20 mV from a holding potential of −120 mV. They were scaled to unity for illustration purposes; scale bars: horizontal indicates time (20 ms), vertical indicates current amplitude (1 µA). (E) For quantification of the effect on inactivation kinetics the time period till the peak current (IPEAK) decayed to 10% of its initial value was estimated. Results for NaV1.4 + β1 E27TAG + no AA (23 ± 2.1 ms) were not significantly different from NaV1.4 expressed alone (26 ± 1.1 ms; p=0.36). Both, wild-type β1 and the reconstituted β1, significantly accelerated the inactivation kinetics of NaV1.4 to 5 ± 0.9 ms and 8 ± 1.0 ms, respectively, while not being significantly different from each other (p=0.08). Analysis includes data from two oocyte batches. Values are presented as mean ± s.e.m.
Figure 3—figure supplement 1
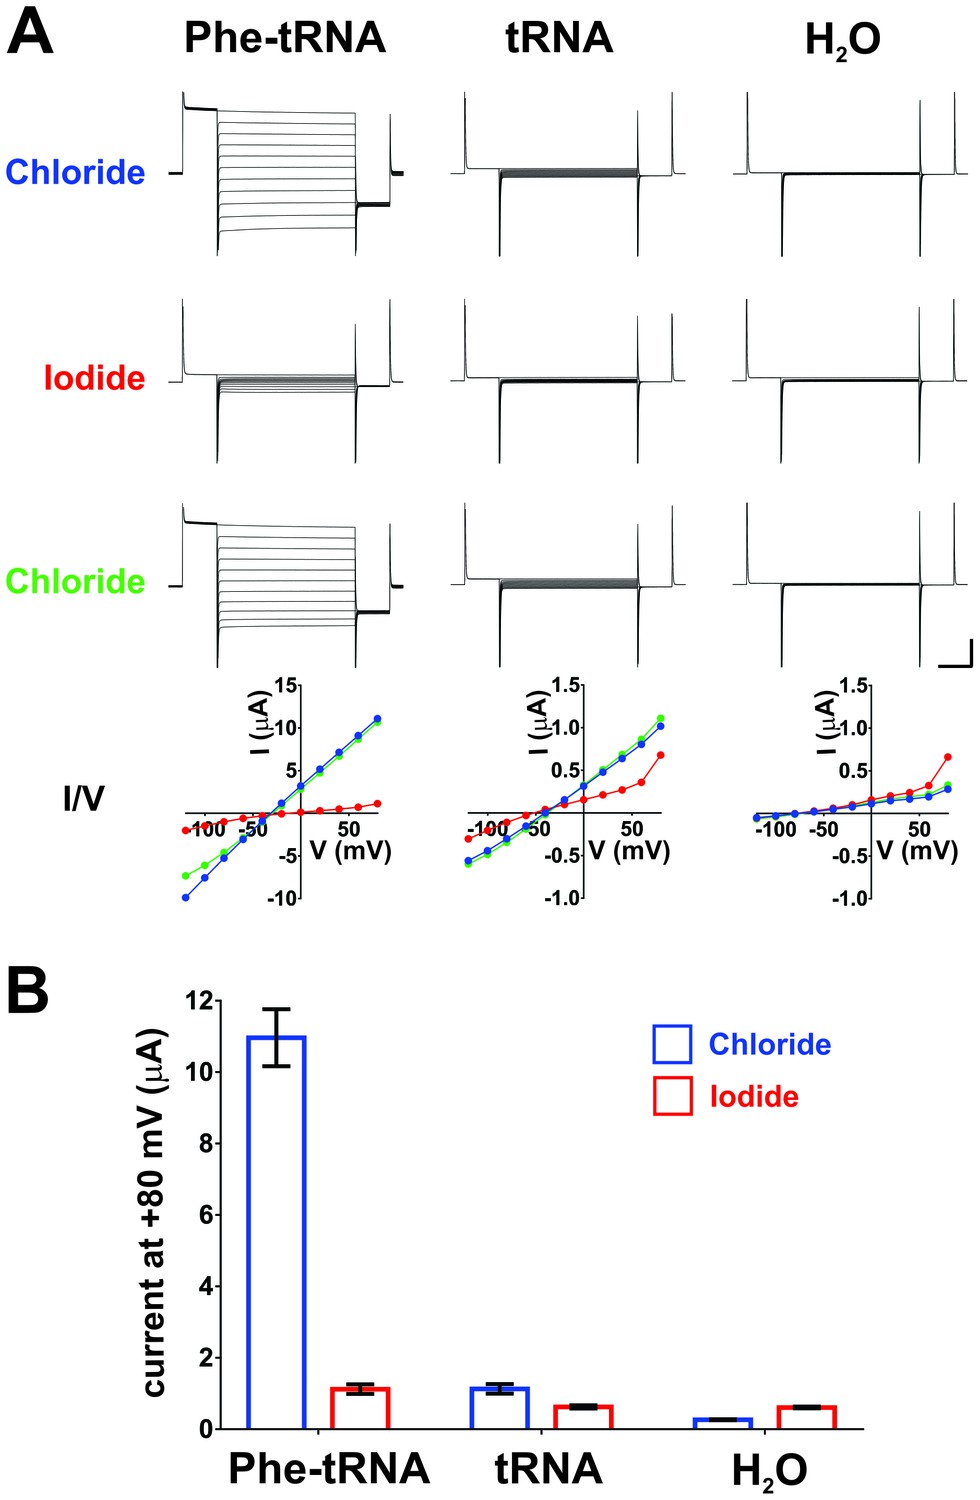
Iodide blocks ClC-0 E166Phe currents, indicating that they are indeed ClC-0 mediated.
(A) Oocytes injected with ClC-0 E166TAG cRNA and Phe-tRNA (left) or ClC-0 E166TAG cRNA and non-acylated tRNA (center) or with water (H2O, right) were perfused with the following sequence of ions: Chloride (blue), Iodide (red), Chloride (green). Representative current traces for each condition and the corresponding current-voltage (I/V) relationships are shown (vertical scale bar: current, 5 µA; horizontal scale bar: time, 50 ms). In Cl--containing saline reversal potentials were estimated to be ~−30 mV for Phe-tRNA (left), ~−40 mV for tRNA and ~−65 mV for H2O (right) injected oocytes. (B) Averaged currents evoked by a +80 mV pulse in Chloride and Iodide, respectively, are shown as mean ± s.e.m. for each condition (n = 7 for Phe-tRNA, n = 5 for tRNA, n = 5 for H2O; from 2–3 different batches of oocytes).
Figure 3—figure supplement 2
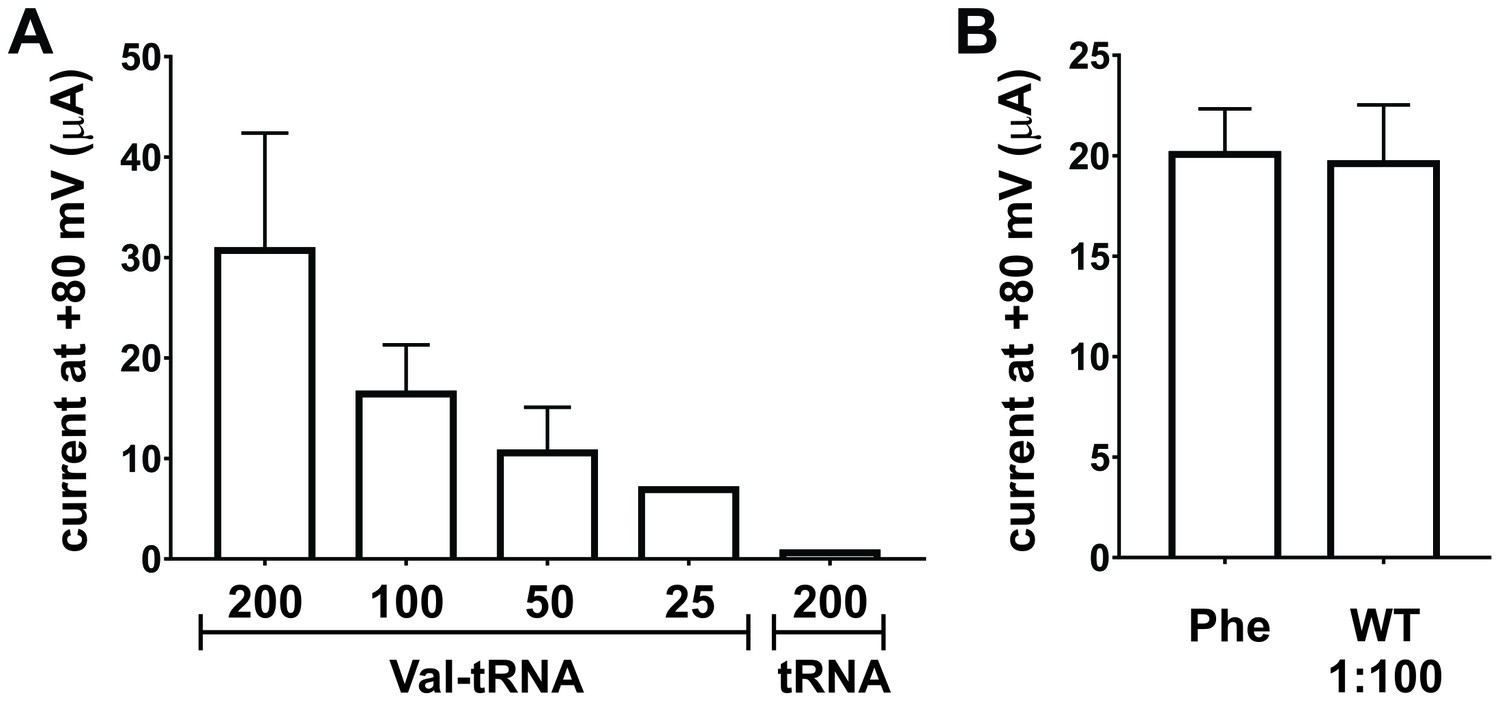
Nonsense suppression efficiency at position E166 in ClC-0.
(A) Optimization of tRNA amounts for nonsense suppression of ClC-0 E166TAG. Oocytes were injected with 7.5 ng of ClC-0 E166TAG cRNA and decreasing Val-tRNA amounts (200/100/50/25 ng per oocyte). As negative control non-acylated tRNA (no AA) was coinjected (200 ng per oocyte). Values represent current amplitudes as mean ± s.e.m. (N = 4 for 1; N = 4 for 1/2; N = 3 for 1/4; N = 3 for 1/8; N = 5 for no AA; from 1 batch of oocytes). (B) Injecting a 100-fold dilution of wild-type (WT) ClC-0 cRNA (0.075 ng per oocyte) produced currents at +80 mV similar in amplitude to ClC-0 E166TAG rescued currents with Phe, where 7.5 ng of cRNA was injected per oocyte. Values are shown as mean ± s.e.m. (N = 30 for Phe, N = 5 for WT from at least three independent batches).
Figure 4
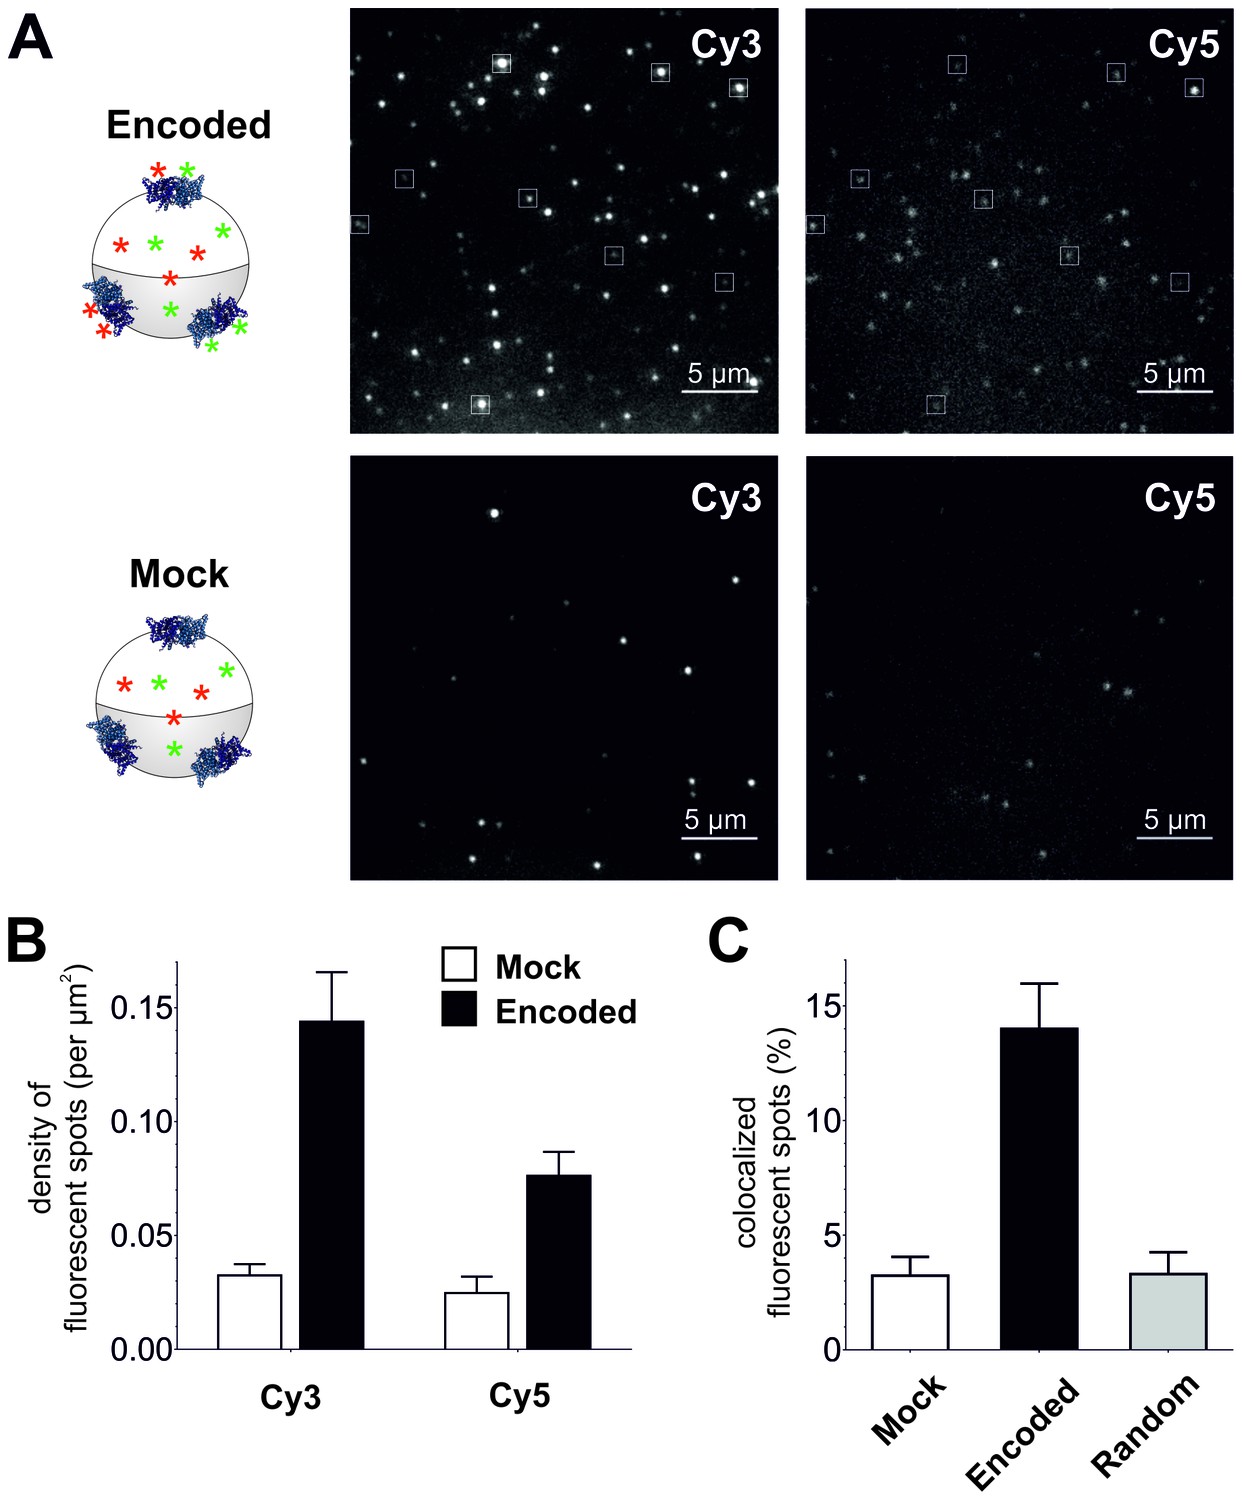
Single-molecule TIRF microscopy imaging of cellular encoded Cy3 and Cy5 fluorophores in ClC-0, a dimeric plasma membrane chloride channel.
(A) TIRF images show distinct fluorescent spots for Cy3 and Cy5 encoded into ClC-0 at position E166 (Encoded (top), Mock (bottom)). A subpopulation of Cy3 and Cy5 spots colocalized (highlighted in white boxes). The encoded and mock injected images were grayscaled to identical levels to enable viewing of both bright and dim spots. (B) Number density of fluorescent spots per area (µm2) of plasma membrane was significantly different between Encoded (black) and Mock (white). p values see main text. Total numbers of counted spots included in this analysis are: N = 4406 for encoded Cy3, N = 2459 for encoded Cy5, N = 1154 for mock Cy3, N = 717 for mock Cy5; they result from ≥5 oocytes (≥3 batches) per condition (C) Same images as in (B) were examined for colocalization between Cy3 and Cy5. In Encoded, 14 ± 2% of the Cy5 signal merged with Cy3. Random colocalization in those images was estimated to 3 ± 1% and colocalization in Mock was not significantly different from that (p=0.96). All values are mean ± s.e.m.
Figure 5 with 1 supplement

Photo-bleaching profiles for Cy3 and Cy5 spots in Encoded and Mock conditions.
(A) and (B) Photo-bleaching events of Cy3 and Cy5 fluorescent spots in the Encoded sample. (A) Example of a 5-step photo-bleaching event of a fluorescent spot showing Cy3 (top) or Cy5 fluorescence (bottom), respectively, in an oocyte co-injected with ClC-0 E166TAG cRNA as well as Cy3- and Cy5-tRNA. A single representative frame was selected from the video sequence showing step-wise reduction in spot-intensity. Presented area size is 20 pixels x 20 pixels. (B) Examples of fluorescence traces (in arbitrary units, AU) as a function of time show step-wise photo-bleaching for Cy3 (left) and Cy5 (right), respectively, until complete photo-destruction of the fluorophore was achieved. Arrows indicate observed steps during the bleaching process; N is equal to the total number of identified steps. (C) Photo-bleaching histogram for Cy3 and Cy5 spots in Encoded and Mock reveal a distribution distribution of steps: while in Mock 1-step events strongly dominated, in Encoded the distribution was clearly shifted towards 2+ steps. Values represent absolute numbers for the identified bleaching step event analyzed from an equal number of frames for each condition (five oocytes, three batches). In total, following numbers were included: N = 1564 for encoded Cy3, N = 762 for encoded Cy5, N = 296 for mock Cy3, N = 300 for mock Cy5.
Figure 5—figure supplement 1
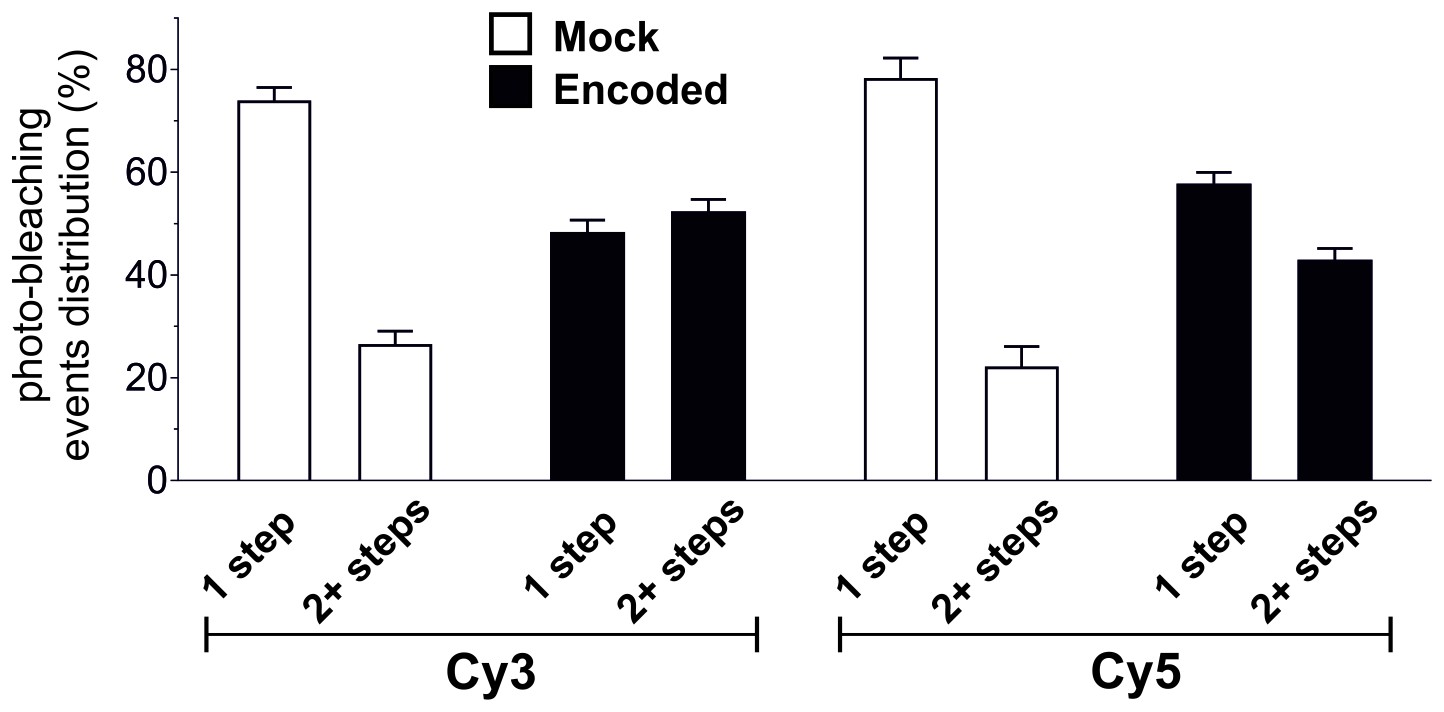
Photo-bleaching profiles for Cy3 and Cy5 spots in Encoded and Mock.
For clarity, results from Figure 5C are shown here as relative photo-bleaching event distributions. In each case, the Encoded conditions produce a statistically significant difference (p<0.0001) over Mock distributions. All values are mean ± s.e.m. In total, following numbers were included: N = 1564 for encoded Cy3, N = 762 for encoded Cy5, N = 296 for mock Cy3, N = 300 for mock Cy5.
Additional files
-
Supplementary file 1
Membrane proteins carrying TAG as native stop codons identified from EST databases of Xenopus laevis oocytes stage V and VI.
In total, Xenopus laevis oocytes of stage V and VI express 1300 genes (see Materials and methods) and 18% of those (234 genes) contain TAG as a stop codon. 43 (shown here) are predicted to be membrane proteins, roughly half of which are categorized as mitochondrial proteins or proteins with unknown function.
- https://doi.org/10.7554/eLife.19088.017
Download links
A two-part list of links to download the article, or parts of the article, in various formats.
Downloads (link to download the article as PDF)
Open citations (links to open the citations from this article in various online reference manager services)
Cite this article (links to download the citations from this article in formats compatible with various reference manager tools)
Cellular encoding of Cy dyes for single-molecule imaging
eLife 5:e19088.
https://doi.org/10.7554/eLife.19088


