Decoding gripping force based on local field potentials recorded from subthalamic nucleus in humans
- University of Oxford, United Kingdom
- John Radcliffe Hospital, University of Oxford, United Kingdom
- Kings College Hospital, Kings College London, England
- UCL Institute of Neurology, United Kingdom
Figures
Figure 1
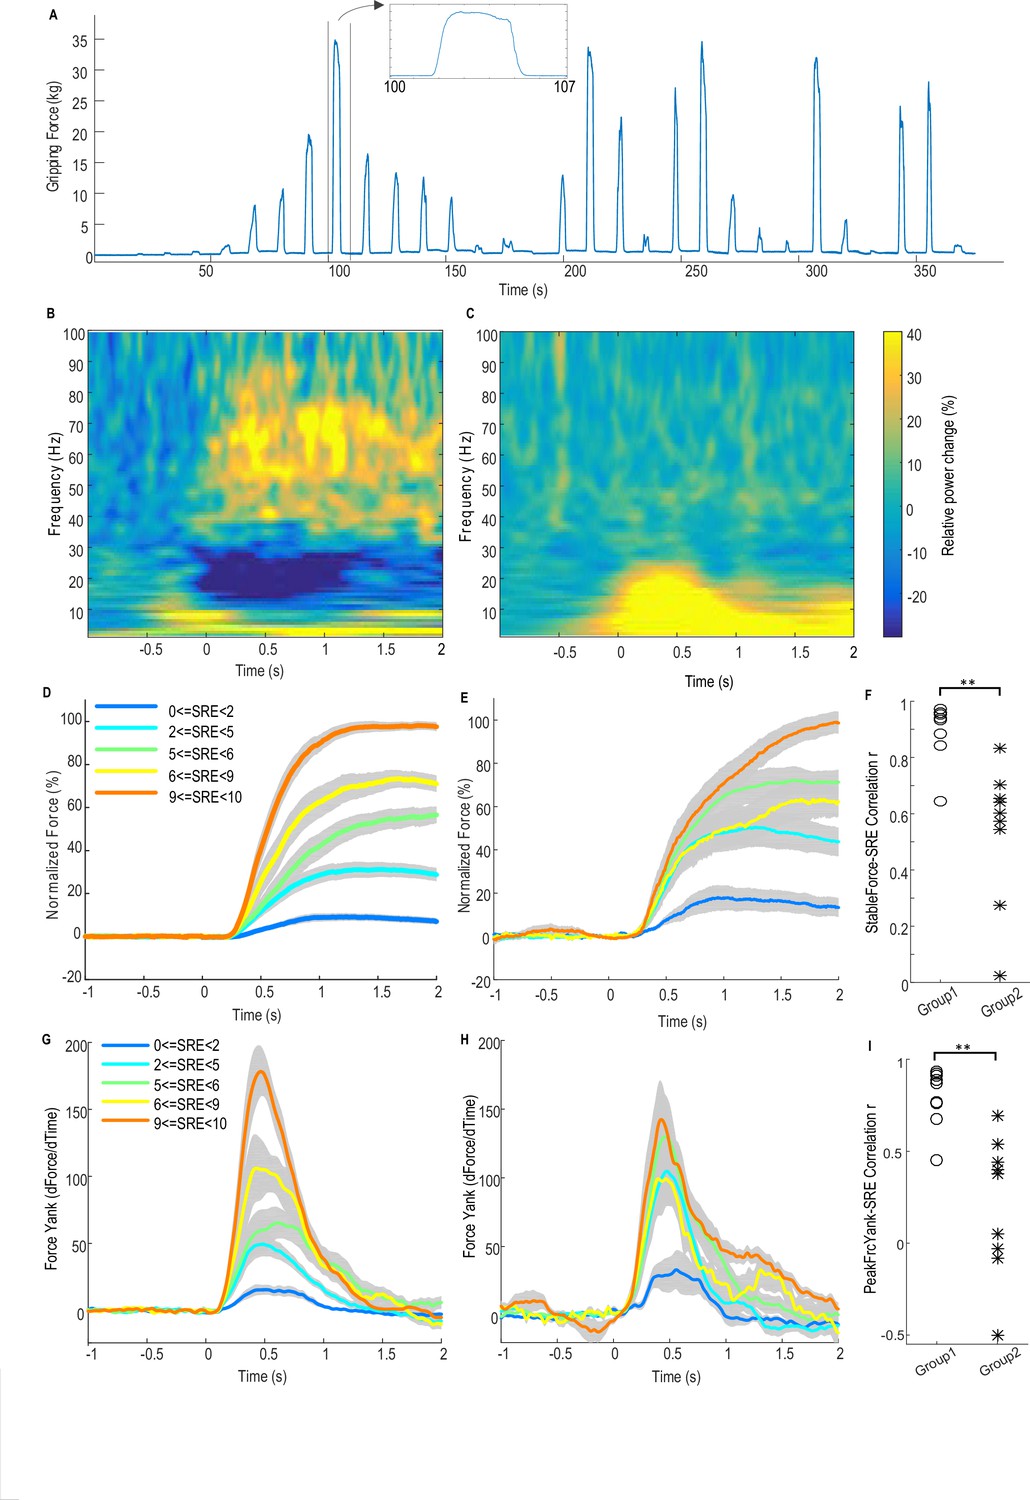
Force-effort scaling and spectra of average power changes relative to pre-movement baseline for two groups of electrodes.
(A) Trajectory of measured force from one exemplar subject. (B) From one group of electrodes (n = 9), a significant reduction of power in the beta band (13–30 Hz) and increase in power in the broad gamma band (55–90 Hz) was observed during gripping. (C) In another group of electrodes (n = 9), significant simultaneous modulation was absent in the beta and gamma band with movement, and there was instead an increased power across the low frequency band during gripping. Trajectories of force (D) and force yank (G) for Group one show that the stable force during the holding phase (1–2 s after cue) as well as the peak force yank in the force initialisation phase scaled well with self-rated effort (SRE). In group 2, the stable force (E) and force yank (H) did not scale with effort as well as Group 1. Group two had significantly lower correlation coefficients between stable force and SRE (F) and between the peak force yank and SRE (I) compared with group 1 (p<0.0001), indicating some impairment in the scaling of force with effort. Time 0 indicates the onset of the cue to start a grip in B–E, G and H. Note that data from three electrodes are excluded. Of these, two had significant modulation in the beta band but not in the gamma band, and one had significant modulation in the gamma band, but not in the beta band.
-
Figure 1—source data 1
The Matlab data file containing source data related to Figure 1.
The variables ‘Group1_PowChange’ and ‘Group2_PowChange’ contain data about average movement-related power changes between 1 Hz and 90 Hz in the two STN groups, respectively. The variables ‘Group1_ Force_DifSRE’, ‘Group1_ FY_DifSRE’, ‘Group2_ Force_DifSRE’, ‘Group2_ FY_DifSRE’ contain data about the average force trajectories and force yank trajectories at each effort range for each STN in Group one and Group 2. The variables ‘Group1_Corr_FrcSRE’, ‘Group1_Corr_FySRE’, ‘Group2_ Corr_FrcSRE’’, ‘Group2_Corr_FySRE’ contain correlation coefficients between stable force or peak force yank and self-rated effort for each STN in the two groups.
- https://doi.org/10.7554/eLife.19089.004
Figure 2
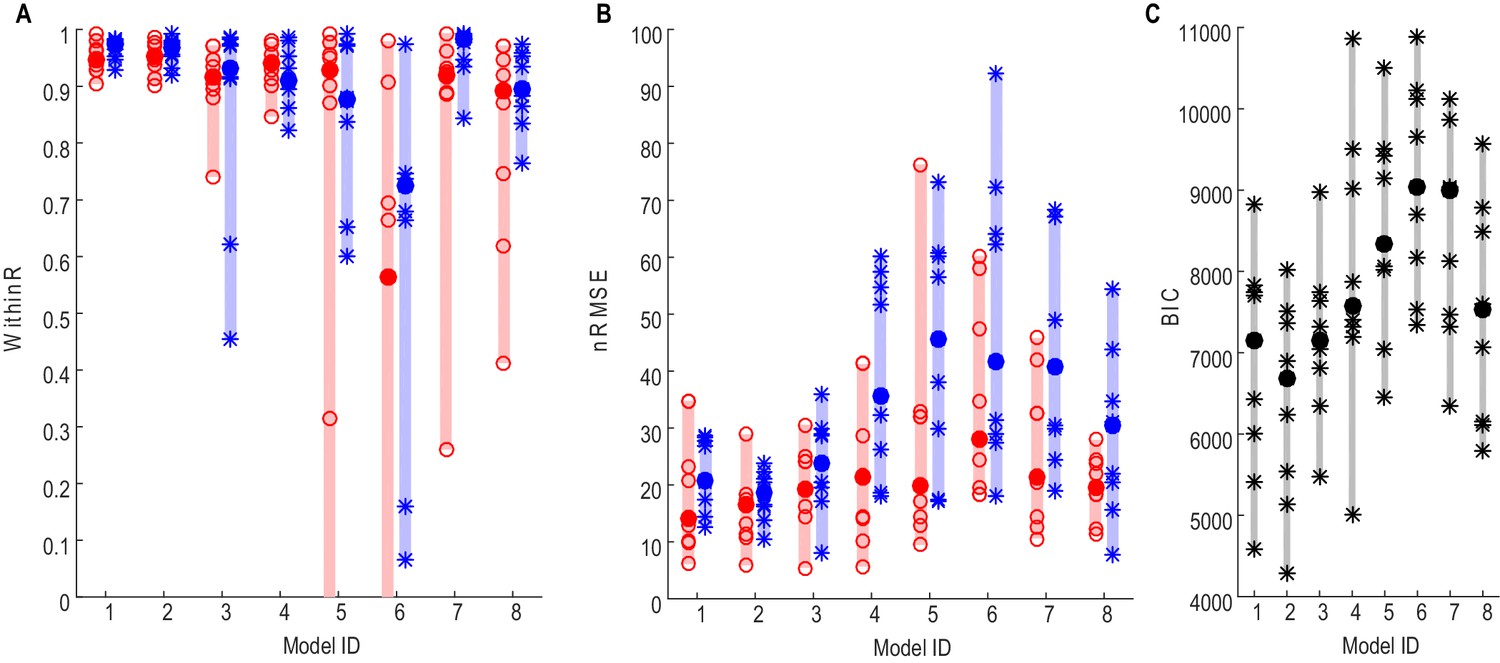
Force prediction performances of different models evaluated in terms of within-trial correlation (A), RMSE (B) and BIC (C).
The filled dots and shaded bars show the median and range across all STNs; the open circles and stars show the data for each individual STN. The red dots and bars show performance in predicting high effort forces, while using data from low effort trials for model fitting; the blue dots and bars show performance in predicting low effort forces, while using data from high effort trials for model fitting. (C) The total BIC values combing the force predictions for low effort and high effort for all tested models. The filled dots and shaded bars show the median and range across all STNs; the stars show the data for each individual STN (some overlap). Models 1–3 use beta and gamma ERS as model inputs; Models 4–5 use activities from all three frequency bands (alpha, beta and gamma) as model inputs; Models 6–8 use activities from a single frequency band (alpha, beta and gamma, respectively) as model inputs.
-
Figure 2—source data 1
The excel data file related to Figures 2 and 6.
It contains data about median WithinR and the normalized RMSE when different models were used for force prediction, as well as the average power modulations at the beta band and gamma band for each STN that was recorded in the main paradigm and used for the analysis.
- https://doi.org/10.7554/eLife.19089.008
Figure 3
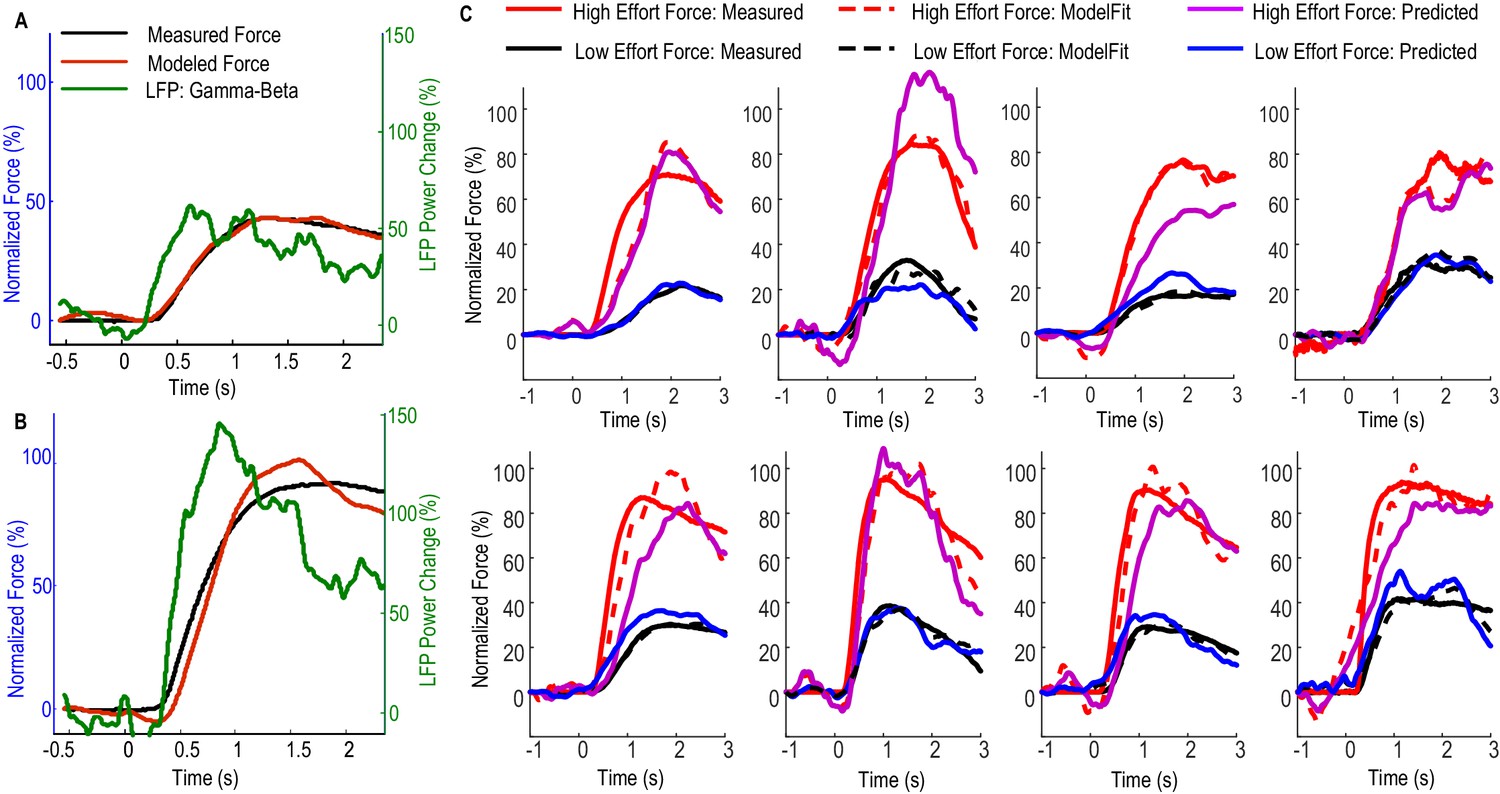
Fitting and predicting performance of the model for predicting force averaged across multiple trials.
(A) The fitted model based on data from low effort trials for one exemplar STN and the contralateral hand. (B) The fitted model was used to predict the average force for high effort trials for the same STN and contralateral hand. (C) The fitted (dashed lines) and predicted force were compared against the measured force for the other 8 STNs in which consistent movement-related modulations in both beta and gamma bands were observed. Predicted force traces for high effort trials were derived from the model fitted to data from low effort trials and vice versa. Time 0 indicates the onset of the cue to start a grip in all plots.
-
Figure 3—source data 1
The Matlab data file containing source data related to Figure 3.
The variable names are self-explanatory. ‘DataPlotC.Axisi’ contain data for the ith axis in PlotC. Column 1–7 in this variable corresponds to time, predicted force for a low effort, predicted force for high effort, fitted the force for a high effort, fitted the force for a low effort, measured the force for a high effort and measured the force for a low effort, respectively.
- https://doi.org/10.7554/eLife.19089.010
Figure 4
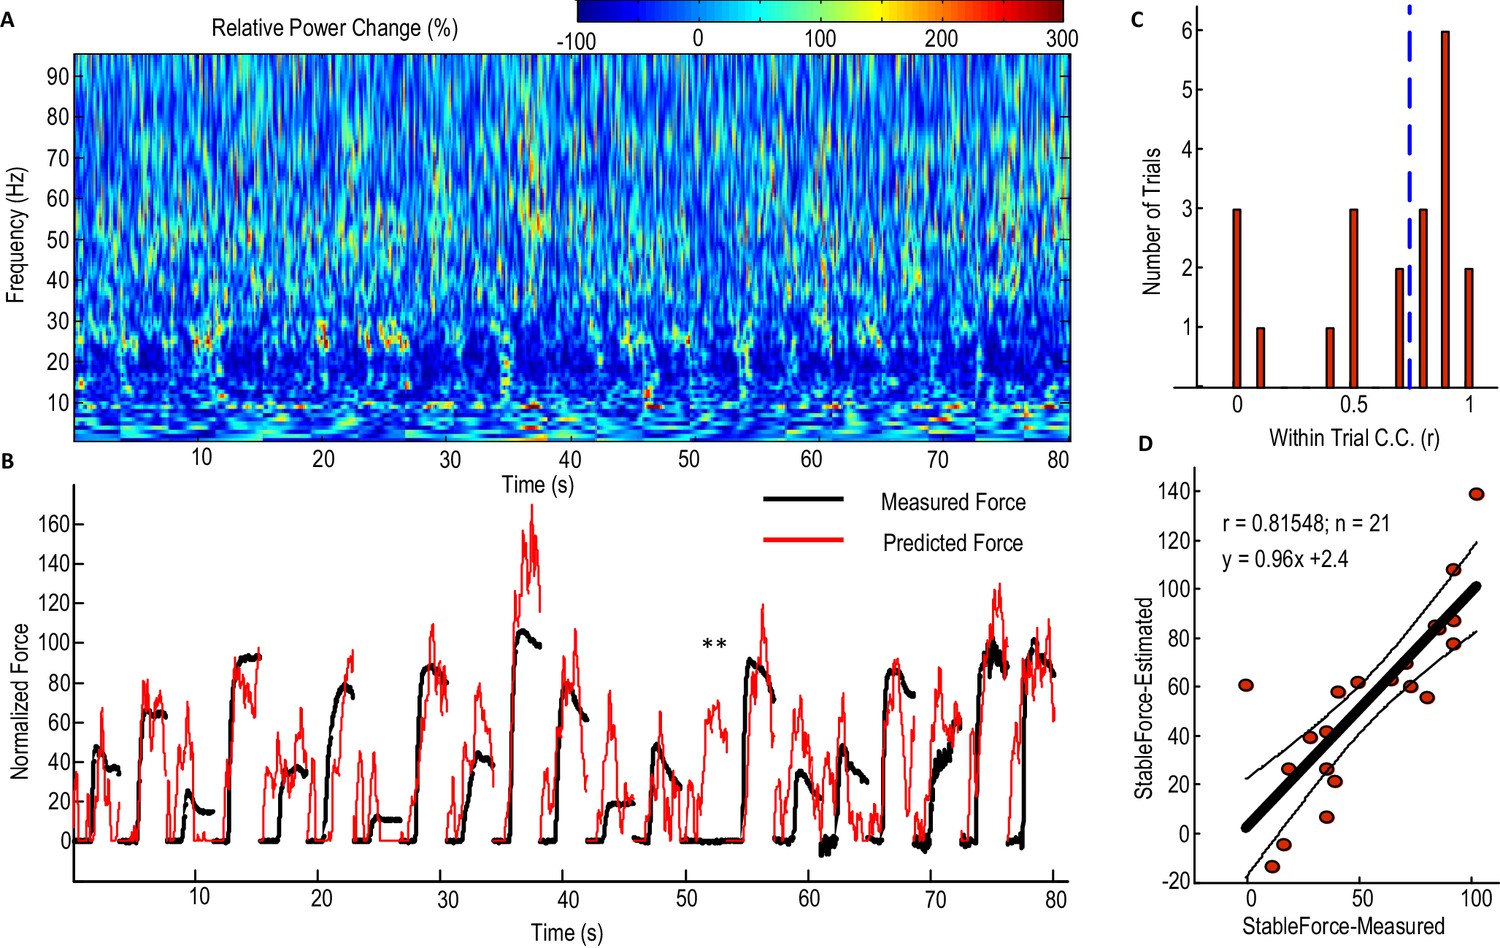
Predicting force profile of individual grips based on beta and gamma activities from STN LFP (one exemplar subject).
(A) Time-evolving power spectrum of the bipolar STN LFP channel used for decoding force. (B) The predicted force (in red) compared with the measured force (in black). ** indicates the trial where STN LFP predicted increased force but with no measured force from the dynamometer. Grips are concatenated in A and B. (C) Distribution of the within-trial correlation coefficient (WithinR) between predicted force and measured force, with the dashed blue line the median value of the WithinR for all trials. (D) Scatter plot between the predicted stable force (average force during the second of holding phase) and measured stable force for all tested trials. The correlation coefficient between the predicted and measured stable force across trials was 0.815 for this subject. The regression slope of 0.96, which is close to 1, shows that there is no systematic under-estimation. The black lines show the regression line and 95% confidence interval.
-
Figure 4—source data 1
The Matlab data file containing source data related to Figure 4.
The variable ‘DataPlotA’ is a data structure containing fields about the movement-related power changes over time (‘ERS’) for one exemplar subject. ‘DataPlotB’ is a data structure containing fields about measured force (‘MeasForce’) and predicted force based on Model 2 (‘EstForce’). ‘DataPlotD’ is a data structure containing measured stable force and predicted stable force for each individual trial and the linear regression between them.
- https://doi.org/10.7554/eLife.19089.012
Figure 5

STN LFP features predict gripping force profile generated by the contralateral hand.
(A) The correlation coefficients between the measured stable force and the predicted stable force were higher for the force generated by the contralateral hand than that by the ipsilateral hand. There was no significant difference when different models based on both beta and gamma activities from STN LFP were used. The dots and bars show the median value and the range of values for different STNs. ** indicate a significant difference in the prediction performance when the LFPs from the ipsilateral STN was used for decoding. (B) The histogram of the within-trial correlation coefficients between predicted force and measured force (WithinR) for the contralateral hand considering all the trials and all the STNs. (C) Cumulative distribution function (CDF) of the WithinR for the force generated by the contralateral hand (solid lines) and the ipsilateral hand (dashed lines). The CDF indicates the probability that WinthinR has a value less than or equal to a certain value on the x-axis. Data presented in this figure are for all the STNs in which significant modulations were observed in both the beta band and gamma band.
-
Figure 5—source data 1
The Matlab data file containing source data related to Figure 5.
The variable ‘WithinR_Test_Contr’ contains data for the WithinR for each individual trial when Models 1–5 were used to predict force generated by the contralateral hand, for the 9 STNs in the main paradigm that are included in the main analysis. ‘WithinR_Test_Ipsi’ contains the WithinR when the models were used to predict force generated by the ipsilateral hand. ‘StbR_Test_Contr’ and ‘StbR_Test_Ipsi’ contain the correlation coefficients between the predicted stable force and measured stable force for the 9 STNs when different models were used.
- https://doi.org/10.7554/eLife.19089.014
Figure 6
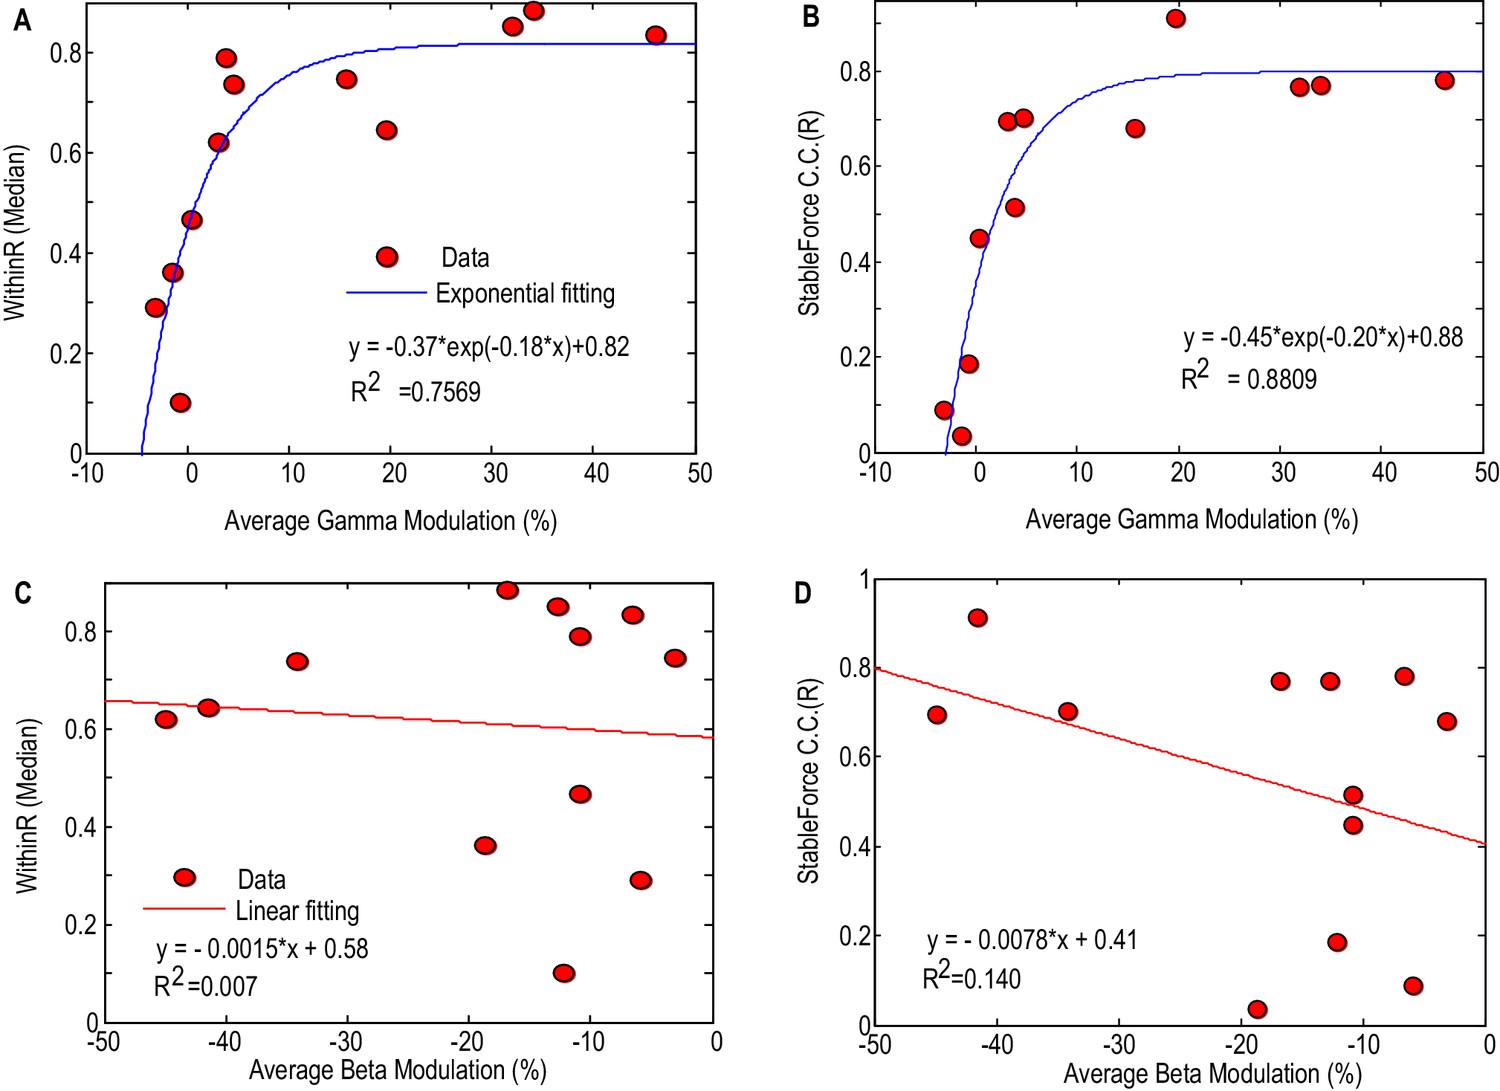
Factors affecting the gripping force prediction performance.
The median values of the WithinR (A) and stable force correlation coefficients (B) increased with the average movement- related modulation in the gamma band. Each dot is the data for one STN and the blue line shows the exponential fit of the data (, p<0.001 for the fitting). The median values of the WithinR (C) and stable force correlation coefficients (D) show a trend of increasing with average movement related desynchronization in the beta band. The blue lines show a linear fitting, but the fits were not significant. In this Figure, we consider all the STNr with significant movement-related modulations, whether either in one or other, or both frequency bands of interest (N = 12).
Figure 7

Validation of the models for force prediction on an independent patient group during maximal effort gripping.
(A) Average power change in the STN LFP activity associated with the gripping movement. The power change is relative to the average over a 1 s period pre-cue. Time 0 is the timing of cue onset. (B) Median WithinR for individual STN and contralateral hands, * indicates data for each individual STN and contralateral hand. (C) Histogram and (E) cumulative distribution function (CDF) of the WithinR for all the 397 individual trials across all the 20 STNs. (D) BIC analysis showed that Model 4 considering alpha, beta and gamma power changes significantly improved force prediction compared to Model 2 during maximal effort gripping. * indicates p<0.05 using a paired t-test.
-
Figure 7—source data 1
The Matlab data file containing source data related to Figure 7 (data from an independent patient group on a maximal effort gripping paradigm).
The variable ‘ERS_AllSTN’ contains the average movement related power changes from 1 to 90 Hz in the LFP signal from each STN recorded. ‘WithinR_IndividualSTN’ contains data of WithinR for each individual trial recorded from each individual STN when Models 1–5 that are tested on this paradigm. ‘WithinR_Median_AllSTN’ contains data for the median WithinR from each STN for the five models that are tested. (Data for Models 2 and 4 are presented in Figure 7).
- https://doi.org/10.7554/eLife.19089.017
Figure 8
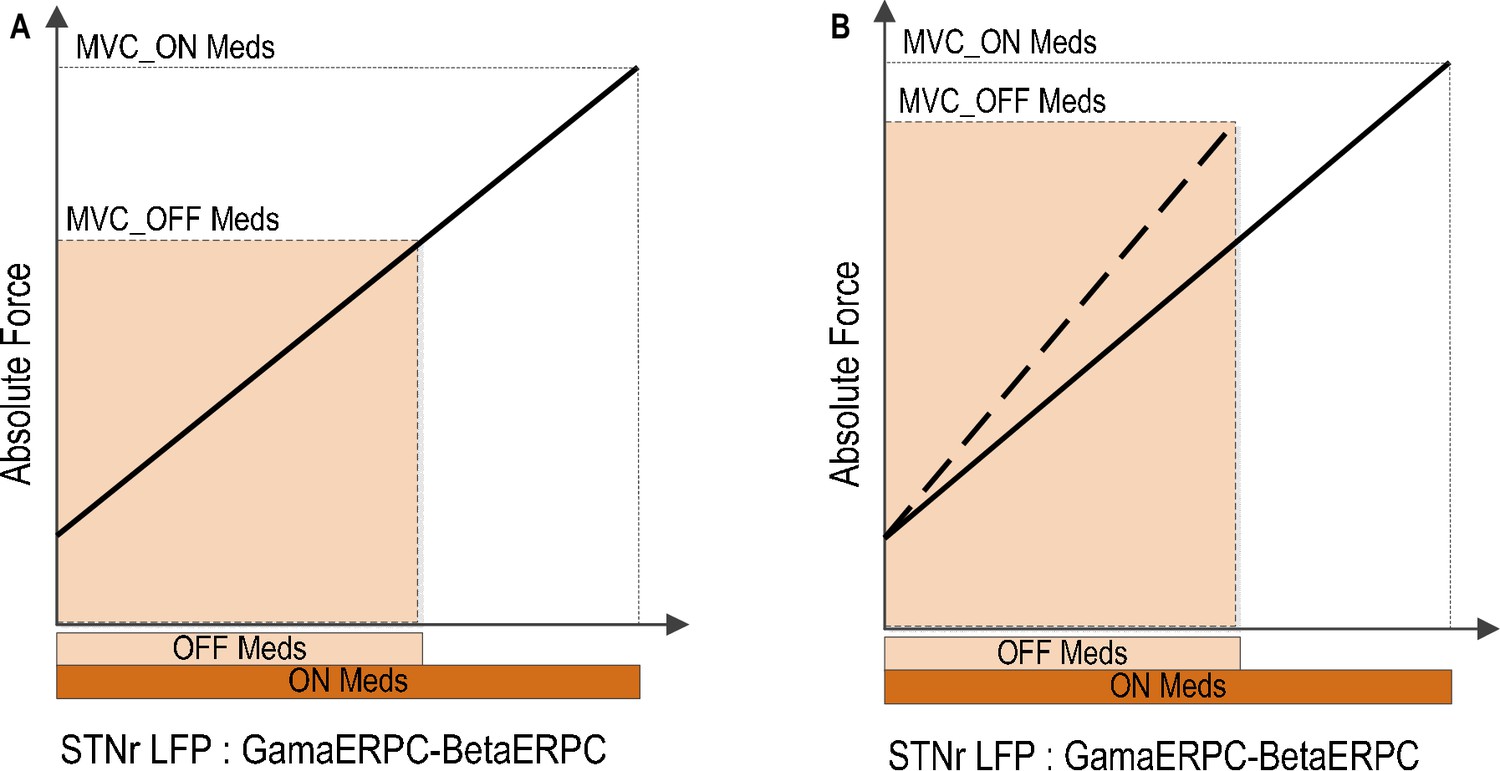
Implications of reduced movement related modulation in beta and gamma band activity in STN LFP with reduced dopaminergic input.
(A) The range of forces that can be generated will be reduced if the scale between the STN encoding signal and the force is to remain the same. This will lead to unscaled, bradykinetic force generation. (B) The scale between the STN encoding signal and the force will be increased if the range of force that can be generated is to be kept similar. This will lead to abnormally high force generation and more coarse force control.
Tables
Table 1
Patient details and movement-related modulated in beta and gamma bands.
Patient ID | Age (yrs) | Gender | PD duration (yrs) | Main symptoms | Daily dose (mg) | UPDRS part III (Pre-op) | Movement related power change (%) and electrode localisation | Stimulation effect | ||||||||||||
|---|---|---|---|---|---|---|---|---|---|---|---|---|---|---|---|---|---|---|---|---|
Left STN | Right STN | |||||||||||||||||||
OFF | ON | Bipoloar channel | Beta ERD | Gamma ERS | Localisation | Most %beta | Stim setting | Bipoloar channel | Beta ERD | Gamma ERS | Localisation | Most % beta | Stim setting | |||||||
1 QS | 49 | M | 13 | Stiffness, bradykinesia, bilateral tremor, freezing | Levodopa 800 Apomorphine (6.5 mg/hour) Rotigotine 8 | 38 | 13 | L1L2 | −4.52 (*) | 17.99 (*) | L1,L2 border MED | L1 | Case: + L1: - | R1R2 | 1.15 | 33.2 (*) | R0:inside/border/MED; R1: border/MED | R0 | Case: + R1: - | UPDRS OFF Med, Stim ON/OFF: 13/38 |
2 Ox | 69 | M | 11 | Rigidity, bradykinesia, freezing | Ropinirole 8 Pramipexole 0.75 Levodopa 900 | 38 | 18 | -- | -- | Electrode was not in target and therefore not recorded | R0R1 | −4.79 | 0.92 | R0,R1 inside only | R1 | None | Stimulation was discontinued shortly after surgery due to unsatisfactory clinical effect | |||
3 King | 65 | F | 17 | Rigidity, tremor | Amantadine 400 Levodopa 600 | 55 | 49 | L0L1 | −5.12 (*) | 7.44 (*) | All inside | L1 | Case: + L0: - | R0R1 | −29.03 (*) | 3.29 (*) | All inside | R1 | Case: + R1: - | Not evaluated |
4 QS | 56 | M | 10 | Bradykinesia, rigidity, tremor limping gait | Levodopa 1000 Rasagiline 1 Citalopram 20 | 40 | 12 | L1L2 | −2.48 (*) | 37.73 (*) | L1,L2,L3 inside; L2 dorsolat | L2 | Case: + L1: - | R0R1 | −18.92 (*) | 2.98 (*) | R0 inside; R1 border/dorsolat | R1 | Case: + R0, R1 (alternating): - | UPDRS OFF Med, Stim ON/OFF: 29/40 |
5 QS | 60 | F | 11 | Tremor@Left; poor coordination, bended gait | Levodopa 600 Pramipexole 0.75 | 53 | 16 | L1L2 | −4.94 (*) | 6.68 (*) | All inside; L1 dorsolat | L1 | Case: + L1: - | R2R3 | −0.049 | 2.14 | R1 inside; R2 border | R2 | Case: + R1: - | Not evaluated |
6 Kings | 65 | M | 5 | Rigidity, bradykinesia, motor fluctuation, tremor | Levodopa 400 Entacapone 800 Rotigotine 8 | 41 | 29 | L1L2 | 3.33 | 1.81 | All inside | None | Case + L2: - | R1R2 | −7.37 (*) | 0.66 | All inside | R2 | Case + R1: - | Not evaluated |
7 QS | 56 | M | 10 | tremor@all four limbs | Levodopa 600 Rotigotine 8 Selegiline 10 | 52 | 19 | L0L1 | −10.68 (*) | 8.42 (*) | L2, L3 in superior STN | L0 | Case: + L1: - | R0R1 | −22.76 (*) | 14.02 (*) | R0, R1 in STN, R2 lateral border of superior STN | R1 | Case + R1: - | Relocation after recording due to side effects on speech |
8 Kings | 73 | M | 14 | Bradykinesia, tremor | Rotigotine 16 Selegeline 10 Levodopa 700 | 35 | 15 | L0L1 | 0.157 | −0.186 | All inside | None | Case: + L1: - | R1R2 | −4.93 (*) | 5.57 (*) | All inside | R1 | Case: + R1: - | Not evaluated |
9 Ox | 63 | F | 14 | Rigidity, bradykinesia | Ropinirole 23 Levodopa 150 | 35 | 24 | 3.197 | −1.14 | None inside | None | None | −2.59 | 7.20 | None inside | None | None | Post-op imaging show mis-location, and electrodes were relocated to GPi | ||
10 QS | 66 | F | 16 | Shuffle, poor balance, NO tremor | Levodopa 600 Amantadine 200 Ropinirole 24 Rasagiline 1 | 32 | 13 | L0L2(L1 no signal) | 4.33 | 2.95 | L0,L1 inside | L0 | Case: + L1: - | R0R1 (bipolar reduced modulation) | −1.37 | 7.41 (*) | R1,R2 inside | R1 | Case: + R1: - | UPDRS OFF Med, Stim ON/OFF: 26/32 |
11 QS | 52 | M | 7 | Freezing, falls, postural instability, tremor@right side | Levodopa 1300 Citalopram 20 Trihexyphenidyl 6 | 58 | 13 | L1L2 (bipolar reduced modulation) | 38.77 | 13.22 | L2 | Case: + L1: - | R1R2 (bipolar reduced modulation) | −1.05 | 1.11 | R1 | Case: + R1: - | Relocation after recording | ||
Mean | 61.3 | 11.3 | 43.4 | 20.1 | ||||||||||||||||
-
(*) Indicate significant movement-related modulation in the power of the activity of the specific frequency band; Ox, Kings, QS indicate the three neurosurgical centres where the data were recorded: Ox = John Radcliffe Hospital, University of Oxford; Kings = Department of Neurosurgery, Kings College Hospital, Kings College London; QS = Sobell Department of Motor Neuroscience and Movement Disorders, UCL Institute of Neurology.
Table 2
Model details.
Models 1–3 use activity change in the beta band (β) and gamma bands (γ) from the STN LFP as model inputs. Models 4 and 5 take into account extra information about the low frequency activity change (α). Models 6–8 only use the activity change from a single frequency band (α, β and γ, respectively) as model input. Tp and Td are the time constant and time delay of the first order linear dynamic model, respectively.
Model ID | Model equation | No. of free parameters |
|---|---|---|
1 | 3 | |
2 | 4 | |
3 | 6 | |
4 | 5 | |
5 | 9 | |
6 | 3 | |
7 | 3 | |
8 | 3 |
Download links
A two-part list of links to download the article, or parts of the article, in various formats.
Downloads (link to download the article as PDF)
Open citations (links to open the citations from this article in various online reference manager services)
Cite this article (links to download the citations from this article in formats compatible with various reference manager tools)
Decoding gripping force based on local field potentials recorded from subthalamic nucleus in humans
eLife 5:e19089.
https://doi.org/10.7554/eLife.19089


