Long non-coding RNA produced by RNA polymerase V determines boundaries of heterochromatin
- University of Michigan, United States
- University of Warsaw, Poland
Figures
Figure 1 with 1 supplement

Genome-wide identification of RNA produced by Pol V (Pol V transcripts).
(A) A genomic region giving rise to Pol V transcripts. The screenshot shows sequencing reads from both repeats of Pol V RIP-seq as well as Pol V ChIP-seq (Wierzbicki et al., 2012), DNA methylation (Stroud et al., 2013), and annotations of genes and Pol V transcripts. (B) Pol V RIP signal is largely limited to identified Pol V transcripts. All annotated Pol V transcripts were scaled to uniform lengths and average Pol V RIP signal from both biological repeats combined (Col-0/nrpe1, [RPM]) was plotted. The heatmap below shows Pol V RIP signal on individual transcripts sorted by length. The p value was calculated using the permutation test by comparing 100 nt long regions starting 200 nt upstream and 50 nt downstream of 5’ ends of the annotated transcripts. (C) Pol V binding to chromatin is enriched on Pol V transcripts. Profile of average Pol V ChIP-seq signal (Col-0/nrpe1 [RPM]) on scaled Pol V transcripts ± 300 bp. The p value was calculated using the permutation test by comparing 100 nt long regions starting 200 nt upstream and 50 nt downstream of 5’ ends of the annotated transcripts. (D) Pol V RIP-seq signal is enriched on regions where Pol V binds chromatin. Profiles of average Pol V ChIP-seq signal (Col-0/nrpe1) and Pol V RIP signal (Col-0/nrpe1) on Pol V ChIP-seq peaks (Wierzbicki et al., 2012) aligned with their summits ± 600 bp (10 bp resolution). (E–G) Loci generating Pol V transcripts are bound by Pol V and are targets of RdDM. Boxplots show regions producing Pol V transcripts but not overlapping ChIP-seq peaks and vice versa (RIP only and ChIP only, respectively) and on Pol V transcript regions overlapping ChIP peaks (overlap). Significance has been tested using the Wilcoxon test. (E) Pol V ChIP-seq (Col-0/nrpe1 [RPM]), (F) Pol V RIP-seq (Col-0/nrpe1 [RPM]) and (G) CHH DNA methylation (Col-0 - nrpe1).
Figure 1—figure supplement 1
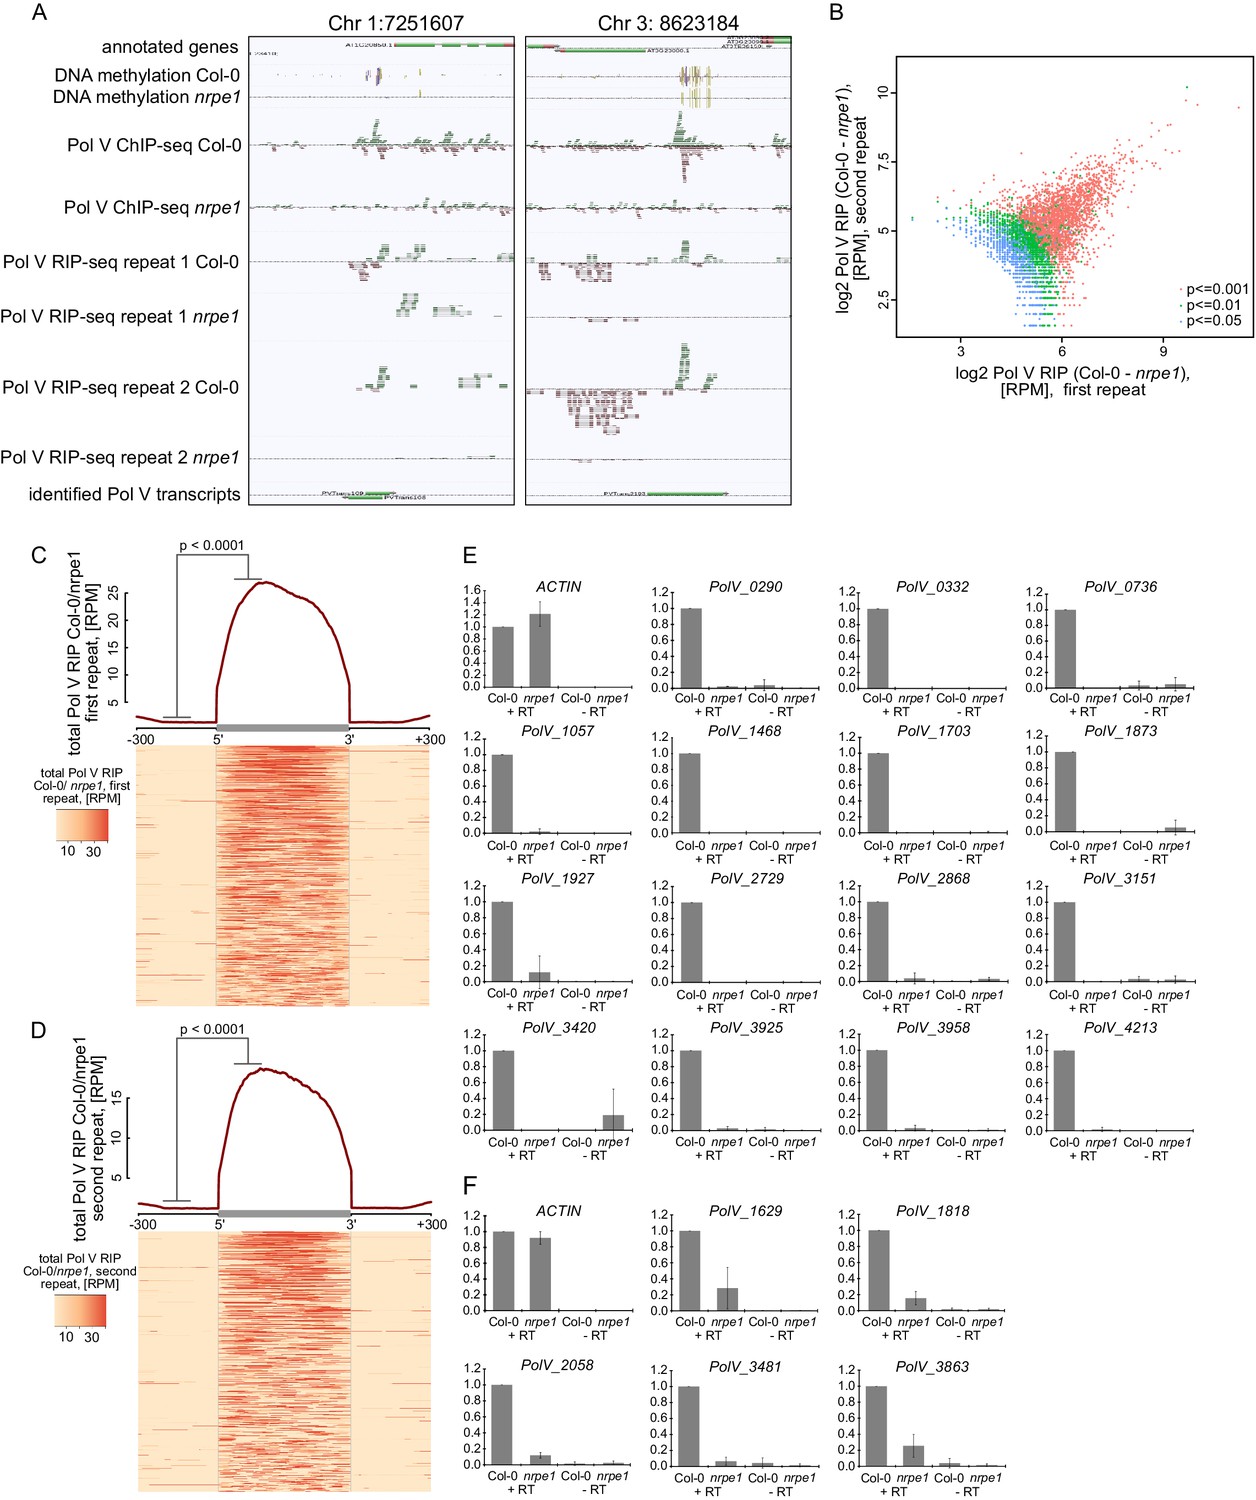
Genome-wide identification of RNA produced by Pol V (Pol V transcripts).
(A) Genomic regions giving rise to Pol V transcripts. The screenshots show sequencing reads from both repeats of Pol V RIP-seq as well as Pol V ChIP-seq (Wierzbicki et al., 2012), DNA methylation (Stroud et al., 2013), annotations of genes (TAIR10), and annotation of Pol V transcripts obtained in this study. (B) Correlation between both biological repeats of RIP-seq. Scatterplot shows total Pol V RIP signal obtained from the first and the second repeat on annotated Pol V transcripts. Colors correspond to p values obtained using the negative binomial test included in the transcript calling protocol. (C) Pol V RIP signal is largely limited to identified Pol V transcripts – first biological repeat only. All annotated Pol V transcripts were scaled to uniform lengths and average Pol V RIP signal from the first biological repeat (Col-0/nrpe1, [RPM]) was plotted. The heatmap below shows Pol V RIP signal on individual transcripts sorted by length. Gray box on the x-axis indicates the position of the Pol V transcripts. In the heatmap every row represents an individual Pol V transcript sorted by size. The p value was calculated using the permutation test by comparing 100 nt long regions starting 200 nt upstream and 50 nt downstream of 5’ ends of the annotated transcripts. (D) Pol V RIP signal is largely limited to identified Pol V transcripts – second biological repeat only. All annotated Pol V transcripts were scaled to uniform lengths and average Pol V RIP signal from the second biological repeat (Col-0/nrpe1, [RPM]) was plotted. The heatmap below shows Pol V RIP signal on individual transcripts sorted by length. Gray box on the x-axis indicates the position of the Pol V transcripts. In the heatmap every row represents an individual Pol V transcript sorted by size. (E,F) Transcripts associated with Pol V are Pol V-dependent. RT-qPCR for specific Pol V transcripts in Col-0 and nrpe1. Average signal levels relative to wild type and standard deviations from three biological replicates are shown.
Figure 2 with 1 supplement
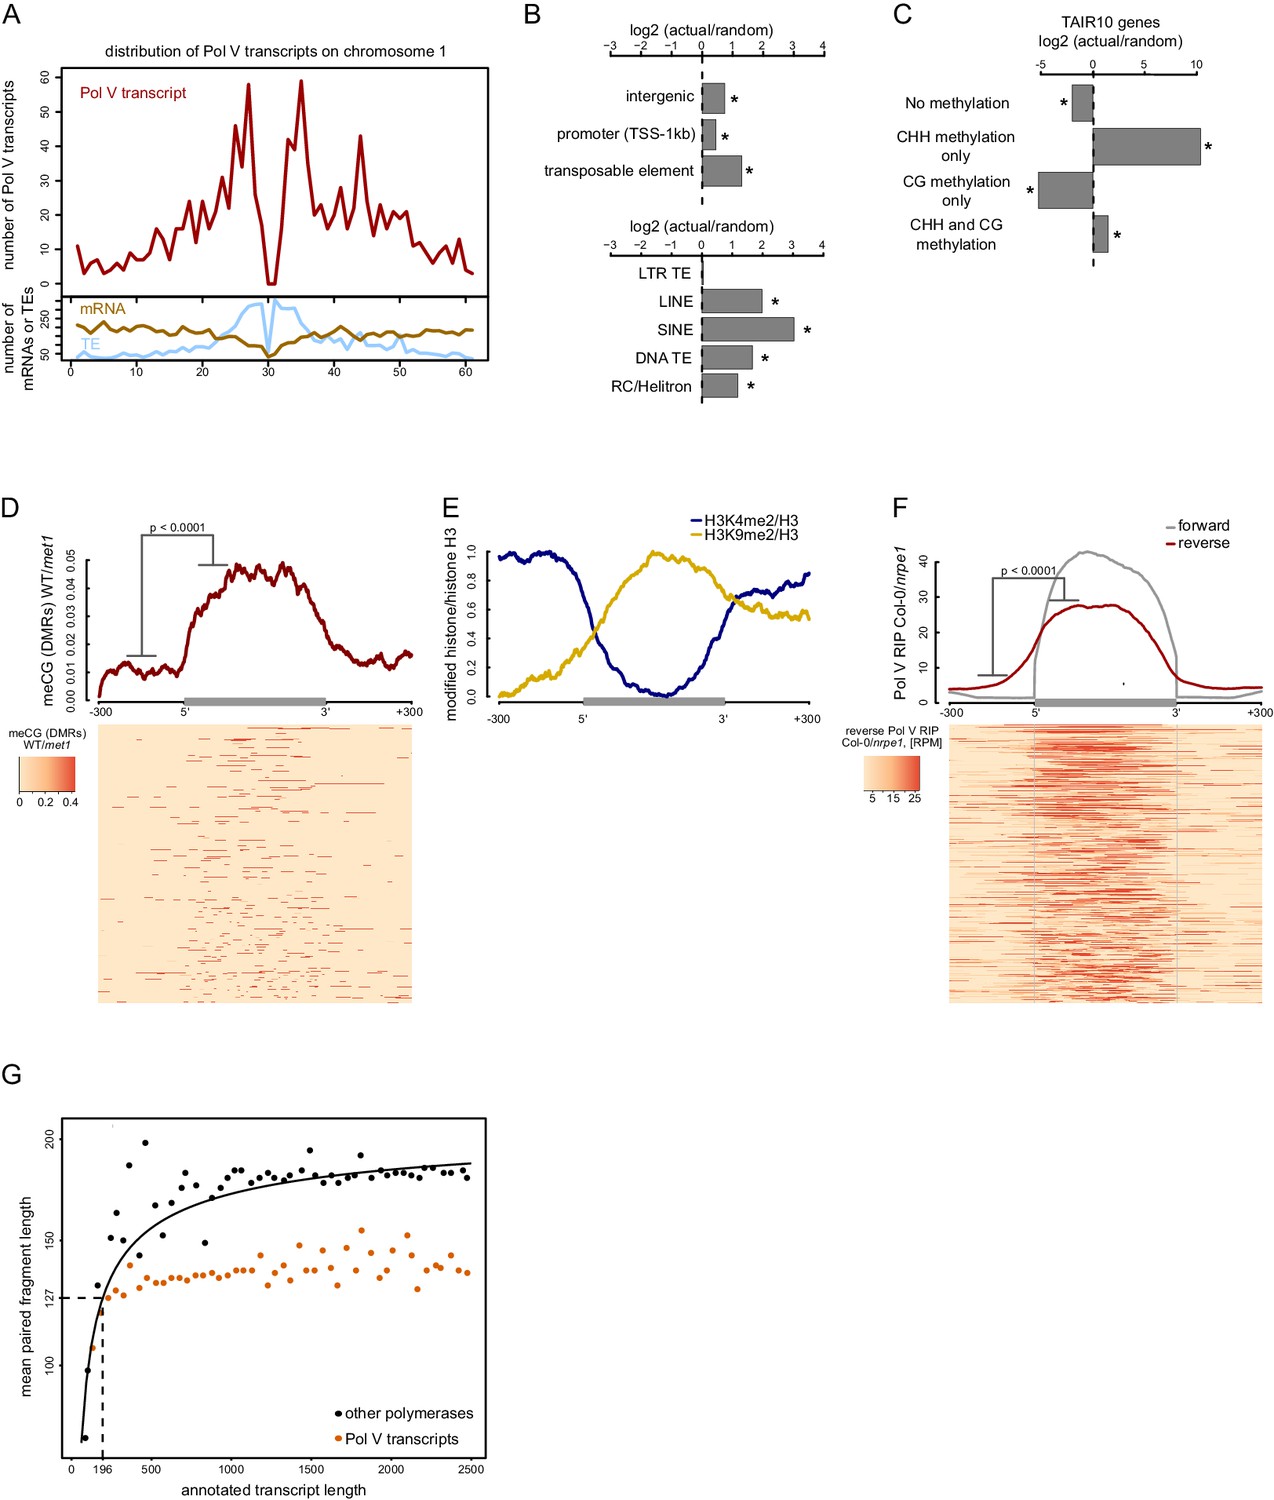
Pol V regulatory elements.
(A) Pol V transcripts are produced from both pericentromeric regions and chromosome arms. The number of mRNAs, transposons (TAIR10) or Pol V transcripts was plotted on chromosome 1 in 500 kb windows. (B) Pol V transcripts are significantly enriched on promoters, intergenic sequences, and transposons of all families except LTR transposons. Plots show ratios of features overlapping Pol V transcripts to those overlapping randomized genomic regions. Promoters are defined as regions 1 kb upstream of the transcription start site of genes. Stars denote significant differences based on permutations (p<0.001). (C) CG methylation is not sufficient to mediate Pol V transcription. Genes annotated in TAIR10 were split into four categories based on the presence of CHH methylation (greater than 2%) and CG methylation (greater than 10%). Enrichment of annotated Pol V transcripts on those categories of genes was calculated by comparing the actual overlap with overlaps of random genomic loci. Stars denote p<0.004. (D) MET1-dependent CG methylation is enriched within Pol V-transcribed regions. Average CG methylation levels (Stroud et al., 2013) within differentially methylated regions (DMRs) were plotted on scaled Pol V transcripts. The p value was calculated using the permutation test by comparing 100 nt long regions starting 200 nt upstream and 50 nt downstream of 5’ ends of the annotated transcripts. (E) A repressive histone modification is enriched on Pol V transcribed regions. Profiles of average enrichment of the modified histone (H3K9me2 and H3K4me2) over histone H3 were plotted on scaled Pol V transcripts ± 300 bp. Enrichment of H3K9me2 and depletion of H3K4me2 were statistically significant (p<0.0066 and p<0.0001, respectively; permutation test). (F) Pol V transcribes bidirectionally. Profiles of averaged Pol V RIP-seq signal (Col-0/nrpe1) in forward (grey, Figure 1B) or reverse orientation (red) on scaled Pol V transcripts ± 300 bp. Forward strand refers to annotated transcripts, reverse strand refers to the strand opposite to the annotated transcripts. The p value was calculated using the permutation test by comparing 100 nt long regions starting 200 nt upstream and 50 nt downstream of 5’ ends of the annotated transcripts. The shift between forward and reverse strands is further analyzed in Figure 2—figure supplement 1. (G) Annotated Pol V transcripts are composed of multiple shorter RNAs. Lengths of paired-end RNA fragments sequenced in RIP-seq mapping to nuclear and organellar genes (TAIR10) or to Pol V transcripts were compared to sizes of full length RNAs derived from annotations (TAIR10). Length of Pol V-bound RNAs (vertical dashed line) was estimated based on the median length of paired-end sequencing fragments mapping to Pol V transcripts (horizontal dashed line) and regression analysis of genes found in TAIR10 annotation (black line).
Figure 2—figure supplement 1
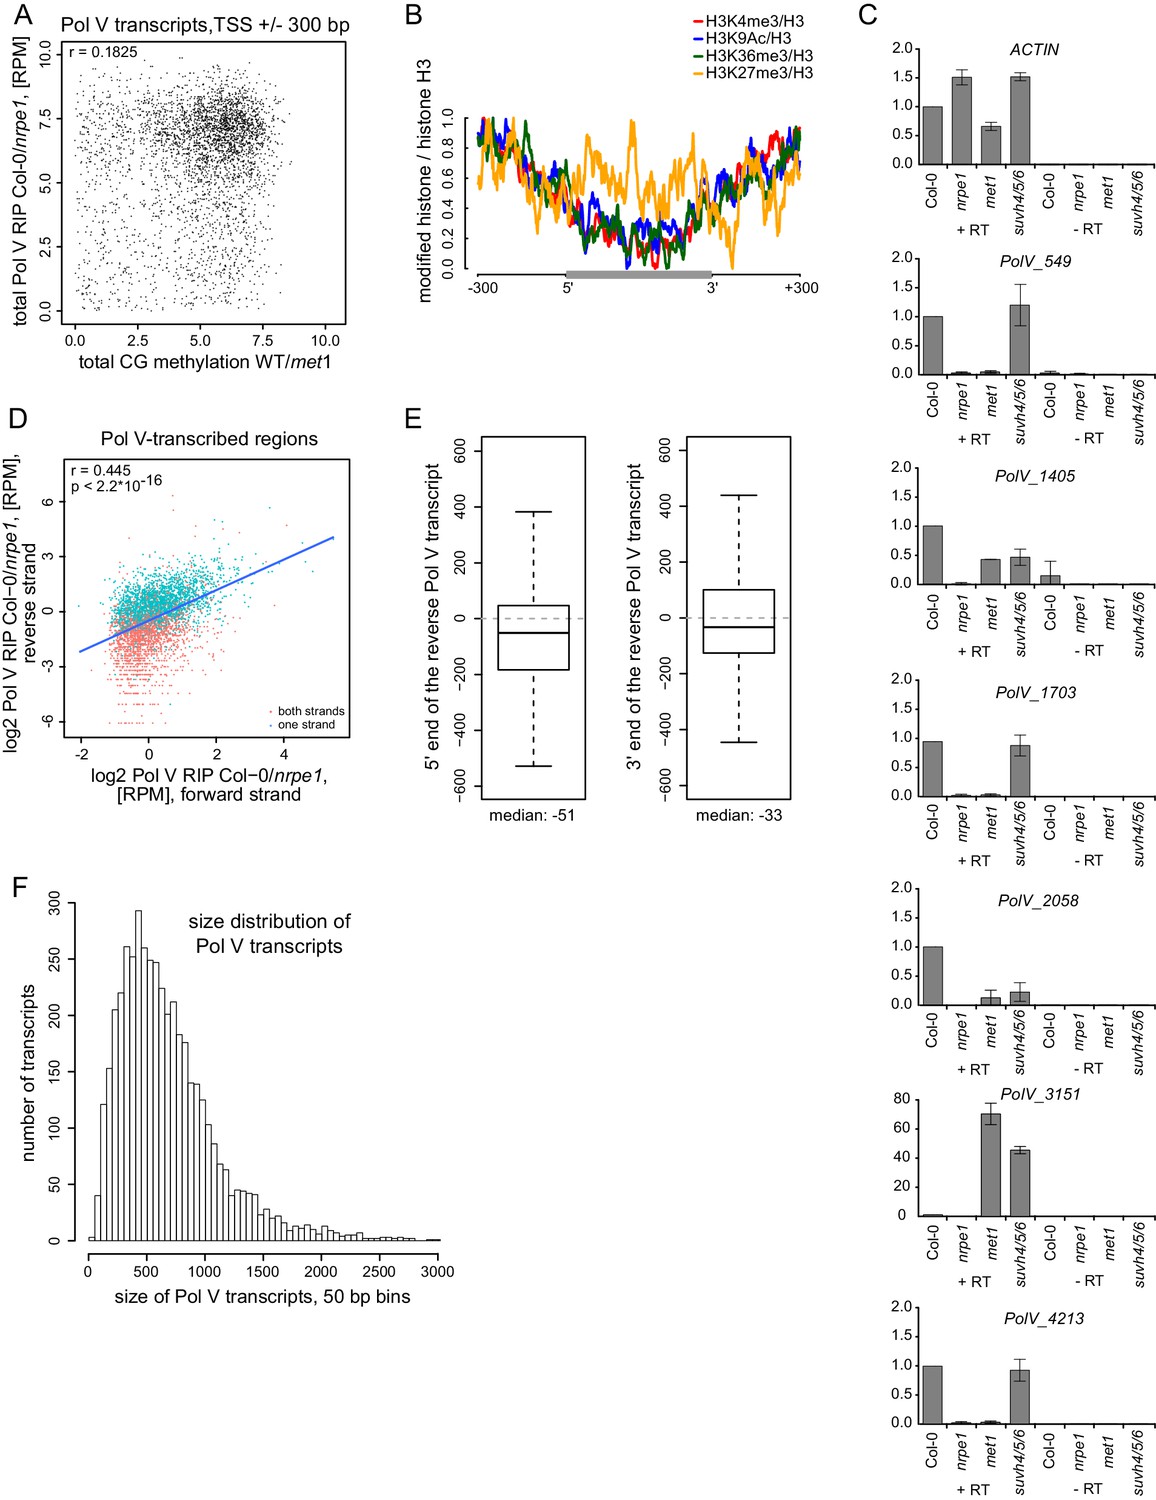
Pol V regulatory elements.
(A) CG DNA methylation levels do not correlate with the levels of Pol V transcripts. Scatterplot shows CG methylation levels (wild-type/met1) (Stroud et al., 2013) and Pol V RIP signal (total Col-0/nrpe1, [RPM]) around the 5’ ends (± 300 bp) of Pol V transcripts. (B) Histone modifications on Pol V transcribed regions. Profiles of average enrichment of modified histones (H3K4me3, H3K9ac, H3K36me3, and H3K27me3 (Moissiard et al., 2012; Luo et al., 2013) over histone H3 (Moissiard et al., 2012) were plotted on scaled Pol V transcripts ± 300 bp. (C) Accumulation of Pol V transcripts is partially affected in met1 and suvh4/5/6 mutants. RT-qPCR for selected Pol V transcripts was performed in Col-0, nrpe1, met1, and suvh4/5/6. Averages signal levels relative to wild type and standard deviations from three biological replicates are shown. (D) Most regions are transcribed by Pol V on both strands. Scatterplot shows Pol V RIP-seq signal (Col-0-nrpe1, [RPM]) from the forward (annotated) and reverse (opposite to annotated) strand on Pol V-transcribed regions. Regions containing annotated transcripts on one or two strands are shown with different colors. Trend line (blue), correlation coefficient and p value have been calculated using linear regression. (E) The start and end sites of forward (annotated) and reverse (opposite to annotated) Pol V transcripts are shifted. Boxplot (left) showing the distance between the 5’-end of the reverse to the 3’-end of the forward Pol V transcript from the same genomic region (median distance −51 bp). Boxplot (right) showing the distance between the 3’-end of the reverse to the 5’-end of the forward Pol V transcript from the same genomic region (median distance −33 bp). (F) Size distribution of Pol V transcripts in 50 bp bins. The median size of Pol V transcripts is 689 bp.
Figure 3 with 1 supplement
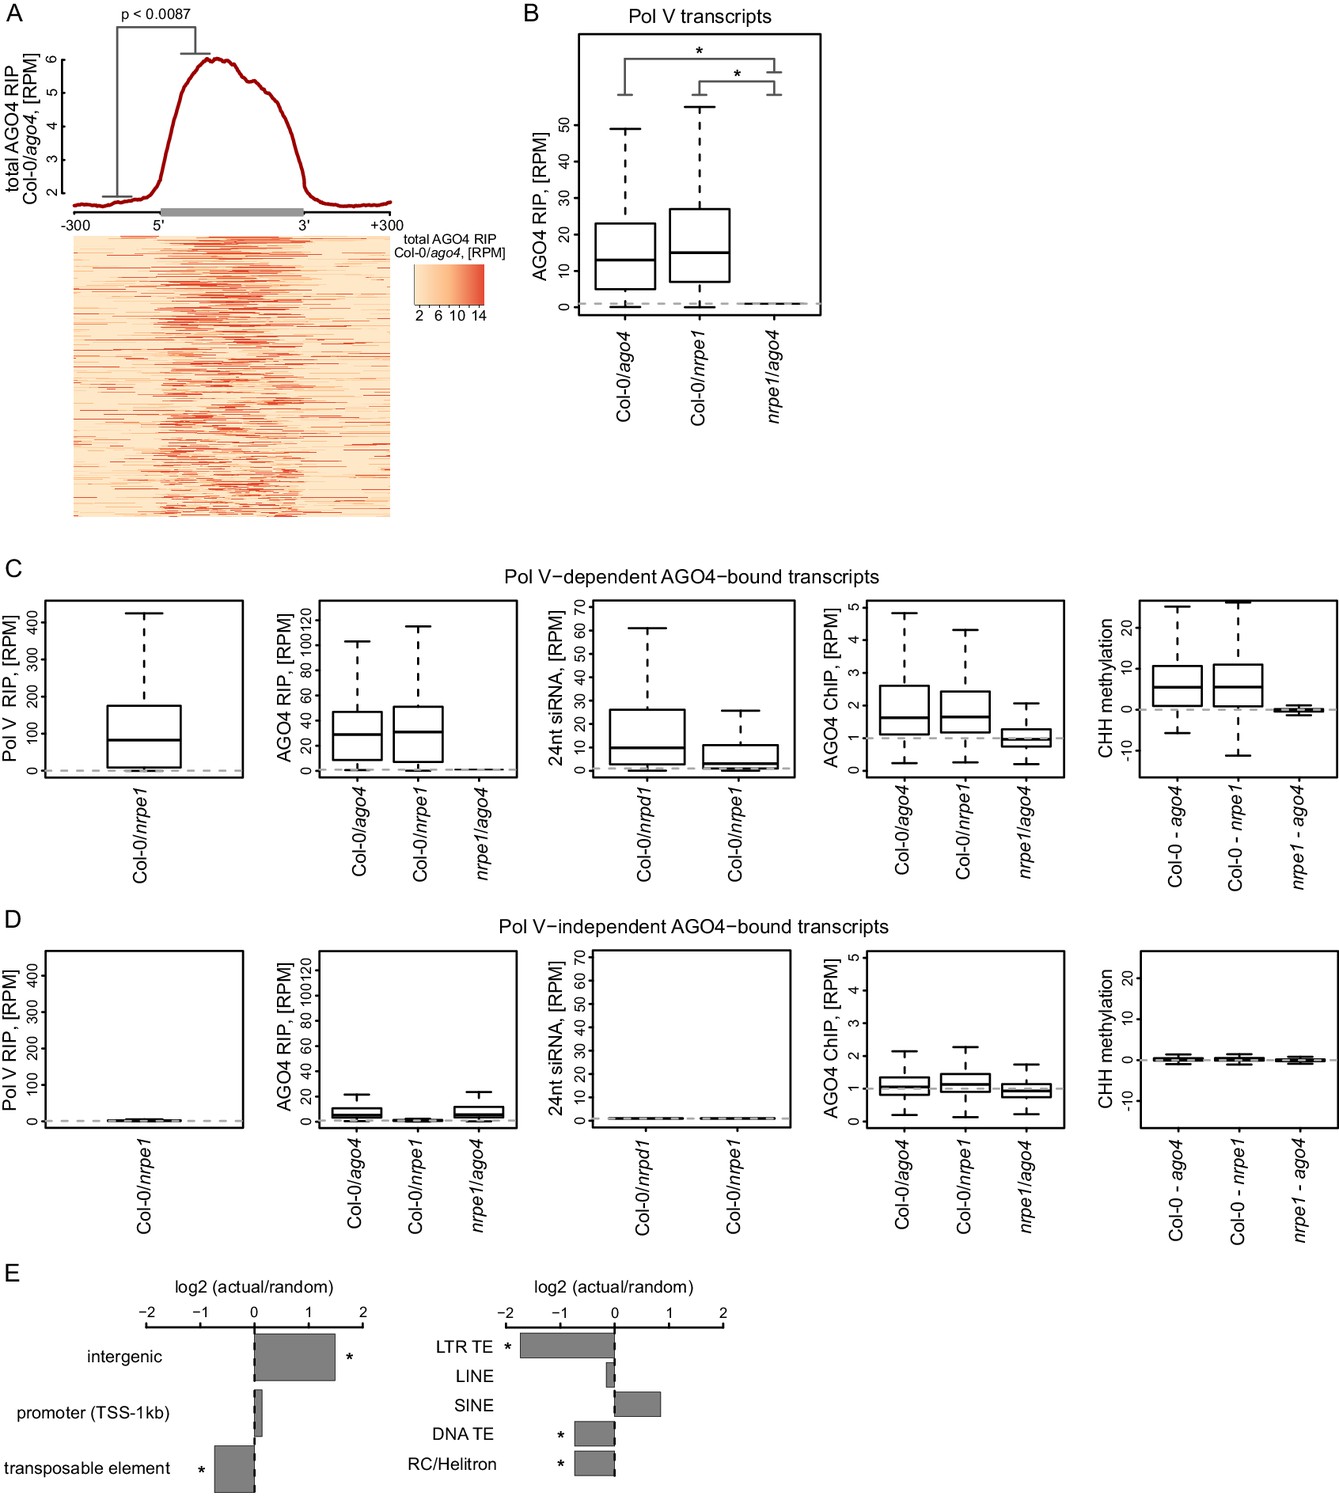
AGO4 binds most Pol V transcripts.
(A) AGO4 RIP-seq signal (Col-0/ago4) is enriched on the majority of Pol V transcripts. Total AGO4 RIP signal was plotted on scaled Pol V transcripts. The p value was calculated using the permutation test by comparing 100 nt long regions starting 200 nt upstream and 50 nt downstream of 5’ ends of the annotated transcripts. (B) Binding of AGO4 to Pol V transcripts depends on Pol V. The box plot shows AGO4 RIP-seq signal on Pol V transcripts. Stars denote p<2.2 * 10–16 (Wilcoxon test). (C) Pol V-dependent association of AGO4 with RNA is correlated with RdDM. Boxplots show signal levels for Pol V RIP-seq, AGO4 RIP-seq, 24nt siRNA, AGO4 ChIP-seq, and CHH methylation. Transcript were called using AGO4 RIP-seq Col-0/ago4 and considered Pol V-dependent if AGO4 RIP-seq Col-0/nrpe1 ≥ 4. (D) Pol V-independent association of AGO4 with RNA is not correlated with RdDM. Box plots show signal levels for Pol V RIP-seq, AGO4 RIP-seq, 24nt siRNA, AGO4 ChIP-seq, and CHH methylation. Transcripts were called using AGO4 RIP-seq Col-0/ago4 and considered Pol V-independent if AGO4 RIP-seq nrpe1/ago4 ≥ 4. (E) Pol V-independent transcripts bound by AGO4 are enriched on intergenic sequences but are depleted on all transposons except SINEs. Plots show ratios of features overlapping transcripts to those overlapping randomized transcripts. Stars denote p<0.001 (permutation test).
Figure 3—figure supplement 1
AGO4 binds most Pol V transcripts.
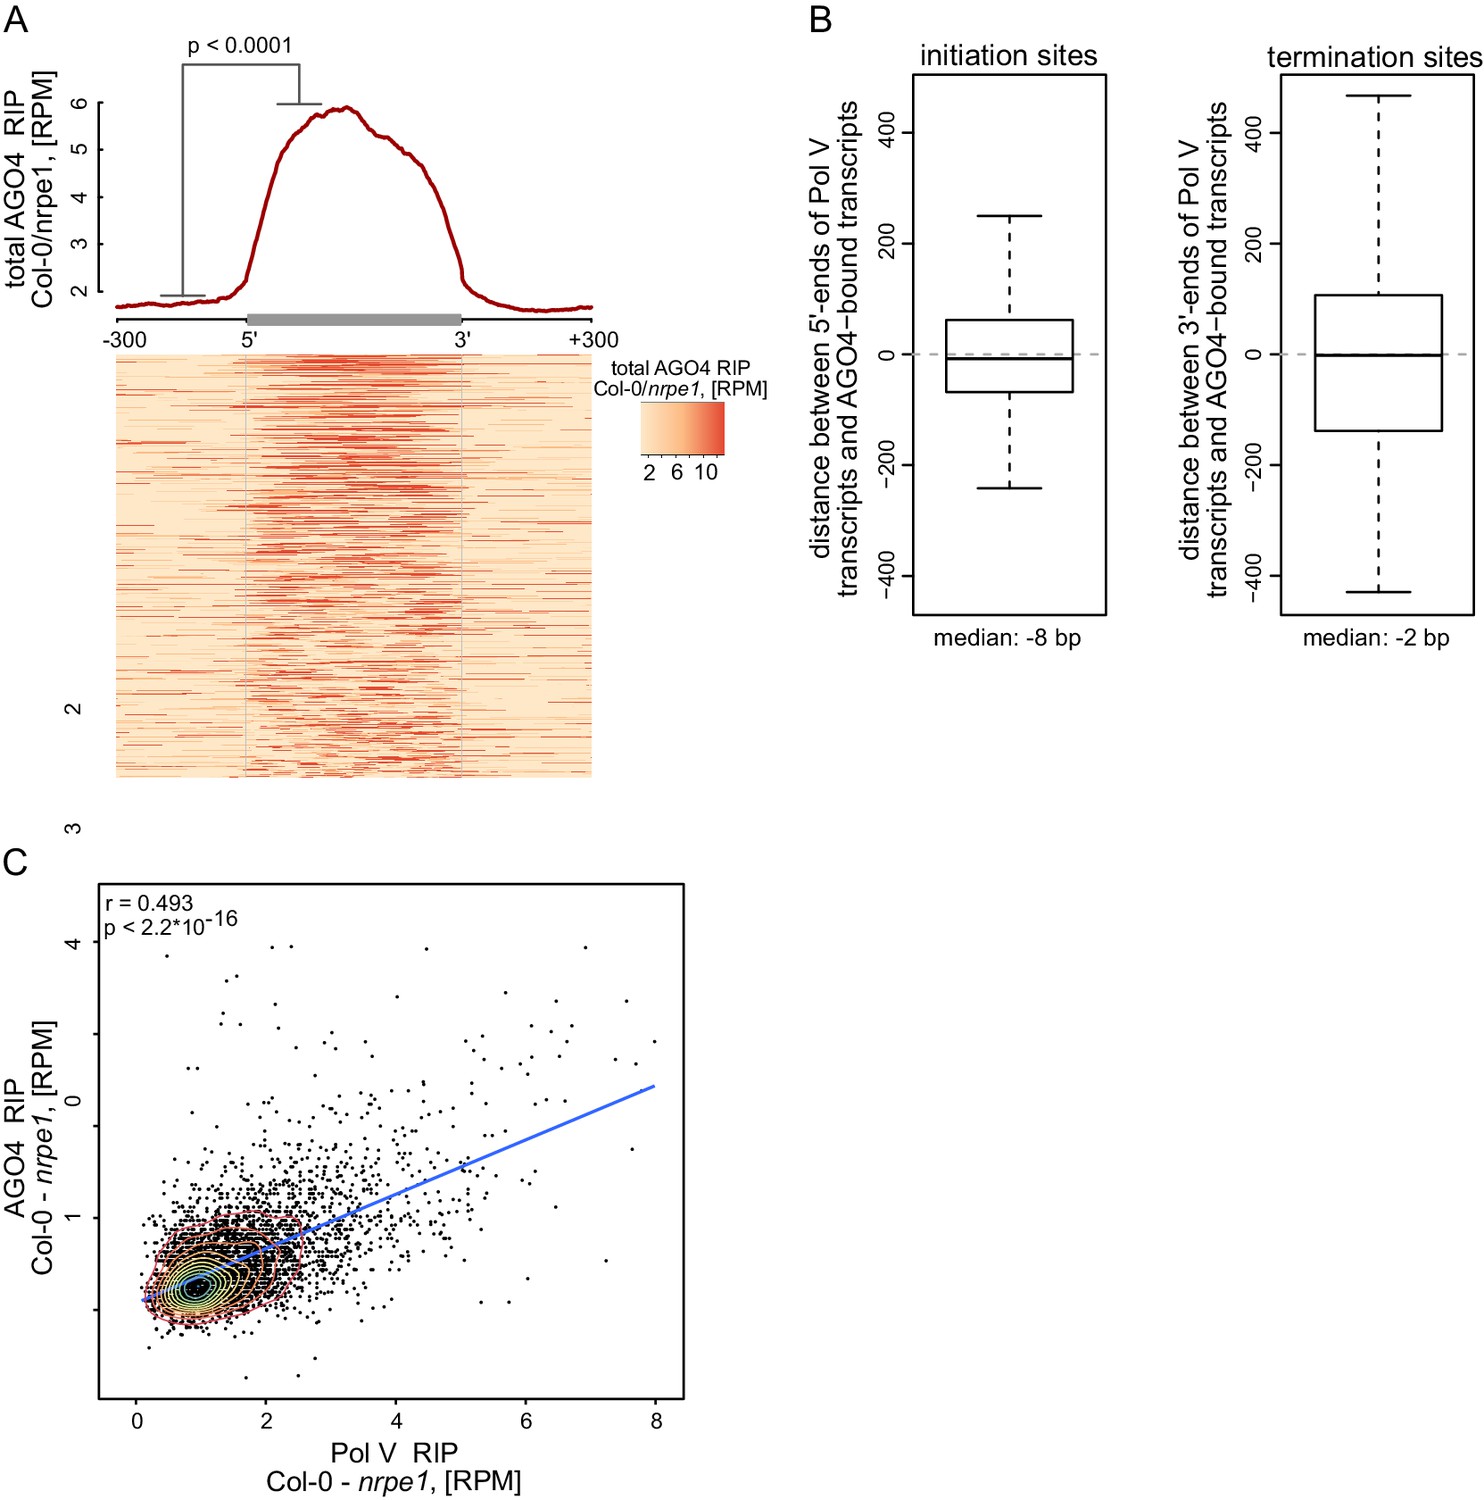
(A) AGO4 binds Pol V transcripts in a Pol V-dependent manner. Profile and heatmap for scaled Pol V transcripts ± 300 bp. The profile represents averaged total AGO4-RIP Col-0/nrpe1 signal [RPM]. In the heatmap every row represents an individual Pol V transcript (sorted by size). The p value was calculated using the permutation test by comparing 100 nt long regions starting 200 nt upstream and 50 nt downstream of 5’ ends of the annotated transcripts. (B) Close overlap between start and end sites of transcripts annotated in AGO4 and Pol V RIP-seq. Left boxplot shows the distance between the initiation sites of overlapping transcripts with the same orientation annotated based on Pol V RIP-seq and AGO4 RIP-seq, respectively (median distance: −8 bp). Right boxplot shows the distance between the 3’-ends of overlapping transcripts with the same orientation called in Pol V RIP-seq and AGO4 RIP-seq, respectively (median distance: −2 bp). (C) Intensity of AGO4 RIP-seq signal is correlated with the intensity of Pol V RIP-seq signal. Scatterplot shows AGO4 RIP-seq signal and Pol V RIP-seq signal (repeat 1) on annotated Pol V transcripts. The plot shows a trend line calculated using linear regression (blue) as well as Spearman correlation coefficient and its p value.
Figure 4 with 1 supplement
AGO4 and IDN2 enhance the accumulation of Pol V transcripts.
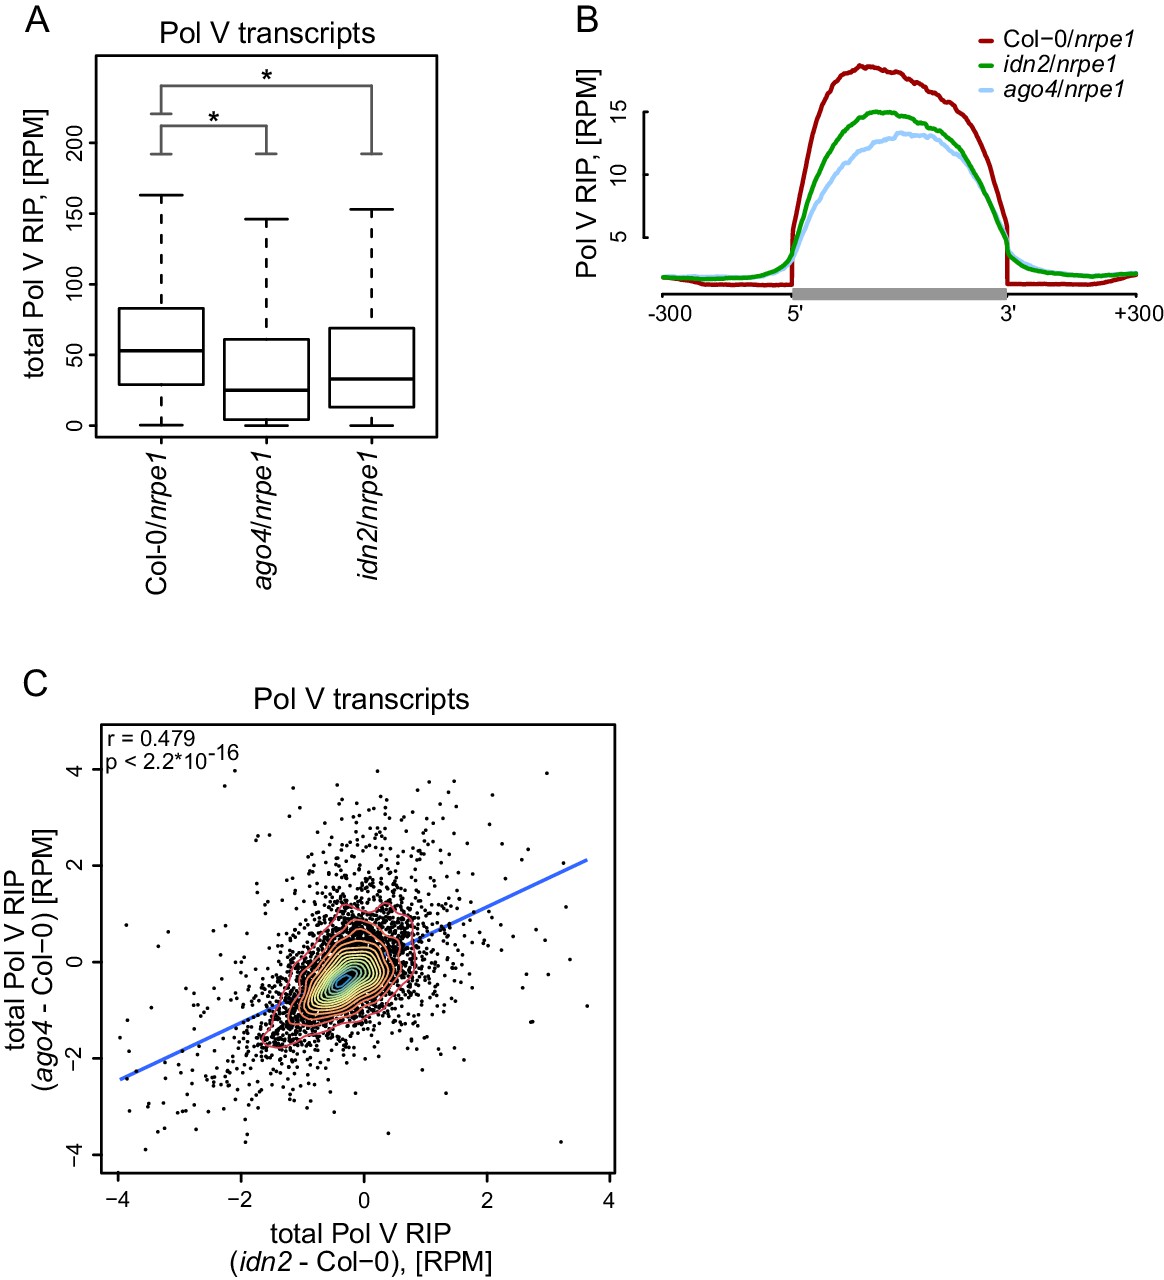
(A) Accumulation of Pol V transcripts is reduced in ago4 and idn2. Box plots show ratios of Pol V RIP-seq signals on Pol V transcripts in various genotypes. Stars denote p<2.2 * 10–16 (Wilcoxon test). (B) Accumulation of Pol V transcripts is reduced in ago4 and idn2 over the entire lengths of Pol V transcripts. Average Pol V RIP-seq enrichment was plotted on scaled Pol V transcripts. Differences between Col-0 and ago4 as well as Col-0 and idn2 are significant when measured between positions 50 nt and 150 nt downstream of 5’ ends of Pol V transcripts (p<0.0001, permutation test). (C) On most Pol V transcripts, Pol V-transcription is affected in a similar way in ago4 and idn2. Scatterplot of total Pol V RIP signal in ago4 - Col-0 vs. idn2 - Col-0. The plot shows a trend line calculated using linear regression (blue) as well as Pearson correlation coefficient and its p value.
Figure 4—figure supplement 1
AGO4 and IDN2 enhance the accumulation of Pol V transcripts.
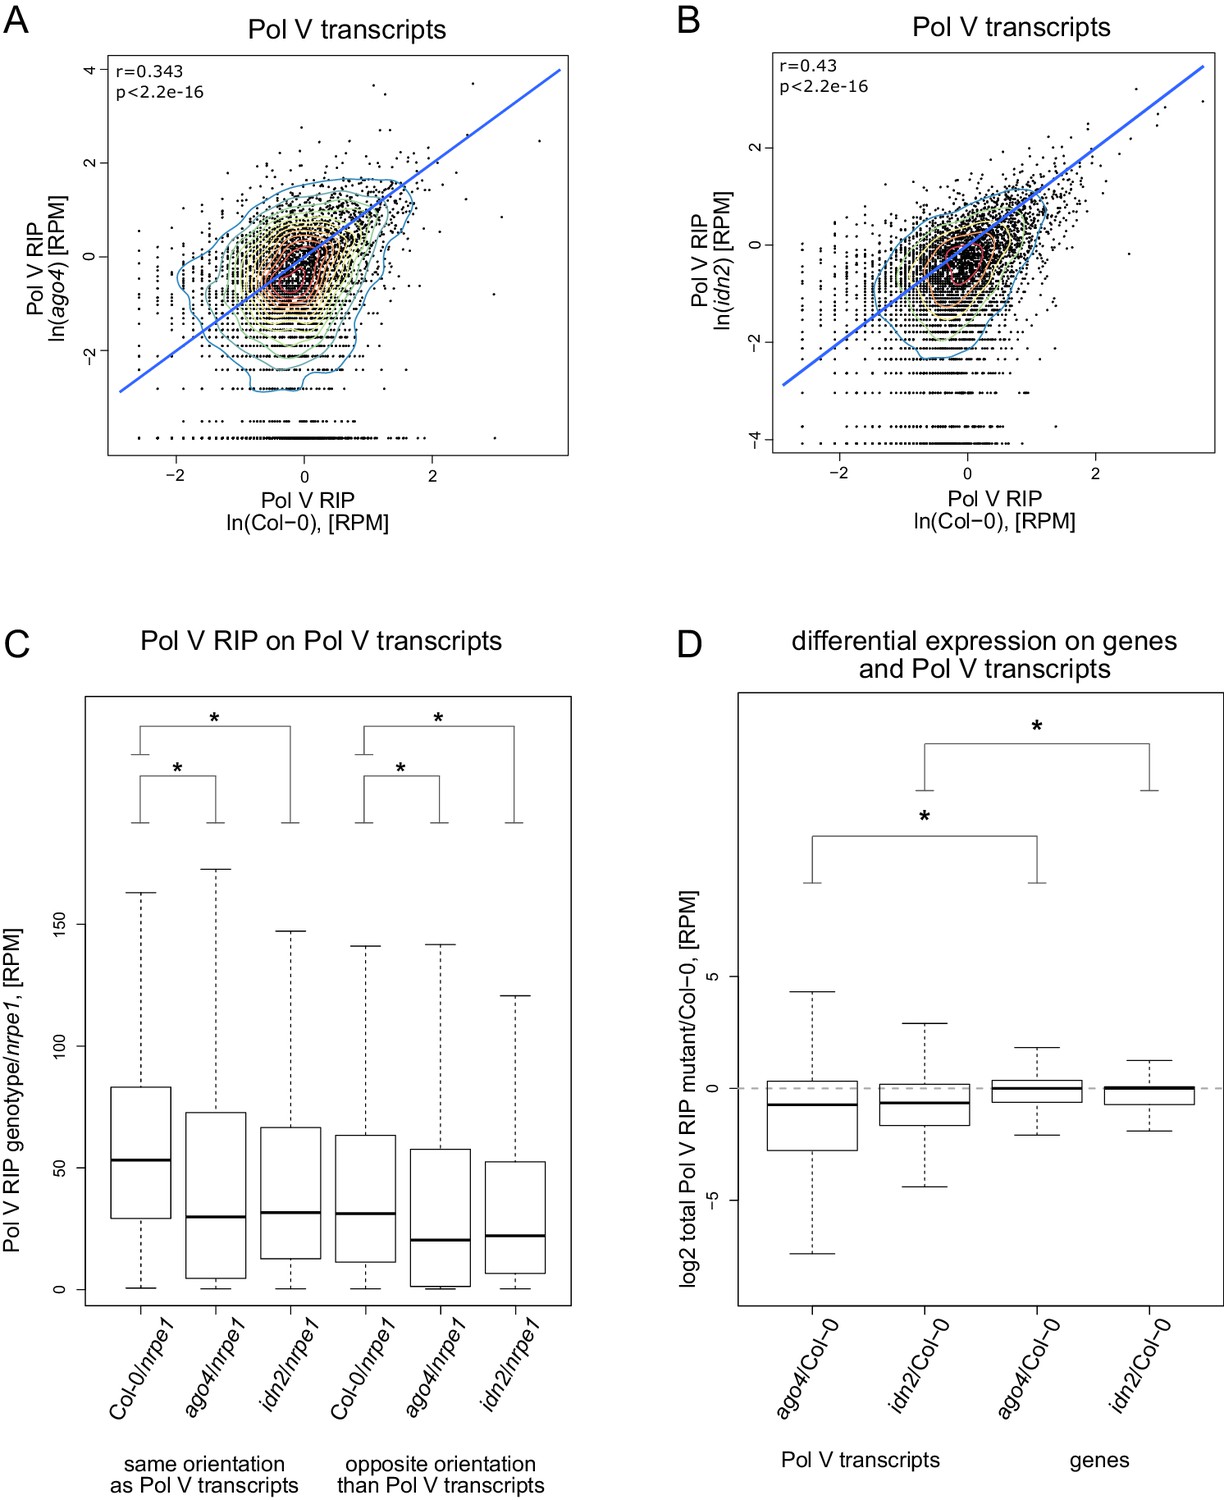
(A) Accumulation of Pol V transcripts is reduced in the ago4 mutant. Scatterplot shows read counts from Pol V RIP-seq in Col-0 wild type and ago4. The plot shows a line where read counts are equal in both genotypes (blue). Pearson correlation coefficient and its p value are calculated using linear regression. (B) Accumulation of Pol V transcripts is reduced in the idn2 mutant. Scatterplot shows read counts from Pol V RIP-seq in Col-0 wild type and idn2. The plot shows a line where read counts are equal in both genotypes (blue). Pearson correlation coefficient and its p value are calculated using linear regression. (C) Forward and reverse transcripts are reduced in ago4 and idn2 on Pol V-transcribed regions, suggesting that AGO4 and IDN2 are important to stabilize transcripts coming from both strands. Box plots show Pol V RIP signal calculated using reads with the same or opposite orientation than Pol V transcripts. Stars denote p<2.2 * 10–16 (Wilcoxon test). (D) Pol V transcript levels are reduced in ago4 and idn2. mRNA levels are on average not reduced in Pol V RIP samples obtained in ago4 and idn2 compared to Col-0, suggesting that the reduction of Pol V transcripts in the mutant backgrounds is not an artefact. Box plots show Pol V RIP signal (mutant/Col-0) on Pol V transcripts and genes. Stars denote p<2.2 * 10–16 (Wilcoxon test).
Figure 5 with 1 supplement
RdDM is restricted to Pol V-transcribed regions.
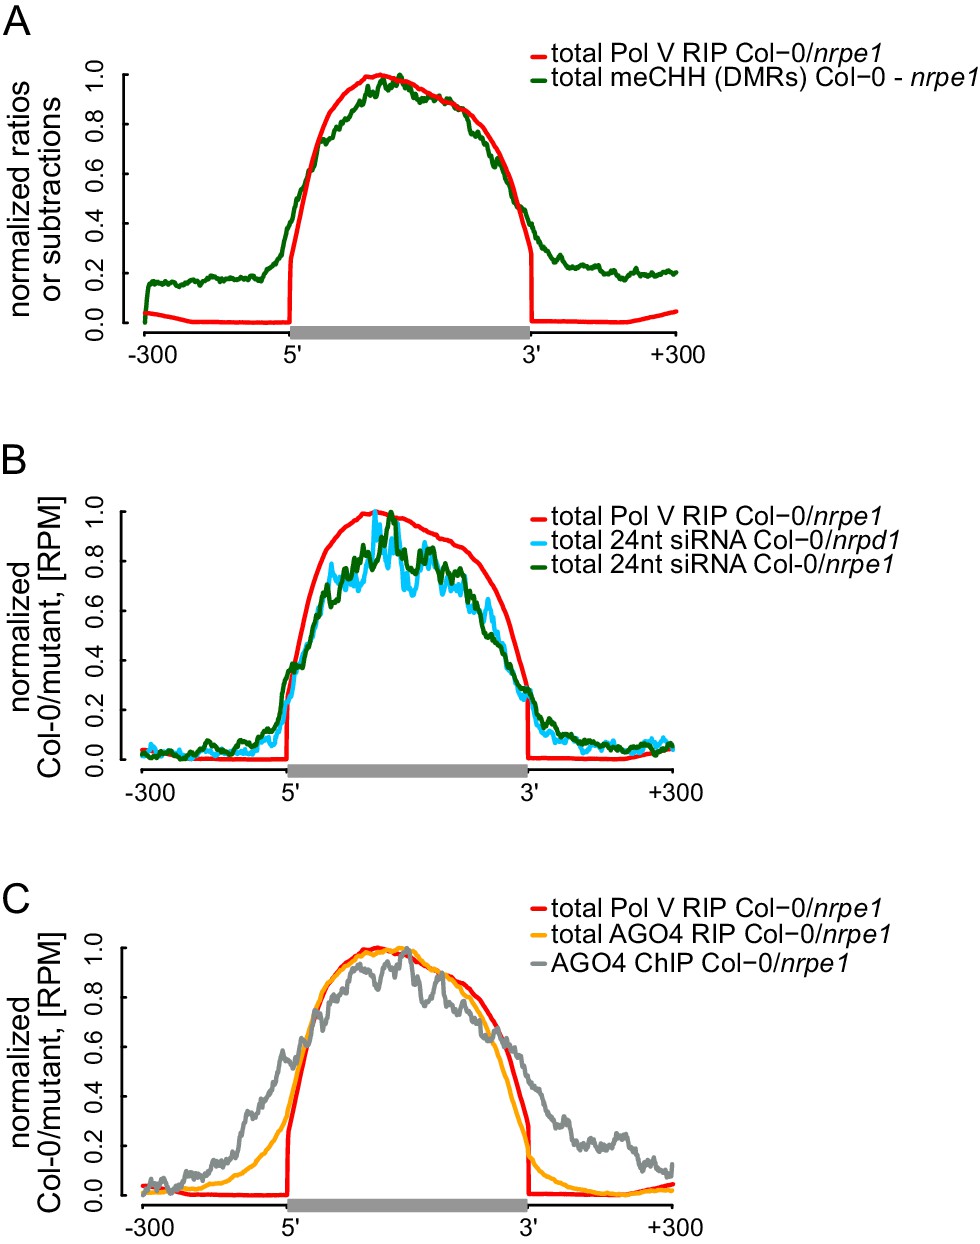
(A) CHH methylation dependent on Pol V closely overlaps Pol V transcription. Average CHH methylation levels within differentially methylated regions (DMRs) were plotted on scaled Pol V transcripts ± 300 bp. Average Pol V RIP-seq signal (Figure 1B) was plotted as a reference. (B) siRNAs closely overlap Pol V transcription. Average enrichment of 24nt siRNA (Col-0/nrpd1 and Col-0/nrpe1) was plotted on scaled Pol V transcripts. Average Pol V RIP-seq signal (Figure 1B) was plotted as a reference. (C) AGO4 binds to Pol V transcripts and corresponding DNA over the entire regions transcribed by Pol V. Average signals of AGO4 RIP-seq and AGO4 ChIP-seq Col-0/nrpe1 were plotted on scaled Pol V transcripts. Average Pol V RIP-seq signal (Figure 1B) is shown as a reference.
Figure 5—figure supplement 1
RdDM is restricted to Pol V-transcribed regions.
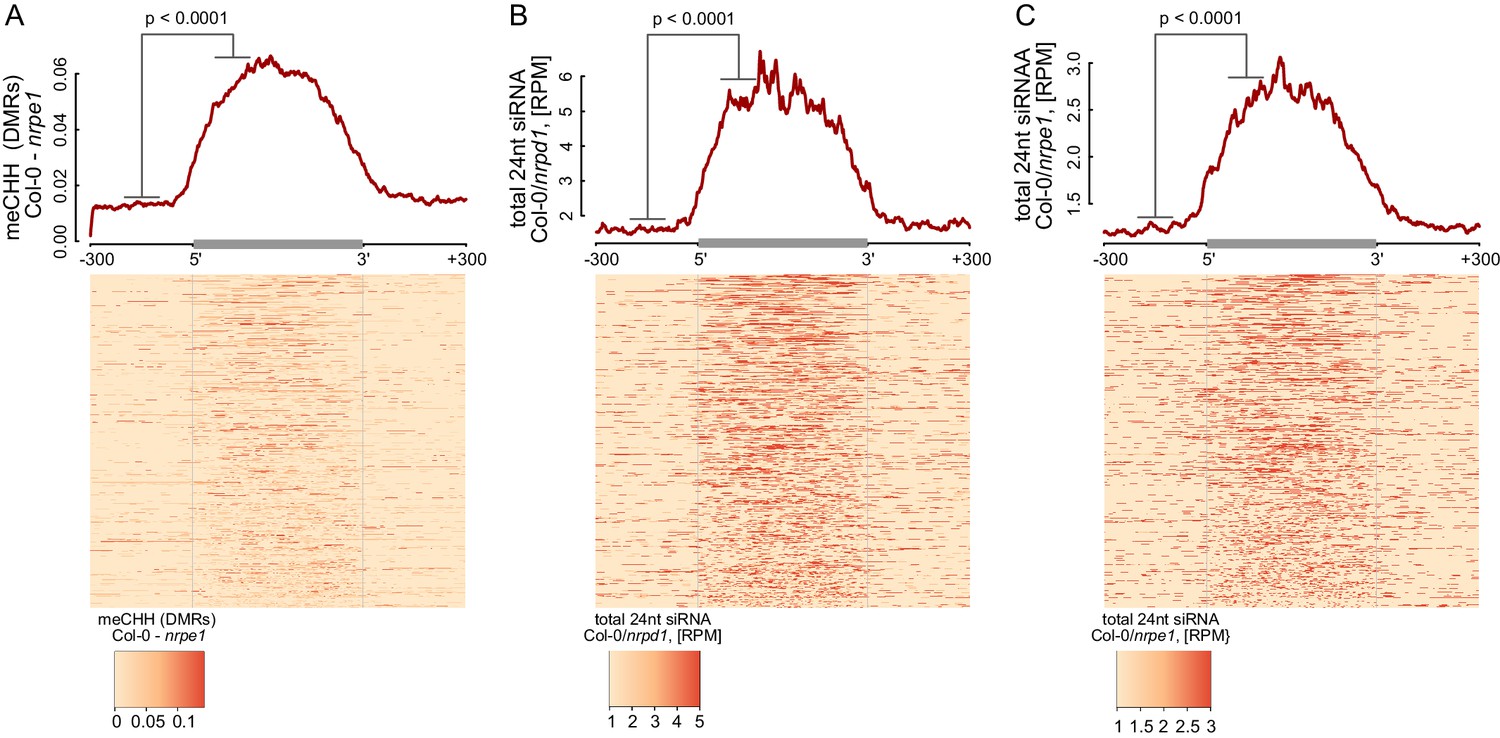
(A–C) Pol IV- and Pol V-dependent 24 nt siRNAs as well as CHH methylation span the entire lengths of Pol V transcripts. Average signals of Pol V-dependent CHH methylation (nrpe1 DMRs) (A) as well as Pol IV-dependent (B) and Pol V-dependent (C) 24 nt siRNA were plotted on scaled Pol V transcripts. Heatmaps show individual transcripts sorted by length. The p values were calculated using the permutation test by comparing 100 nt long regions starting 200 nt upstream and 50 nt downstream of 5’ ends of the annotated transcripts.
Figure 6 with 1 supplement
Strand bias of RdDM and importance of AGO4 binding to Pol V transcripts.
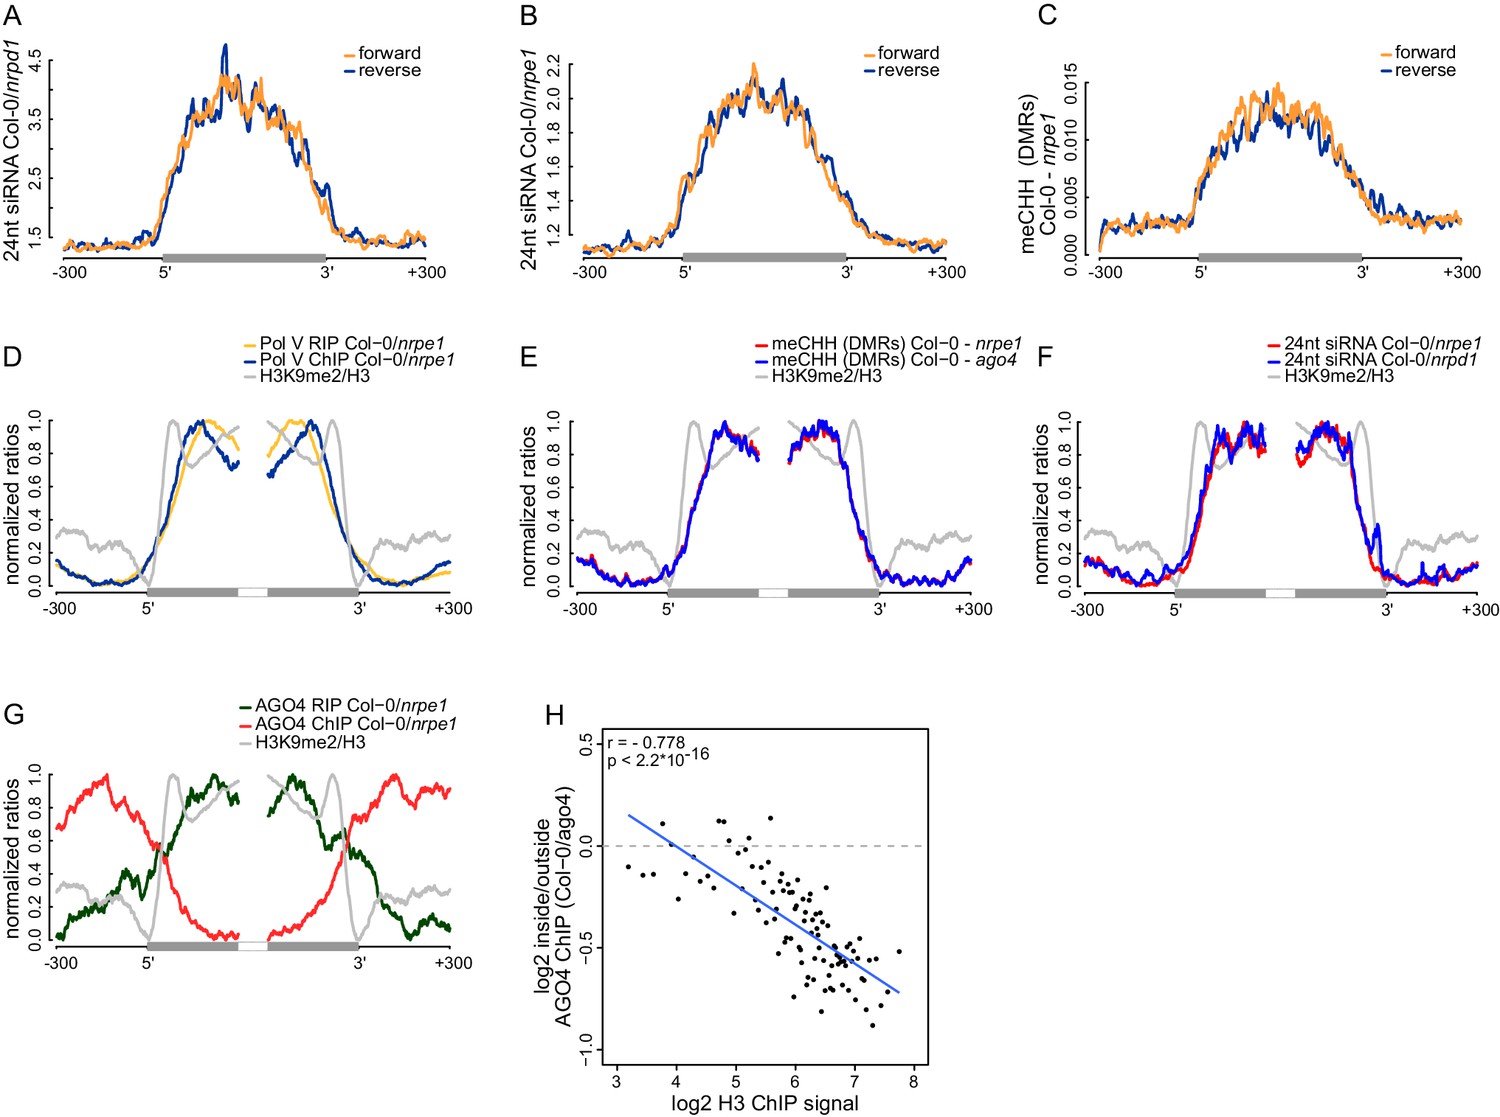
(A) Pol IV-dependent 24nt siRNAs do not show a strand bias on Pol V transcripts. Average signal (Col-0/nrpd1, [RPM]) for reads with the same or the opposite orientation as Pol V transcripts was plotted on scaled Pol V transcripts ± 300 bp. (B) Pol V-dependent 24nt siRNAs do not show a strand bias on Pol V transcripts. Average signal (Col-0/nrpe1, [RPM]) for reads with the same or the opposite orientation as Pol V transcripts was plotted on scaled Pol V transcripts. (C) CHH methylation does not show a strand preference on Pol V transcripts. Average signal of called differentially methylated regions (DMRs) for CHH methylation (Col-0 - nrpe1) from the same or opposite strand as the Pol V transcript was plotted on scaled Pol V transcripts. (D–G) CHH methylation follows AGO4 interactions with Pol V transcripts on the edges of heterochromatic domains. (D) Pol V binds and transcribes DNA at the edges of heterochromatic domains. (E) CHH methylation is deposited on regions transcribed by Pol V. (F) 24nt siRNAs overlap Pol V transcripts. (G) AGO4 associates with RNA on regions transcribed by Pol V but association of AGO4 with DNA detectable by ChIP-seq is present outside of the heterochromatic domains. Profiles represent normalized average signals on heterochromatic domains (with H3K9me2) ± 300 bp, aligned at the ends. In each panel, gray bars on the x-axis (H3K9me2 region) and gray profiles (H3K9me2/H3) are shown. (H) High nucleosome density prevents AGO4 from binding to DNA within heterochromatic domains. Scatterplot compares H3 ChIP-seq signal to AGO4 ChIP-seq signal outside or inside of heterochromatic domains. Heterochromatic domains were combined in 100 groups based on their H3 levels and plotted against the log2 value of AGO4 ChIP-seq inside/outside the H3K9me2 region. 'Outside' was defined as the 50 to 250 bp upstream of the left end of the heterochromatic domain, while 'inside' corresponds to 50 to 250 bp inside the heterochromatic domain. The plot shows a trend line calculated using linear regression (blue) as well as Pearson correlation coefficient and its p value.
Figure 6—figure supplement 1
Strand bias of RdDM and importance of AGO4 binding to Pol V transcripts.
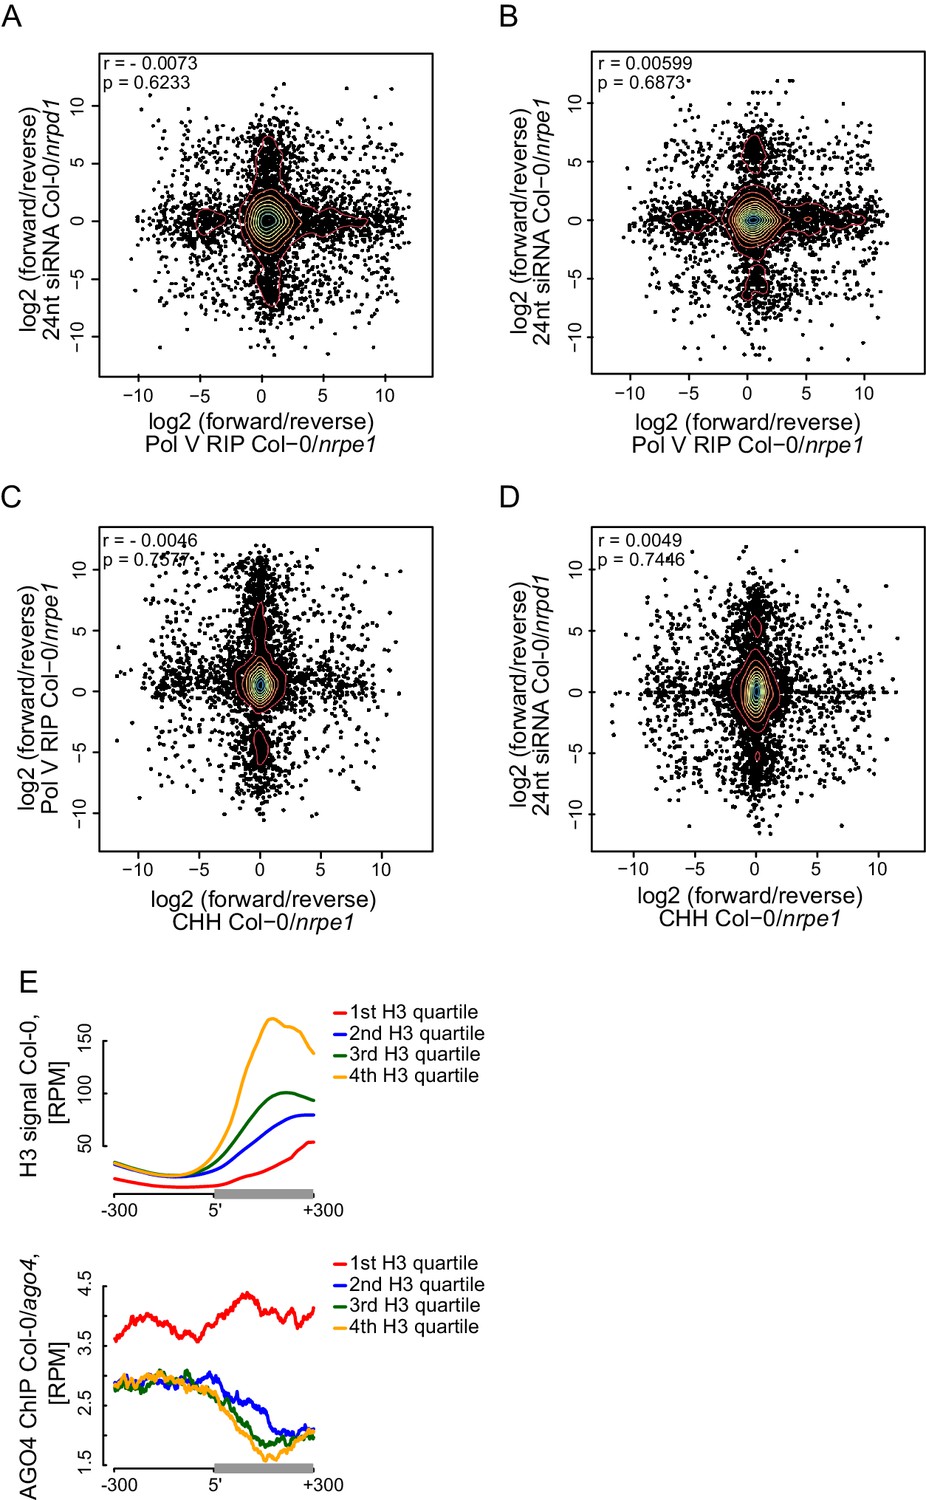
(A–D) Strand preference of Pol V RIP on Pol V-transcribed regions is not correlated with strand-preference of 24nt siRNA or CHH methylation. Scatterplots show ratios (forward/reverse) of sequencing reads (Pol V RIP-seq and 24nt siRNA [Lee et al., 2012]) or CHH methylation (Stroud et al., 2013) observed on Pol V transcripts. (A) Comparison of Pol V-transcription and Pol IV-dependent siRNAs. (B) Comparison of Pol V-transcription and Pol V-dependent siRNAs. (C) Comparison of Pol V-transcription and Pol V-dependent CHH methylation. (D) Comparison of Pol V-dependent CHH methylation and Pol IV-dependent siRNAs. (E) High nucleosome density prevents AGO4 from binding to DNA within heterochromatic domains. Heterochromatic domains were split into quartiles according to the strength of their internal H3 signal (Moissiard et al., 2012) (first 200 bp from the end). Profiles show the average H3 or AGO4 ChIP-seq (Col-0/ago4) (Zheng et al., 2013) signal for ends of heterochromatic domains.
Figure 7 with 1 supplement
Pol V determines the edges of transposons.
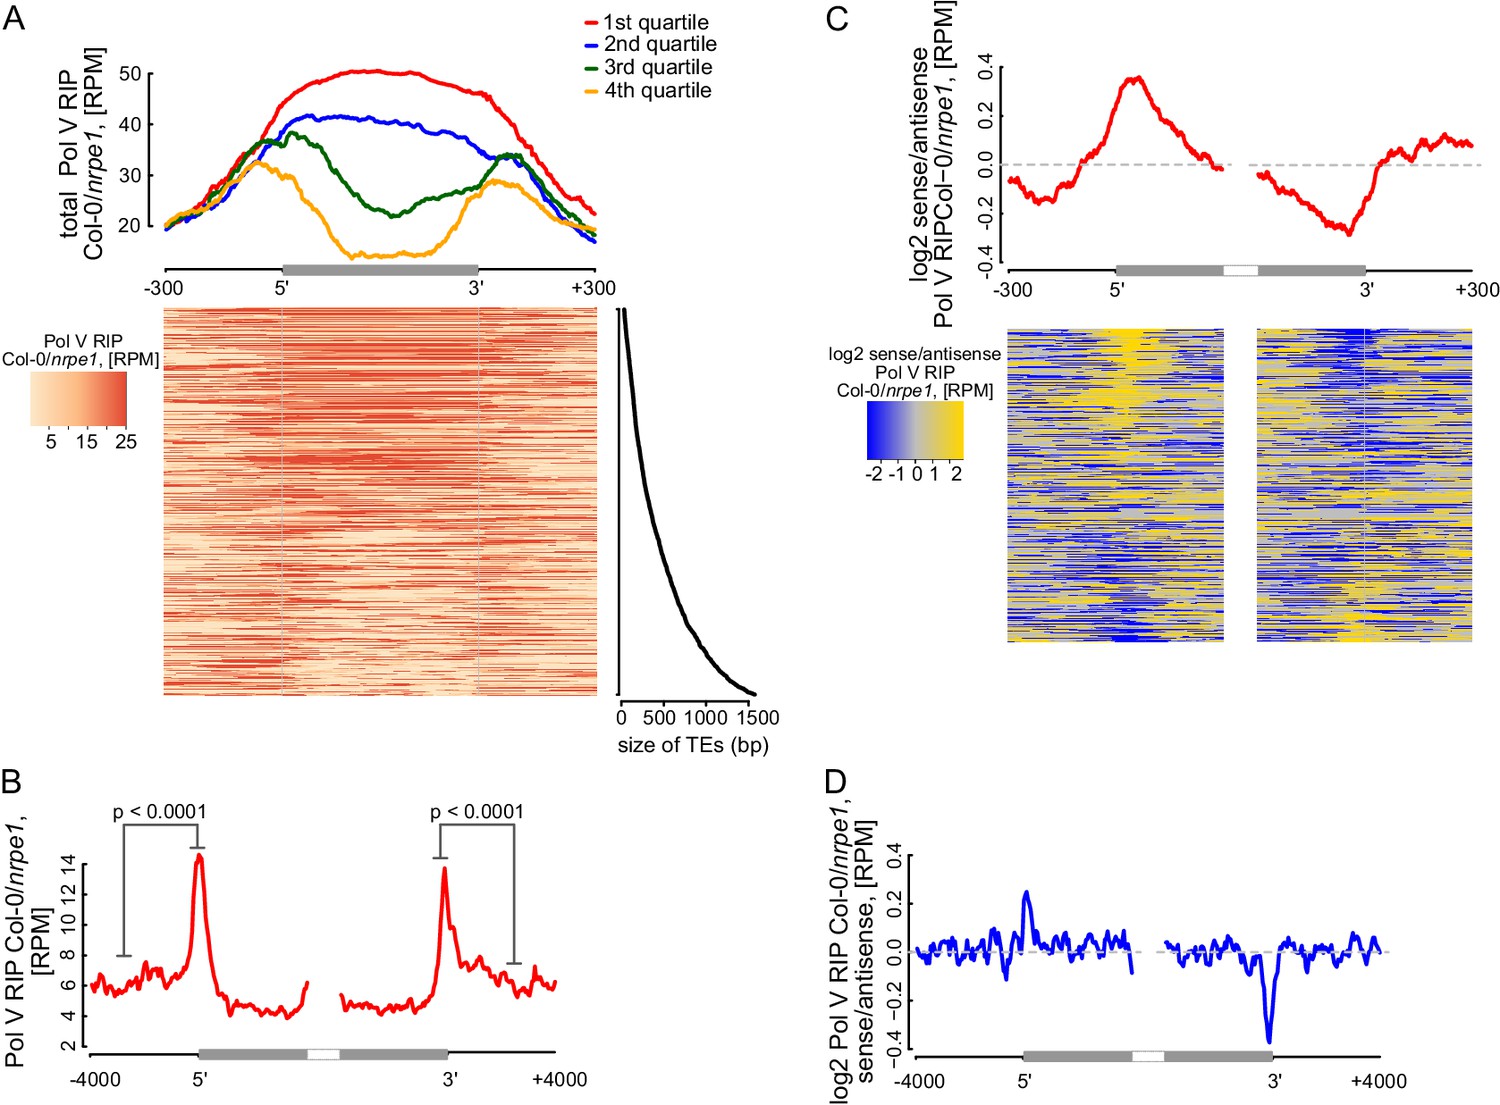
(A) Pol V transcripts are produced over the entire lengths of small transposons but are enriched at the edges of larger transposons. Annotated transposons (TAIR10) overlapping Pol V transcripts were split into quartiles according to their size (smallest to largest), scaled and the Pol V RIP-seq signal Col-0/nrpe1 was plotted. Heatmap shows individual transposons sorted by size (sizes shown on the adjacent plot). (B) Pol V transcription is enriched on the edges of large transposons. Annotated euchromatic transposons greater than 4 kb were aligned by their 5’- and 3’-ends and average Pol V RIP-seq signal was plotted in 50 bp windows. The p value was calculated using the permutation test by comparing 500 nt long regions starting 1000 nt outside and 250 nt within the TEs. (C) Pol V transcribes into transposons. Transposons used in Figure 7A were aligned by their 5’- and 3’-ends and the average ratio of sense to antisense Pol V RIP-seq signal was plotted. Heatmaps show individual transposons sorted by the strength of transcription into the TEs. (D) Pol V transcribes into transposons. Transposons used in Figure 7B were aligned with their ends and the average ratio of sense to antisense Pol V RIP-seq signal was plotted.
Figure 7—figure supplement 1
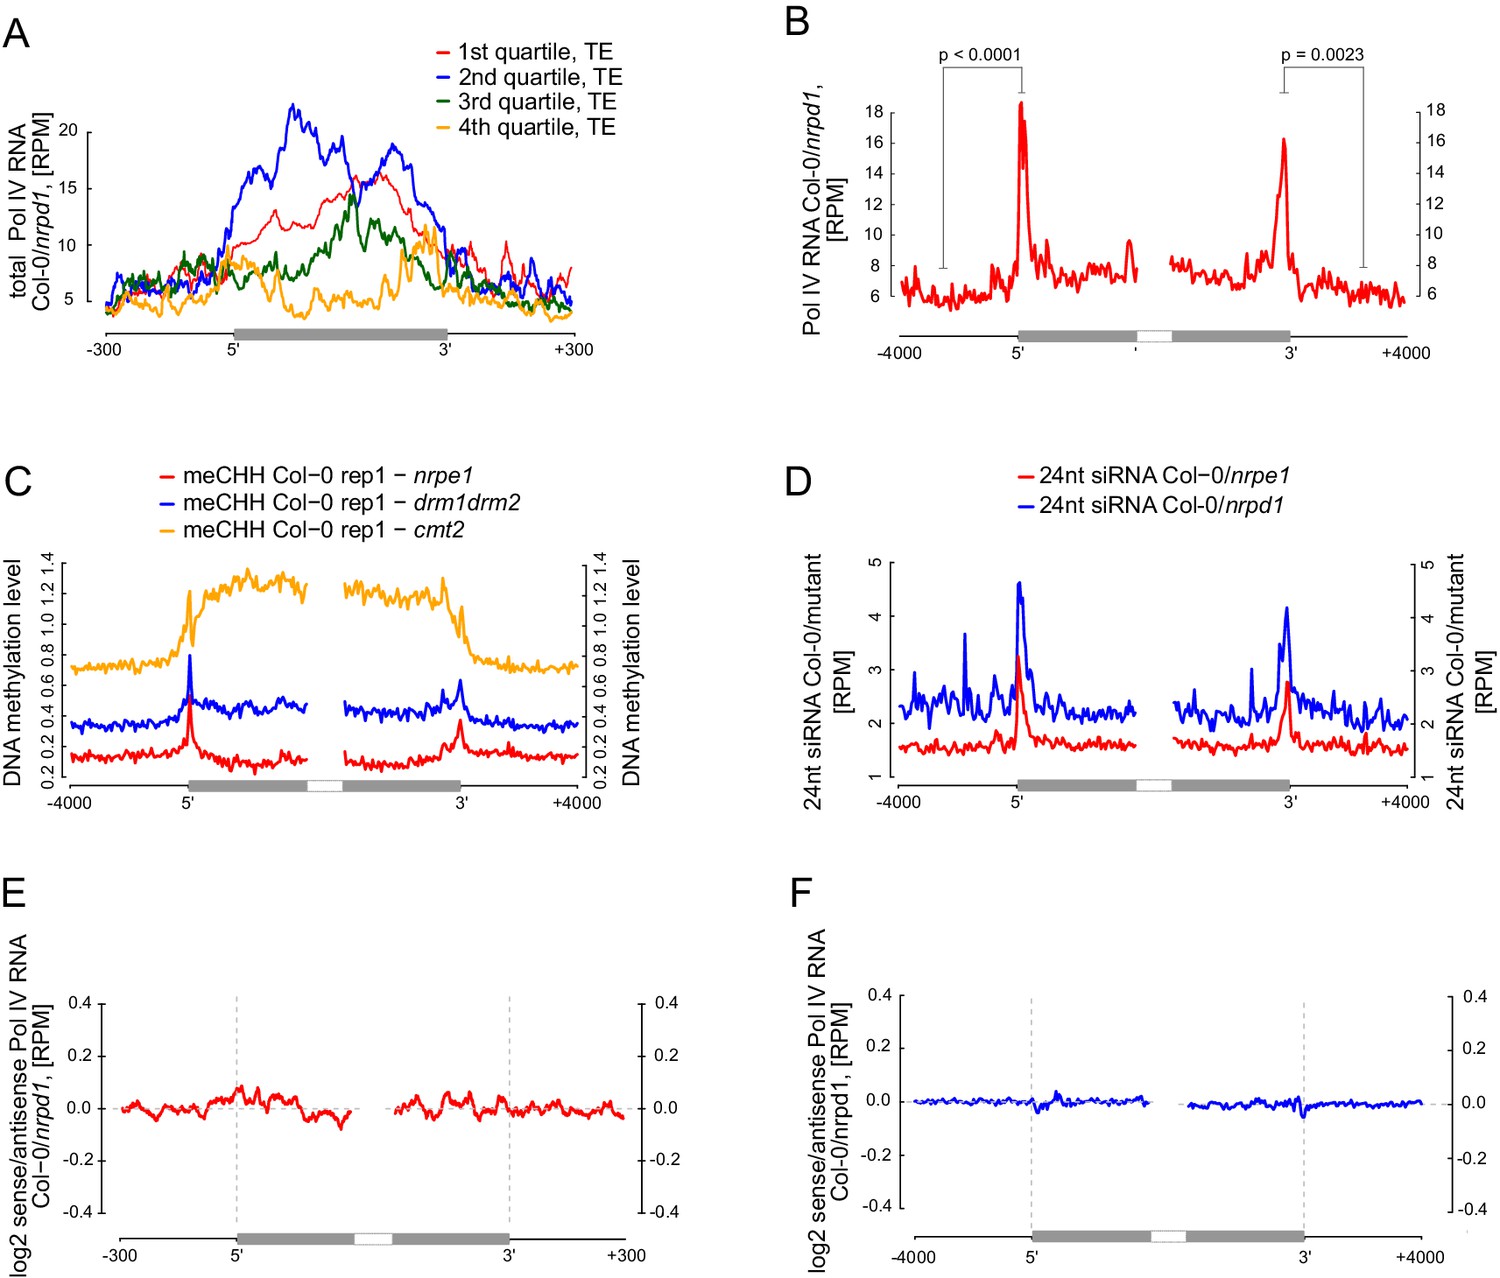
Pol V determines the edges of transposons.
(A) Pol IV transcription on transposons. Annotated transposons (TAIR10) overlapping Pol V transcripts were split into quartiles according to their size (smallest to largest), scaled and the Pol IV RNA-seq signal Col-0/nrpd1 (Blevins et al., 2015) was plotted. (B) Pol IV transcription is enriched on the edges of large transposons. Annotated euchromatic transposons greater than 4 kb were aligned by their 5’- and 3’-ends and average Pol IV RNA-seq signal (Blevins et al., 2015) was plotted in 50 bp windows. The p values were calculated using the permutation test by comparing 500 nt long regions starting 1000 nt outside and 250 nt within the TEs. (C) Pol V- and DRM1/DRM2-dependent CHH methylation are restricted to the edges of large TEs (≥4 kb), while CMT2 is more important for CHH methylation inside of TEs. Average CHH methylation levels (Stroud et al., 2013) were plotted in 50 bp windows on the 5’- and 3’-ends (± 4 kb) of large transposons. (D) Pol V-dependent 24 nt siRNAs and Pol IV-dependent 24 nt siRNAs are limited to the edges of large transposons (≥4 kb). Plots represent average signal on the 5’- and 3’-ends (± 4 kb) of large transposons. Ratios of Pol IV- or Pol V-dependent 24 nt siRNAs (Lee et al., 2012) were plotted. (E) Pol IV transcription shows no strand preference on transposon edges. Transposons used in Figure 7A were aligned by their 5’- and 3’-ends and the average ratio of sense to antisense Pol IV RNA-seq signal (Blevins et al., 2015) was plotted. (F) Pol IV transcription shows no strand preference on transposon edges. Transposons used in Figure 7B were aligned with their ends and the average ratio of sense to antisense Pol IV RNA-seq signal (Blevins et al., 2015) was plotted.
Additional files
-
Supplementary file 1
Oligonucleotides used in this study.
The table shows oligonucleotides used for locus-specific qPCR-based assays used in this study.
- https://doi.org/10.7554/eLife.19092.016
Download links
A two-part list of links to download the article, or parts of the article, in various formats.
Downloads (link to download the article as PDF)
Open citations (links to open the citations from this article in various online reference manager services)
Cite this article (links to download the citations from this article in formats compatible with various reference manager tools)
Long non-coding RNA produced by RNA polymerase V determines boundaries of heterochromatin
eLife 5:e19092.
https://doi.org/10.7554/eLife.19092


