Domain-swapped T cell receptors improve the safety of TCR gene therapy
- California Institute of Technology, United States
- Stanford University School of Medicine, United States
- Max Delbrück Center for Molecular Medicine, Germany
- University of Arizona, United States
- The BIO5 Institute, University of Arizona, United States
- University of California, Los Angeles, United States
- Humboldt-Universität zu Berlin, Germany
Figures
Figure 1
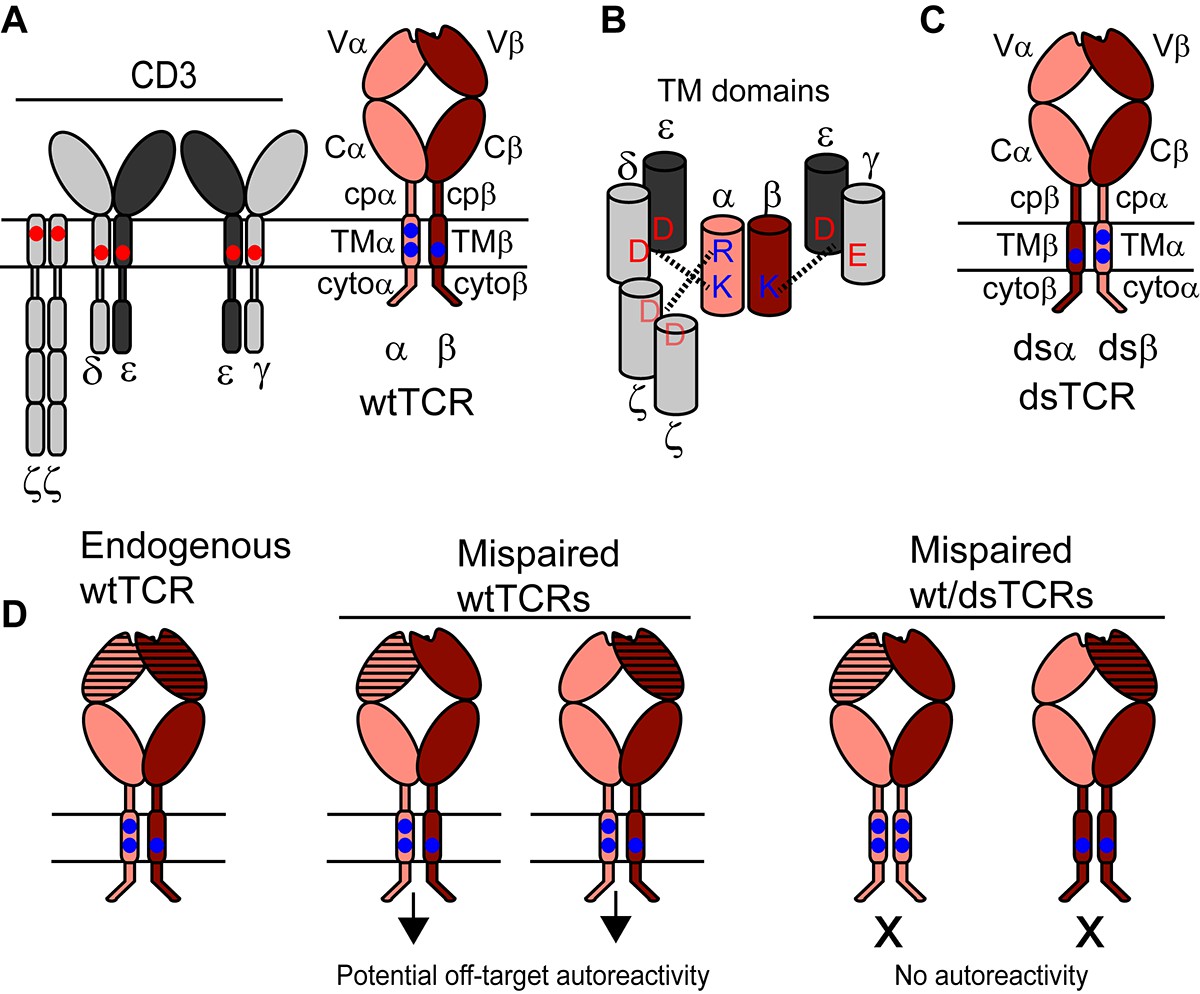
Schematic outlining the domain-swapped TCR strategy.
(A) The TCR/CD3 complex comprises the antigen-specific variable (V) Ig domain and constant domains (constant Ig, C; connecting peptide, cp; transmembrane helix, TM; and cytoplasmic tail, cyto), which assemble with CD3 chains. CD3 chains are required for export of the TCR/CD3 complex to the cell surface and for signaling. Parallel horizontal lines represent the cell membrane. (B) Schematic showing key interactions between basic residues in the TCR TM domain and acidic residues in the CD3 TM domains. (C) Domain-swapped TCRs retain all domains of the wild-type TCR with altered covalent connectivity. (D) Mispairing between therapeutic and endogenous TCR chains can result in autoreactivity (middle). Mispairing between domain-swapped therapeutic and endogenous TCR chains will result in heterodimers that lack constant domains needed to assemble with CD3, preventing surface expression and function of potentially autoreactive TCRs (right). Domain-swapped TCRs are thus expected to be functional but incapable of mediating mispairing-related autoreactivity.
Figure 2 with 2 supplements
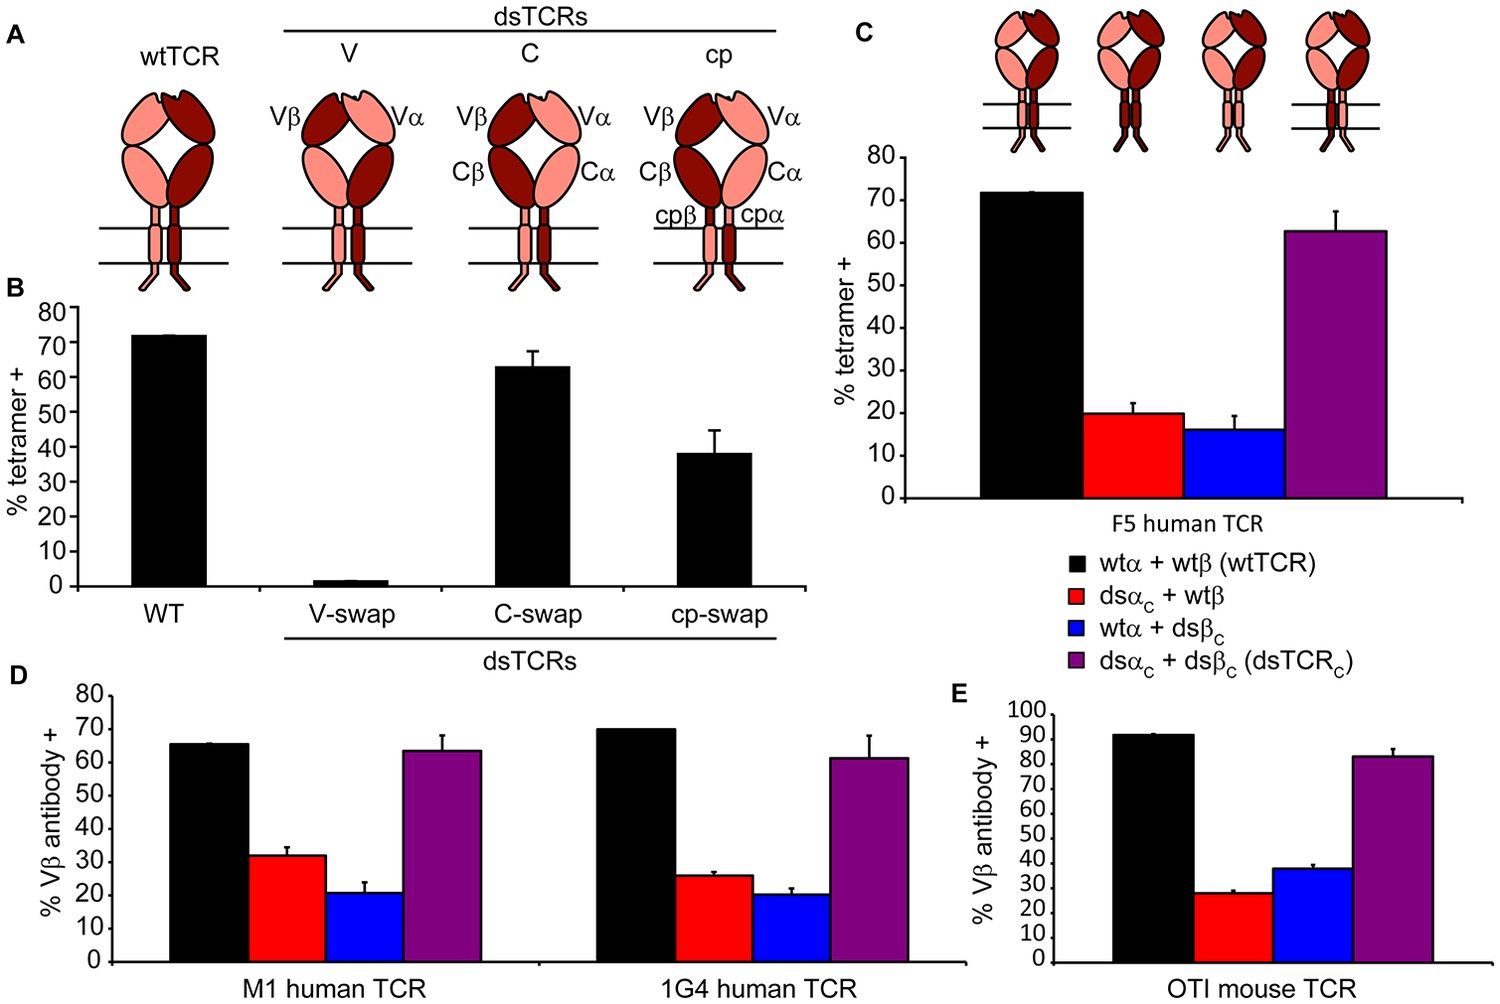
Domain-swapped TCRs assemble with CD3 and retain antigenic specificity.
(A) Schematic of dsTCR architectures. Domains are swapped following the V domains (dsTCRV), C domains (dsTCRC), or connecting peptides (dsTCRcp). (B) Flow cytometric analysis of peptide-MHC multimer binding by CD3+ 293T transfected with F5 wtTCR or dsTCRs. (C) Flow cytometric analysis comparing peptide-MHC multimer binding by CD3+ 293T transfected with F5 wtTCR, dsTCRC, or simulated mispaired constructs. Schematics of constructs are above corresponding data. (D–E) Flow cytometric analysis comparing anti-Vβ antibody binding by CD3 + 293T transfected with wtTCR, dsTCRC, or simulated mispaired constructs for (D) two additional human TCRs and (E) mouse OTI TCR. Means ± SD for two replicate transfections are shown.
Figure 2—figure supplement 1
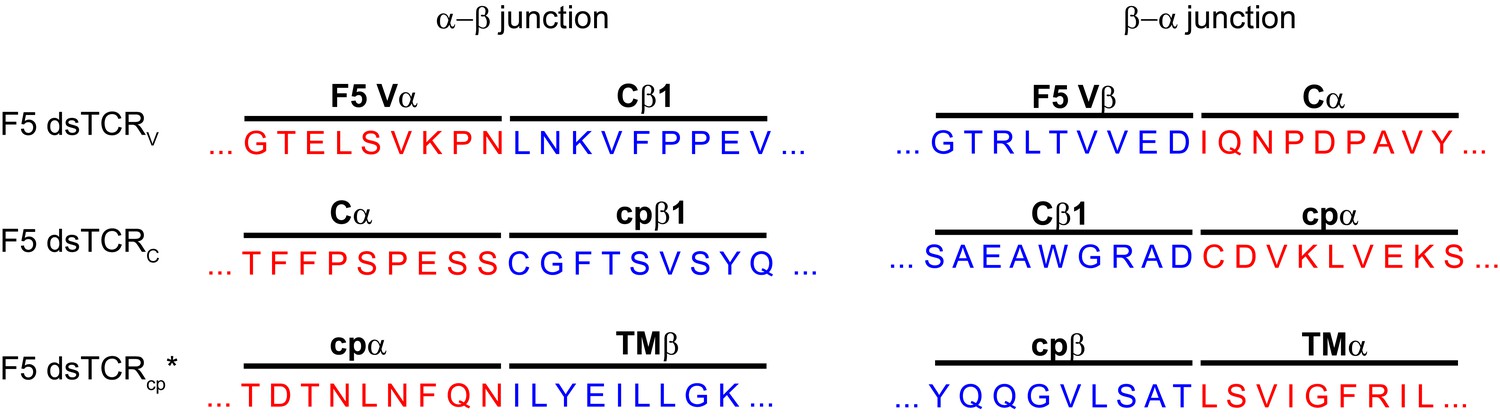
Amino acid sequences of initial domain-swapped TCR construct chimeric junctions.
Sequence derived from TCRα is in red and sequence derived from TCRβ is in blue. The junction sequence shown for dsTCRcp’ was only used for experiment in Figure 2. Final optimized junction for dsTCRcp is shown in Supplemental Figure 2.
Figure 2—figure supplement 2
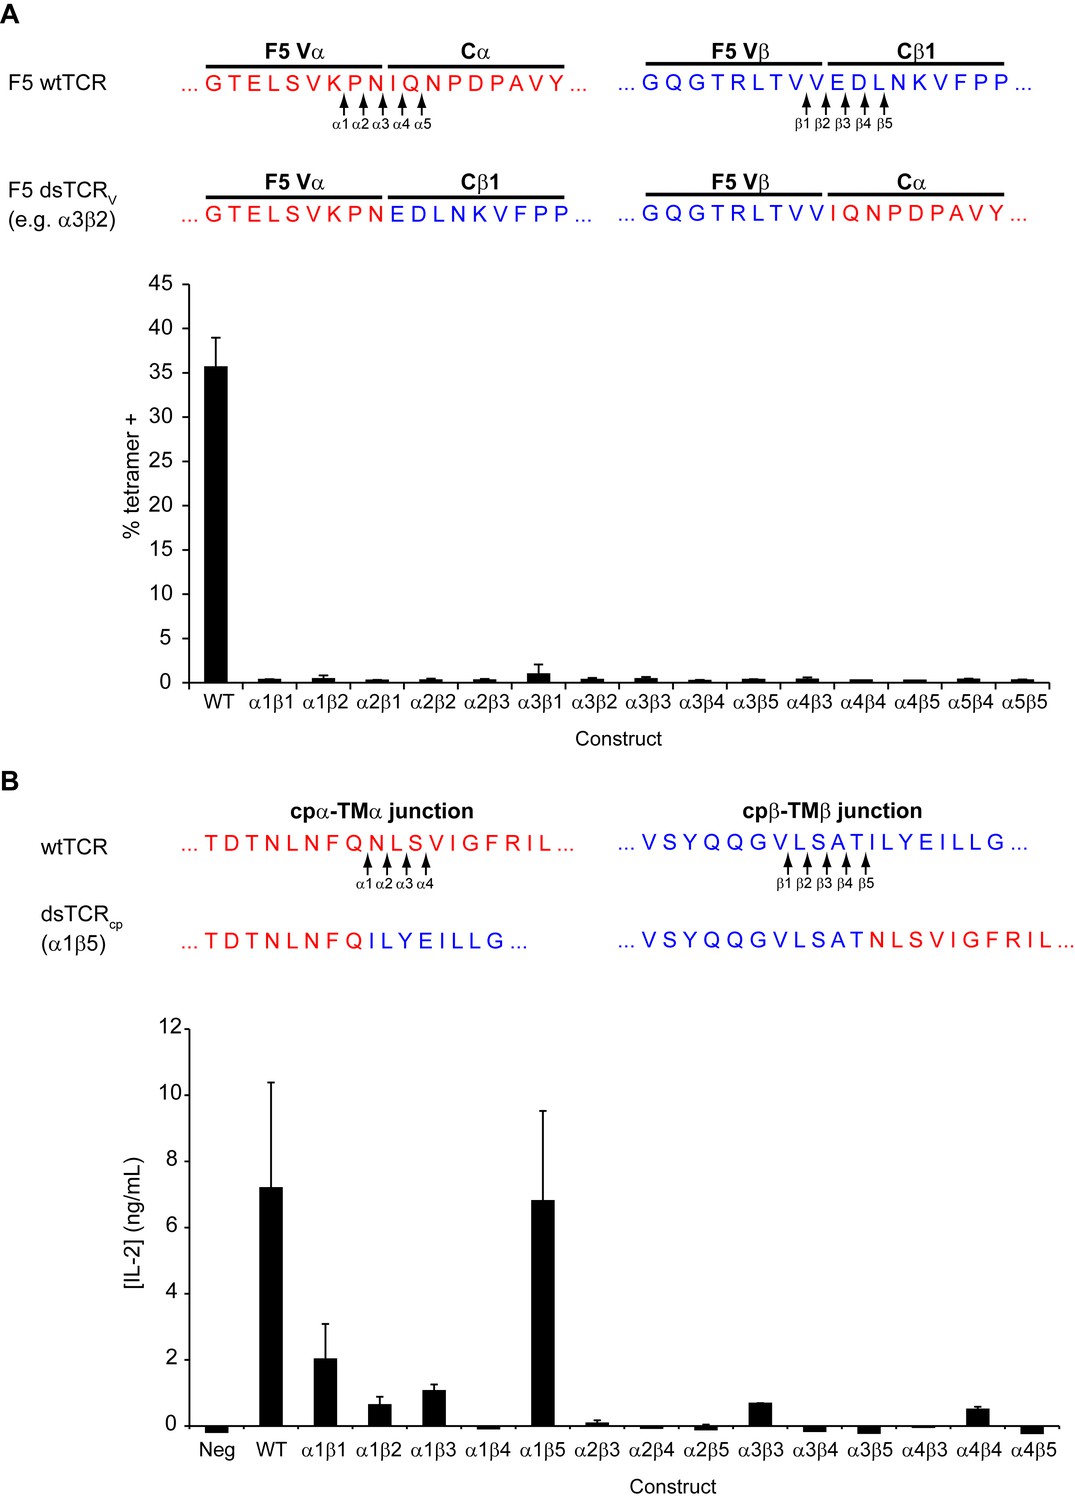
Optimization of domain-swapped junctions for dsTCRV and dsTCRcp.
(A) Amino acid sequences of F5 TCR Vα-Cα and Vβ-Cβ domain boundaries are shown. Positions used in iterating the position at which domains were swapped are indicated with arrows, and an illustrative example sequence for one dsTCRV iteration (α3β2) is provided. To test for optimal surface expression, 293T were cotransfected with CD3 and dsTCRV constructs and percent of transfected cells that bound tetramer was measured by flow cytometry. Means ± SD for triplicate assays from a single experiment shown. (B) Amino acid sequences of F5 TCR cpα-TMα and cpβ-TMβ domain boundaries are shown. Positions used in iterating the position at which domains were swapped are indicated with arrows. The optimized dsTCRcp sequence (α1β5) is provided. To identify construct with optimal function, IL-2 secretion was measured by ELISA following 48 hr coincubation of dsTCRcp–transduced Jurkat T cells with antigen-expressing K562 target cells. Means ± SD for 3 technical replicates from a single experiment shown.
Figure 3 with 1 supplement
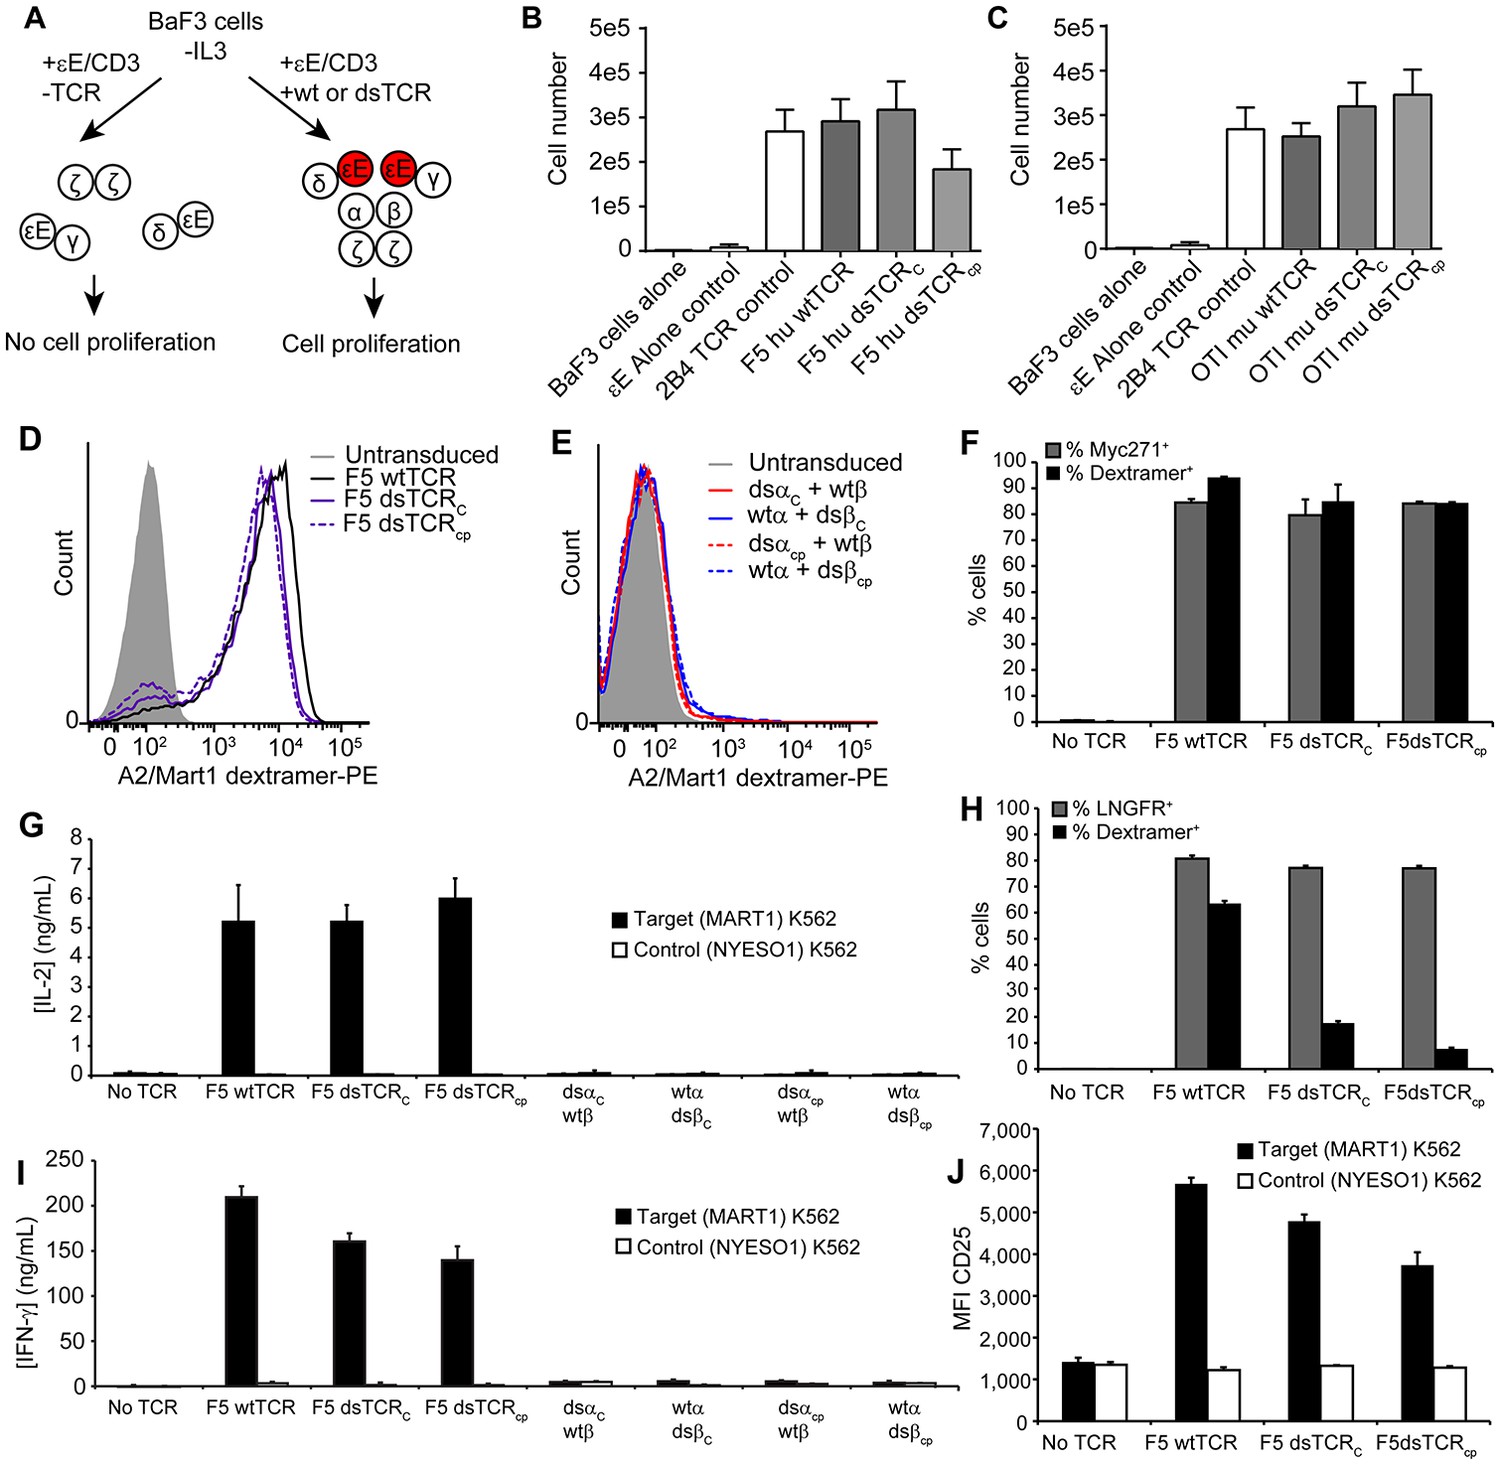
Domain-swapped TCRs are functional in lymphocytes.
(A) Schematic of the BaF3 proliferation assay for determining CD3 orientation within the TCR/CD3 complex. CD3ε-EpoR fusion proteins promote IL-3-independent proliferation of BaF3 only if assembly in the TCR/CD3 complex orients them in juxtaposition to one another. (B-C) CD3ε-EpoR-driven proliferation of BaF3 cells expressing wild-type and domain-swapped (B) human F5 TCR and (C) mouse OTI TCR. Cell number was measured 72 hr after IL-3 deprivation. Means ± SD for 3 independent experiments are shown. (D-E) Representative flow cytometry histograms comparing peptide-MHC multimer binding by Jurkat T cells transduced with (D) F5 wtTCR or dsTCR constructs or (E) simulated mispaired constructs. Multimer binding is reliant on cell surface expression following assembly with endogenous CD3 chains. (F) Flow cytometric measurement of TCR and Myc271 expressed on the surface of transduced Jurkats. Myc271 is an independent transduction marker expressed from the same vector as TCR. (G) ELISA measuring secretion of IL-2 from TCR-transduced Jurkats following 48 hr coincubation with cognate or control antigen-expressing K562 target cells. (H) Flow cytometric measurement of dextramer-binding TCR and LNGFR expressed on the surface of transduced primary human T cells. LNGFR is an independent transduction marker expressed from the same vector as TCR. (I) ELISA measurement of secreted IFN-γ and (J) flow cytometric measurement of CD25 expressed on the T cell surface from TCR-transduced primary human T cells following 48 hr coincubation with cognate or control antigen-expressing K562 target cells. For panels (f-j), means ± SD for 3 technical replicates are shown.
Figure 3—figure supplement 1
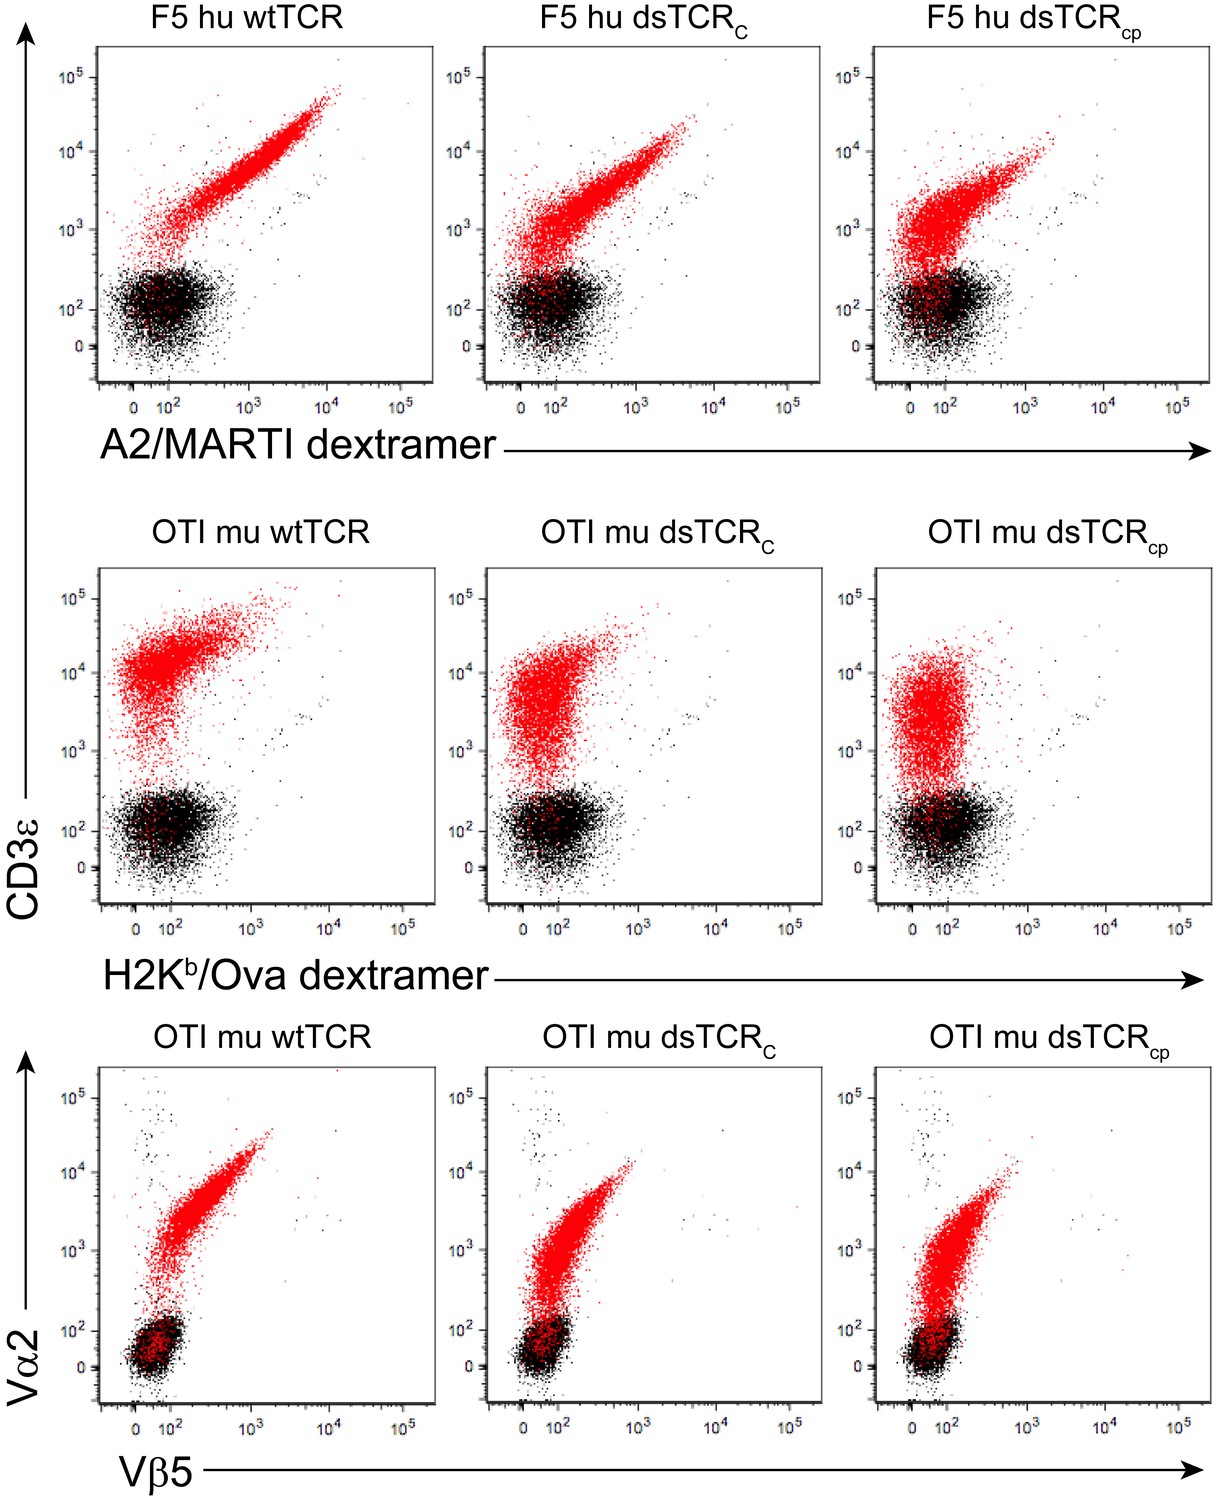
Domain-swapped TCRs are expressed on the surface of CD3+ BaF3 cells.
Representative flow cytometry plots showing surface expression of wt and dsTCR constructs in transduced CD3+ BaF3 cells. Events from untransduced (black) and transduced (red) cells are overlaid. Three independent experiments were performed.
Figure 4 with 4 supplements
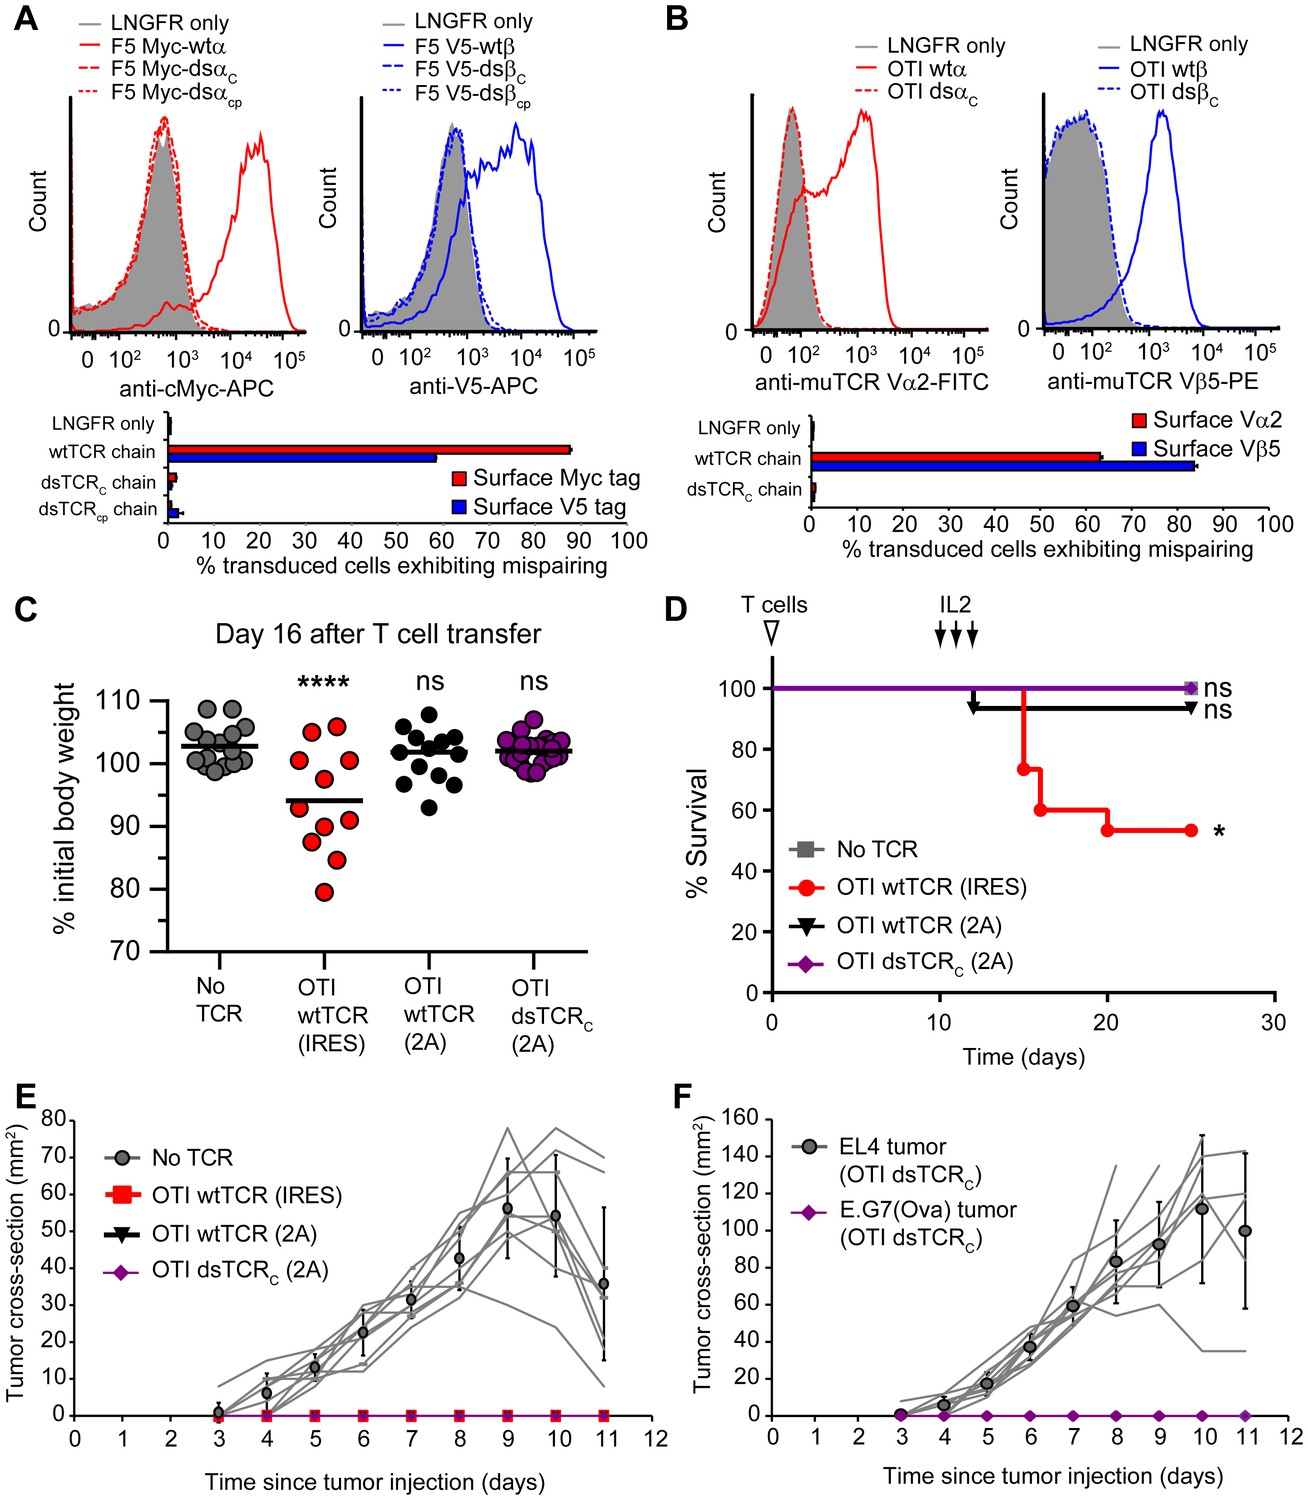
Domain-swapped TCRs do not mispair with endogenous TCRs and do not cause graft-vs-host disease.
(A-B) Flow cytometric measurement of mispairing of (A) human F5 TCR chains in human peripheral blood T cells and (B) murine OTI TCR chains in murine splenic T cells. Cells were transduced with only TCRα (left panel) or only TCRβ (right panel) such that expression of the introduced chain on the cell surface required mispairing with endogenous TCR chains. Representative histograms are displayed above bar graphs quantifying means ± SD for 3 technical replicates. (C-D) Mouse model of TCR gene transfer-induced graft-vs-host disease (TI-GvHD). Mice were irradiated on day -1, administered TCR-transduced T cells on day 0, and injected twice daily with IL-2 from day 10–12. Weight was monitored daily and mice were euthanized at 85% initial body weight. Results are aggregated from 3 independent experiments. Respective group sizes, n = 9, 15, 15, and 25. *p<0.05, ****p<0.0001, ns, not significant. (C) Percent initial body weight of surviving mice at 16 days after T cell administration. (D) Kaplan-Meier survival curve. (E) Tumor size in mice administered TCR-transduced T cells and then injected with ovalbumin-expressing E.G7 thymoma tumor cells. Respective group sizes, n = 9, 6, 10, and 10. Mean ± SD for each group is overlaid on traces for individual animals. (F) Tumor size in mice (n = 10) administered OTI dsTCR-transduced T cells and then injected on opposing flanks with EL4 (control) or E.G7 (target) thymoma tumor cells.
Figure 4—figure supplement 1
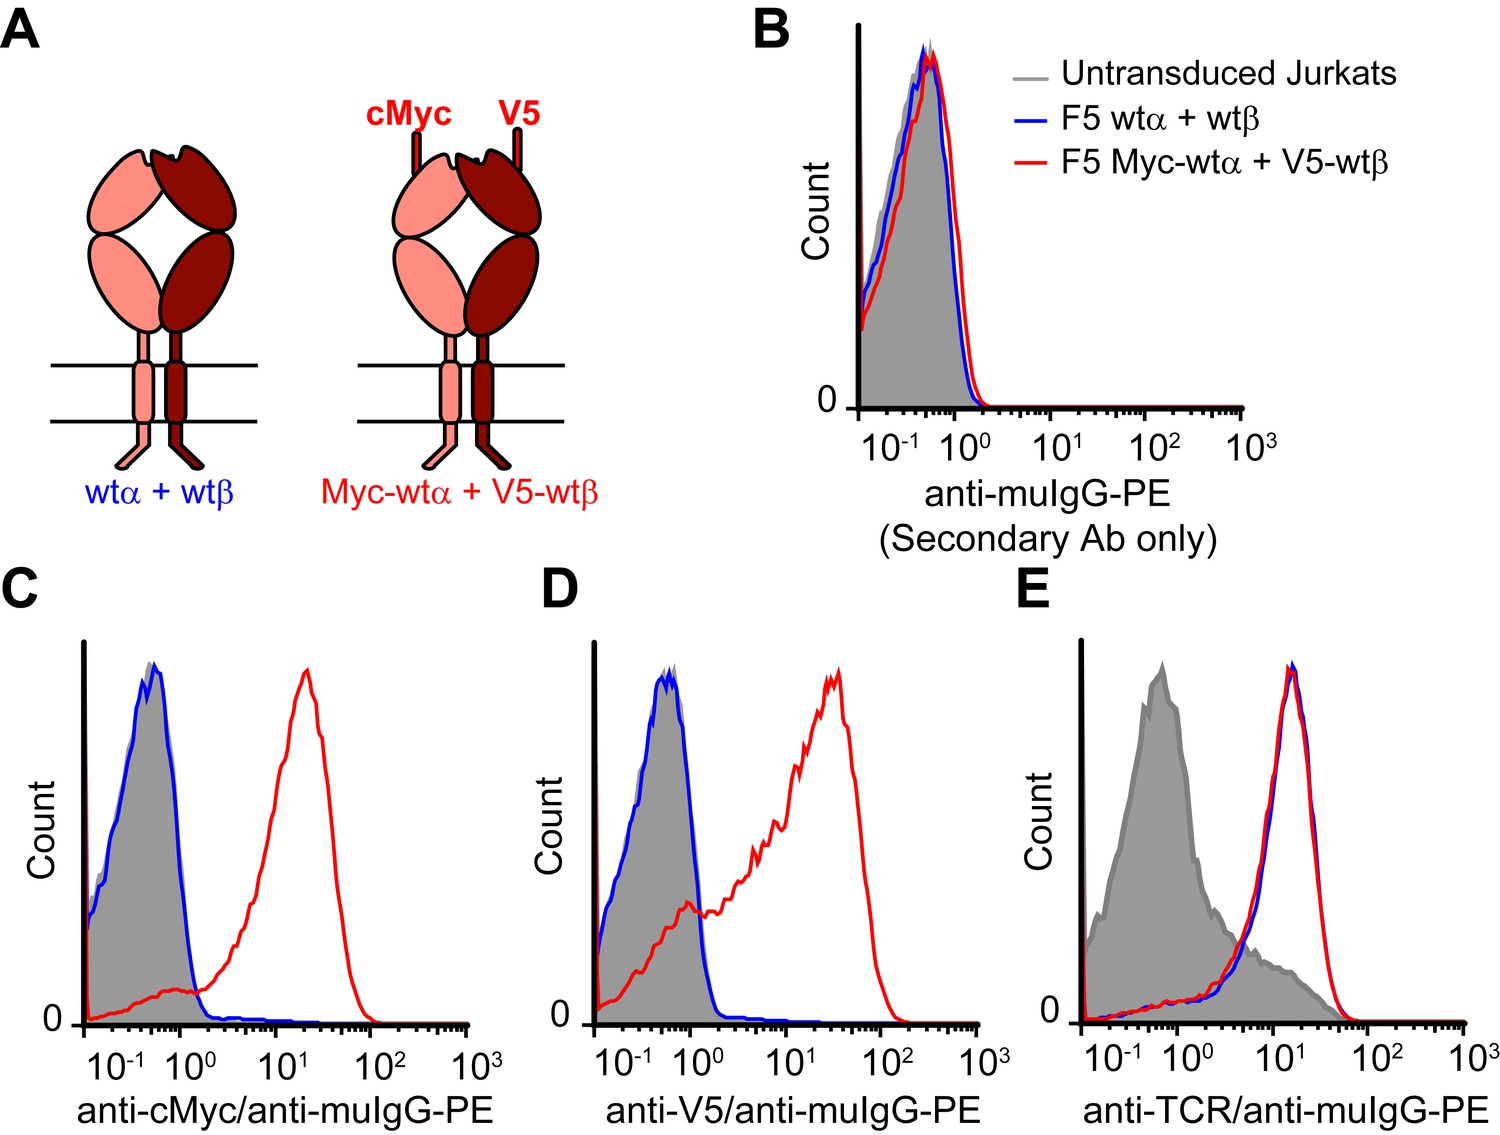
N-terminal epitope tags do not impair surface expression of TCR chains.
(A) Schematic of untagged and epitope-tagged TCRs delivered to Jurkat T cells via retroviral transduction. (B-E) Flow cytometry histograms measuring (B) background staining with anti-mouse IgG (secondary antibody) only, (C) cMyc-TCRα, (D) V5-TCRβ, or (E) TCR expressed on the surface of untransduced and transduced Jurkat cells. JOVI.1 antibody detects a TCRβ extracellular constant domain epitope on the surface of ~10% of untransduced Jurkat T cells. This is increased to the same extent by transduction with untagged or tagged TCR. Histograms are representative of 3 similar experiments.
Figure 4—figure supplement 2
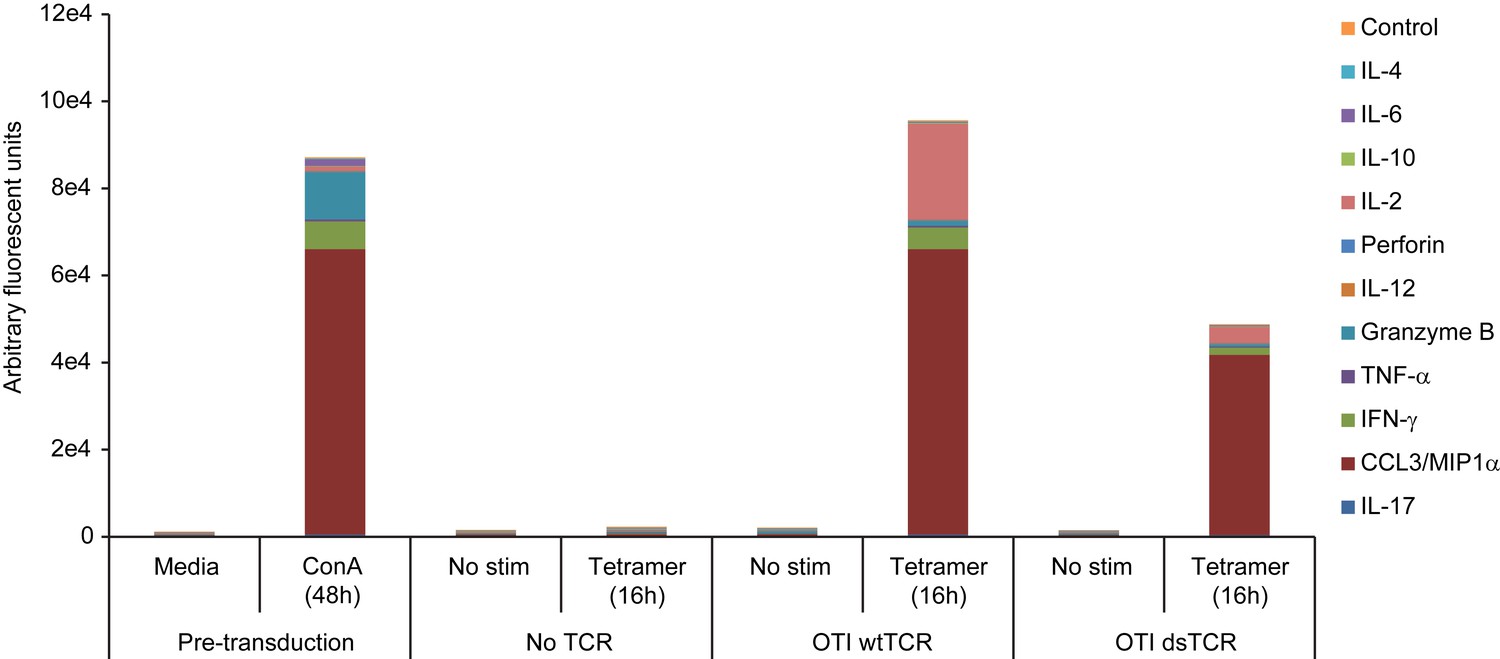
Wild-type TCR- and dsTCR-transduced T cells secrete a similar complement of cytokines upon stimulation.
Mouse splenocytes were activated with 2 μg/mL concanavalin A and 1 ng/mL IL-7 for 48 hr, transduced with OTI wtTCR, OTI dsTCR, or no TCR overnight, washed, and then incubated for 16 hr in either media alone or media containing H-2Kb/Ova tetramer and anti-CD28 antibody. Supernatants collected after 48 hr ConA/IL-7 activation and after 16 hr tetramer stimulation were tested for ensemble cytokine analysis based on a DNA-encoded Antibody Library (DEAL) assay52. Results are from a single experiment.
Figure 4—figure supplement 3
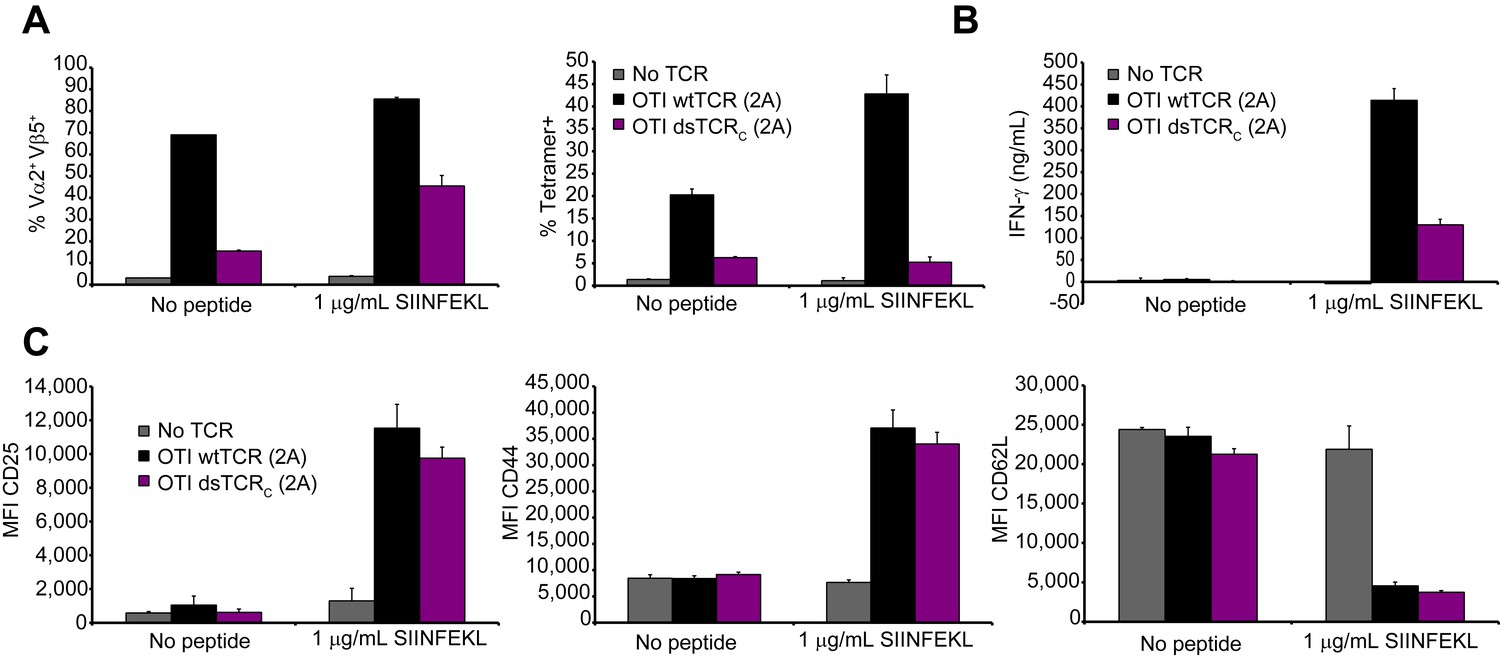
Domain-swapped TCR-transduced T cells are functional in vivo.
(A-C) Functional analysis of splenic T cells from mice 45 days after administration of OTI (Vα2Vβ5) TCR-transduced T cells. Splenocytes were incubated for 72 hr with or without Ova257-264 peptide and analyzed by flow cytometry and ELISA. Means ± SD for 3 technical replicates are shown. (A) Flow cytometric measurement of percent of Vα2+Vβ5+ (left panel) and H-2Kb/Ova257-264 tetramer+ (right panel) splenic T cells. (B) ELISA measurement of secreted IFN-γ. (C) Flow cytometric measurement of CD25 (left panel), CD44 (middle panel), and CD62L (right panel) expressed on the T cell surface.
Figure 4—figure supplement 4
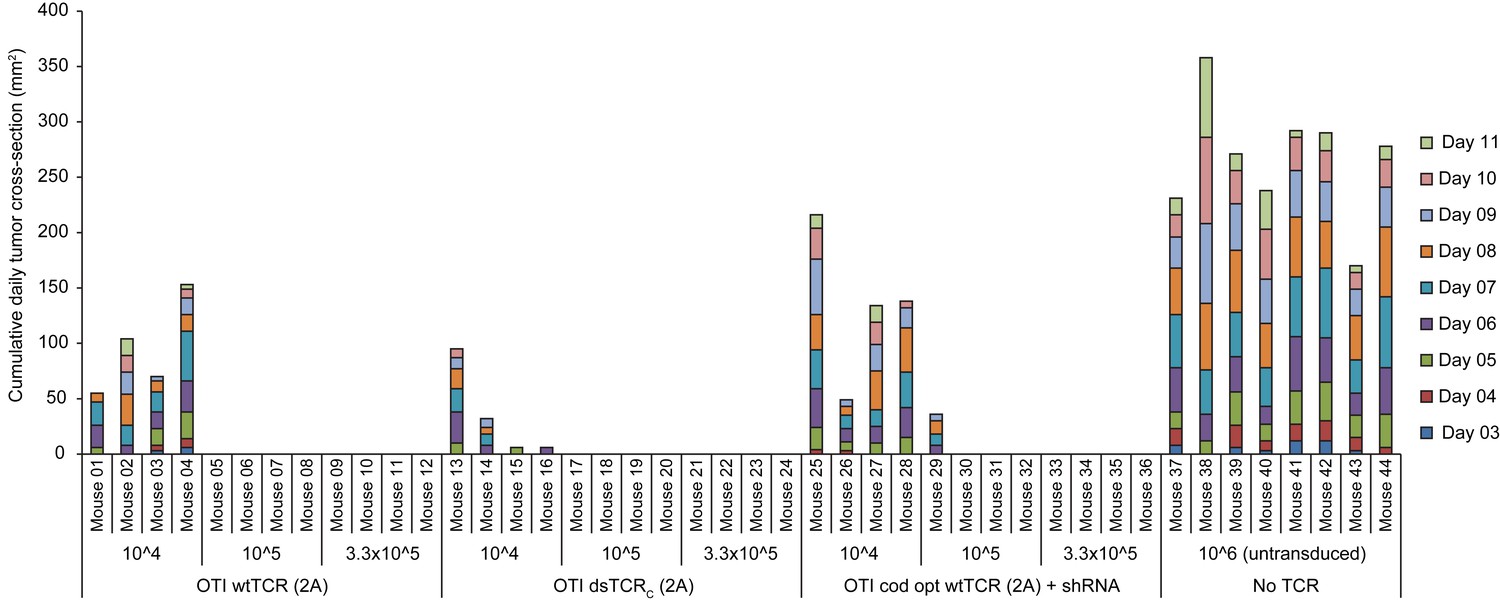
Wild-type and domain-swapped TCR-transduced T cells similarly protect against tumor growth
Stacked daily tumor cross-sectional area measurements in mice administered a variable number (104,105, or 3.3 x 10⁵) of ovalbumin-specific TCR-transduced T cells (unsorted) and then injected with 5 x 10⁶ ovalbumin-expressing E.G7 thymoma tumor cells. Group size is n = 8 for control T cells (no transduced TCR) and n = 4 for each input level for each TCR-transduced T cell group (wild-type, domain-swapped, or codon-optimized wild-type with endogenous TCR knockdown).
Figure 5 with 1 supplement
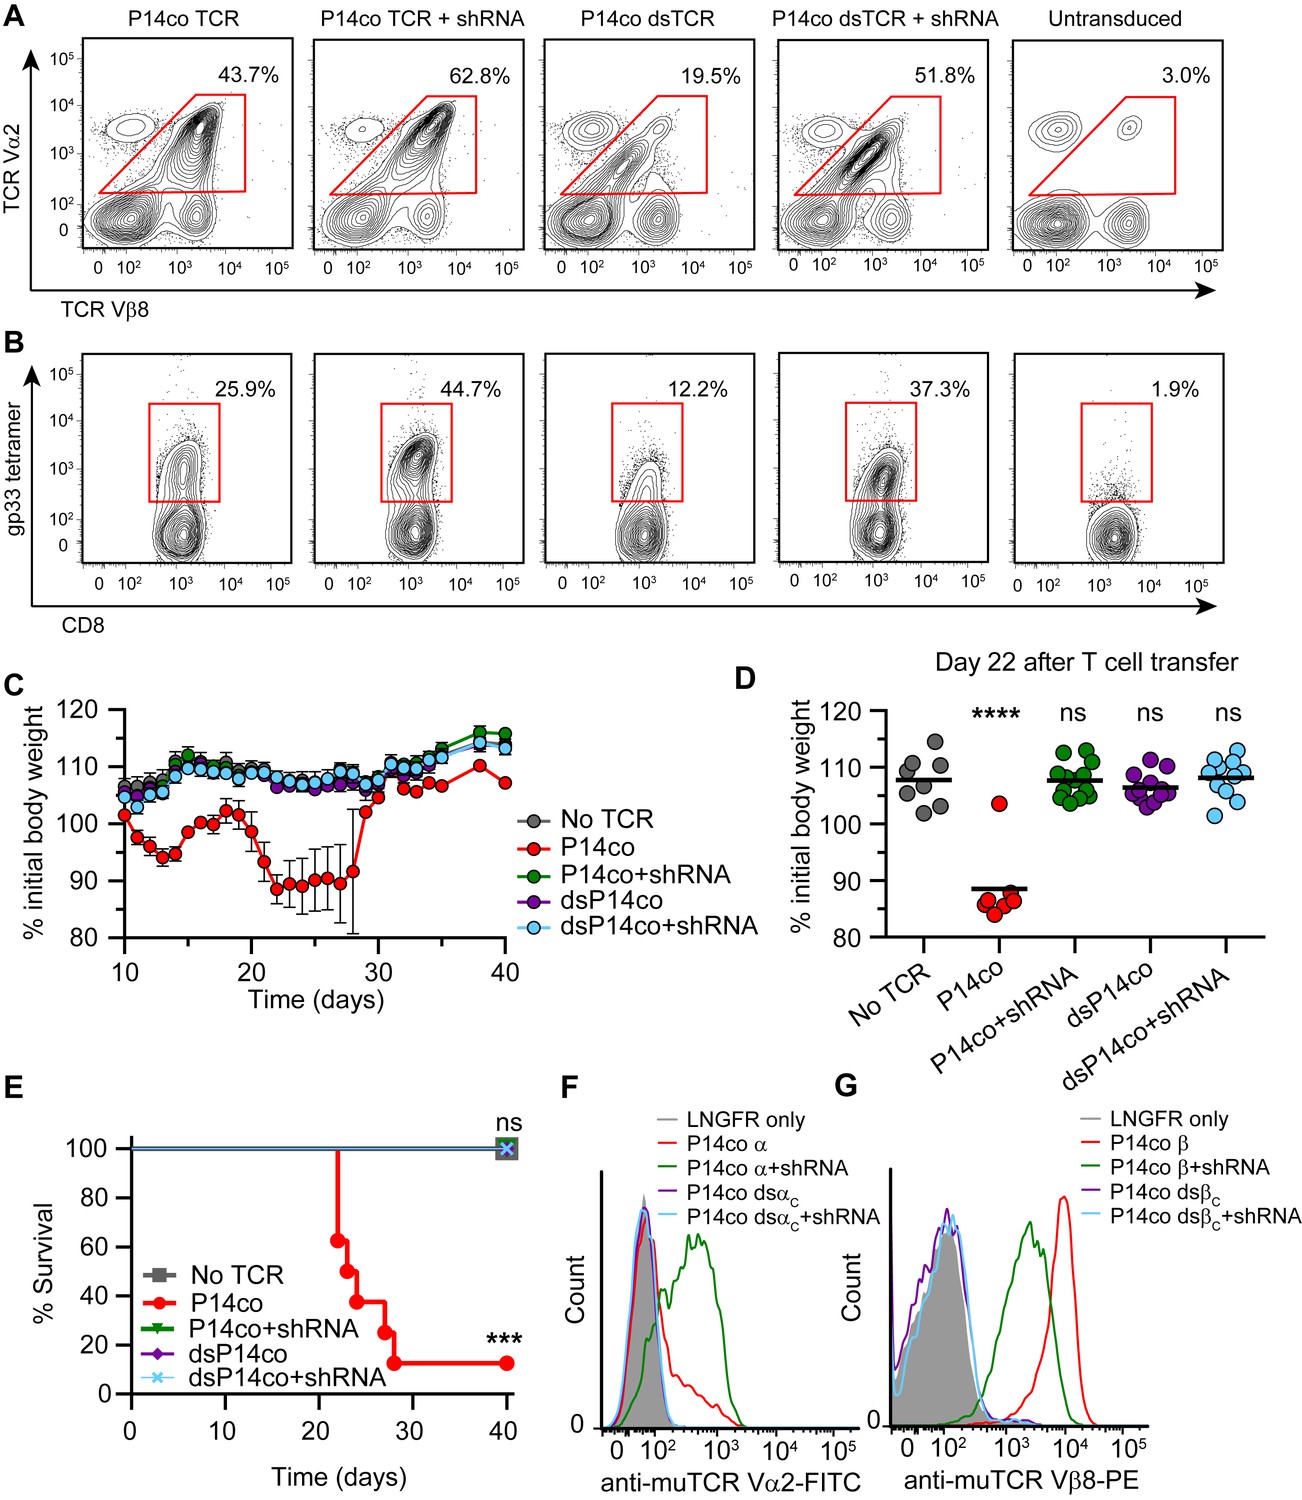
Complementarity of TCR domain-swapping and endogenous TCR knockdown.
(A-B) Representative flow cytometry plots showing percent of CD8+ T cells that are (A) Vα2+Vβ8+ and (B) gp33 tetramer+ following transduction with a vector delivering codon-optimized gp33-specific P14 (Vα2Vβ8) TCR ± shRNA targeted to endogenous TCR Cα/Cβ. (C-E) Mouse model of TCR gene transfer-induced graft-vs-host disease (TI-GvHD), as in Figure 4, except mice were administered T cells transduced with codon-optimized P14 TCR ± shRNA targeted to endogenous TCR Cα/Cβ. Respective group sizes, n = 8, 8, 13, 12, and 11. ***p<0.001, ****p<0.0001 ns, not significant. (C) Mean percent initial body weight ± SD for each group over time. (D) Percent initial body weight of surviving mice at 22 days after T cell administration. (E) Kaplan-Meier survival curve. (F-G) Flow cytometric measurement of mispairing of (F) P14 TCRα and (G) P14 TCRβ chains in murine splenic T cells transduced with either chain ± shRNA targeted to endogenous TCR Cα/Cβ. Histograms are representative of triplicate results from 3 independent experiments.
Figure 5—figure supplement 1
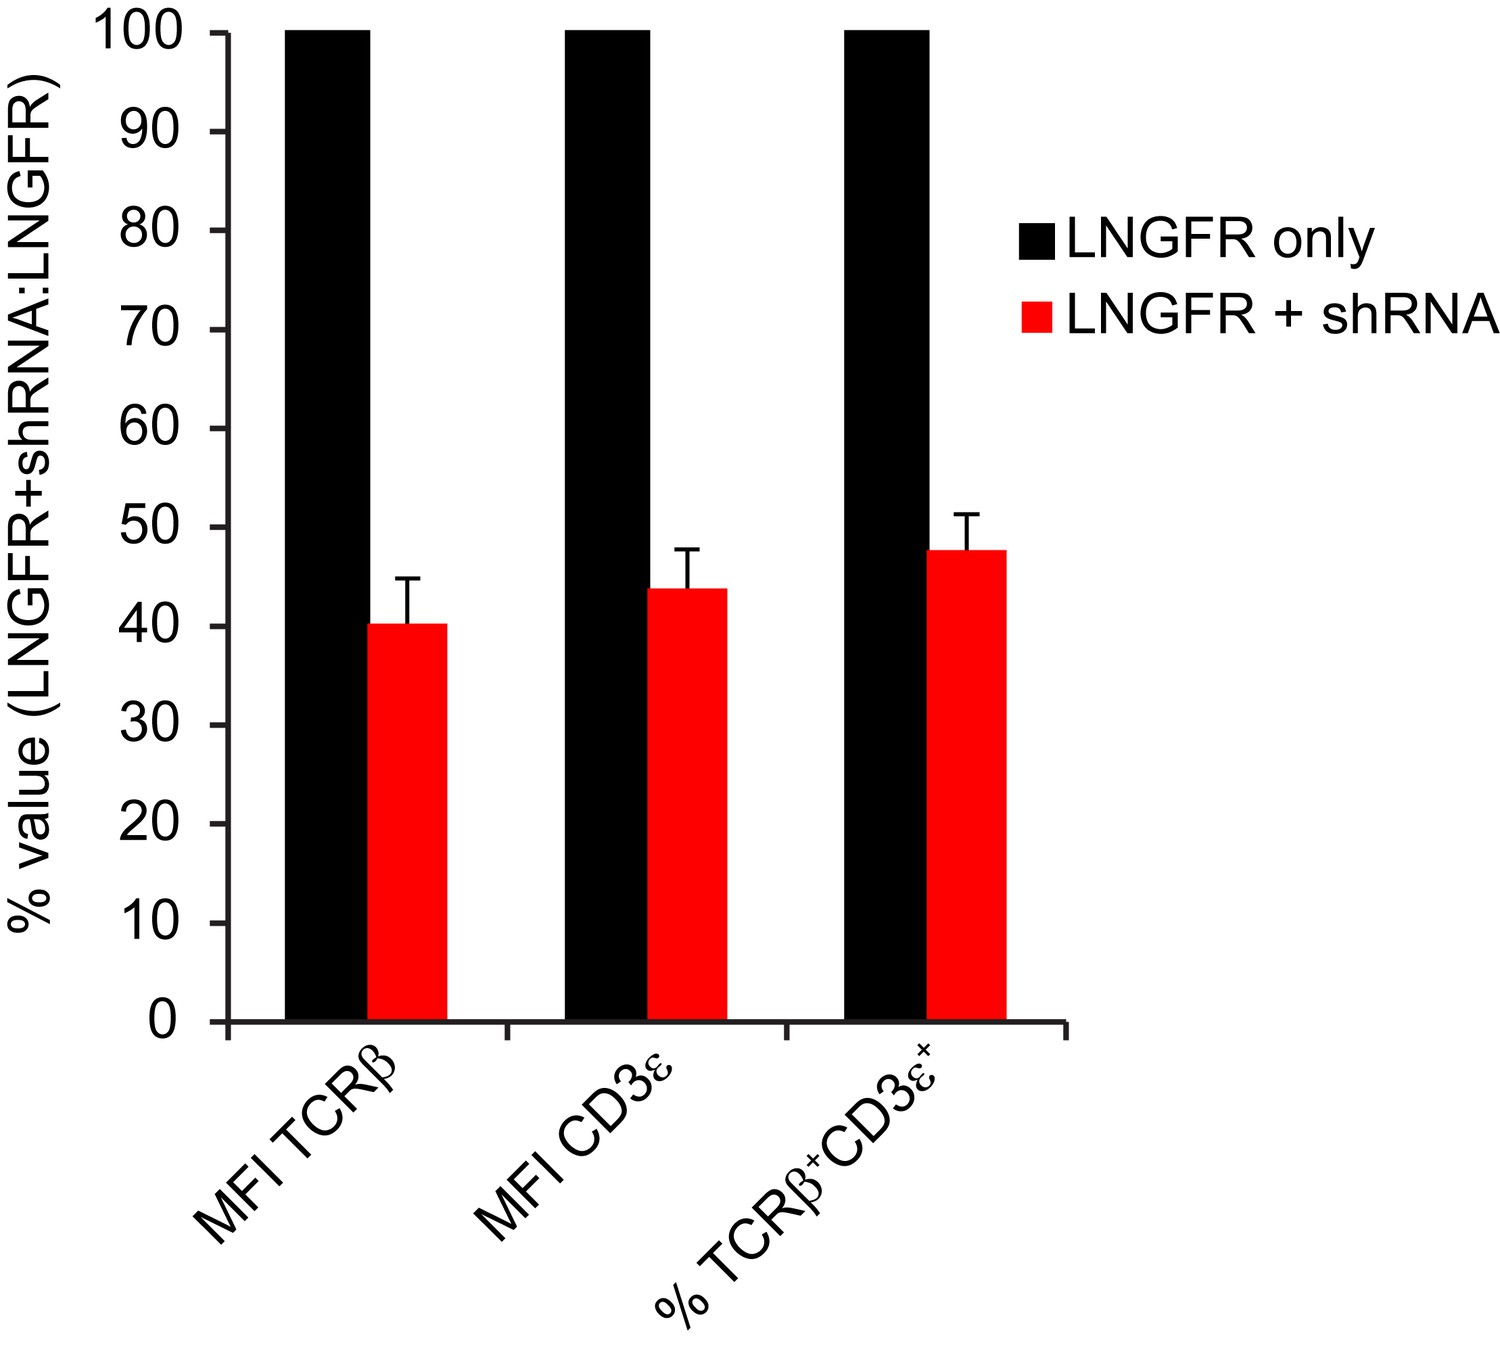
shRNA-mediated knockdown reduced endogenous TCR expression on surface of mouse T cells.
Flow cytometric measurement of cell surface TCR Cβ and CD3ε on mouse splenic T cells transduced with LNGFR ± shRNA targeting endogenous TCR Cα/Cβ. Mean ± SD from triplicate measurements of MFI for TCR Cβ, MFI for CD3ε, and % double positive for TCR Cβ/CD3ε among CD45.1+CD8a+LNGFR+ cells, calculated as 100%*(value for LNGFR+shRNA/value for LNGFR). Data are representative of 2 independent experiments.
Figure 6
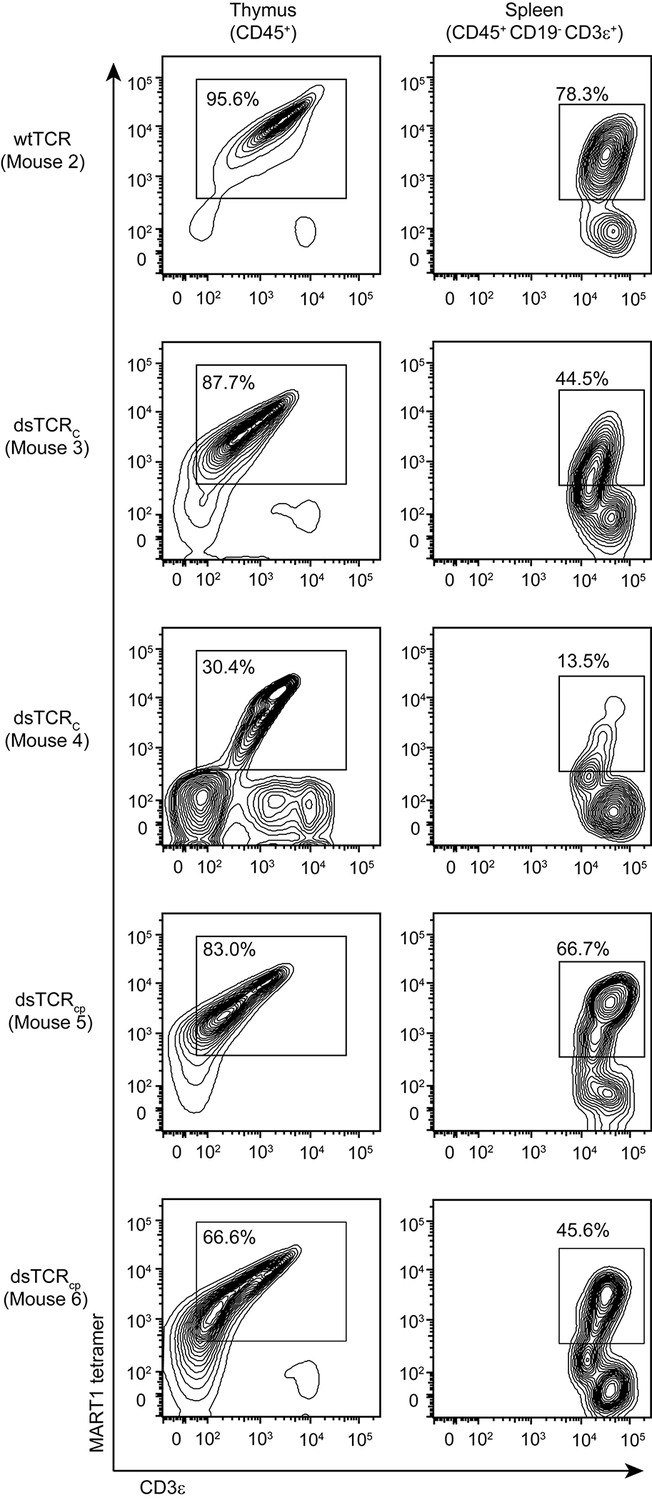
dsTCR-transduced human HSCs develop into antigen-specific T cells in humanized mice.
Flow cytometry plots showing dissociated thymocytes or splenocytes from humanized mice stained with A2/MART1 tetramer and anti-CD3ε. Mice were injected with TCR-transduced HSCs three months prior to analysis. Mouse 3 and 4 are replicates, mouse 5 and 6 are replicates. Mouse 2 has no replicate because wtTCR-transduced HSCs did not engraft in Mouse 1 (not shown). Results are from a single experiment.
Figure 7 with 1 supplement
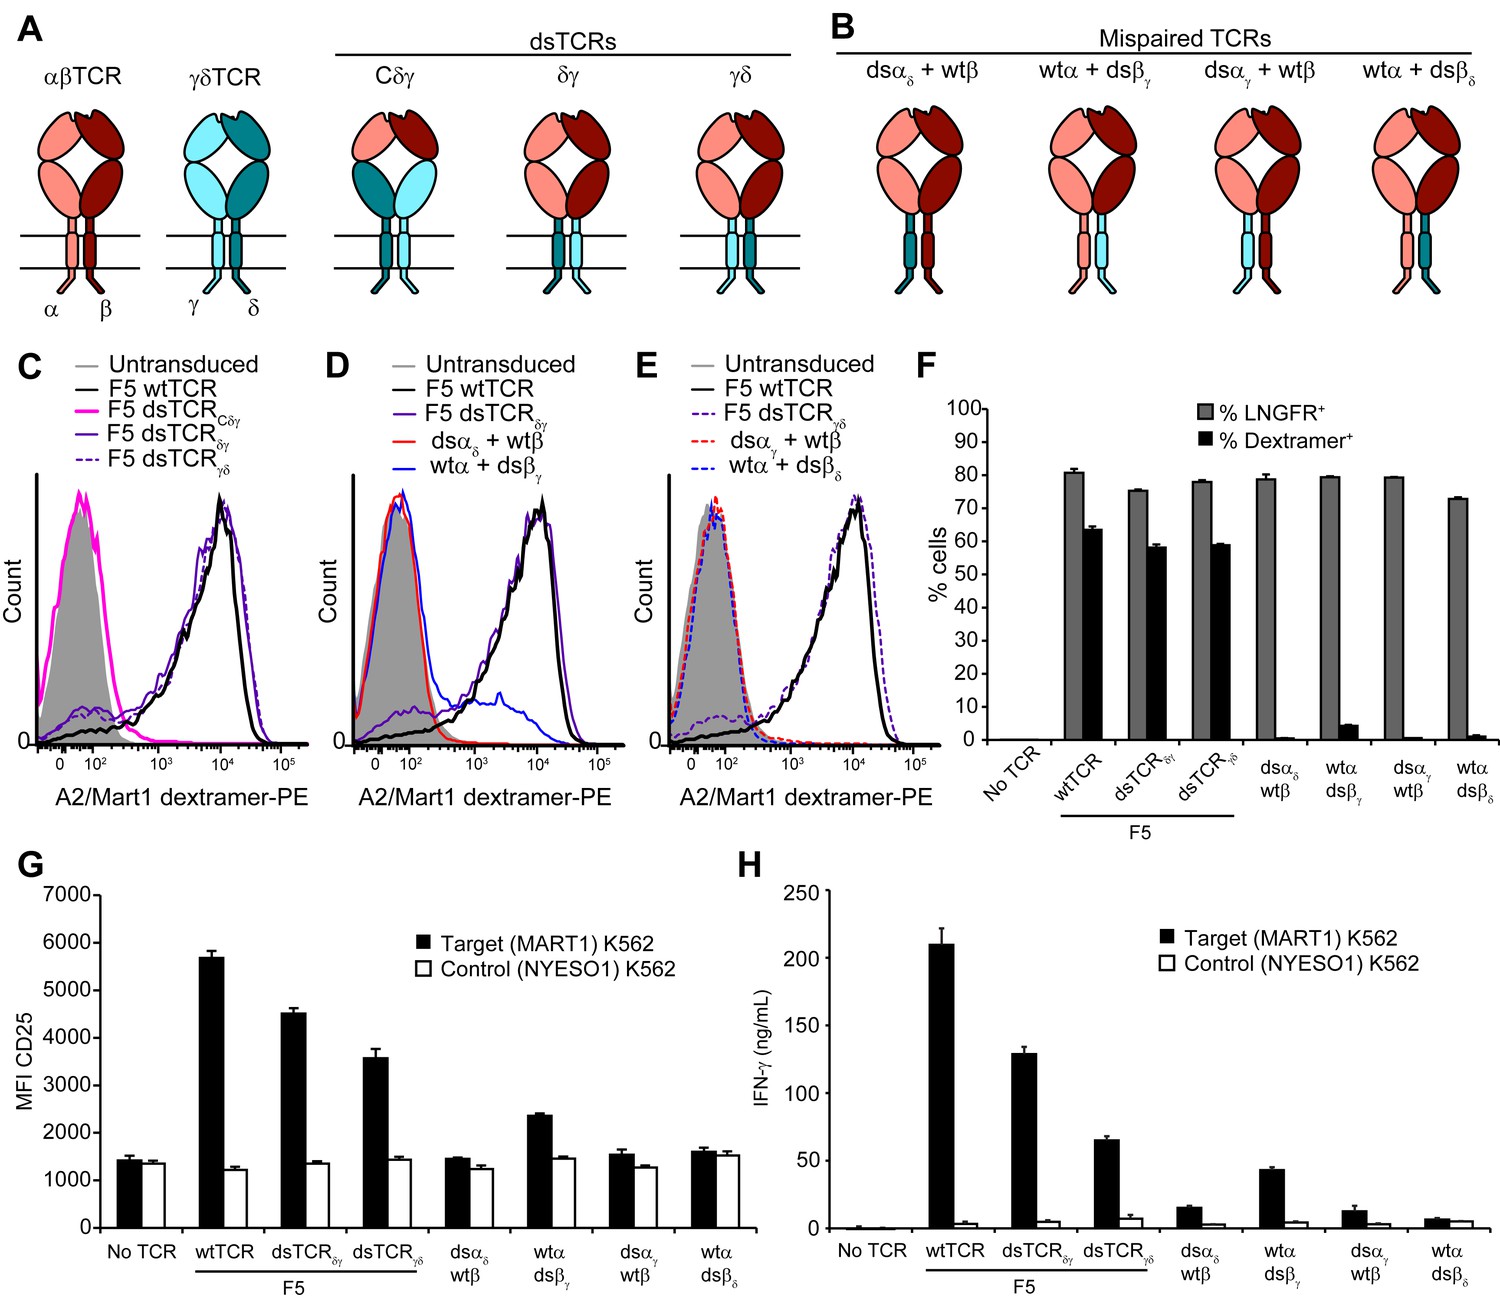
Substitution of αβ TCR constant domains with corresponding domains from γδ TCRs prevents TCR mispairing.
(A) Schematic of αβ/γδ chimeric TCR architectures. Domains are swapped following the V domains (dsTCRCδγ) or C domains (dsTCRδγ and dsTCRγδ). (B) Schematic of simulated mispaired constructs, in which αβ and γδ constant domains are juxtaposed. Such mispairing is expected to be unproductive because αβ and γδ constant domains do not interact. (C-E) Flow cytometry histograms comparing peptide-MHC multimer binding by Jurkat T cells transduced with (C) F5 wtTCR or αβ/γδ chimeric dsTCR constructs, (D) F5 wtTCR, F5 dsTCRδγ and constructs simulating mispairing between these, or (E) F5 wtTCR, F5 dsTCRγδ and constructs simulating mispairing between these. Histograms are representative of triplicate results from 2 independent experiments. (F) Flow cytometric measurement of percent of dextramer-binding TCR and LNGFR expressed on the surface of transduced primary human T cells. LNGFR is an independent transduction marker expressed from the same vector as TCR. (G) Flow cytometric measurement of CD25 expressed on the T cell surface and (H) ELISA measurement of secreted IFN-γ from TCR-transduced primary human T cells following 48 hr coincubation with cognate or control antigen-expressing K562 target cells. For panels (F-H), means ± SD for 3 technical replicates are shown.
Figure 7—figure supplement 1
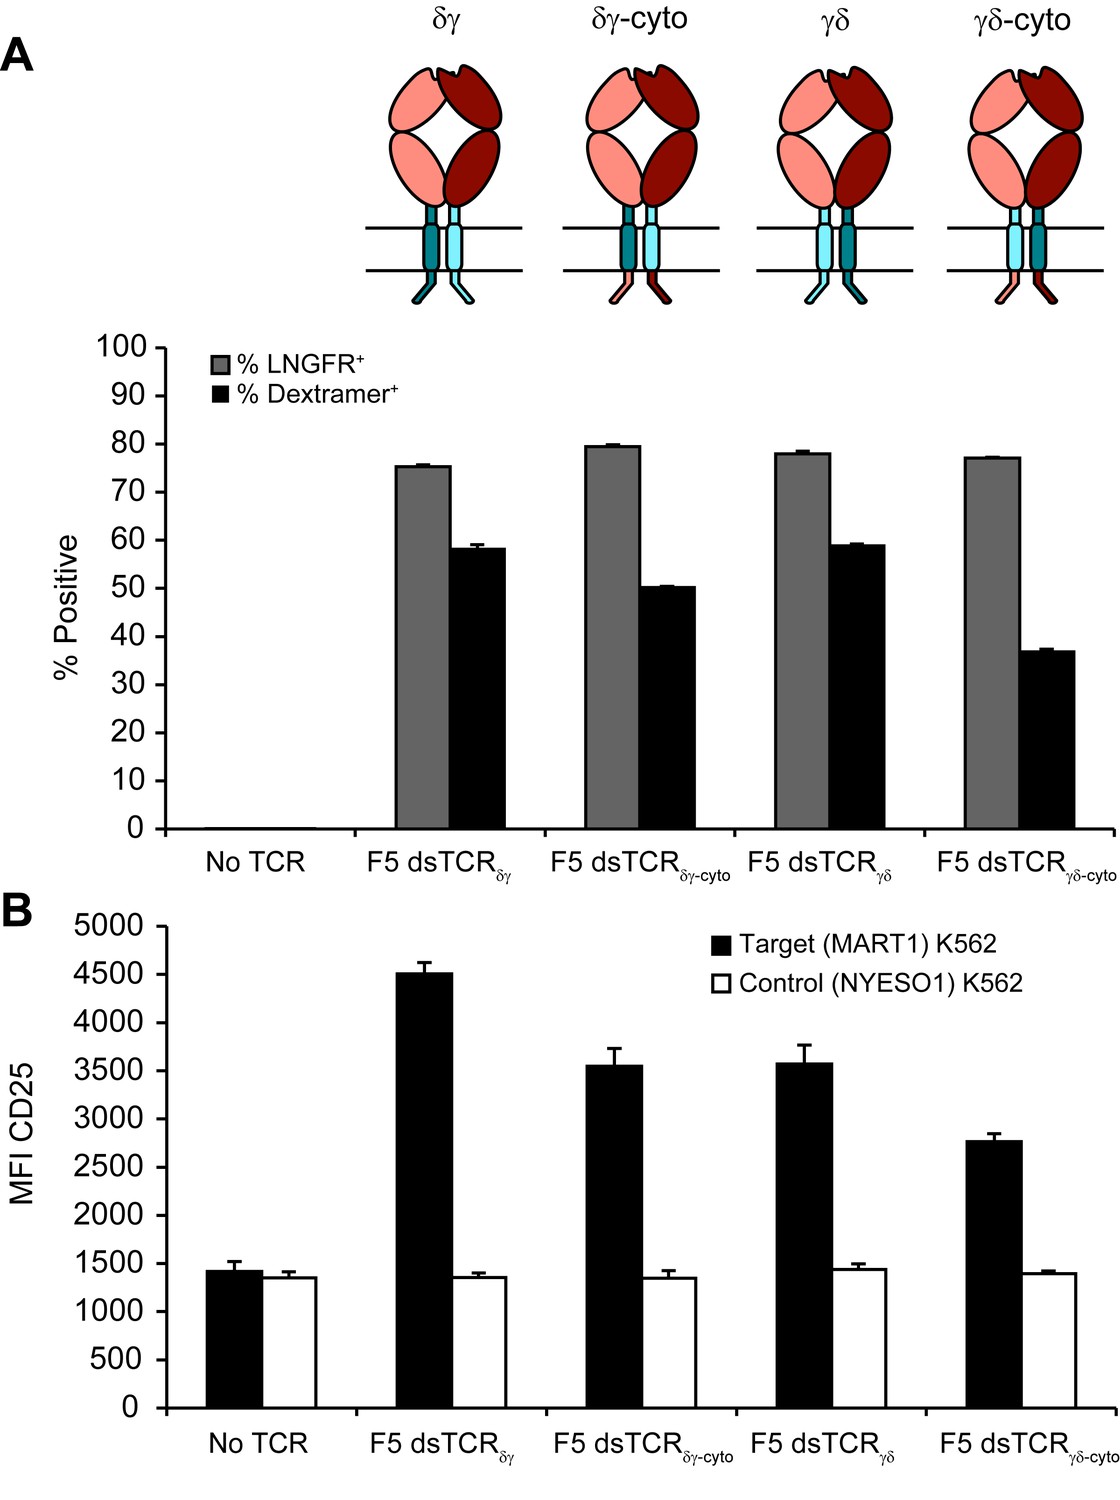
Chimeric αβ/γδ dsTCRs function similarly with cytoplasmic domains derived from αβ or γδ TCRs.
(A) Flow cytometric measurement of dextramer-binding TCR and LNGFR expressed on the surface of transduced primary human T cells. LNGFR is an independent transduction marker expressed from the same vector as TCR. Schematics of constructs are above corresponding data. Colors used in schematic correspond to those in Figure 6. (B) Flow cytometric measurement of CD25 expressed on the T cell surface from TCR-transduced primary human T cells following 48 hr coincubation with cognate or control antigen-expressing K562 target cells. For both panels, means ± SD for 3 technical replicates are shown.
Download links
A two-part list of links to download the article, or parts of the article, in various formats.
Downloads (link to download the article as PDF)
Open citations (links to open the citations from this article in various online reference manager services)
Cite this article (links to download the citations from this article in formats compatible with various reference manager tools)
Domain-swapped T cell receptors improve the safety of TCR gene therapy
eLife 5:e19095.
https://doi.org/10.7554/eLife.19095


