Motility precedes egress of malaria parasites from oocysts
- Heidelberg University Medical School, Germany
Figures
Figure 1

The thrombospondin-related protein 1 (TRP1) shares distinct domains with TRAP-family proteins, belongs to the family of TRAP-like proteins and is present in all Plasmodium species.
(A) TSR-containing proteins in Plasmodium. TRAP-family proteins are marked with a red bar, whereas TRAP-related proteins are indicated by a green bar and other TSR-containing proteins by a blue bar. TRP1 is encircled by a dashed line (top right). Thrombospondin repeats are shown as blue boxes (labeled with T) and Von Willebrandt factor like A-domains are depicted as red hexagons (labeled with A). Signal peptides are shown as black boxes and transmembrane domains as light green ovals. CSP possesses a GPI-anchor (grey triangle), whereas SPATR harbors an EGF-domain (white box). Conserved tryptophans are indicated with a W. Protein schemes are not drawn to scale and amino acid numbers refer to P. berghei proteins. (B) Protein model of PbTRP1 (PBANKA_0707900; 896 amino acids) in comparison to PbTRAP (PBANKA_1349800, 606 amino acids, not to scale). Both proteins contain a signal peptide (SP), a thrombospondin type-I repeat (TSR), a transmembrane domain (TMD) and a cytoplasmic tail domain (CTD), but TRP1 lacks the conserved tryptophan (W) that is typically found at the C-terminus of TRAP-family proteins. Instead of the Von Willebrandt factor-like A-domain in TRAP, TRP1 contains a long N-terminal extension. (C) Multiple sequence alignment of the PbTRP1 TSR with TSRs from the TRAP-family (PbTRAP, TgMIC2, PbCTRP, PbS6 and PbTLP) and other TSR-containing proteins (PbTRAMP and PbCSP). (D) Length (in amino acids) and isoelectric point (pI) of the CTDs of TRP1 and TRAP from different Plasmodium species.
Figure 2 with 3 supplements
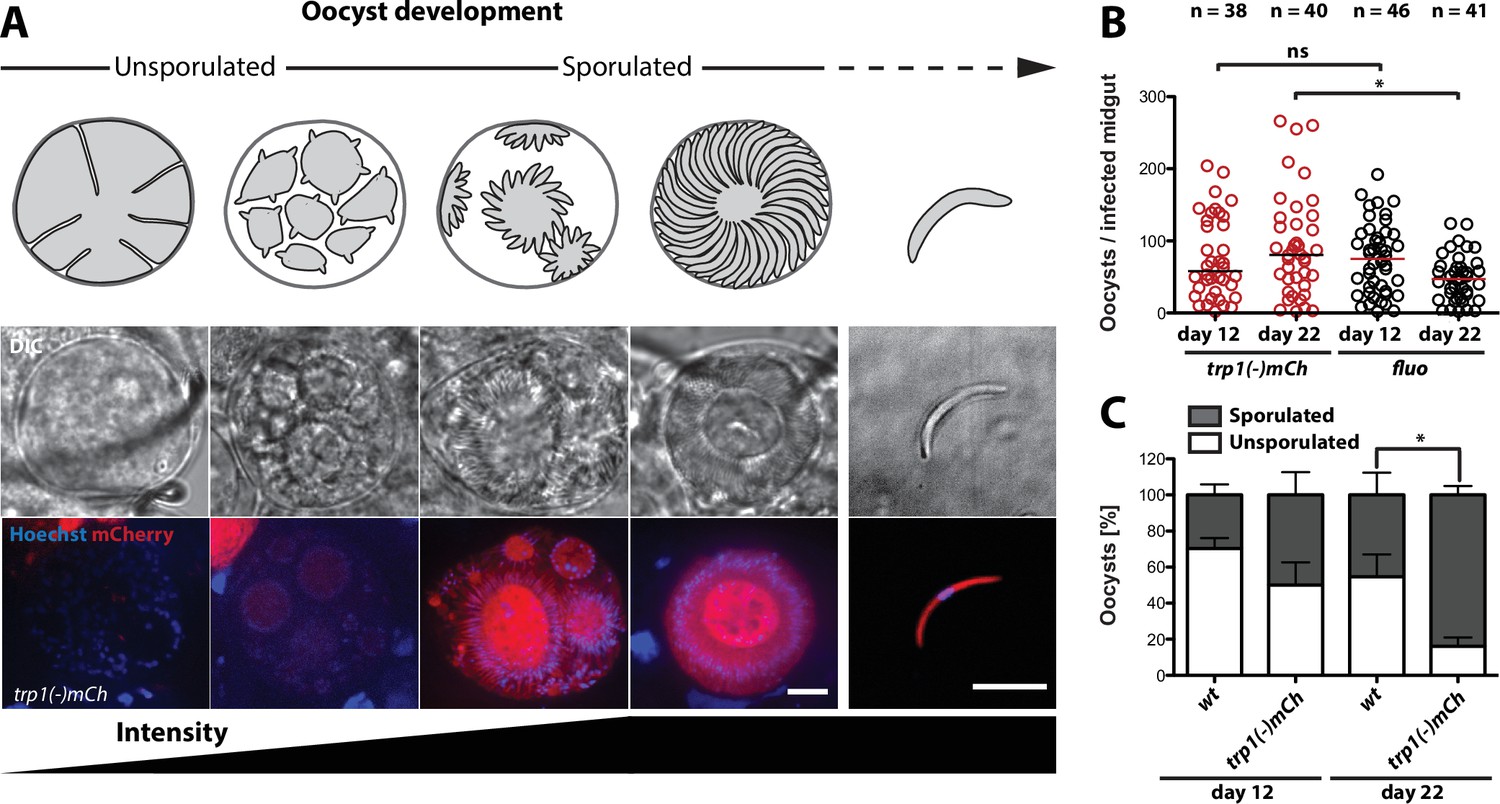
trp1(-) oocysts sporulate normally and persist in a sporulated state.
(A) Expression of mCherry in trp1(-)mCh parasites was only observed in sporulating oocysts and sporozoites. The developmental stage of the oocysts is depicted schematically above the images, while the increase in fluorescence intensity is schematically indicated below. Strong mCherry expression was only observed in budding or mature oocysts. Scale bar: 10 µm. (B) Oocyst numbers of infected midguts for trp1(-)mCh and wild-type parasites at day 12 and day 22 post-infection. * depicts p<0.05; one-way ANOVA followed by a Kruskal-Wallis test. Horizontal bars indicate the median. Data were generated from two (trp1(-)mCh) and three (fluo) different feeding experiments, respectively. (C) Percentages of sporulated and unsporulated oocysts in trp1(-)mCh and wild-type infected midguts at 12 and 22 days post infection. * depicts p<0.05; one-tailed Student's t-test. The mean and the SEM are shown. Data were generated from three different feeding experiments.
Figure 2—figure supplement 1
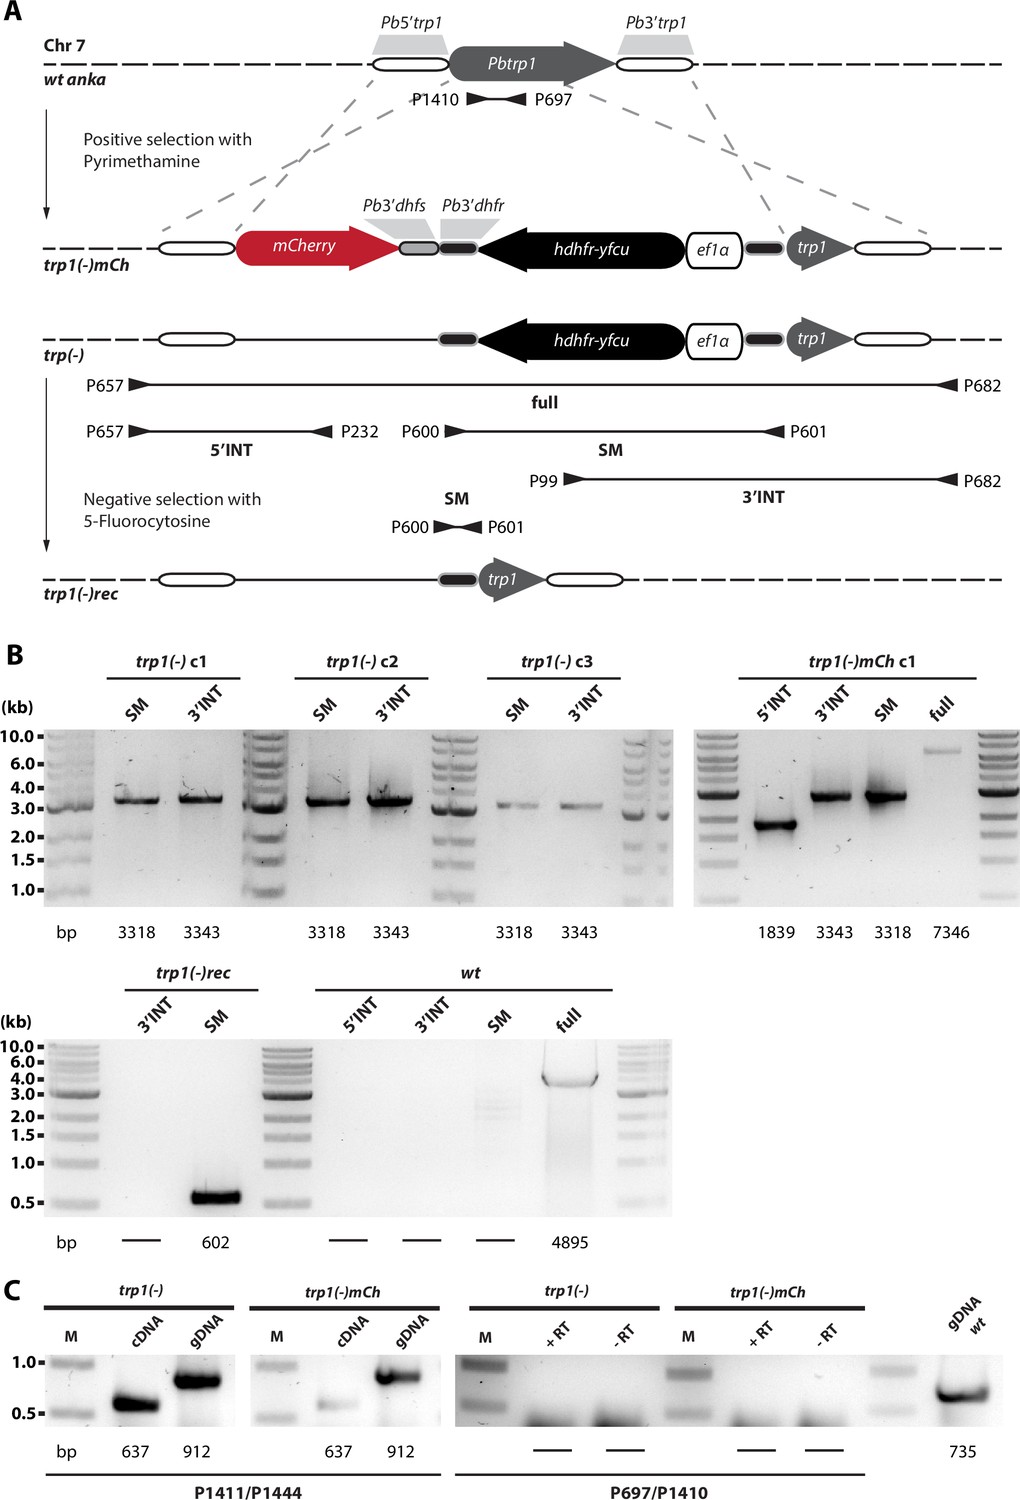
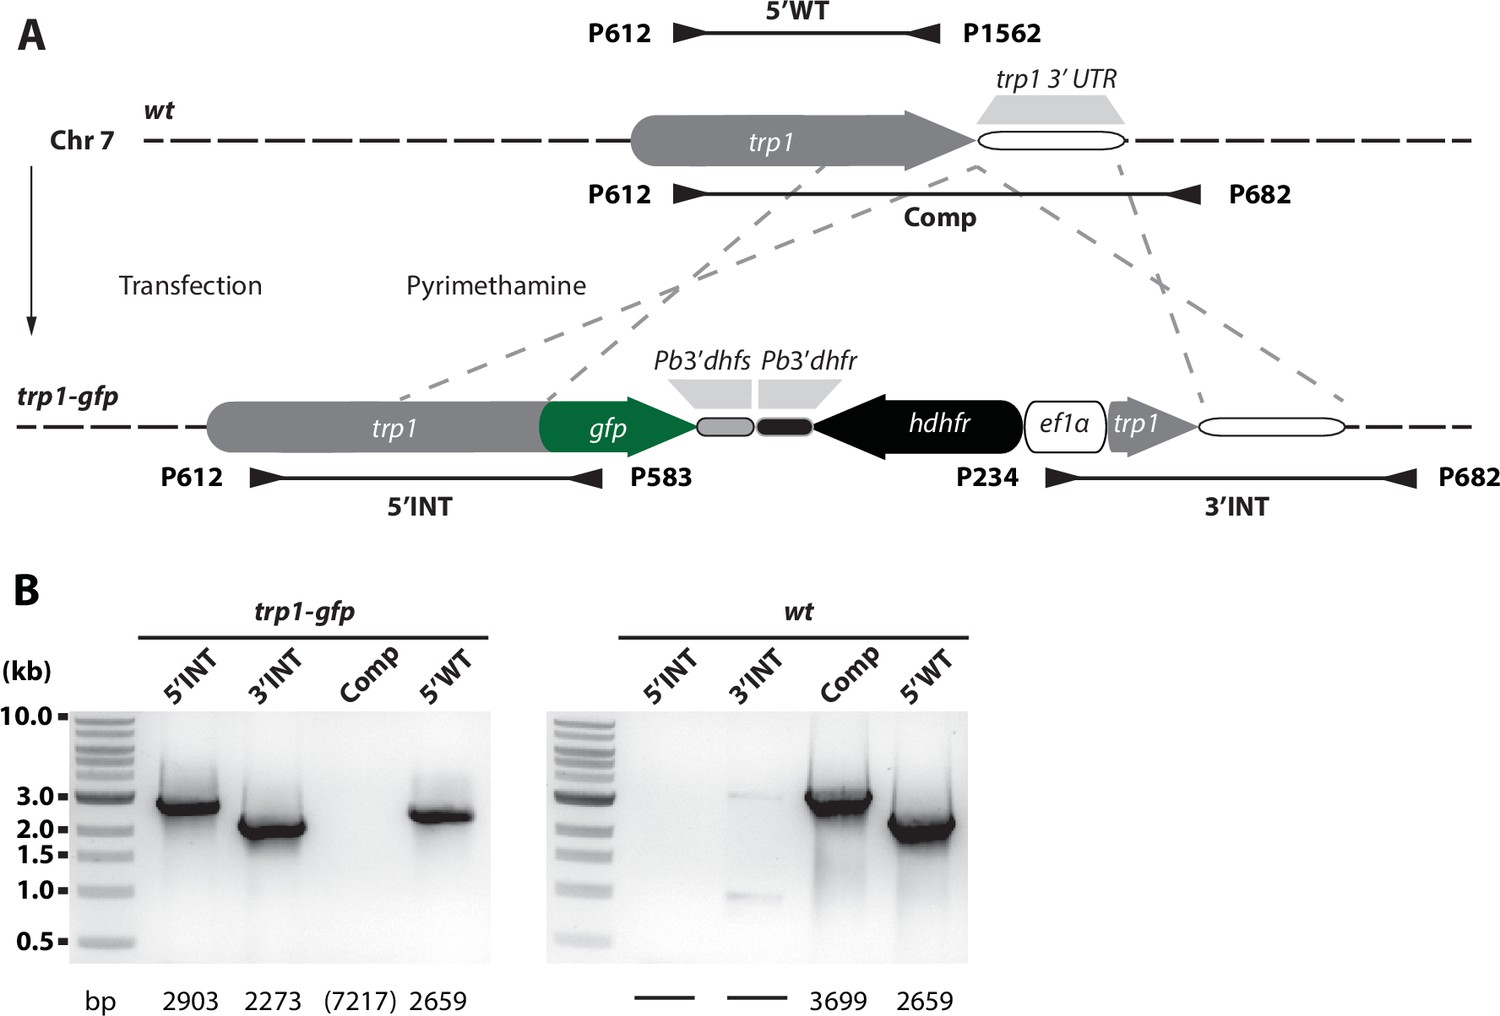
Generation and PCR analysis of trp1(-), trp1(-)mCh and trp1(-)rec parasites.
(A) Schematic representation of the strategy for gene deletion and marker recycling via negative selection. Two different trp1(-) lines were generated by independent transfection of two different constructs into wild-type (wt) P. berghei strain ANKA parasites. The vector contained the positive-negative selection marker hdhfr-yfcu. The marker gene was flanked by ~1 kb sequences upstream and downstream of the open reading frame of trp1 to generate a knockout line by double crossover homologous recombination (trp1(-)). In addition, a second vector was generated to visualize trp1 promoter activity in vivo via expression of mCherry (trp1(-)mCh). Location of primers and the approximate length of the PCR fragments used for genotyping are indicated by arrows and lines below the scheme. (B) PCR analysis of clonal trp1(-) and trp1(-)mCh parasites. Note the shift in size of the complete locus (full) between trp1(-)mCh and wt. The expected sizes of the PCR products are indicated below. PCR analysis of negatively selected knockout parasites trp1(-)rec revealed loss of the selection cassette. Note the shift in size of the PCR product for the selection marker (SM) before and after negative selection. (C) RT-PCR with cDNA generated from trp1(-) and trp1(-)mCh midgut sporozoites. The PCR with the primers P1411/P1444 shows the presence of cDNA indicated by the loss of an intron and the shift in size of α-tubulin I. The PCR with the primers P697/P1410 is specific for trp1. An internal control with gDNA from the P. berghei ANKA strain is also shown to verify that the PCR worked. See also Figure 5.
Figure 2—figure supplement 2
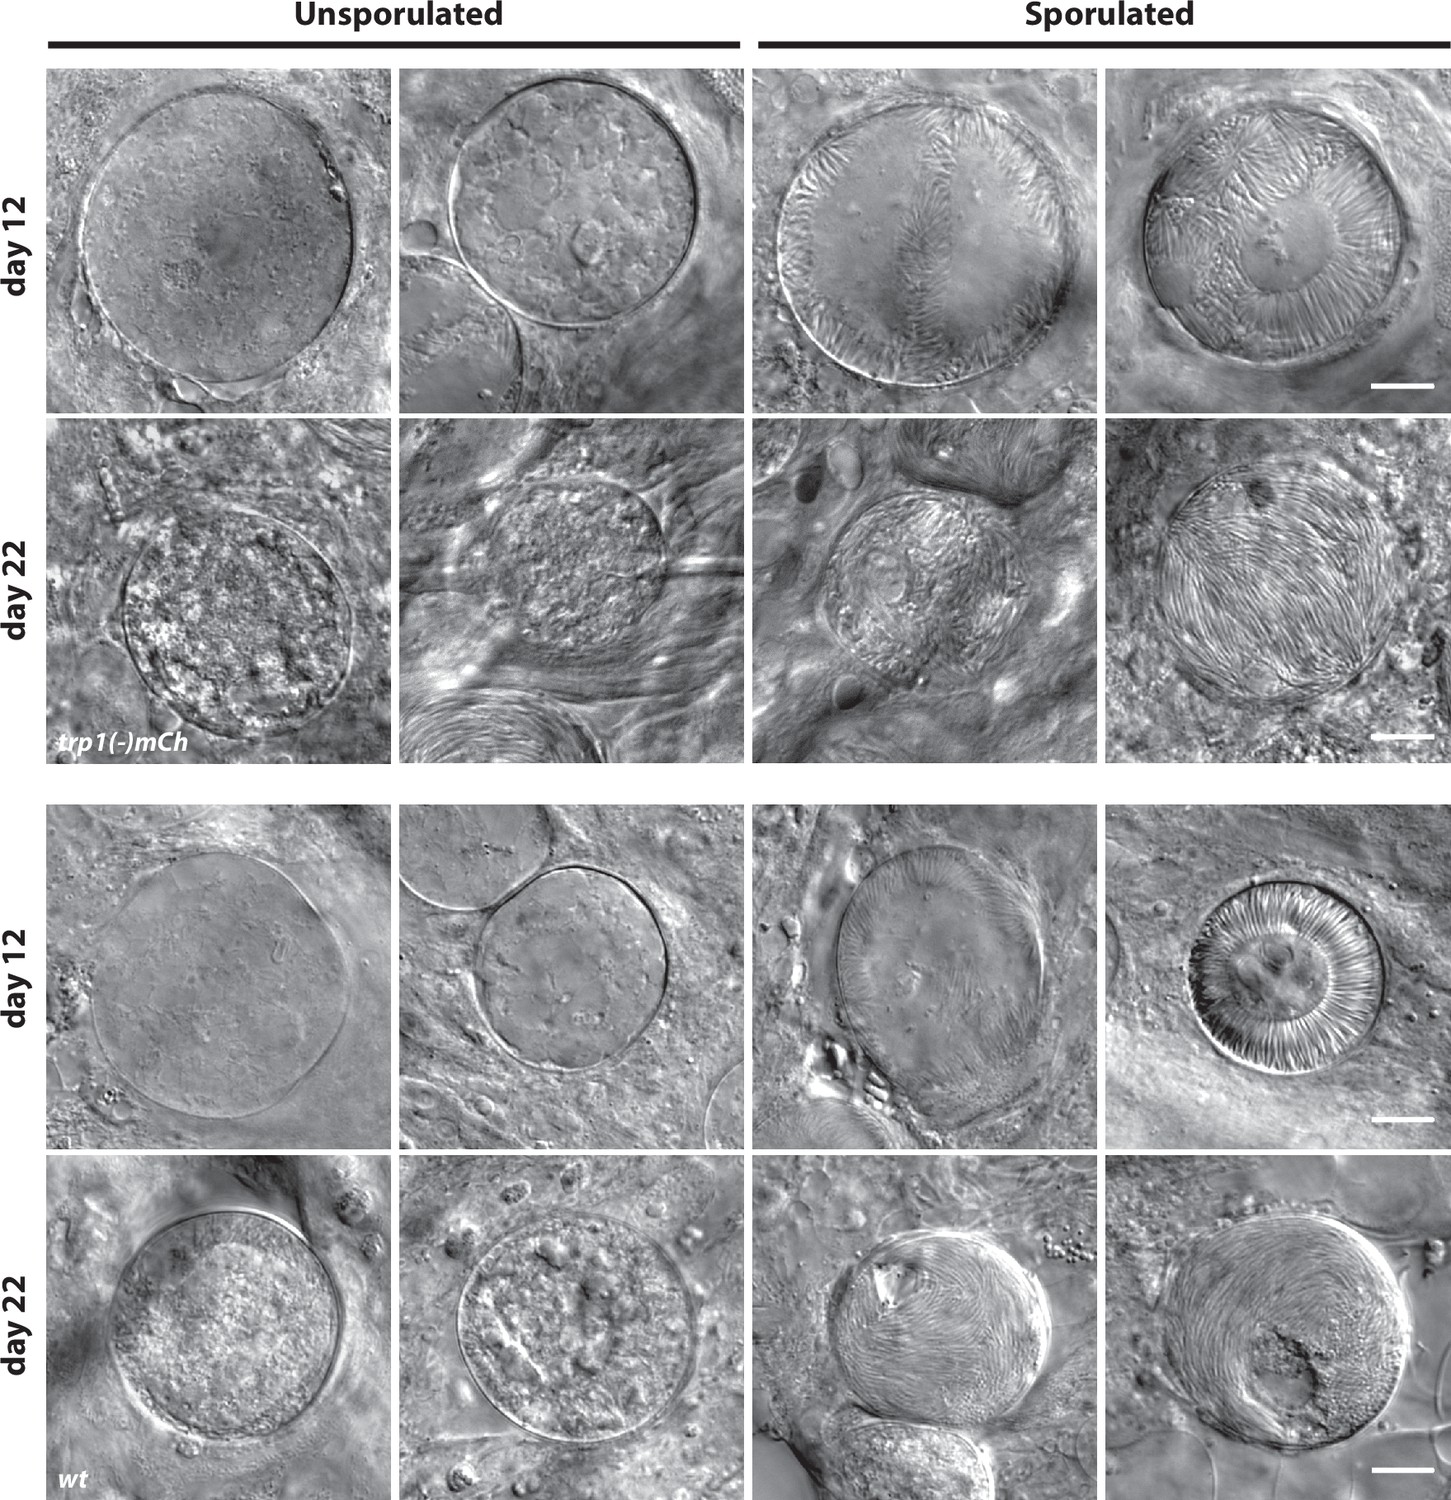
Classification of oocysts as unsporulated or sporulated.
Examples of unsporulated and sporulated trp1(-)mCh and wt oocysts at day 12 and day 22. Note that oocysts with budding sporozoites as well as oocysts with completely developed sporozoites were classified as sporulated. Scale bar: 10 µm.
Figure 2—figure supplement 3
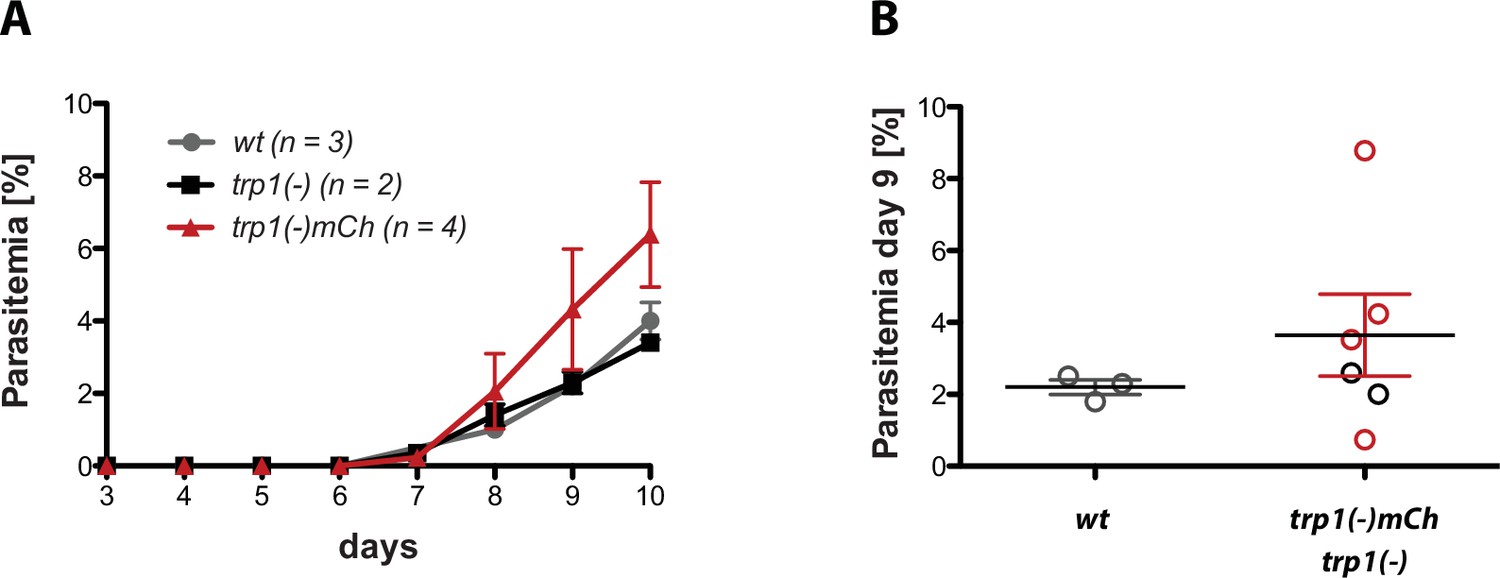
trp1(-) and trp(-)mCh midgut sporozoites are infective to mice if intravenously injected.
(A) Midgut sporozoites of trp1(-) (400,000), wt (500,000) and trp1(-)mCh (500,000) were injected intravenously into four mice each. Parasitemia was monitored for 10 days post infection. Shown are the mean and SEM of four (trp1(-)mCh), two (trp1(-)) and three (wt) mice, which became blood-stage patent. (B) Parasitemia at day 9 post infection of the wt- and trp1(-)mCh-infected mice represented in (A).
Figure 3 with 1 supplement
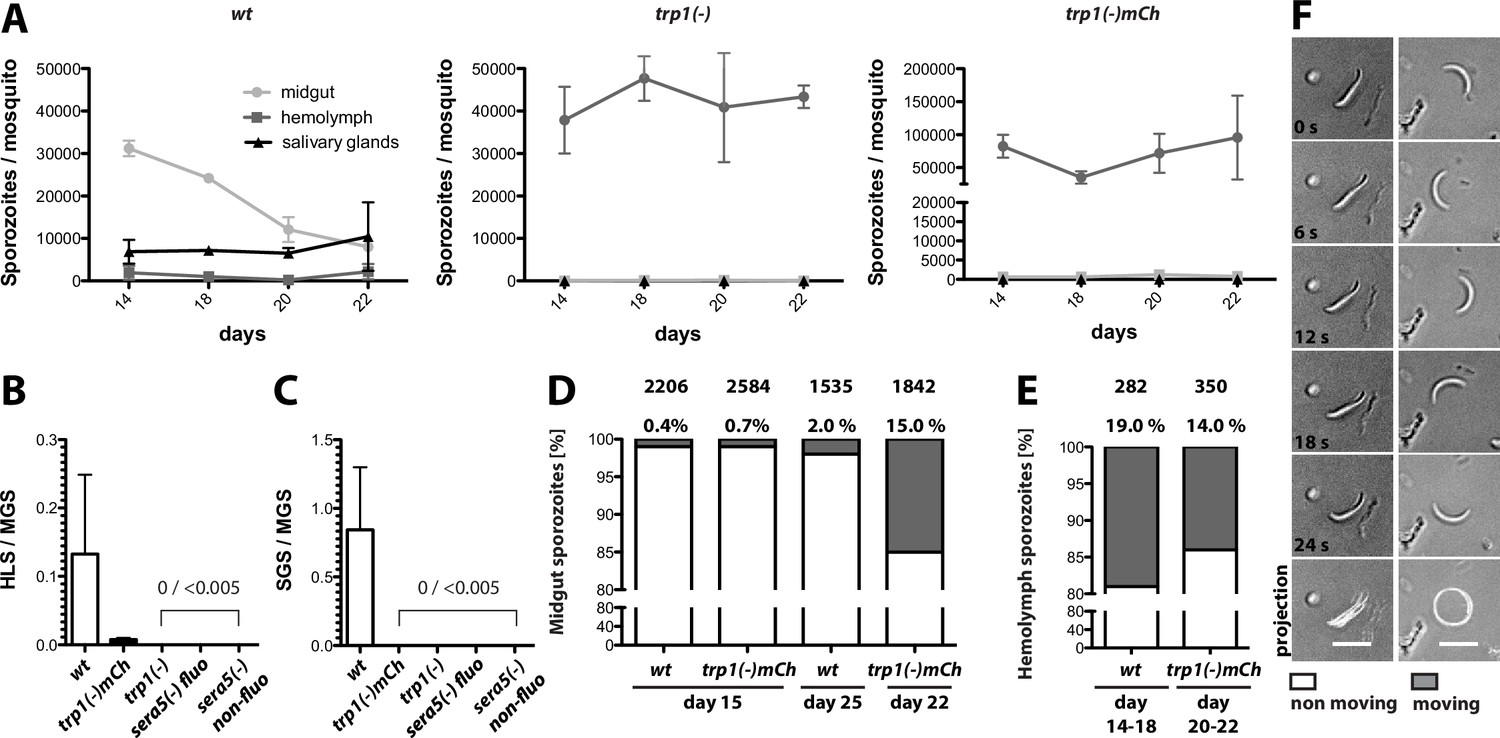
trp1(-) sporozoites are impaired in oocyst egress and salivary gland invasion but show normal gliding motility in vitro.
(A) Numbers of wild-type, trp1(-) and trp1(-)mCh sporozoites in midguts, hemolymph and salivary glands over time. Shown are one to three countings per time point from one to three different feeding experiments. (B) Ratio of hemolymph (HLS) to midgut (MGS) sporozoites in wild-type-, trp1(-)- and trp1(-)mCh-infected mosquitoes. As negative control for a parasite that is not able to egress, a fluorescent and a non-fluorescent sera5(-) line were used. The bar represents the mean of four independent countings (ten mosquitoes each) at days 14, 17/18, 20 and 22 post infection of a selected feeding experiment. Error bars represent SEM. For absolute numbers see Table 2. (C) Ratio of salivary gland (SGS) to midgut (MGS) sporozoites corresponding to (B). The bar represents the mean, and error bars reflect SEM. For absolute numbers see Table 2. (D) Percentage of moving (dark) and non-moving (white) midgut sporozoites of wild-type and trp1(-)mCh at the indicated days post infection. Sporozoites were classified as moving if they were able to glide for at least one full circle within five minutes. All sporozoites that behaved differently were classified as non-moving. The number of investigated sporozoites is indicated on top of the bars. (E) Percentage of moving (dark) and non-moving (white) hemolymph sporozoites of wild-type and trp1(-)mCh. (F) Example of a non-moving (floating, left column) and a moving (circular movement, right column) trp1(-)mCh sporozoite isolated from the hemolymph. Scale bar: 10 µm.
Figure 3—figure supplement 1
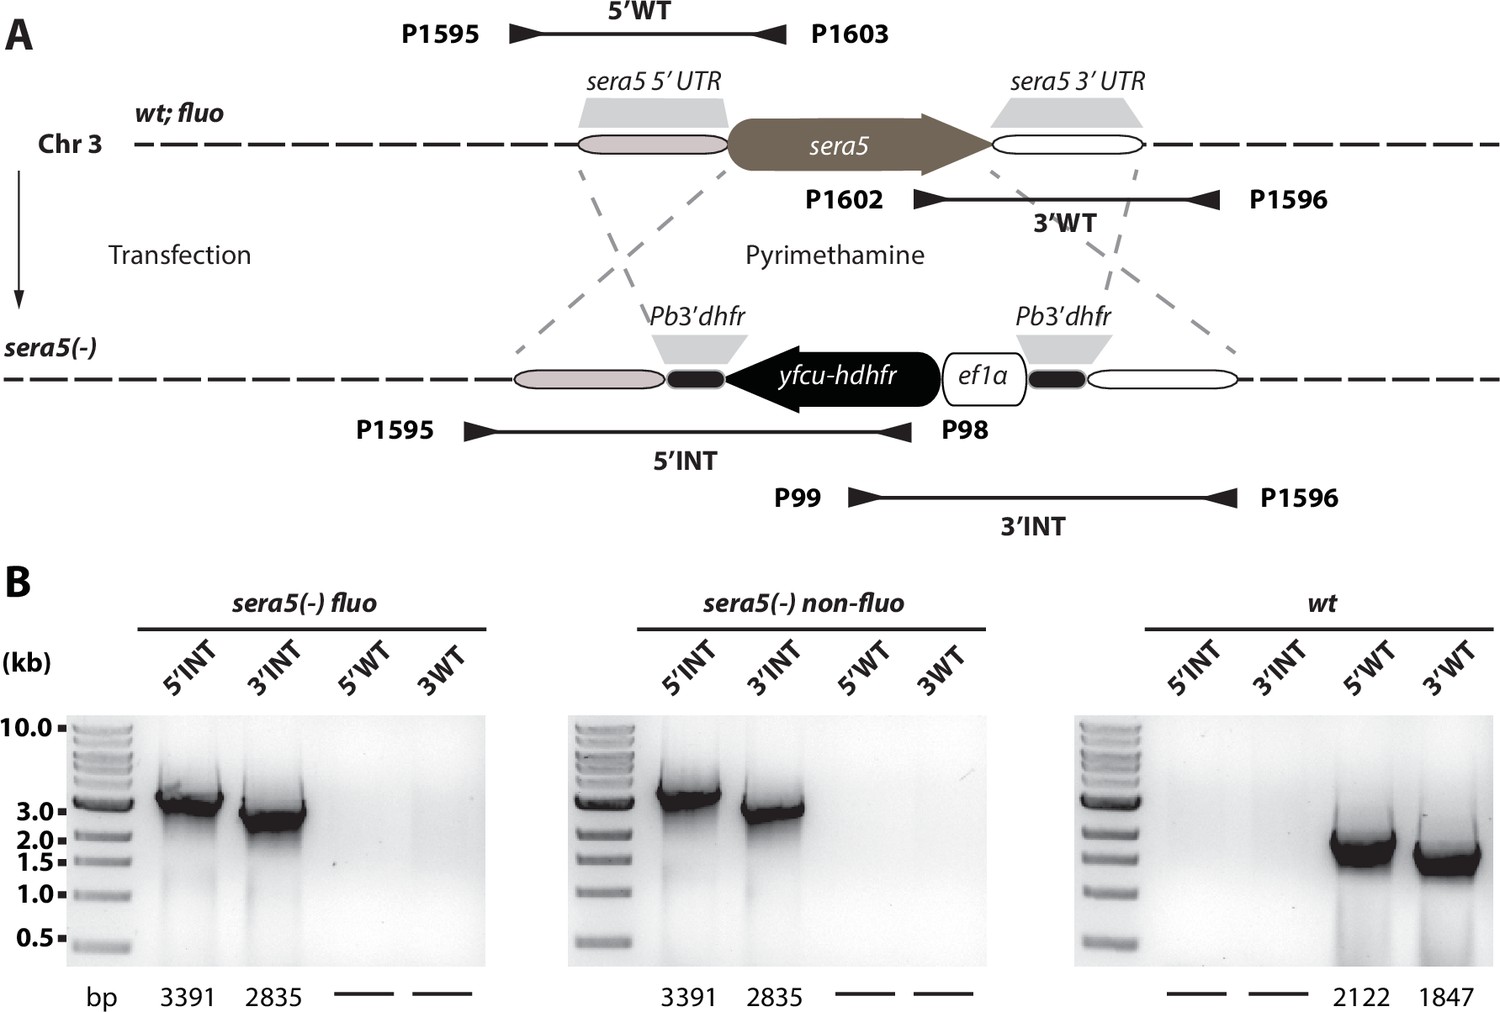
Generation and PCR analysis of sera5(-) fluo and sera(5) non-fluo parasites.
Schematic representation of the sera5 knockout strategy. (A) Two different sera5(-) lines were generated by two independent transfections, one into wt and one into the fluorescent-selection marker-free line fluo. The vector contained the positive-negative selection marker hdhfr-yfcu. The marker gene was flanked by ~1 kb sequences upstream and downstream of the open reading frame of sera5 to generate a knockout line by double crossover homologous recombination. Positive transfections gave rise to two different lines named sera5(-) fluo and sera5(-) non-fluo. The location of primers and the approximate length of PCR fragments used for genotyping are indicated by arrows and lines below the scheme. (B) PCR analysis of clonal sera5(-) fluo and sera5(-) non-fluo parasites. The expected sizes of PCR products are indicated below the gel images.
Figure 4 with 2 supplements
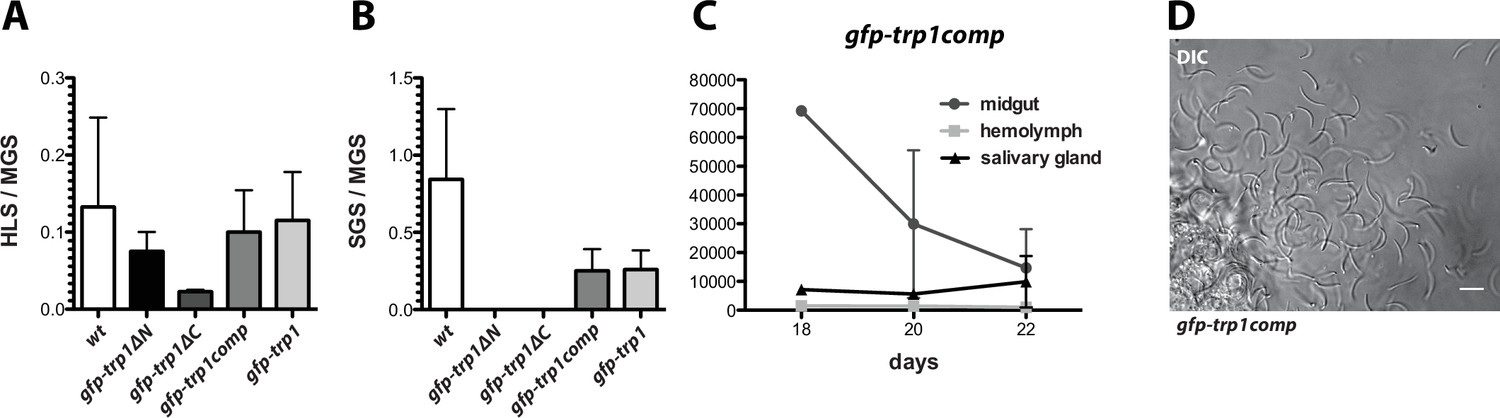
Complementation of trp1(-) parasites with full-length but not truncated TRP1 restores the wild-type phenotype.
(A) Ratio of hemolymph sporozoites (HLS) to midgut sporozoites (MGS) and (B) of salivary gland sporozoites (SGS) to midgut sporozoites (MGS) for gfp-trp1∆N, gfp-trp1∆C gfp-trp1comp and gfp-trp1 lines in comparison to wild-type (wt) parasites. The bar charts show the mean of four independent countings (10 mosquitoes each) at days 14, 18, 20 and 22 post infection of a selected feeding experiment. For absolute numbers see Table 2. Error bars represent SEM. (C) Sporozoites of gfp-trp1comp in midguts, salivary glands and hemolymph counted over time; 1–2 countings per timepoint. (D) Mechanically ruptured salivary gland releasing gfp-trp1comp sporozoites. Scale bar: 10 µm.
Figure 4—figure supplement 1
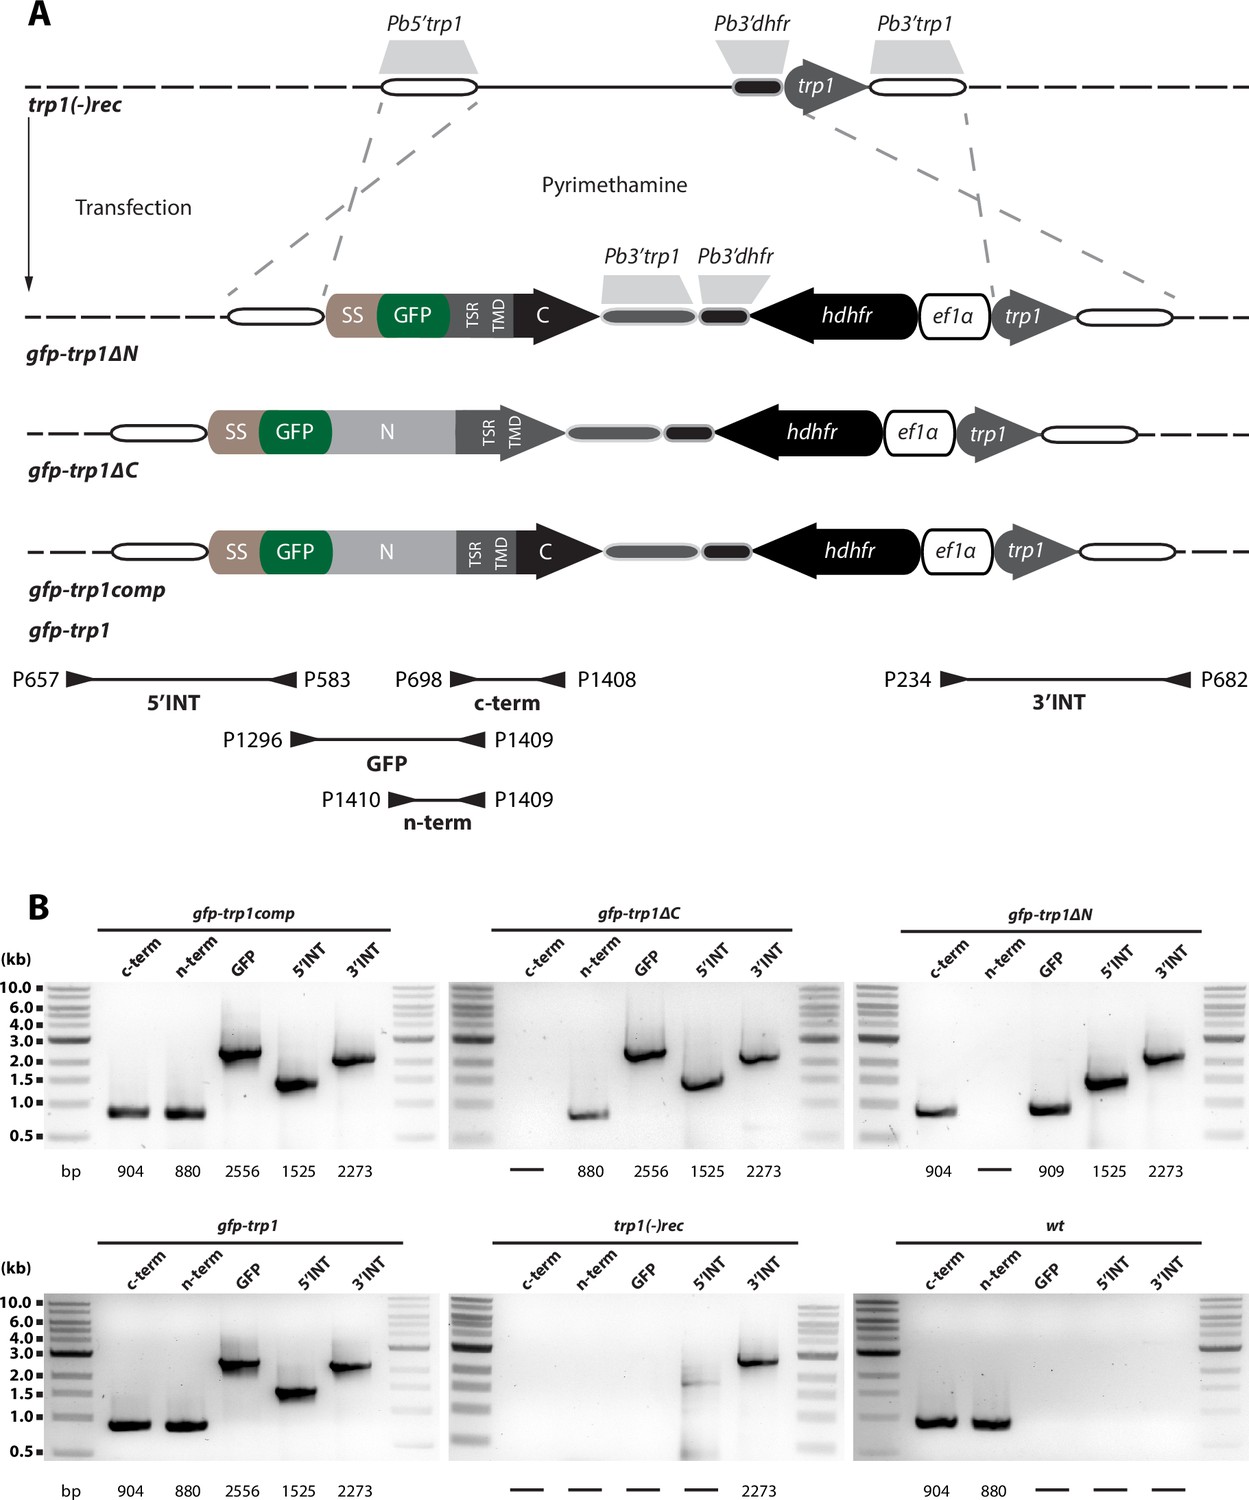
Generation and PCR analysis of gfp-trp1comp, gfp-trp1, gfp-trp1∆N and gfp-trp1∆C parasites.
Schematic representation of the complementation strategy with sequences encoding full-length and truncated TRP1 proteins. (A) Complementation was performed with three different constructs (gfp-trp1, gfp-trp1∆N and gfp-trp1∆C). All constructs contained the positive selection marker hdhfr under control of the ef1α promoter and a GFP gene at the N-terminal end, between the sequence encoding the signal peptide and the remaining trp1 ORF. The location of primers and the length of PCR fragments used for genotyping are indicated by arrows and black lines below the scheme. Approximate sizes of the PCR products are indicated below the images. (B) PCR analysis of clonal lines revealed correct integration of the designed constructs. To probe for the absence of deleted sequences, two PCRs specific for the N- and C-terminus of trp1 (n-term and c-term) were performed. The PCR termed GFP amplifies a sequence between GFP and trp1 to test the fusion of both sequences. For comparison, the PCRs for both recipient lines trp1(-)rec and wt are shown.
Figure 4—figure supplement 2
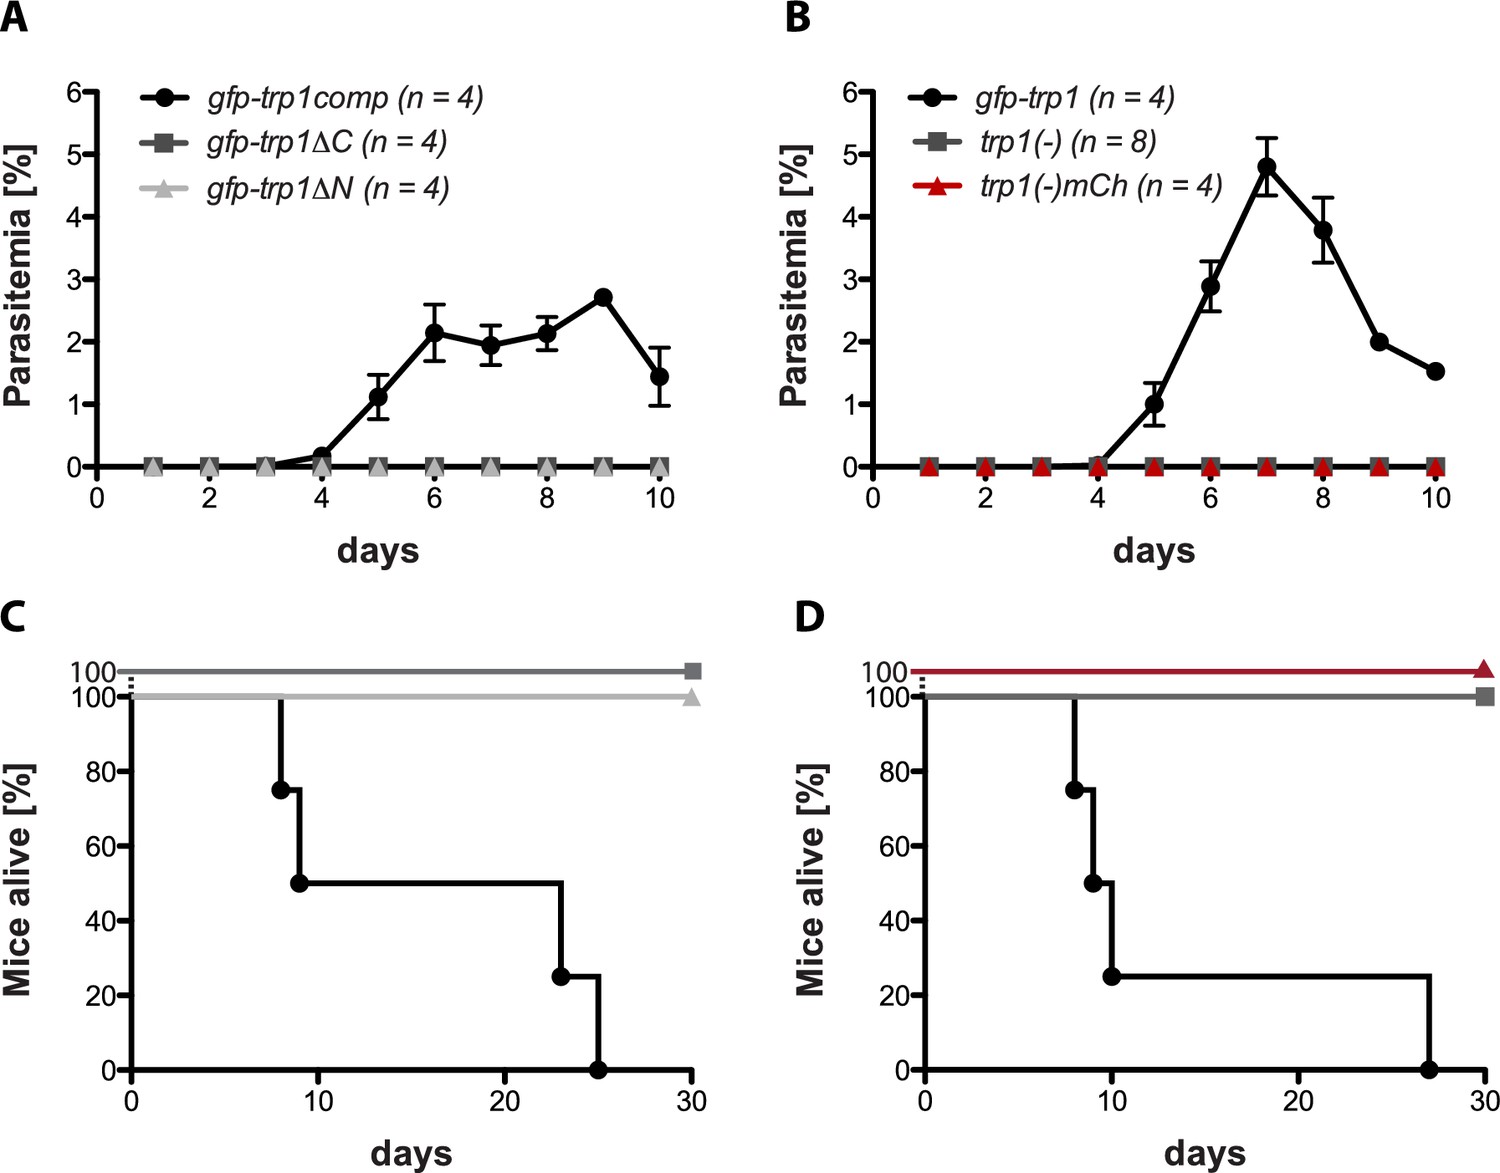
TRP1 is essential for transmission by infected mosquitoes.
(A,B) Parasitemia in mice exposed to ten mosquitoes infected (A) with gfp-trp1:comp, gfp-trp1∆C and gfp-trp1∆N and (B) with trp1(-), trp1(-)mCh and gfp-trp1. Blood stage parasites were monitored for 10 days post infection. The graphs show the mean and the standard error of the mean (SEM) of the parasitemia for all infected mice per group (n). (C,D) The survival of mice infected with gfp-trp1comp, gfp-trp1∆C and gfp-trp1∆N (corresponding to (A)) and with trp1(-), trp1(-)mCh and gfp-trp1 (corresponding to (B)). The viability of all mice was monitored for 30 days post infection.
Figure 5 with 1 supplement
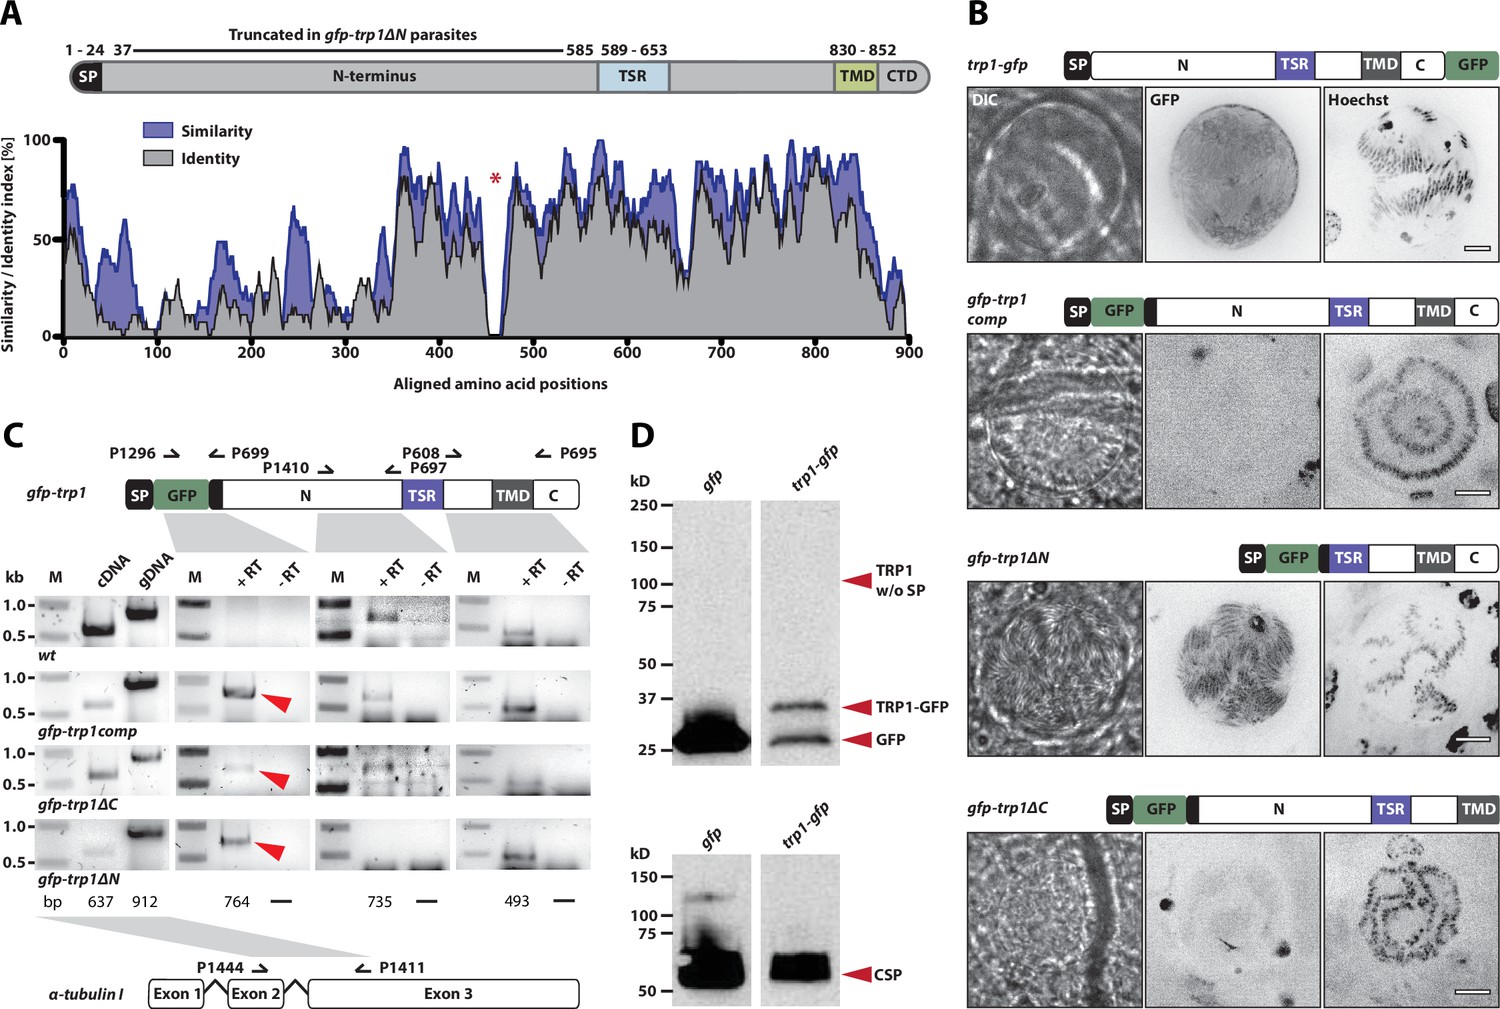
TRP1 is post-translationally processed.
(A) Appearance of conserved residues (identity) and residues with similar charge (similarity) in PfTRP1, PvTRP1 and PkTRP1 in reference to PbTRP1. The graph corresponds to the protein model of TRP1 shown above. The gap marked by a red asterisk indicates an insertion in the sequence that is unique to PbTRP1. Note the less conserved nature of part of the N-terminus. (B) Localization of TRP1-GFP, GFP-TRP1comp, GFP-TRP1∆N and GFP-TRP1∆C in oocysts 11–14 days post infection. Nuclear DNA is stained with Hoechst. Scale bar: 10 µm. See also Video 1. (C) RT-PCR of cDNA generated from midgut sporozoites. Purity of cDNA was tested with α-tubulin I primers amplifying a sequence from exon 2 to exon 3 (left). Splicing of the intron in-between the two exons resulted in a smaller PCR fragment compared to the gDNA. A gfp:trp1 fusion transcript could be detected in gfp-trp1comp, gfp-trp1∆N, and gfp-trp1∆C (indicated by red arrowheads) but not in wt sporozoites. In addition, two PCRs were performed to detect two different parts of the trp1 transcript. The gene and protein models shown below and above the images are not drawn to scale. (D) Western blot with 100,000 trp1-gfp and csgfp midgut sporozoites. The two lanes below show as loading control CSP, while the bands above show signals for GFP. Sporozoites expressing TRP1-GFP show a band at ~26 kDa that corresponds to free GFP and a second band at ~35 kDa that corresponds to GFP fused to the C-terminus and the transmembrane domain of TRP1. The predicted size of untagged TRP1 after cleavage of the signal peptide (~104 kDa) is indicated by a red arrow. Note that the shown images correspond to the same blot that was exposed for the same time. Lanes in-between the shown samples were only removed to simplify the representation.
Figure 5—figure supplement 1
Generation and PCR analysis of parasites expressing TRP1 fused C-terminally to GFP (trp1-gfp).
Schematic representation of the C-terminal tagging strategy for TRP1. (A) The line trp1-gfp was generated by transfection of wt. The vector contained the positive selection marker hdhfr, which was flanked by the C-terminal end of the TRP1 ORF and the TRP1 3’UTR. Integration of this sequence by double crossover homologous recombination resulted in a C-terminal fusion of TRP1 to GFP. Location of primers and approximate length of PCR fragments used for genotyping are indicated by arrows and lines below and above the scheme. (B) PCR analysis of clonal trp1-gfp and wt parasites. The expected sizes of PCR products are indicated below. Note that the PCR for the trp1-gfp line of the complete locus (Comp) could not be amplified, presumably because of the length and the high AT content of the sequence.
Figure 6

TRP1-GFP localizes to the oocyst wall while GFP-TRP1ΔN accumulates in the endoplasmatic reticulum (ER).
(A) Localization of TRP1-GFP in oocysts 11–14 days post infection. Nuclear DNA is stained with Hoechst. The accumulation of GFP at the oocyst wall is indicated by red arrows in the zoomed images. See also Video 1. (B) Localization of GFP-TRP1∆N at 11–14 days post infection. Nuclear DNA is stained with Hoechst. The dashed white line in the zoomed images indicates the oocyst wall.
Figure 7 with 1 supplement
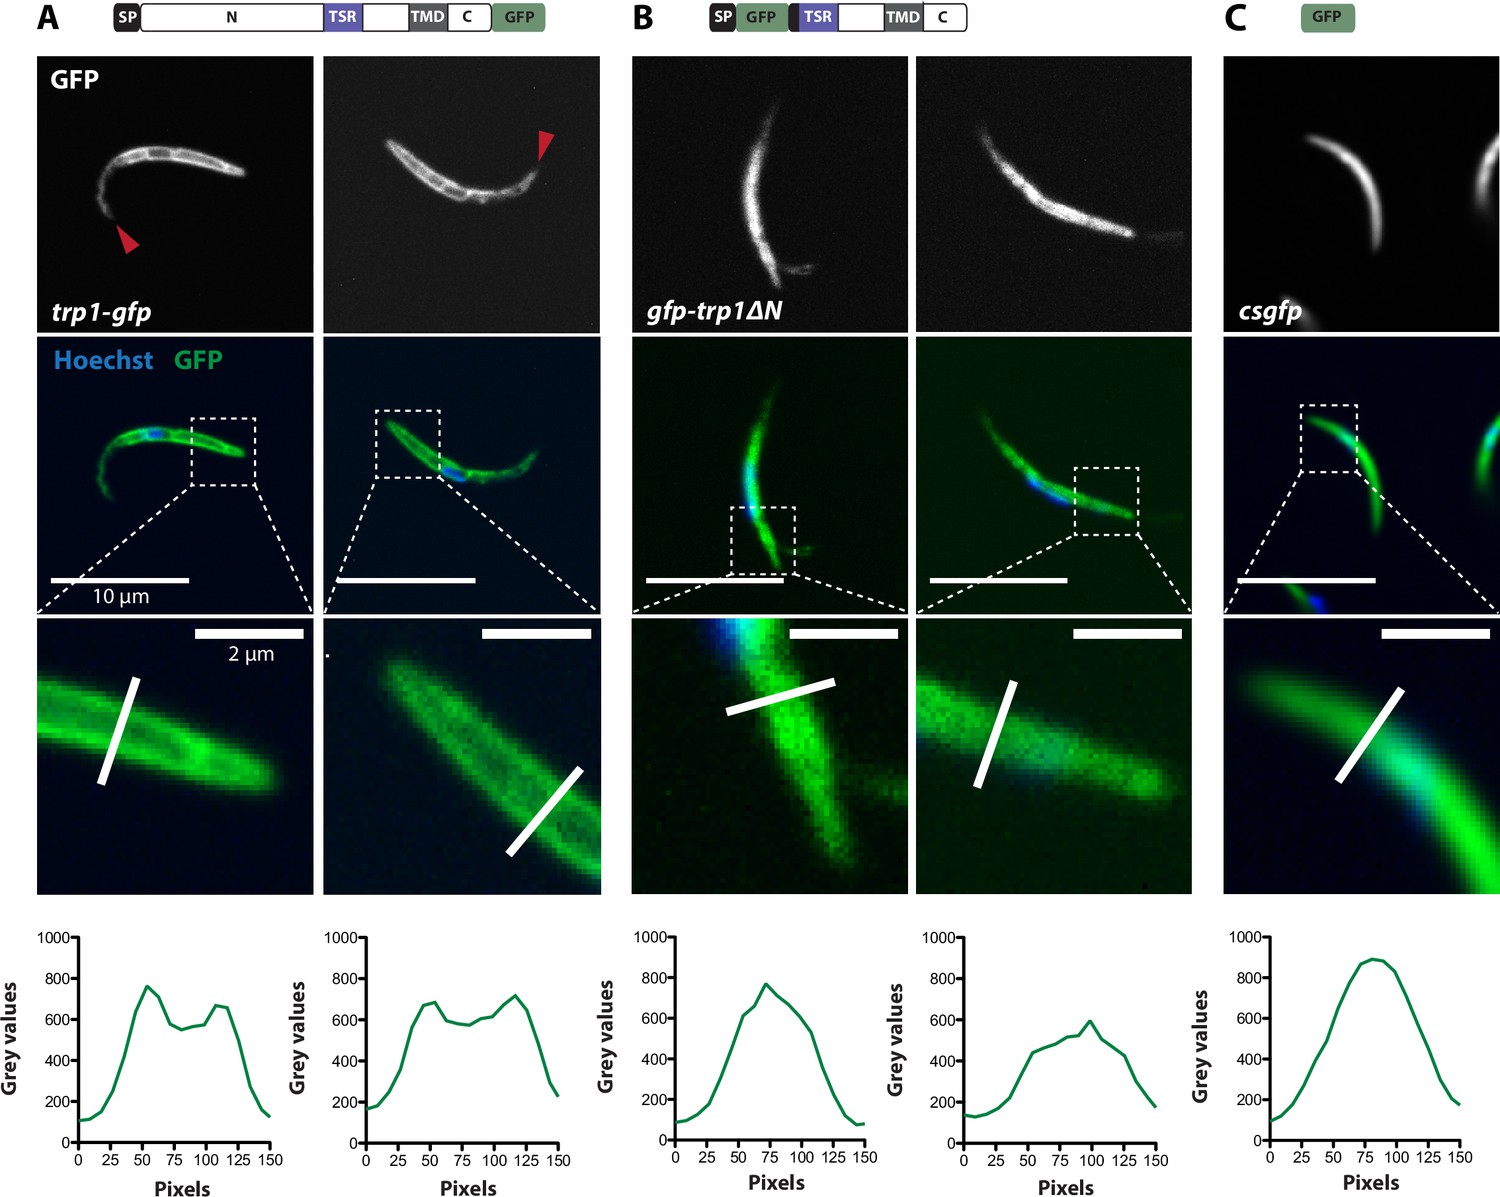
TRP1-GFP but not GFP-TRP1∆N localizes in a polarized fashion at the sporozoite periphery.
(A) Live imaging of hemolymph sporozoites expressing TRP1-GFP. The line plot below shows the intensity of grey values along the white line indicated in the zoomed image, showing the proximal end of the sporozoite. The GFP signal localizes close to the plasma membrane indicated by the intensity profile showing two peaks on both sides of the sporozoites. The red arrows point to the apical tip of the sporozoites. See also Video 2. (B) Live imaging of midgut sporozoites expressing GFP-TRP1∆N. The GFP signal is not equally distributed as seen in control parasites in (C) but does not localize close to the plasma membrane as shown in (A). (C) Live imaging of a salivary gland sporozoite expressing cytoplasmic GFP. In contrast to (A) and (B), the GFP signal is equally distributed within the cytoplasm.
Figure 7—figure supplement 1
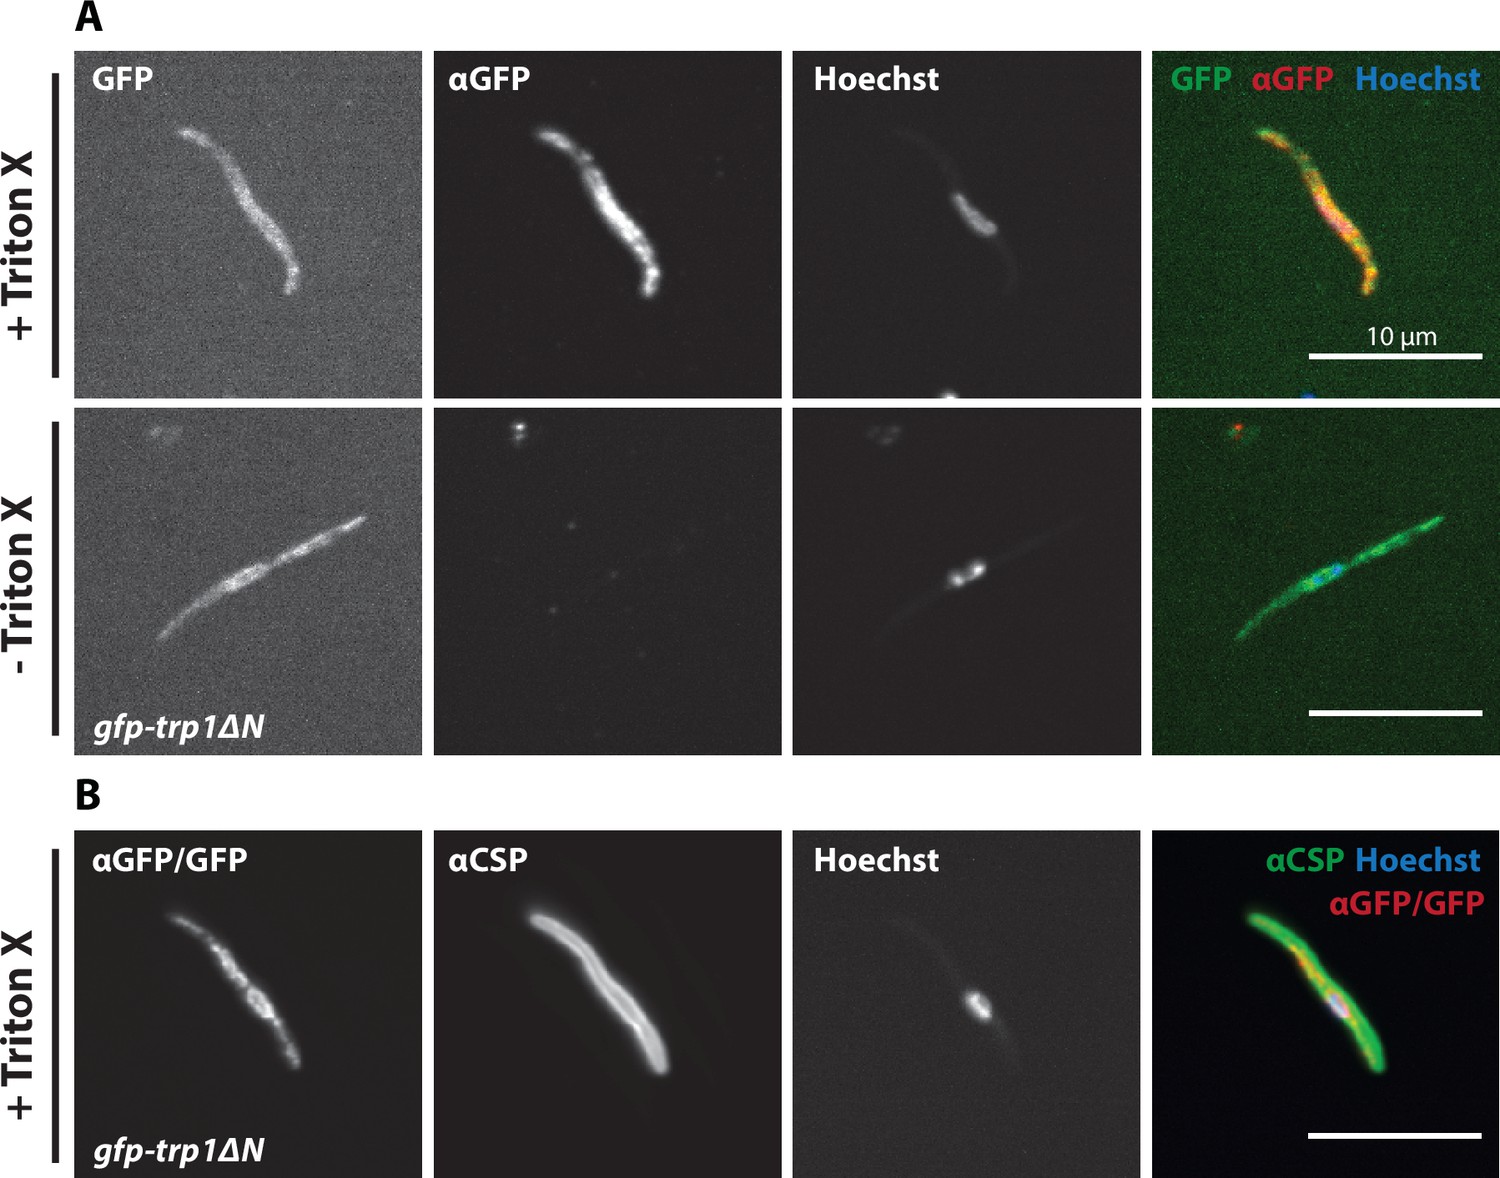
GFP-TRP1∆N does not localize on the sporozoite surface.
(A) Immunofluorescence of midgut sporozoites against GFP in the presence and absence of Triton-X 100. Note the absence of anti-GFP signal in the unpermeabilized sporozoite, suggesting that the GFP-TRP1∆N fusion protein localizes within the sporozoite and not on the plasma membrane. (B) Positive control with antibodies against CSP, visualizing the plasma membrane.
Figure 8

Localization of TRP1-GFP and the micronemal protein TRAP.
Comparison of salivary gland sporozoites expressing C-terminally tagged TRP1 (trp1-gfp) with salivary gland sporozoites expressing N-terminally tagged TRAP (gfp-trap). Zoomed images all show the apical tip of the sporozoites. Three different sporozoites are displayed for each strain. While TRAP shows a micronemal localization, predominantly at the apex of the sporozoite, TRP1 localizes close to the plasma membrane and accumulates at the rear end of the sporozoite.
Figure 9

trp1(-) sporozoites do not egress from oocysts and do not show intra-oocyst motility.
(A) Distribution of egress events (dark grey) and oocysts containing motile sporozoites (light grey) in control (fluo), wild-type (wt) or sera5(-) and trp1(-)mCh oocysts on a microscope slide covered with a cover slip or (B) uncovered in a glass-bottom Petri-dish. As control for a non-egressing strain, a fluorescent (sera5(-) fluo) and a non-fluorescent (sera5(-) non-fluo) SERA5 knockout line were tested. The different sample preparation methods are depicted below the graphs. Sporozoites budding from oocysts in a sporosome-like manner as well as spontanous bursting of oocysts were classified as egress events (Videos 4–6). (C) Time lapse of a budding event under a cover slip. A wild-type oocyst with budding sporozoites is shown. The start of two budding events is indicated with red arrows. Scale bar: 10 µm. See also Video 3. (D) Bursting of an oocyst in a glass-bottom Petri-dish. An oocyst expressing GFP bursting and releasing sporozoites is shown. Scale bar: 20 µm. See also Video 7.
Figure 10 with 1 supplement
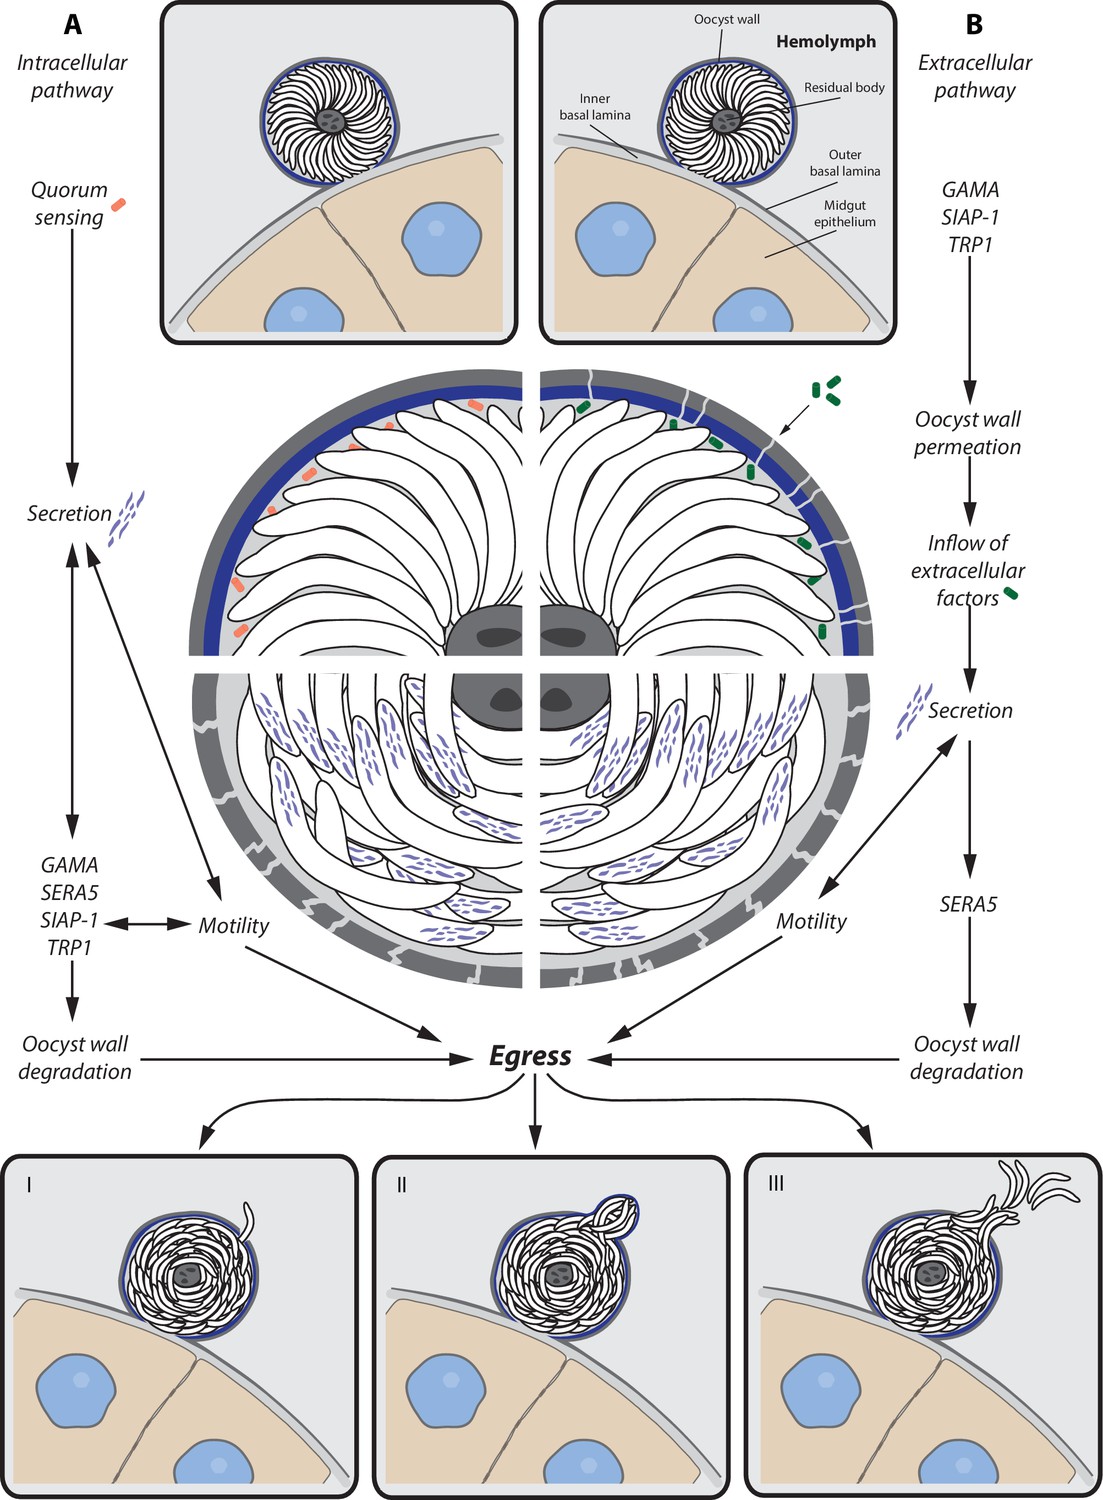
Potential model for sporozoite egress from oocysts.
Hypothetical model of a cascade of events that lead to sporozoite egress from oocysts. (A) Intracellular pathway — possible quorum sensing between sporozoites leads to secretion of proteins (e.g. GAMA, SERA5, SIAP-1, TRP1) that trigger gliding motility and degradation of the oocyst wall, which is followed by sporozoite egress. (B) Extracellular pathway — expression of factors (e.g. GAMA, TRP1, SIAP-1) leads to permeabilization of the oocyst wall and inflow of extracellular factors. Inflowing factors trigger secretion of proteins that not only activate gliding motility but also degrade the oocyst wall (e.g. SERA5), which is followed by sporozoite egress. Egress of sporozoites can occur in different ways. (I) Single sporozoite egress — sporozoites migrate through thin holes in the oocyst envelope. (II) Sporosome formation — many sporozoites stretch the oocyst wall, leading to the formation of sporozoite filled vesicles (sporosomes) that bud from the oocyst. (III) Bursting oocyst — rapid rupture of the oocyst wall.
Figure 10—figure supplement 1
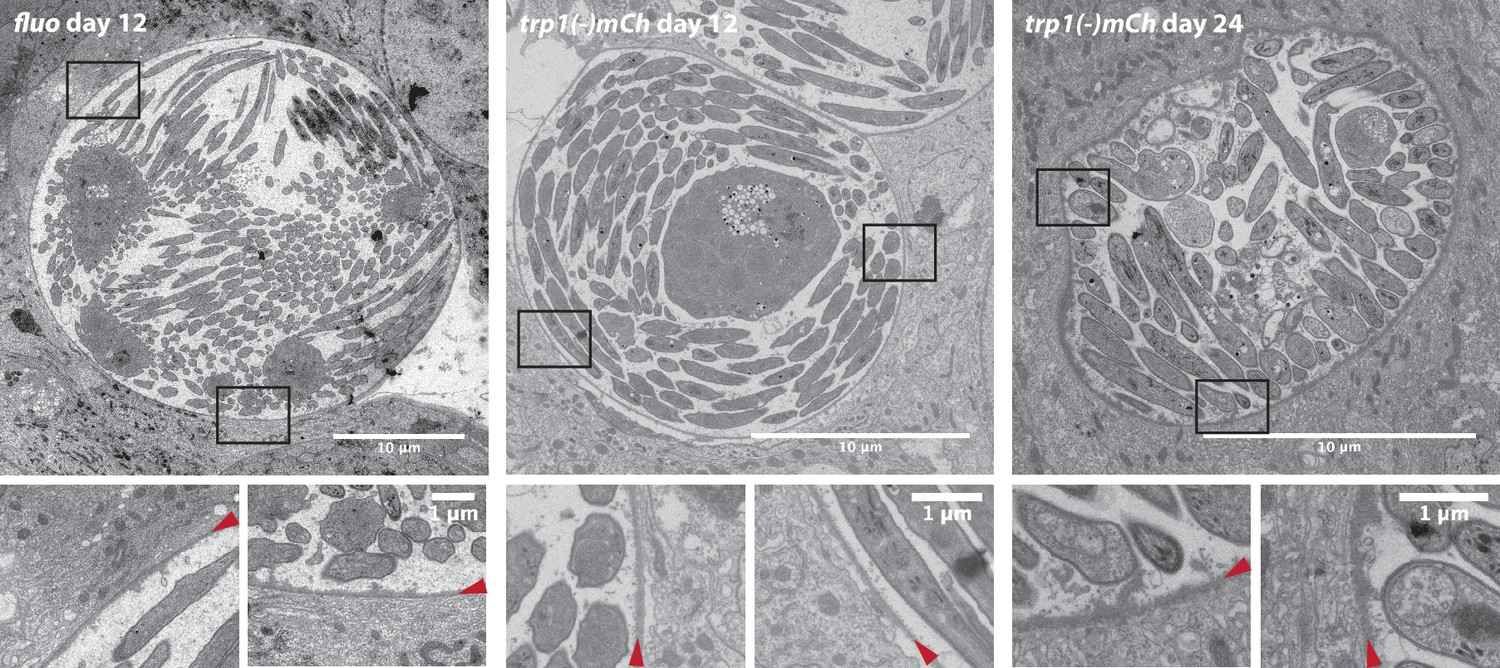
Electron microscopy of control (fluo) and trp1(-)mCh oocysts.
Full midguts of the respective parasites were fixed 12 or 24 days post infection and processed for electron microscopy. Two focus sections of each oocyst illustrate the integrity of the oocyst wall indicated by red arrowheads. Scale bars are depicted within the images.
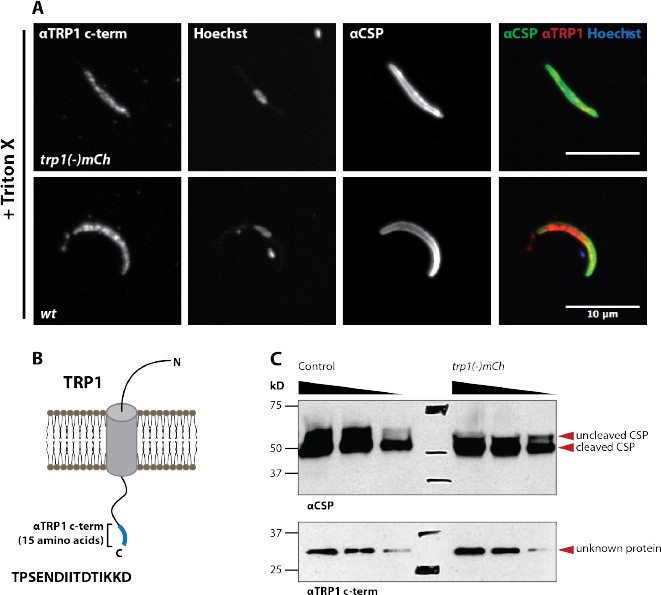
Author response image 1
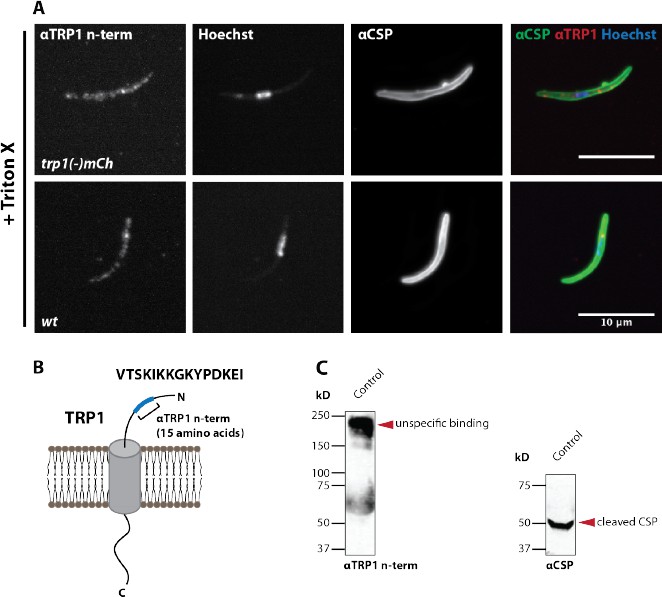
A peptide antibody designed against the TRP1 C- terminus does not recognize TRP1 by immunofluorescence and western blot.
(A) Immunofluorescence on permeabilized (Triton-X 100) midgut sporozoites of wt and trp1(-)mCh. The staining with αCSP antibodies, which label the sporozoite surface, was included as control to validate the staining procedure. Note that the immunofluorescence with the C-terminal αTRP1 antibody showed in both strains an equivalent intensity suggesting no specific binding to TRP1. (B) Illustration of TRP1, the location and sequence (15 last amino acids) of the peptide used for raising the antibody. (C) Western blot with wt control and trp1(-)mCh midgut sporozoites. The C- terminal αTRP1 antibody recognizes an unknown Plasmodium or Anopheles protein (lower images). CSP was used as a loading control (upper images).
Author response image 2
A peptide antibody designed against the TRP1 N- terminus does not recognize TRP1 by immunofluorescence and western blot.
(A) Immunofluorescence on permeabilized (Triton-X 100) midgut sporozoites of wt and trp1(-)mCh. The staining with αCSP antibodies was included as control to validate the staining procedure. The immunofluorescence signal with the N- terminal αTRP1 was not significantly different from background suggesting non- specific binding. (B) Illustration of TRP1, the location and sequence (15 amino acids) of the peptide used for raising the antibody. (C) Western blot with wt (control) midgut sporozoites. The N-terminal αTRP1 antibody doesn’t recognize any Plasmodium protein. Note that the unspecific binding between 150 and 250 kDa corresponds to a shading of the membrane but not a distinct band that got enhanced during the scanning of the western blot. CSP was used as a loading control (on the right side). Both images correspond to the same sample on the same western blot.
Videos
Video 1
Sections in Z-direction through oocysts expressing TRP1-GFP and GFP-TRP1ΔN.
Movie showing slices in Z-direction of an oocyst expressing TRP1-GFP (left) and an oocyst expressing GFP-TRP1ΔN (right). Oocysts were imaged with a spinning disc confocal microscope (Nikon Ti series) and a 60x objective (CFI Apo TIRF 60x H; NA 1.49). Only the GFP signal is shown.
Video 2
Salivary gland sporozoites expressing TRP1-GFP gliding.
Movie showing salivary gland sporozoites expressing TRP1-GFP gliding close to a salivary gland imaged on a spinning disc confocal microscope (Nikon Ti series) with a 60x objective (CFI Apo TIRF 60x H; NA 1.49). The GFP signal and the differential interference contrast (DIC) are shown beside each other. Note the intra-sporozoite movement of the TRP1-GFP signal, the peripheral localization is mainly at the rear end of the motile sporozoites. Time between frames: 1 s.
Video 3
Sporozoites are budding from a wild-type oocyst.
Movie in differential interference contrast (DIC) of wild-type sporozoites moving inside an oocyst and budding from the oocyst in a sporosome. Imaged on an Axiovert 200M (Zeiss) with a 63x (N.A. 1.3) objective. Time between frames: 30 s. These time-laps series were taken subsequently with ~5–10 s between each series.
Video 4
Oocyst rapidly bursting.
Movie showing an oocyst of the fluo control line rapidly bursting and disappearing. Fluorescence and differential interference contrast (DIC) are shown beside each other. Imaged on an Axiovert 200M (Zeiss) with a 10x (N.A. 0.5) objective. Time between frames: 30 s.
Video 5
Sporozoites moving inside oocyst.
Movie showing fluo control sporozoites moving inside an oocyst. Fluorescence and DIC are shown beside each other. Imaged on an Axiovert 200M (Zeiss) with a 10x (N.A. 0.5) objective. Time between frames: 30 s.
Video 6
Sporozoites budding from oocyst.
Movie showing fluo control sporozoites possibly budding from an oocyst. Fluorescence and DIC are shown beside each other. Imaged on an Axiovert 200M (Zeiss) with a 10x (N.A. 0.5) objective. Time between frames: 30 s.
Video 7
Long-term imaging of mosquito midguts infected with trp1(-)mCh, sera5(-) fluo and the fluorescent reporter line fluo.
Midguts of mosquitoes infected with trp1(-)mCh, sera5(-) fluo or a control line were imaged for 1 hr with 30 s per frame. The video shows, consecutively, a midgut infected with trp1(-)mCh, a midgut infected with a fluorescent control line and the sera5(-) fluo line. Note the absence of any sporozoite movement in the trp1(-)mCh movie, the bursting of an oocysts in the center of the wt control movie, and the intra-oocyst motility of sporozoites in several oocysts in the sera5(-) fluo movie. Imaged on an Axiovert 200M (Zeiss) with a 10x (N.A. 0.5) objective. Time between frames: 30 s.
Video 8
sera5(-) fluo sporozoites moving inside an oocyst.
Movie in differential interference contrast (DIC) showing intra-oocyst motility of sera5(-) fluo sporozoites within an oocyst. Imaged on an Axiovert 200M (Zeiss) with a 63x (N.A. 1.3) objective. Time between frames: 1 s.
Tables
Table 1
Summary of known gene deletions and genetic modifications associated with defects in sporozoite egress from oocysts.
Strain | Egress from oocysts | In vitro motility | Salivary gland invasion | Recognizable domain / function |
|---|---|---|---|---|
wt | +++ | +++ | +++ | / |
sera5(-)* | - | +++ | - | protease |
csp-RIImut27 | - | n.a. | n.a. | thrombospondin repeat (TSR) |
csp(RI−)57 | n.a. | +++ | ++ | TSR |
csp(RII−)57 | n.a. | - | + | TSR |
ccp2(-) and ccp3(-) | - | ++ | n.a. | LCCL-like, ricin, discoidin, ApicA, levanase and neurexin-like domains |
| pcrmp3(-) and pcrmp4(-) | - | +++ | n.a. | CRM domain, EGF-like domain |
gama(-)† | - | - | n.a. | / |
siap-1(-) | + | - | + | / |
orp1(-)‡ | - | +++ | - | histon-fold domain (HFD) |
orp2(-)‡ | - | +++ | - | HFD |
trp1(-) | - | +++ | - | TSR |
-
* Previously named ECP1 (Aly and Matuschewski, 2005).
-
† Previously named PSOP9 (Ecker et al., 2008).
-
‡ Information added during proof (Currà et al., 2016).
Table 2
Sporozoite numbers in midgut (MG), hemolymph (HL) and salivary glands (SG). Sporozoites were counted at day 14, 17/18, 20 and 22 post infection. The mean and the standard deviation (± SD) of countings from two to three different feeding experiments are shown. Note that not all dissected mosquitoes were infected and hence numbers per infected mosquito are higher.
Parasite line | No. of MG sporozoites per mosquito | No. of HL sporozoites per mosquito | MG / HL | No. of SG sporozoites per mosquito |
|---|---|---|---|---|
wt | 18,100 (±10,600) | 1,400 (±1,700) | 13 | 7,800 (±5,300) |
trp1(-) | 42,400 (±12,500) | 100 (±100) | 424 | 0 |
trp1(-)mCh | 101,200 (±46,800) | 800 (±300) | 127 | 0 |
sera5(-) fluo | 35,700 (±11,900) | 0 | / | 0 |
sera5(-) non-fluo | 50,100 (±12,900) | 0 | / | 25 (±50) |
gfp-trp1comp | 45,600 (±20,200) | 3,500 (±2,900) | 13 | 8,900 (±6,800) |
gfp-trp1 | 9,800 (±10,200) | 1,500 (±2,100) | 7 | 1,900 (±2,000) |
gfp-trp1∆N | 18,900 (±12,700) | 1,000 (±700) | 19 | 0 |
gfp-trp1∆C | 52,700 (±9.500) | 1,100 (±300) | 48 | 0 |
trp1-gfp parental | 3,400 (±1,600) | n.a. | n.a. | 175 (±100) |
trp1-gfp clonal | 9,300 (±4,500) | 2,600 (±1,500) | 4 | 600 (±750) |
Table 3
Infectivity of parasite lines to C57/BL6 mice. Data are shown for the TRP1-knockout lines trp1(-) and trp1(-)mCh as well as for the TRP1 complementations gfp-trp1comp, gfp-trp1∆N and gfp-trp1∆C in comparison to wild-type (wt – P. berghei strain ANKA) and gfp-trp1. MG – midgut; i.v. — intravenous injection into tail vein.
Parasite line | Route of inoculation | Mice positive #/# | Prepatency |
|---|---|---|---|
wt | by bite | 4/4 | 3.25 |
wt | 500,000 MG Sporozoites (i.v.) | 3/4 | 6.0 |
trp1(-) clone 1 | by bite | 0/4 | ∞ |
trp1(-) clone 3 | by bite | 0/4 | ∞ |
trp1(-) clone 3 | 400,000 MG sporozoites (i.v.) | 2/4 | 6.0 |
trp1(-)mCh | by bite | 0/4 | ∞ |
trp1(-)mCh | 500,000 MG sporozoites (i.v.) | 4/4 | 6.5 |
gfp-trp1comp | by bite | 4/4 | 3.0 |
gfp-trp1 | by bite | 4/4 | 3.5 |
gfp-trp1∆N | by bite | 0/4 | ∞ |
gfp-trp1∆C | by bite | 0/4 | ∞ |
Table 4
Primer sequences. Primers used for the generation of the different parasite lines, genotyping and reverse transcriptase (RT-) PCR.
Primer no. | Sequence |
|---|---|
P99 | CTAGCTAGCTTAATCATTCTTCTCATATACTTC |
P232 | CGCGGATCCTTACTTGTACAGCTCGTCCATGC |
P234 | CTTGCACCGGTTTTTATAAAATTTTTATTTATTTATAAGC |
P583 | AGTCATGCTGTTTCATGTGATC |
P600 | CCCAAGCTTCAAAAAAGCAGGCTTGCCG |
P601 | GCCGATATCCAAGAAAGCTGGGTGGTACCC |
P606 | GTAGGTCGACTGCTTAAACAGAAATTTCTGAACTTTGTTAGG |
P607 | GTAGGAATTCATCATGGTTCAGCTTTCATAAAAATCTATATGG |
P608 | GTAGAAGCTTGAGCTAAATAATAATGACACCGATTTAACGAG |
P609 | GTAGCTCGAGCATCTACTACTCATAATACACTTAGTGGAAGTACG |
P610 | GTAGCCGCGGTGCTTAAACAGAAATTTCTGAACTTTGTTAGG |
P611 | GTAGGACATATGTCTTCCACCTCCACCATTATCGTATTTTTTCAAAGTAGGACCAATCCA |
P612 | GTAGGGCGCCGGTGGAGGTGGATGGATTGGTCCTACTTTGAAAAAATACGATAAT |
P616 | GTAGGGATCCCAAAGCTGAAACTGATGAACCCATAGATG |
P657 | GGCATTTAAAACTACTATAGGATGTGGG |
P682 | CTCAAGGGTTTGATCAAGAAACTGCAG |
P694 | TAACCATCAAAACATCTCGATCTTTCGAG |
P695 | AATTTCTTTGACAATTAAATAAACAAGATATATCGCTG |
P698 | AAATGTAATTTTAGTTCTTGGTCAGATTGGTCAG |
P699 | ATTATCGTATTTTTTCAAAGTAGGACCAATCCA |
P887 | GAAGAATATAATTCGATACATATGTTTAGACAAAATC |
P1296 | GCGGGATCCATGAGTAAAGGAGAAGAACTTTTC |
P1408 | CATTTTCAGATGGTGTTTCAGTTTGTAC |
P1409 | CATATGAACTACATGCGTTAGAAGC |
P1410 | GATGATGATGATGATGAAAATAATGACATG |
P1411 | CACCATCAAAACGTAATGAAGCTG |
P1444 | CAAATGCCTCCTGACCAGGC |
P1597 | GTAGCCGCGGGATGGAAGTTCAAATATGTGTAGACTTACCTTATTG |
P1562 | GTAGGACATATGTCTTCCACCATCTTTCTTTATGGTATCTGTAATTATATCATTTTCAG |
P1564 | GTAGGTCGACCACTTAAATTTAATGATTAAATGGTGTGTACATTTCTAC |
P1565 | GTAGGATATCCATATACATAATACACTTATAGACACATTTAAATATG |
P1566 | GTAGAAGCTTGACATAGTCATCACAATATTCATTATTCATATATCATAC |
P1567 | GTAGCTCGAGCAATTTTCCCTTTATAATATTCTGTCTCTTTACATTGC |
P1595 | GTAAATAAGAATATGCATATACATGGGTG |
P1596 | CTGTTATAGTATGGGCCATGTTTCTG |
P1602 | CAGAGATCCTGAATACGACCCTAG |
P1603 | CTTTCTTCTGAAACATTATCCTGTAAGC |
Additional files
-
Supplementary file 1
Alignment of TRP1 homologues from different Plasmodium species.
Multiple sequence alignment with TRP1 homologues from P. berghei, P. chabaudi, P. yoelii 17X, P.vivax, P. knowlesi and P. falciparum 3D7. Highly conserved residues are written in white and highlighted in black, mostly conserved residues are highlighted in dark grey and less conserved residues are highlighted in light grey. The N-terminus (not present in gfp-trp1ΔN) is marked with a green line, the thrombospondin repeat is indicated in blue, the transmembrane domain is marked in orange and the C-terminus (not present in gfp-trp1ΔC) is highlighted in yellow. The red line marks a short sequence of 11 amino acids that is duplicated in the tagged lines gfp-trp1ΔN, gfp-trp1ΔC, gfp-trp1comp and gfp-trp1 before and after the GFP to ensure the structural integrity of the protein.
- https://doi.org/10.7554/eLife.19157.034
Download links
A two-part list of links to download the article, or parts of the article, in various formats.
Downloads (link to download the article as PDF)
Open citations (links to open the citations from this article in various online reference manager services)
Cite this article (links to download the citations from this article in formats compatible with various reference manager tools)
Motility precedes egress of malaria parasites from oocysts
eLife 6:e19157.
https://doi.org/10.7554/eLife.19157


