Ric-8A, a G protein chaperone with nucleotide exchange activity induces long-range secondary structure changes in Gα
- Montana State University, United States
- The University of Montana, United States
Figures
Figure 1 with 1 supplement
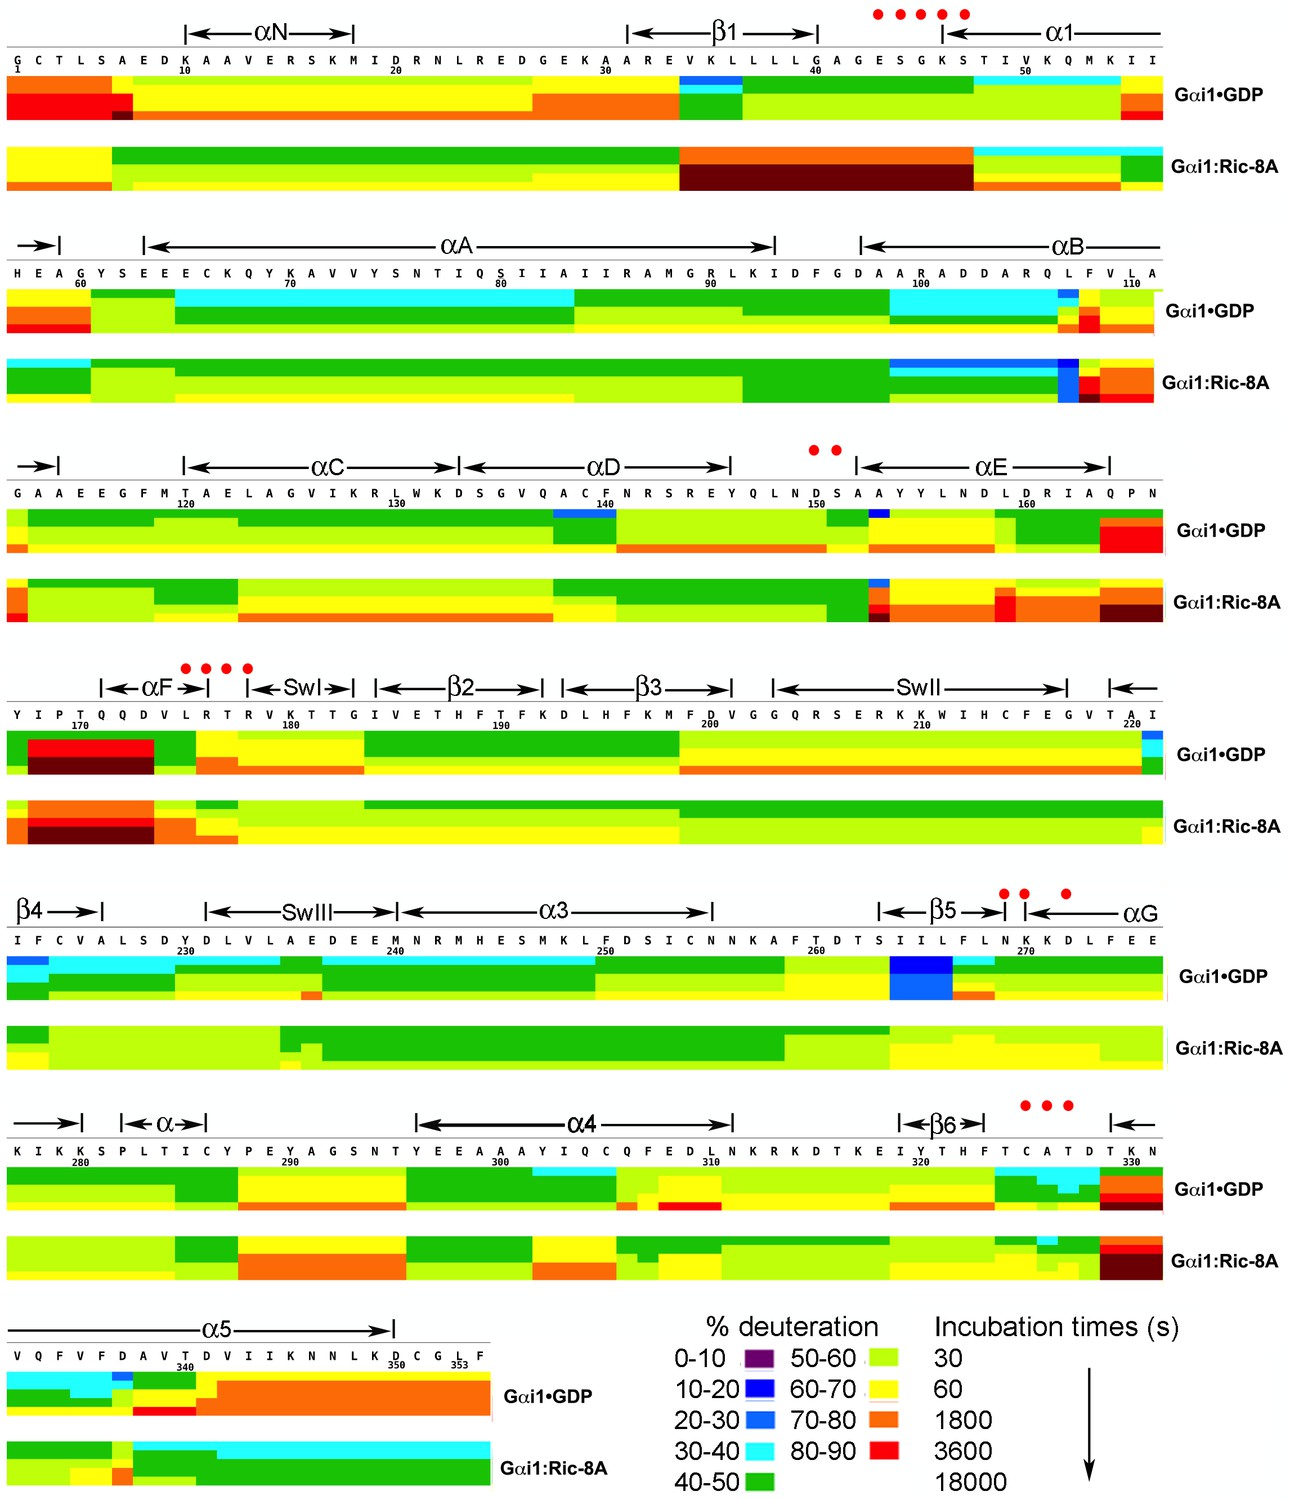
Kinetics of Hydrogen-Deuterium exchange from Gαi1 in complexes with GDP and Ric-8A.
HDX at successive time points are represented by sets of horizontal bars, progressing from top (30 s) to bottom (5 hr), mapped on the amino acid sequence of Gαi1 for Gαi1•GDP (upper set) and Gαi1:Ric-8A (lower set). Color coding (see key) indicates fraction (percent) of total amide hydrogen atoms exchanged per peptide at each time point. Location of secondary structure elements is shown above the amino acid sequence. Red dots indicate residues that form non-covalent interactions with GDP.
-
Figure 1—source data 1
Percent deuteration of peptides derived from Gαi1•GDP and Gαi1:Ric-8A.
- https://doi.org/10.7554/eLife.19238.004
Figure 1—figure supplement 1
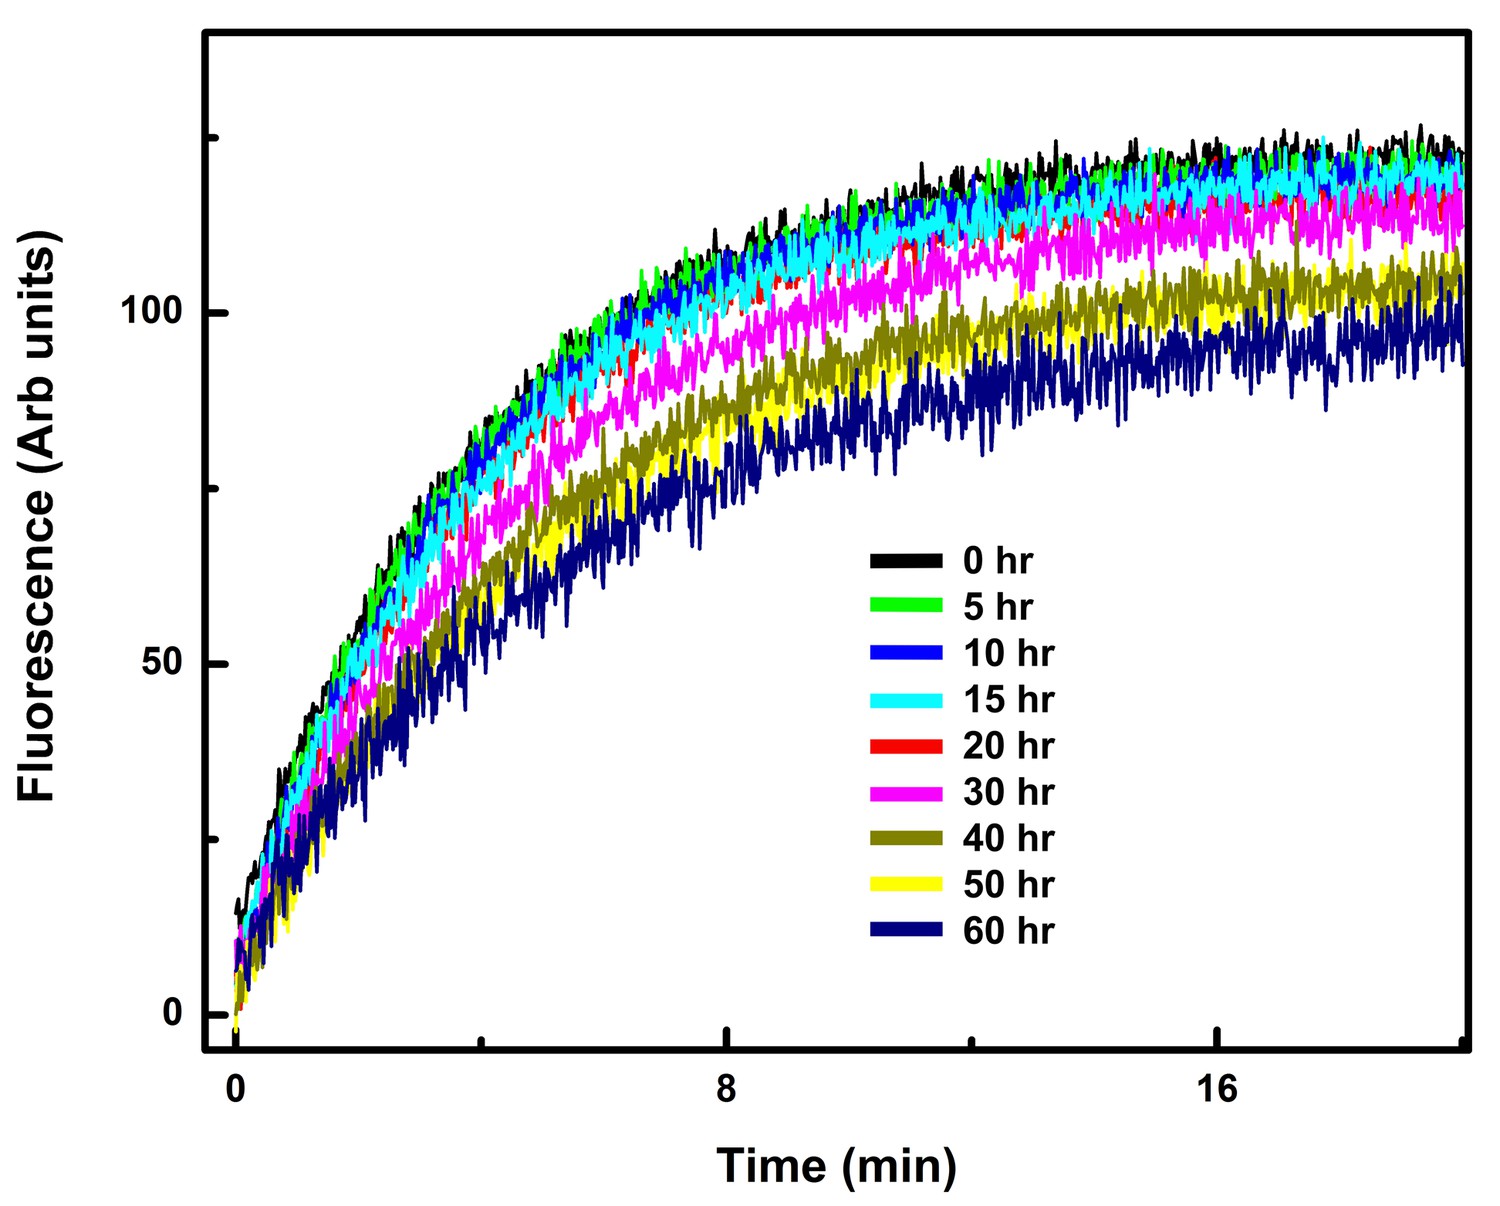
The Gαi1:Ric-8A complex is stable over the period in which the HDX experiments were performed.
The increase in tryptophan fluorescence emission upon addition of GTPγS at successive time points was measured after Ric-8A:Gαi1 (0.5 µM) in 20 mM HEPES, pH 8.0, 100 mM NaCl, 10 mM MgCl2, 1 mM DTT, and 0.05% C12E10 in a reaction volume of 400 µl was allowed to equilibrate for 10–15 min at 20°C in a quartz fluorescence cuvette. GTPγS (final concentration, 5 µM) was added to the reaction mixture, and the increase in fluorescence at 340 nm was monitored upon excitation at 290 nm as described in Materials and methods.
Figure 2
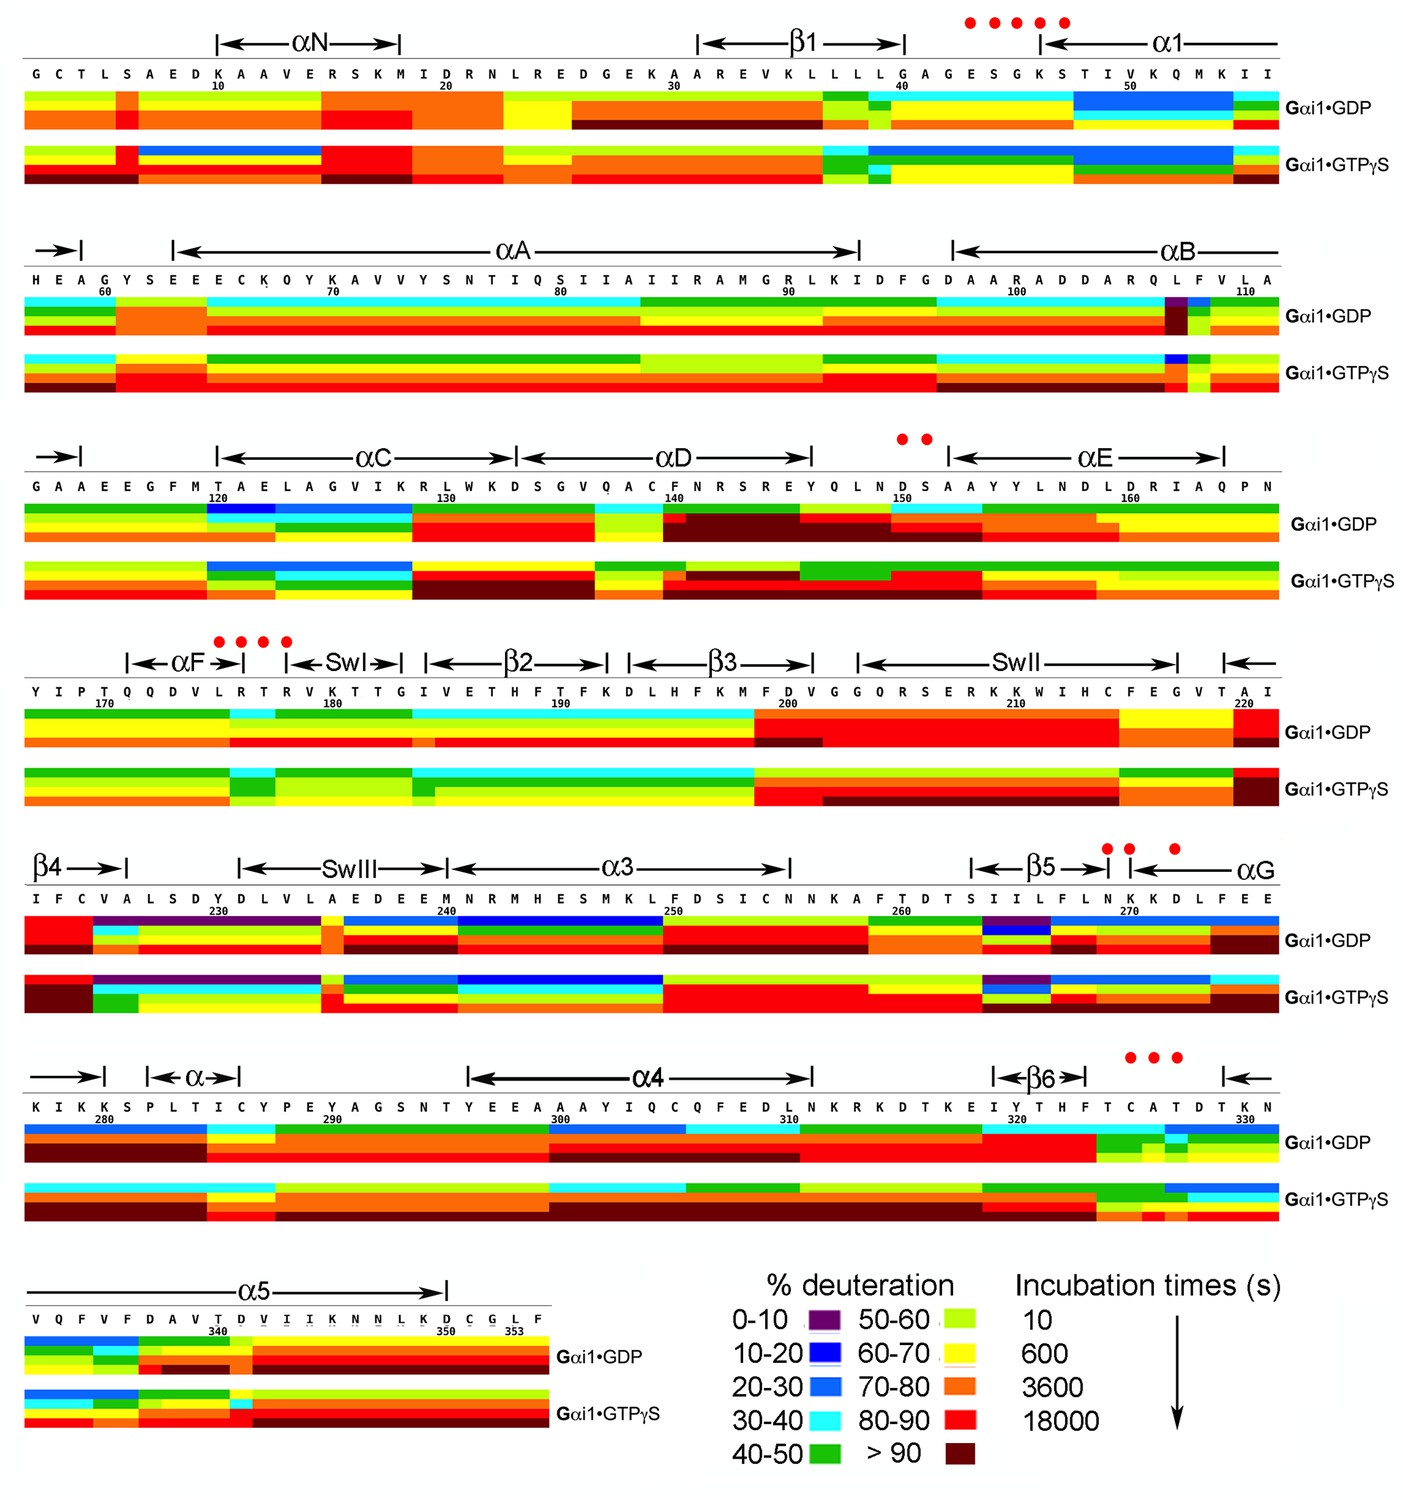
Kinetics of Hydrogen-Deuterium exchange from Gαi1 in complexes with GDP and GTPγS.
Image elements are as described in the legend to Figure 1.
-
Figure 2—source data 1
Percent deuteration of peptides derived from Gαi1•GDP and Gαi1•GTPγS after incubation in deuterated buffer.
- https://doi.org/10.7554/eLife.19238.007
Figure 3
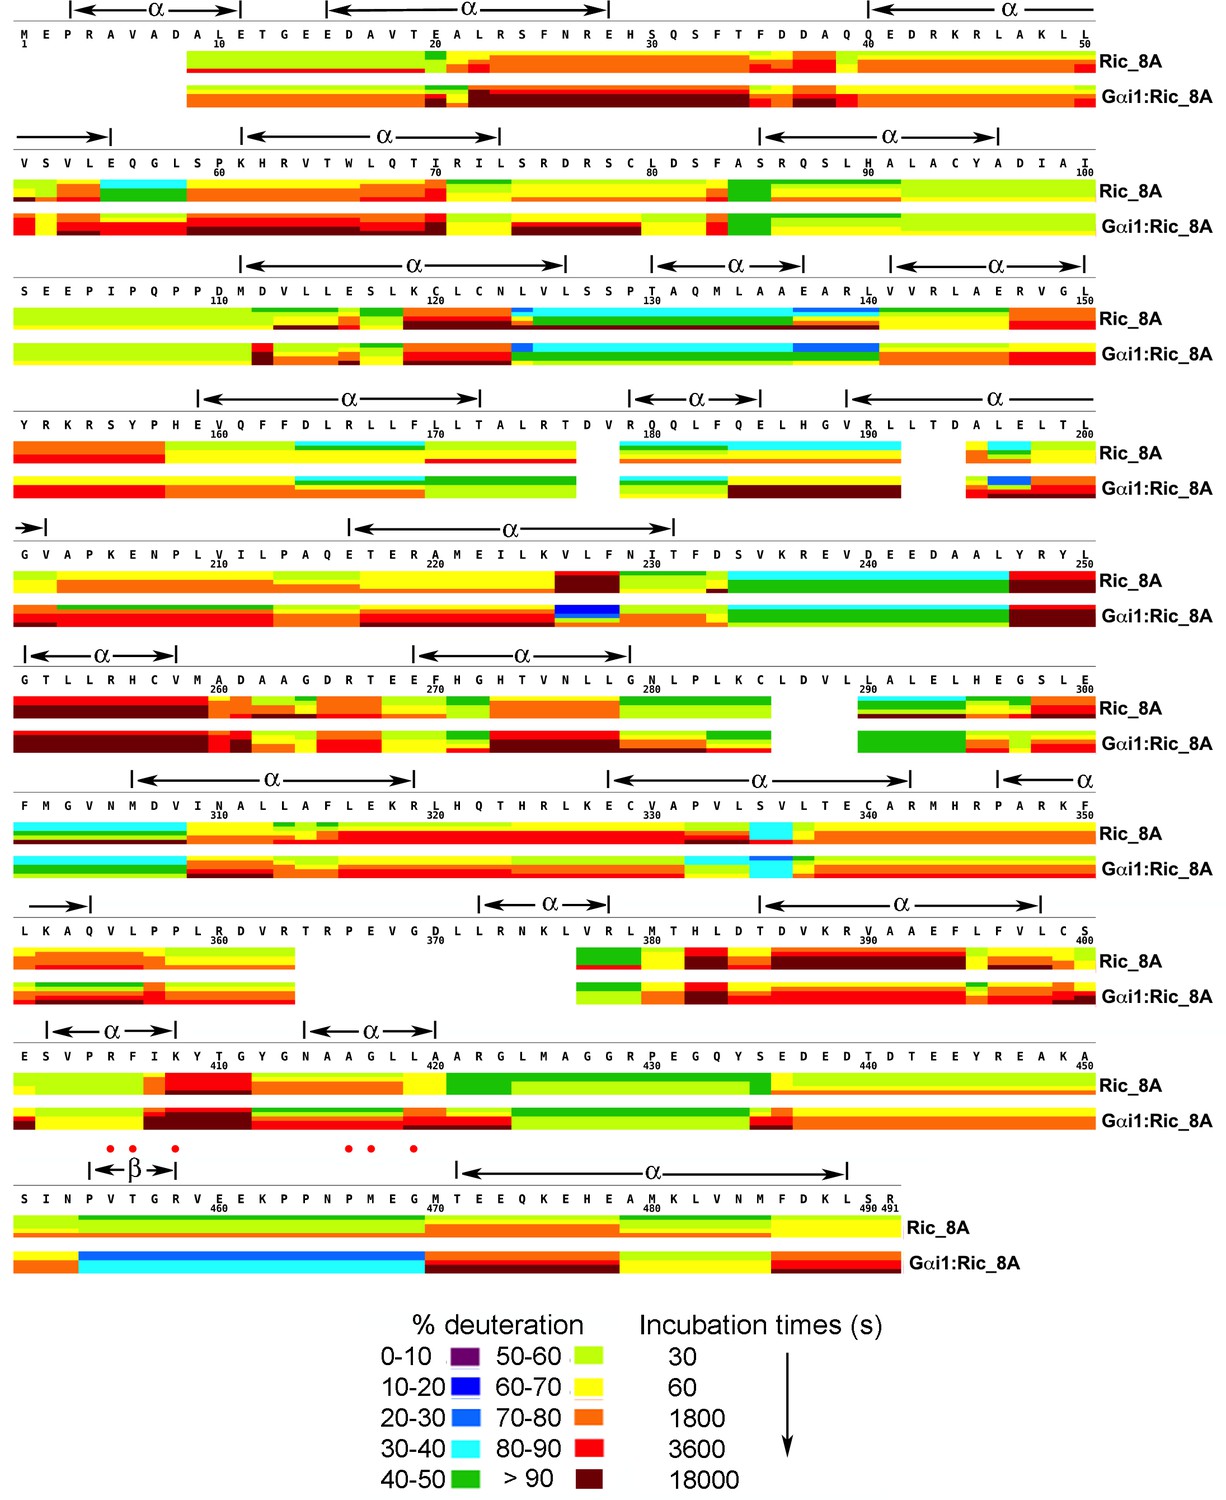
Kinetics of Hydrogen-Deuterium exchange from Ric-8A, free and in the complex with Gαi1.
Location of predicted secondary structure elements is shown above the amino acid sequence. Red dots indicate residues which, upon substitution with alanine, result in significant impairment of GEF activity. Image elements are otherwise as described in the legend to Figure 1.
-
Figure 3—source data 1
Percent deuteration of peptides derived from Ric-8A and Gαi1:Ric-8A after incubation in deuterated buffer.
- https://doi.org/10.7554/eLife.19238.009
Figure 4

Binding of Ric-8A to Gαi1, and nucleotide exchange induce widespread changes in Gα secondary structure.
(a) in the transition from Gαi1•GDP to Gαi1:Ric-8A-bound states, and (b) Gαi1•GDP to GTPγS complexes, as revealed by HDX-MS. The color scheme represents difference in per-residue deuteration relative to Gαi1•GDP mapped onto the structures of Gα•GDP (A, PDB 1GGD) or Gαi1•GTPγS (PDB 1GIT) Residues that undergo an increase in deuteration of 25% or greater are colored green (deprotection), and those that experience a decrease in deuteration of 25% or less are colored magenta (protection). Intermediate degrees of deuteration changes are colored according to the color key. Secondary structure elements are labeled; Switch I, Switch II and Switch III are labeled as S1, S2 and S3, respectively. Bound nucleotide, which is not present in the Gαi1:Ric-8A complex, is shown as a stick figure.
Figure 5
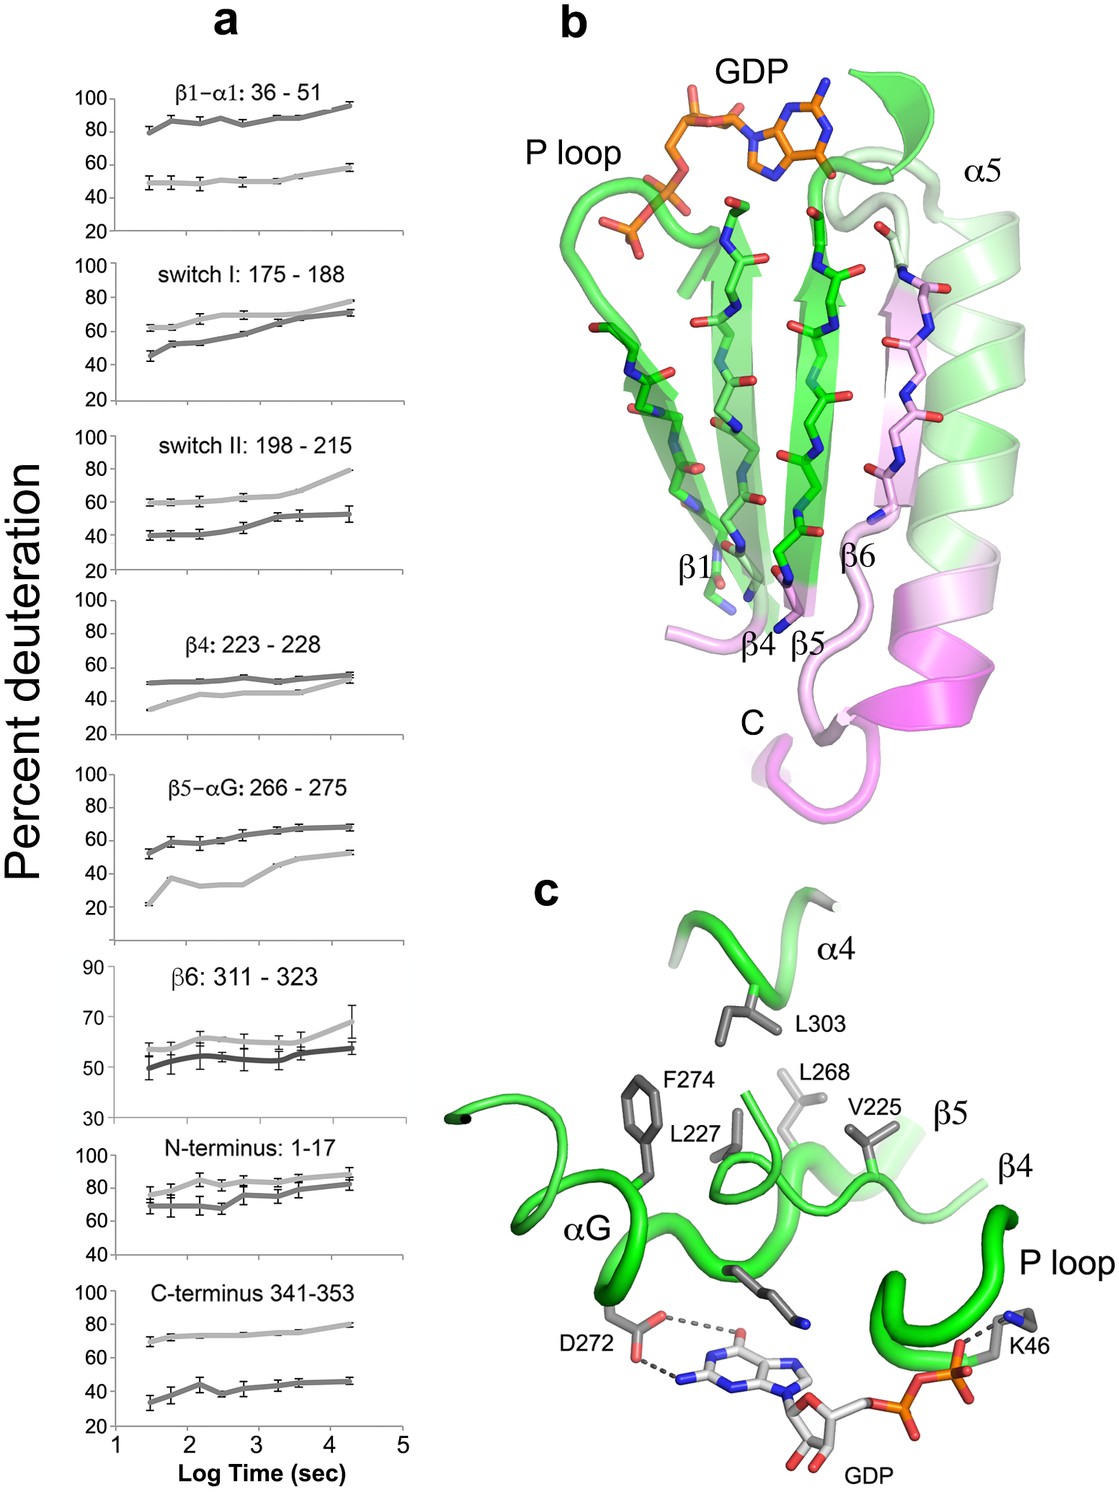
The beta sheet scaffold and nucleotide-binding site of Gαi1 are deprotected in the nucleotide-free complex with Ric-8A.
(a) kinetics of HDX at selected Gαi1 peptides in Gαi1•GDP, light gray, and Gαi1•Ric-8A, dark gray; error bars represent the standard deviation computed for three technical replicates (see Materials and methods) (b) section of the beta sheet and α5 in the Ras domain that abut the nucleotide-binding site, colored according to the extent of HDX, using the coloring scheme used in Figure 4; (c) elements of the nucleotide-binding site featuring the hydrophobic cluster between αG, β4, β5 and α4. Tube diameter is proportional to deuteration. Side chains and GDP are shown as stick figures: carbon, gray, oxygen, red and nitrogen, blue.
Figure 6
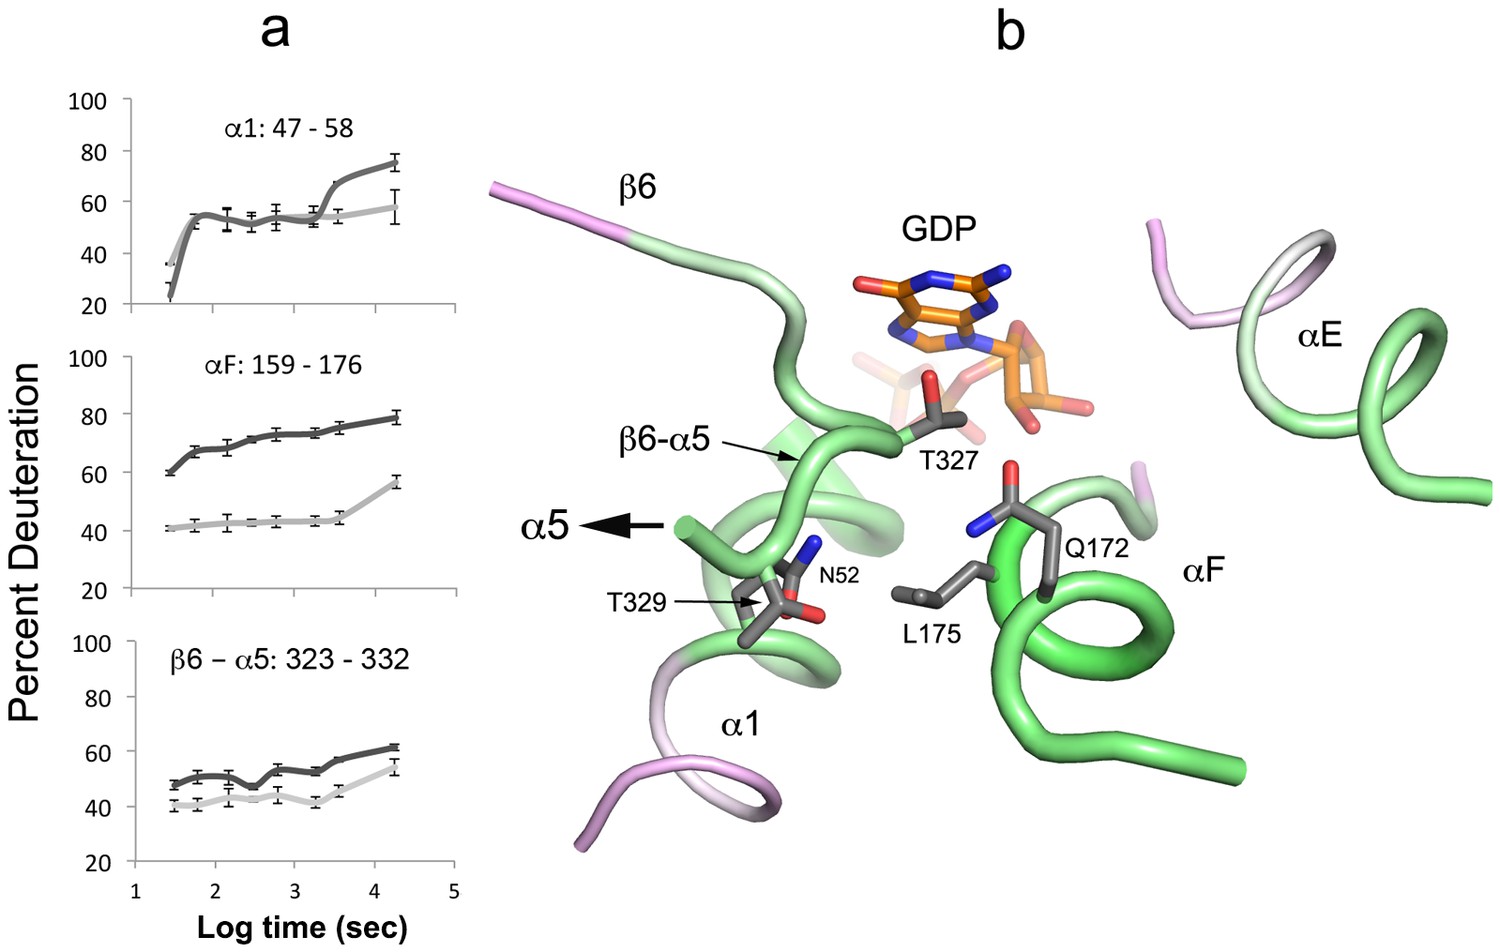
Destabilization of secondary structure at the Ras-domain:helical domain interface.
(a) HDX kinetics of interdomain secondary structure elements. (b) side chains of conserved residues in human Gα isoforms.
Figure 7

HDX identifies a possible Gαi1 binding site in Ric-8A.
(a) amplitude of HDX mapped on a model of the tertiary structure of Ric-8A, using the coloring scheme adopted in Figure 4; (b) GEF activity of Ric-8A mutants expressed as percent of WT Ric-8A activity. Each Ric-8A variant is mutated to alanine at one of the residues within the sequence 454–470 as indicated. GEF activity for the (1-452)Ric-8A truncation mutant is also shown. Relative GEF activity represented by the blue bars is measured as the initial velocity of GDP to GTPγS exchange at GDP-bound Gαi1 (2 μM), upon addition of GTPγS (10 μM) and Ric-8A (2 μM) [WT rate, 3.84 (1.45) μM/min (sample standard deviation in parentheses), n = 8] Orange bars represent the relative rate of GTPγS binding to nucleotide-free Gαi1:Ric-8A (2 μM) [WT rate, 4.66 (1.38), n = 8]. Error bars show standard deviation of mutant/WT GEF activity ratios based on three independent measurements. The bar labeled mGiα quantifies the intrinsic exchange rate of myristoylated Gαi1 [0.08 (0.02)] min−1. Asterisks above bars indicate significance (two-tailed Student’s t test) of the difference in the respective mutant Ric-8A-catalyzed rate to that of WT Ric-8A: *p<0.01; **p<0.005; ***p<0.001. For cases in which the difference between these rates is corresponds to p>0.01), no asterisk is shown.
Figure 8

Differential scanning fluorimetry of Ric-8A and its mutants.
Samples (10 μl) of wild type Ric-8A(1–491) and mutants thereof (~1 mg/ml) in 50 mM HEPES, pH 8.0, 150 mM NaCl and 1 mM TCEP were dispensed into glass capillaries and placed into the sample chamber of a Prometheus NT.48 differential scanning fluorimeter (NanoTemper Technologies, Inc, Munich, Germany). Samples were subjected to a time-dependent temperature gradient over 20–75°C at a rate of 1°C/min. Fluorescence emission at 330 nm and 350 mn (excitation wavelength, 295 nm) was recorded at seven second intervals. The transition temperature for thermal denaturation (Tm) is defined as the temperature at the maximum the first derivative of the ratio of fluorescence emission at 350 and 330 nm (F350/F330) as determined by a polynomial fit to the temperature-fluorescence ratio curve implemented in the manufacturer’s software.
Videos
Video 1
HDX changes in Gai1•GDP upon binding of Ric-8A.
https://doi.org/10.7554/eLife.19238.002Tables
Table 1
Initial velocities of Ric-8A mutant guanine nucleotide exchange activity. Assays were conducted as described in Materials and methods section of the Main text. For measurement of v1, reaction buffer (50 M HEPES, pH 8.0, 150 M NaCl, 10 M MgCl2, and 1 M TCEP) at 25°C contained 2 μM Gαi1•GDP, 2 μM Ric-8A and 10 μM GTPγS (initial concentration); for measurement of v2, 2 μM Gαi1•GDP, 2 μM Ric-8A were incubated for 5 min before addition of 10 μM GTPγS.
Ric-8A mutant | v1* (μM/min) | v2 (μM/min) |
|---|---|---|
WT | 3.84 (1.45) | 4.66 (1.38) |
P454A | 2.88 (0.80) | 5.39 (0.43) |
V455A | 0.82 (0.05) | 0.25 (0.01) |
T456A | 0.59 (0.04) | 0.24 (0.06) |
G457A | 3.47 (1.11) | 6.02 (1.19) |
R458A | 0.63 (0.07) | 0.37 (0.03 |
V459A | 5.65 (0.68) | 6.85 (1.44) |
E460A | 6.54 (0.83) | 5.36 (1.39) |
E461A | 7.45 (0.65) | 5.06 (0.59) |
K462A | 4.46 (0.92) | 5.15 (0.24) |
P463A | 2.90 (0.69) | 4.78 (1.26) |
P464A | 2.83 (0.94) | 4.73 (1.21) |
N465A | 2.25 (1.03) | 4.56 (0.51) |
P466A | 0.47 (0.01) | 0.34 (0.02) |
M467A | 2.17 (0.06) | 4.57 (0.44) |
E468A | 3.82 (0.55) | 6.23 (0.88) |
G469A | 0.63 (0.08) | 0.26 (0.05) |
(1-452)Ric-8A | 0.86 (0.22) | 0.39 (0.03) |
-
* v1 for the reaction
-
Gαi1•GDP + GTPγS + Ric-8A → Gαi1•GTP + Ric-8A + GDP
-
v2 for the reaction
-
Gαi1•Ric-8A + GTPγS → Gαi1•GTPγS + Ric-8A
-
Values in parentheses are the standard deviation for three independent experiments.
Download links
A two-part list of links to download the article, or parts of the article, in various formats.
Downloads (link to download the article as PDF)
Open citations (links to open the citations from this article in various online reference manager services)
Cite this article (links to download the citations from this article in formats compatible with various reference manager tools)
Ric-8A, a G protein chaperone with nucleotide exchange activity induces long-range secondary structure changes in Gα
eLife 5:e19238.
https://doi.org/10.7554/eLife.19238


