Mapping out Min protein patterns in fully confined fluidic chambers
- Kavli Institute of Nanoscience, Delft University of Technology, Netherlands
Figures
Figure 1 with 3 supplements
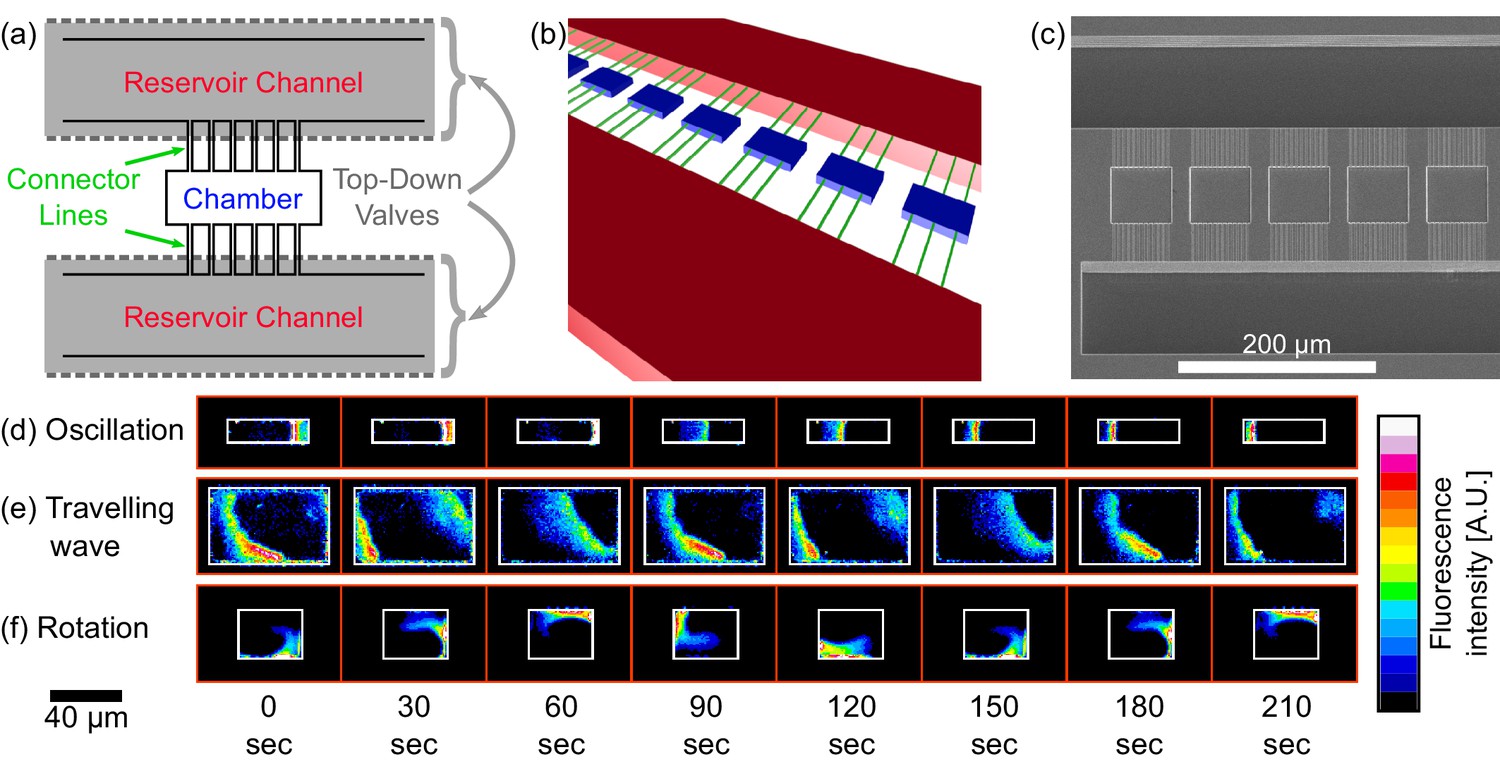
Chip structure and basic modes of Min patterns.
(a) Top view illustration of the microfluidic device structure. We study Min protein pattern formation in totally enclosed microfluidic chambers. Each chamber (blue) is 2.4 µm high with a width ranging from 10 to 60 µm and a length ranging from 10 to 90 µm. Each chamber is connected through small connector lines (green, with a cross-section of ∼0.9 × 0.9 µm) from both sides to two ∼30 µm deep reservoirs channels (red). A top layer of pressurized microfluidic valves (gray shading) are placed above the reservoirs channels. After the walls of the chambers are coated with a lipid bilayer, MinD and MinE proteins are injected into the device. Subsequently, the valves above the reservoir channels are closed. Consequently, the rectangular chambers (including the connector lines) are separated from the rest of the device. This unique structure allows studying the 3D geometric selection rules of the Min system in vitro. (b) 3D illustration of the microfluidic device structure. Chambers are in blue, connector lines in green, and reservoir channels in red. For clarity, the pressure valves are not shown. (c) SEM image of the silicon wafer master that was used in order to replicate the chambers, connector lines and reservoir channels into PDMS. Note that the fabrication was done with a positive resist and, thus, we have used a double replica method in order to recover the right orientation of the chambers (see Materials and methods). (d–f) Characterization of dynamical Min patterns observed in the confined fluidic chambers. (d) Oscillations - Min proteins periodically move back and forth between two poles of the chamber. (e) Traveling waves - Min proteins wave fronts continuously propagate from one side of the chamber to the other. (f) Rotations - Min zone circulates around a fixed point in the chamber. Scale bar 40 μm applied to all three examples (d–f). Fluorescence signals represent MinE patterns.
Figure 1—figure supplement 1
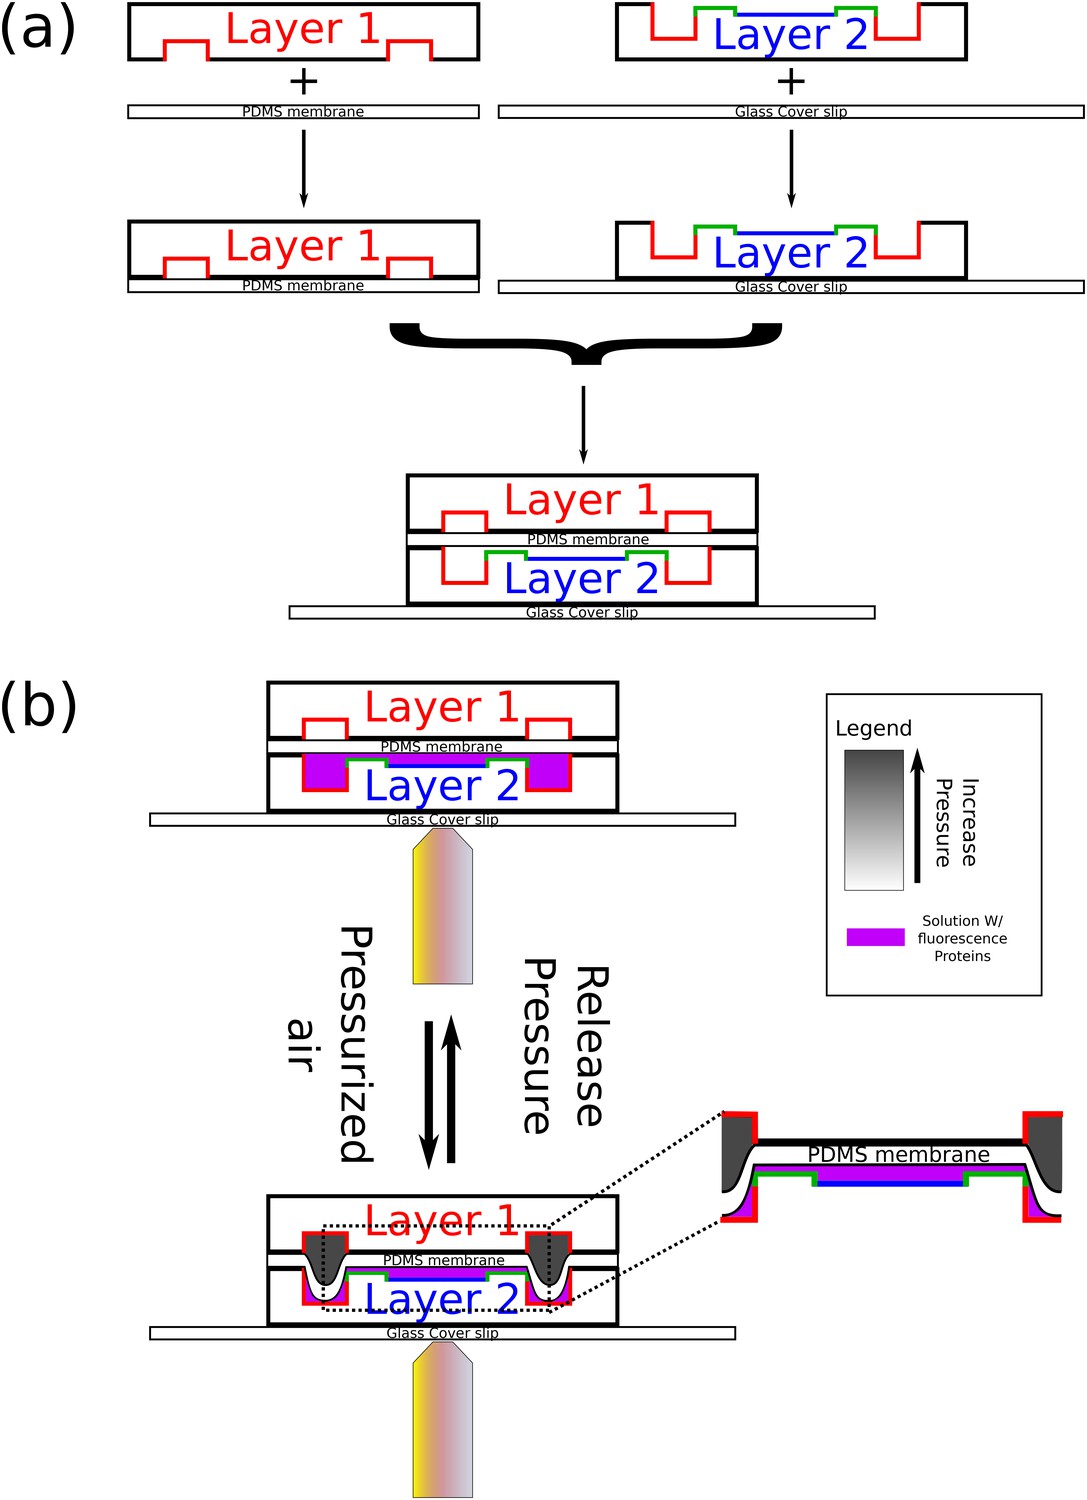
Schematics of chip fabrication and operation.
(a) Illustration of the fabrication process of the microfluidic device. First, a top layer PDMS chip is bound to a thin PDMS membrane via plasma treatment and a high-temperature baking. Next, a lower layer PDMS chip with the chambers is bound to a glass coverslip in the same way. Finally, the two parts are aligned and bound to each other in the same way. (b) An illustration of the operation of the chip in order to obtain closed microfluidic chambers. First, the chip is coated with a supported lipid bilayer. Next, Min proteins are infused in the chambers. Finally, the upper layer valves are pressurized with air. As results, one can study the behavior of the Min proteins in confined isolated fluidic volumes.
Figure 1—figure supplement 2
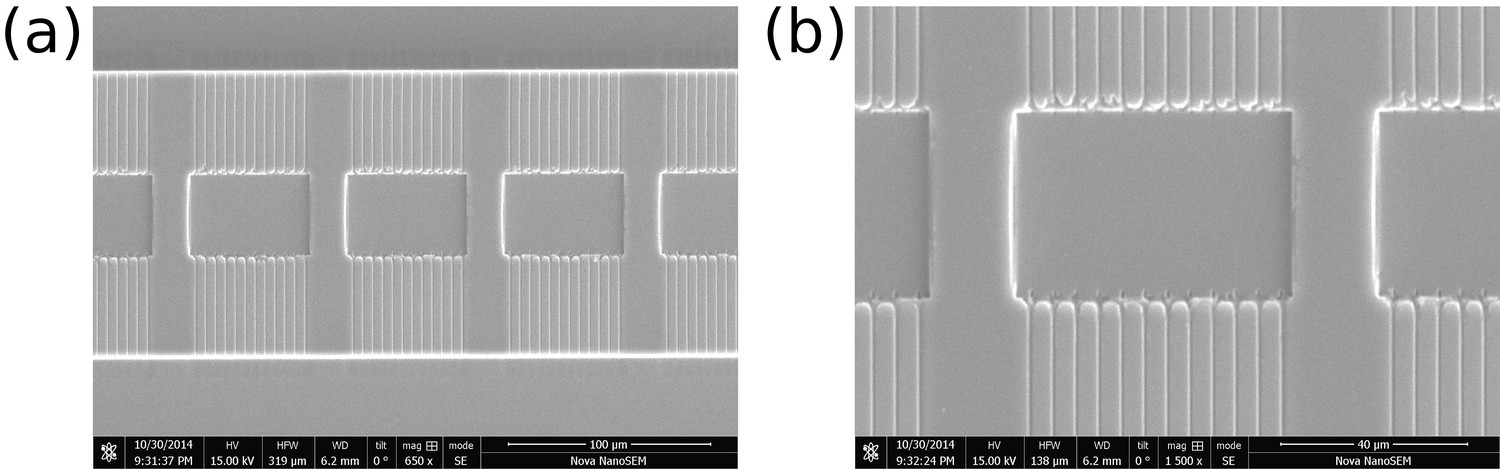
SEM images of two different areas in the lower layer PDMS chip.
https://doi.org/10.7554/eLife.19271.005
Figure 1—figure supplement 3
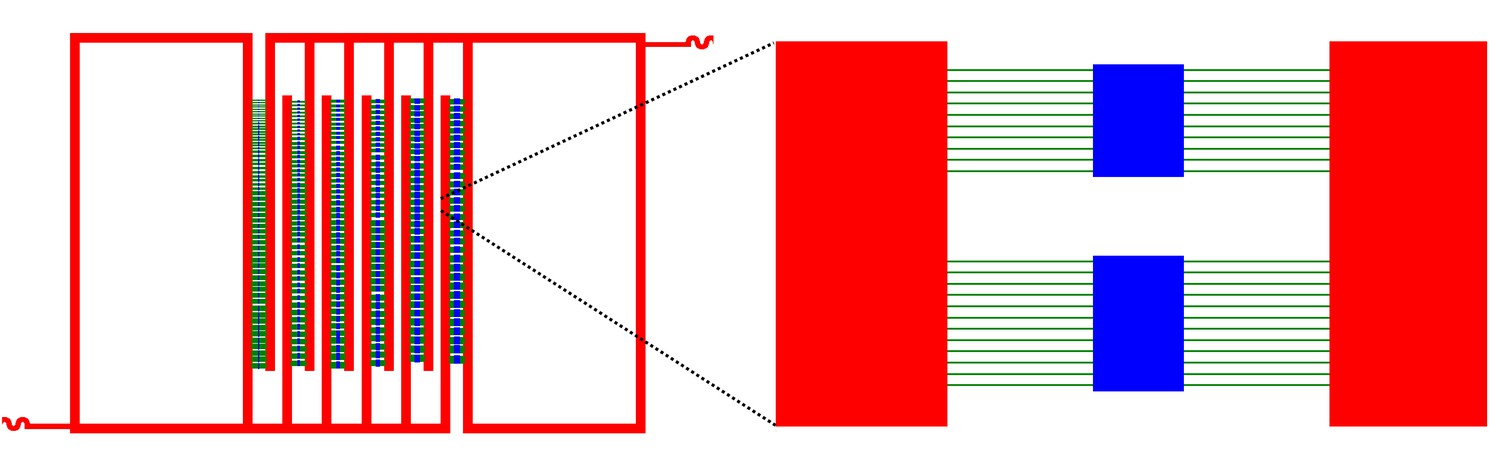
Schematic representation of the overall lower layer chip structure.
A series of three dimensional closed rectangle chambers. Chambers and lines are in blue. Connector lines are in green, and deep reservoirs channels are in red.
Figure 2 with 1 supplement

Atlas of the Min system behavior in 3D confined chambers.
We represent the dynamical Min behavior in each case as a quadrant. (a) Illustration of the quadrant scheme. Each quadrant is composed of (upper left) A single frame from a movie that captures the behavior of the Min system in a specific chamber at a specific point of time; (lower right) A temporal standard deviation picture of the movie; (lower left) an Xt-kymograph of the middle line cross-section of the chamber along the red line in the upper left movie frame image, and (upper right) a Yt-kymograph of a middle line cross-section of the chamber along the blue line in the upper left movie frame image. (b–d) Illustrative examples of the three pure genera of Min dynamics that were observed. (b) Oscillations. (c) Traveling waves, and (d) Rotations. (e) Table representing real examples of observed Min dynamics in the chambers, organized according to the quadrant scheme. Each image is color coded in a 16-colors look-up table as shown in the legend. Scale bar represents 30 μm in the x and y directions and 600 s for the and kymographs. A detailed explanation for the quadrant representation of the Min pure and non-pure behaviors is found in the main text. Fluorescence signals represent MinE patterns.
Figure 2—figure supplement 1

A zoom-in of the atlas of the Min system behavior in 3D confined chambers.
This figure represents a zoom of Figure 2e. Typical examples of the Min protein behavior in smaller chambers are thus shown at larger magnification for clarity. The format of figure follows the same quadrant representation. For more details see the main text. Fluorescence signals represent MinE patterns.
Figure 3 with 1 supplement
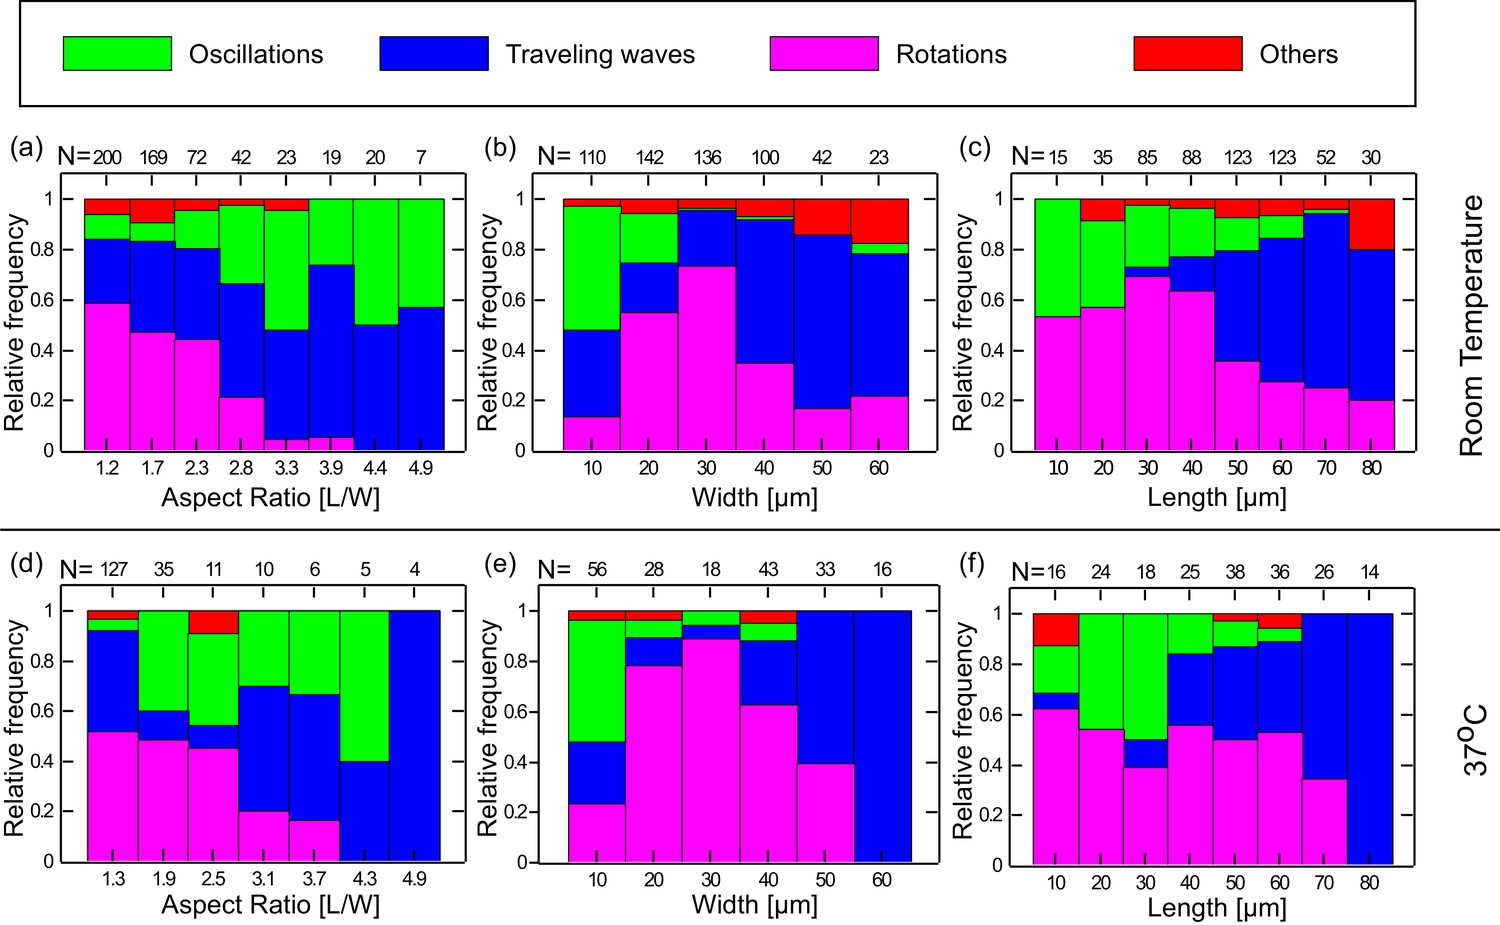
Preferred dynamical Min behavior as a function of the chamber-geometry parameters.
(a–c) Geometry selection at room temperature. (a) Selection according to the chamber aspect ratio. (b) Selection according to chamber width. (c) Selection according to chamber length. All measurements were preformed at room temperature on a DOPC:DOPG (67:33) SLB supplemented with 0.03 of TopFluor Cardiolipin. The number of chambers observed with the specific geometrical characteristics are indicated above each bar. (d–f) Same as (a–c) for measurements that were preformed at 37°C on an E. coli polar lipid extract SLB. The analysis is based on the fluorescence signals of MinE.
Figure 3—figure supplement 1
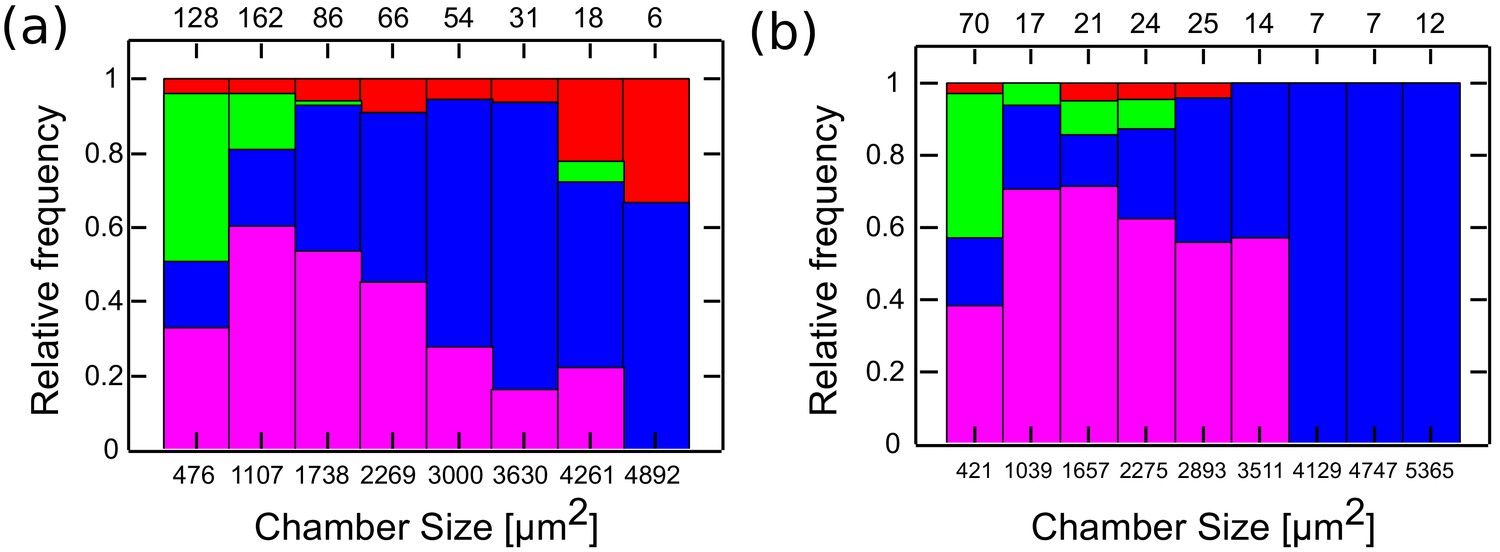
Min patterns geometry selection rules based on chambers size.
Geometry selection of the Min patterns according to the chamber size for measurements at room temperature over DOPC:DOPG SLB membrane (a), and at 37°C with E. coli polar lipids extract SLB (b).
Color code, as in Figure 3.
Figure 4 with 2 supplements
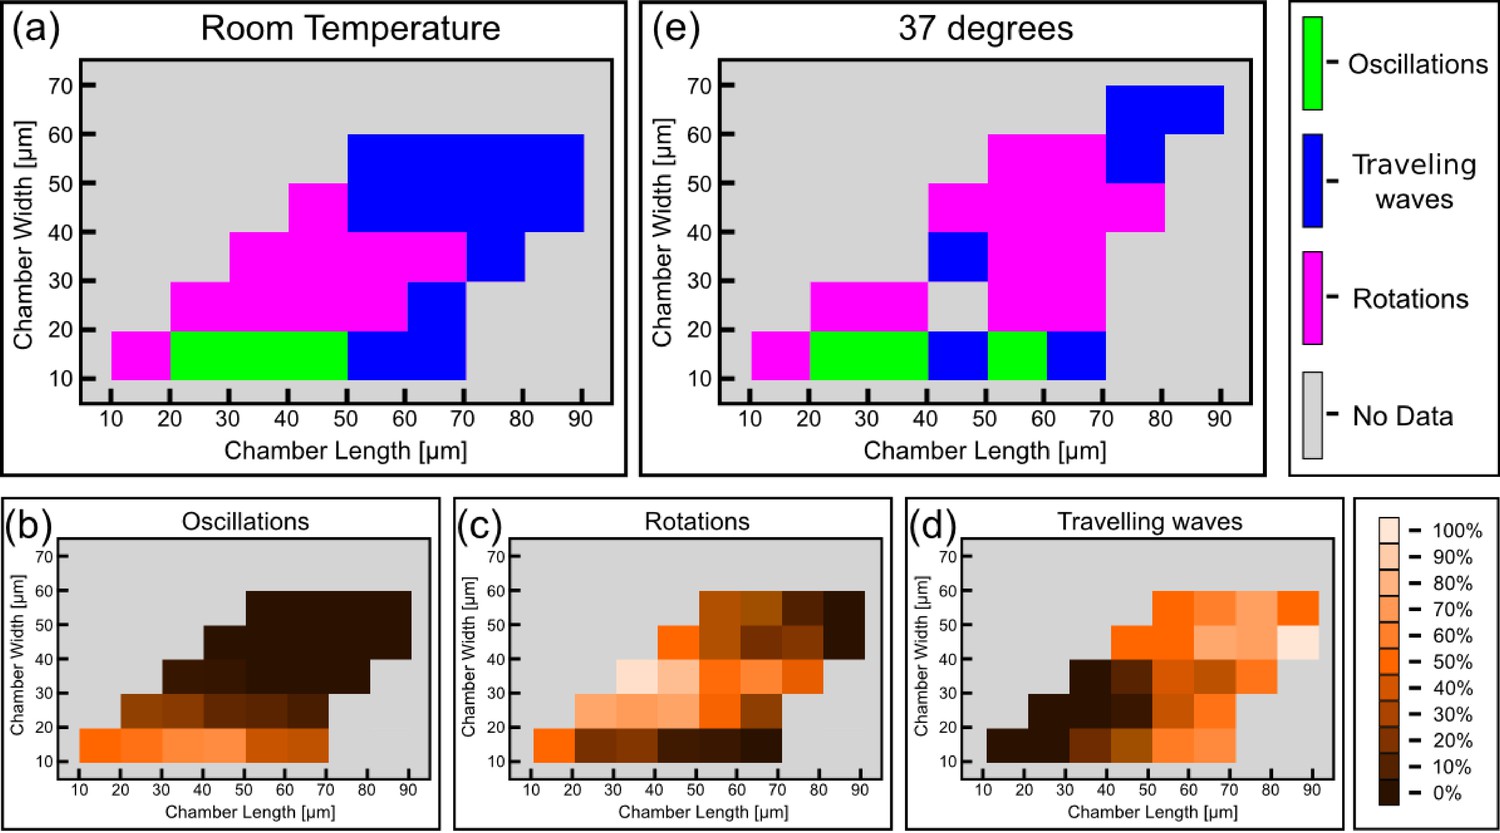
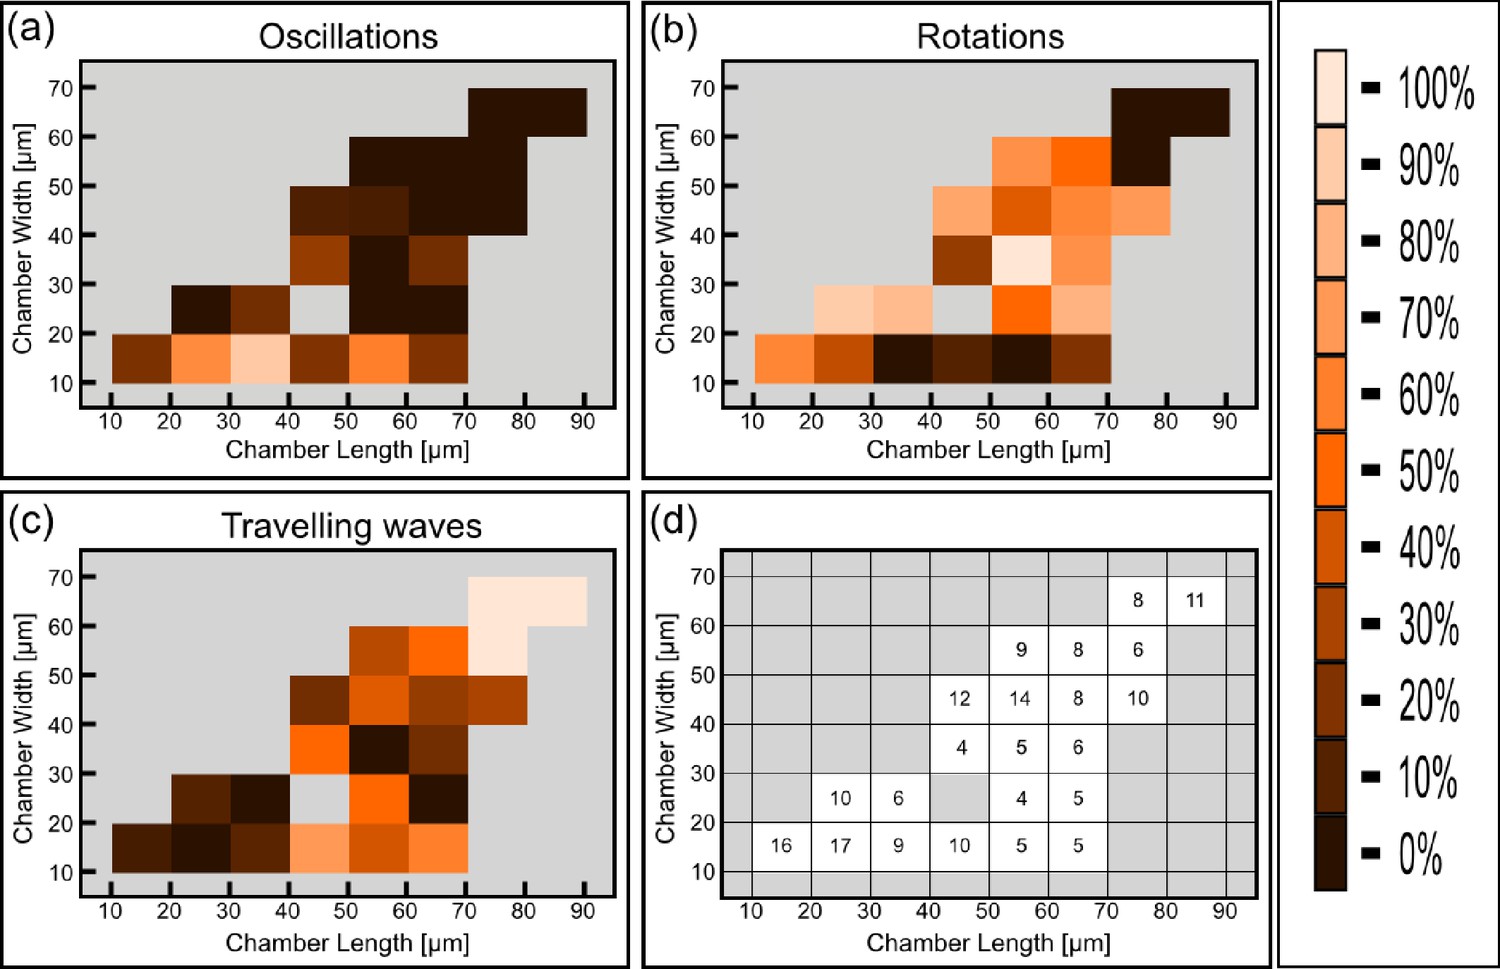
Phase diagram of the Min patterns.
(a) Phase diagram of the Min behavior at room temperature. Each square represents the most abundant behavior in that geometry. Color code is shown on the right. (b–d) Relative abundance of the pole-to-pole oscillations, rotations and traveling waves in each chamber size. Color code for (b–d) is shown on the right. (e) Phase diagram of Min behavior at 37°C. Color code is the same as in (a). The analysis is based on the fluorescence signals of MinE.
Figure 4—figure supplement 1
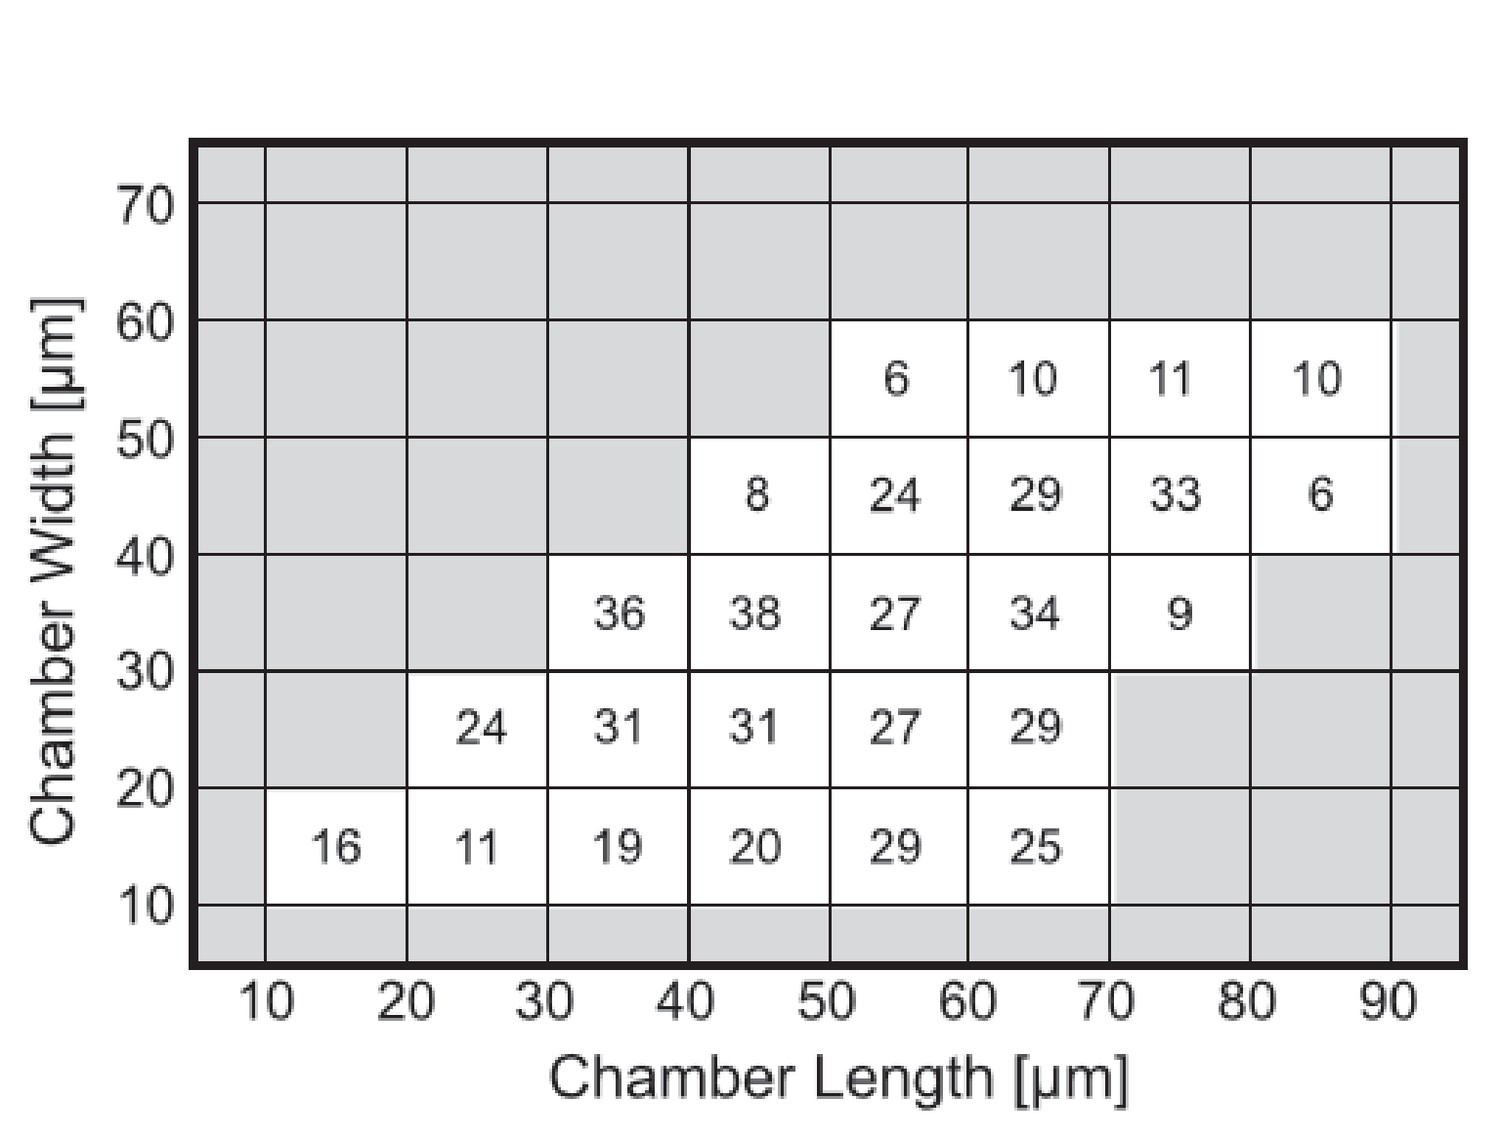
Number of chambers that were used per each tile for constructing Figure 4a–d.
https://doi.org/10.7554/eLife.19271.014
Figure 4—figure supplement 2
Detailed analysis of the phase diagram at elevated temperature (Figure corresponding to Figure 4e).
(a) Relative abundance of the oscillatory behavior for each chamber size. Color code is defined in the legend to the right. (b) Same as (a) for rotations. (c) Same as (a) for traveling waves. (d) Number of chambers that were used per each tile for constructing Figure 4e and panels (a–c).
Figure 5 with 1 supplement
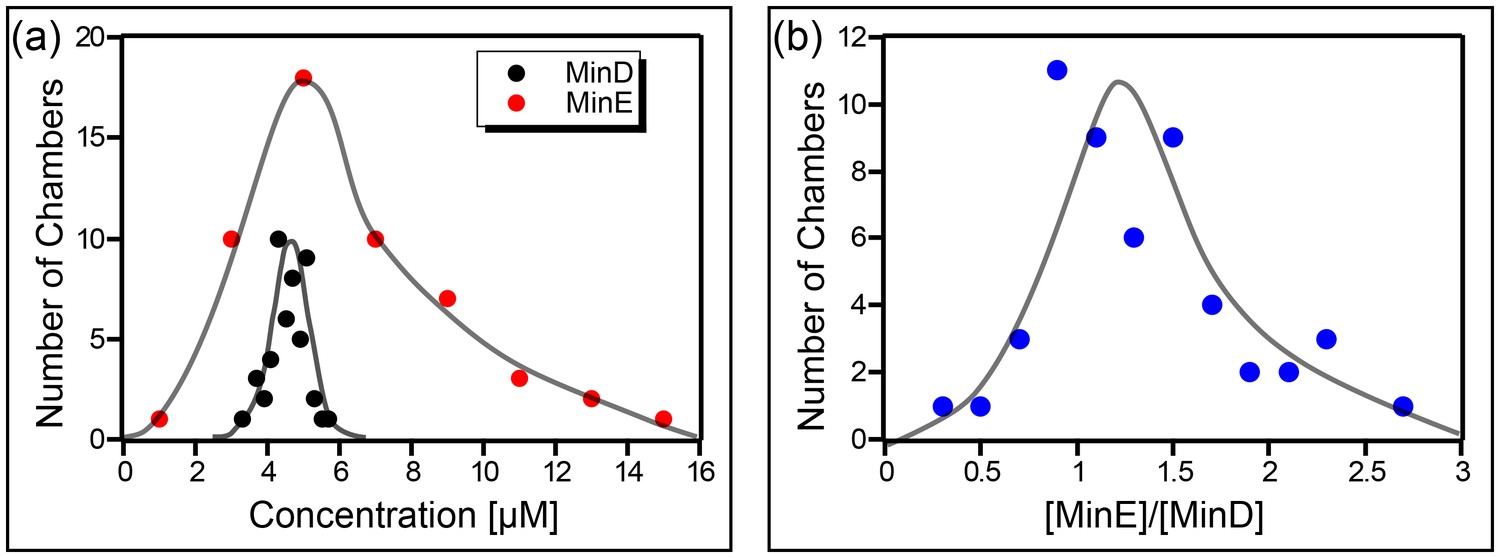
Concentration of the Min proteins.
(a) Histogram of the deduced concentration of MinE and MinD in the chambers. (b) Idem for the ratio of MinE to MinD. Lines are guides to the eye. Concentration was measured using a GFP protein as a standard as described in the Materials and methods.
Figure 5—figure supplement 1
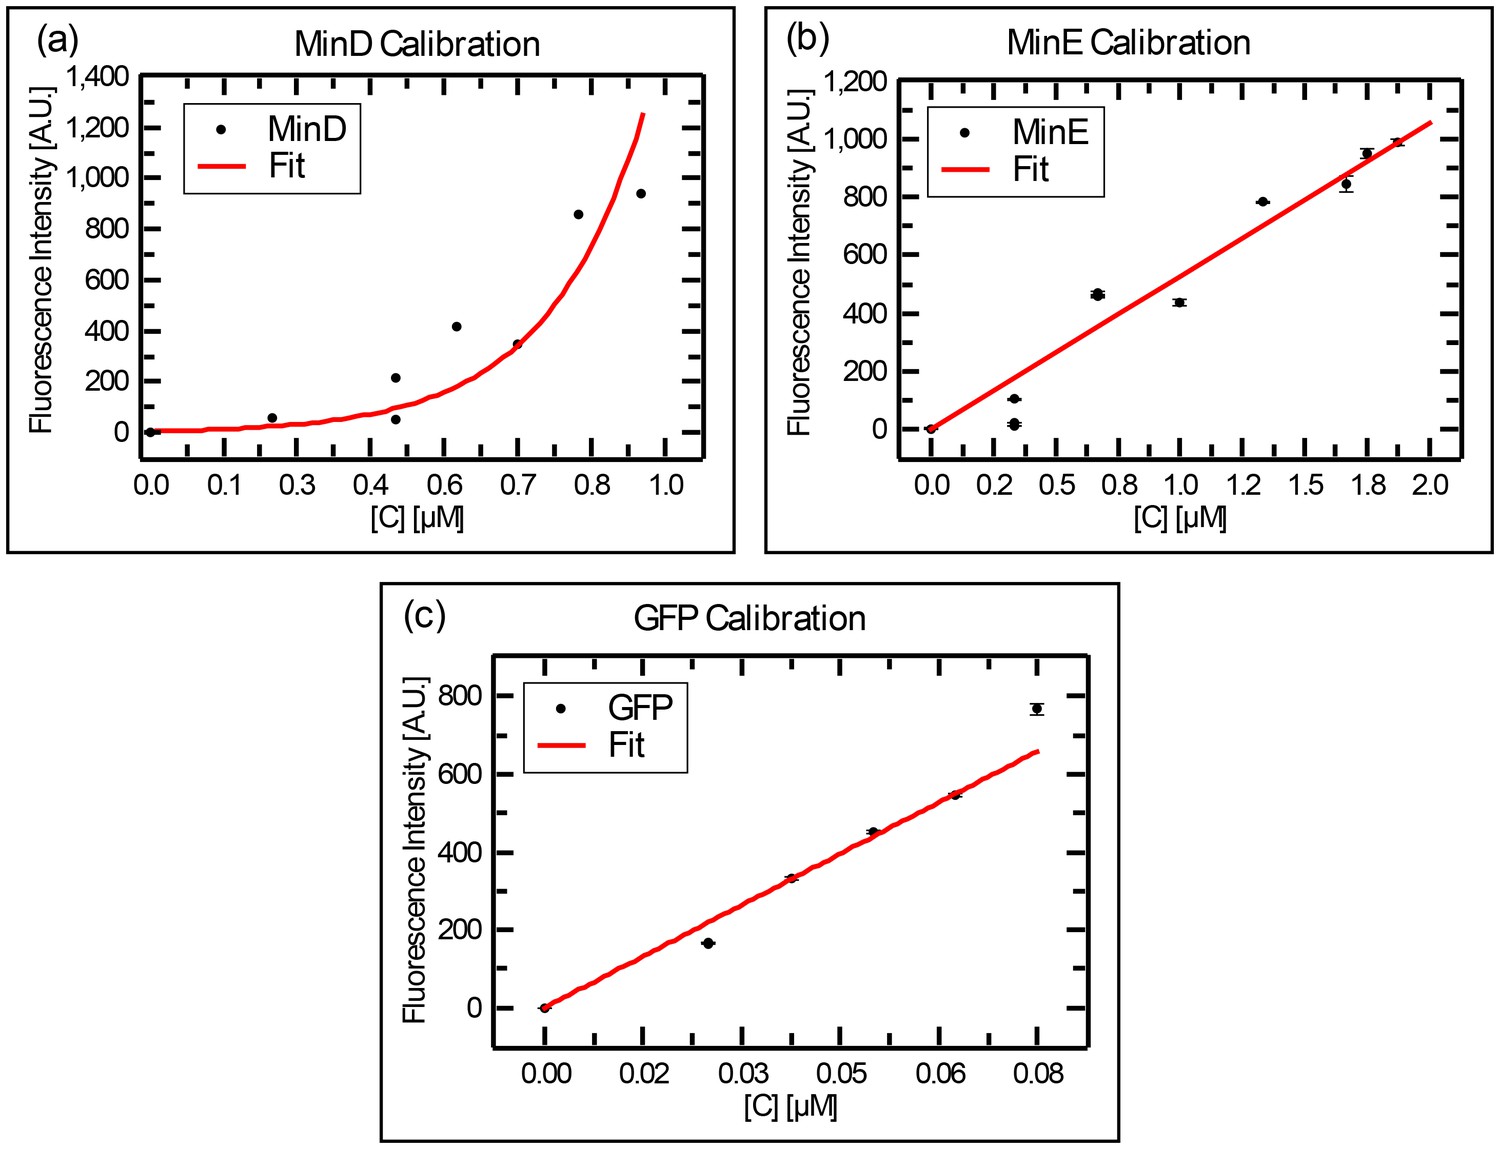
Calibration curves for the fluorescence intensity of (a) MinD, (b) MinE, and (c) GFP, as collected with a fluorometer.
Stock solution of MinD-Cy3 (14 μM) or MinE-Cy5 (25 μM) were diluted at various values and the resulted fluorescence was recorded on a Carry eclipse fluorometer. The same procedure was repeated for GFP.
Figure 6 with 1 supplement
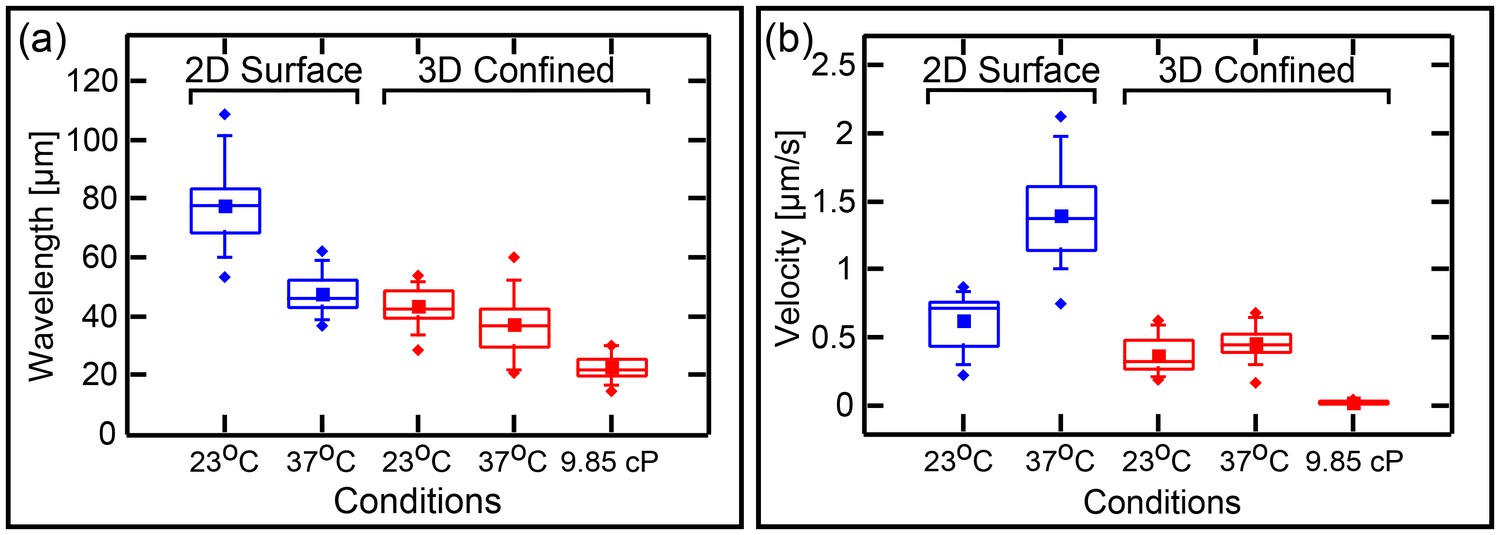
Wavelenght and Min patterns front propagation velocity.
(a) Statistical box plot representing the wavelength of the Min waves at different conditions: at room temperature and at 37°C, at flat SLB (blue) as well as inside the 3D confined chambers (red), and with high viscous medium in the chambers (at room temperature). The lines of each box represent the location of the 25, 50, and 75 percentiles. Full squares represent the location of the mathematical mean. Whiskers represent the 5 – 95 percentile range and the diamonds the minimum and maximum values of the data. (b) Velocity of Min pattern propagation at the same conditions. Box representation is the same as in (a). The analysis is based on the fluorescence signals of MinE.
Figure 6—figure supplement 1
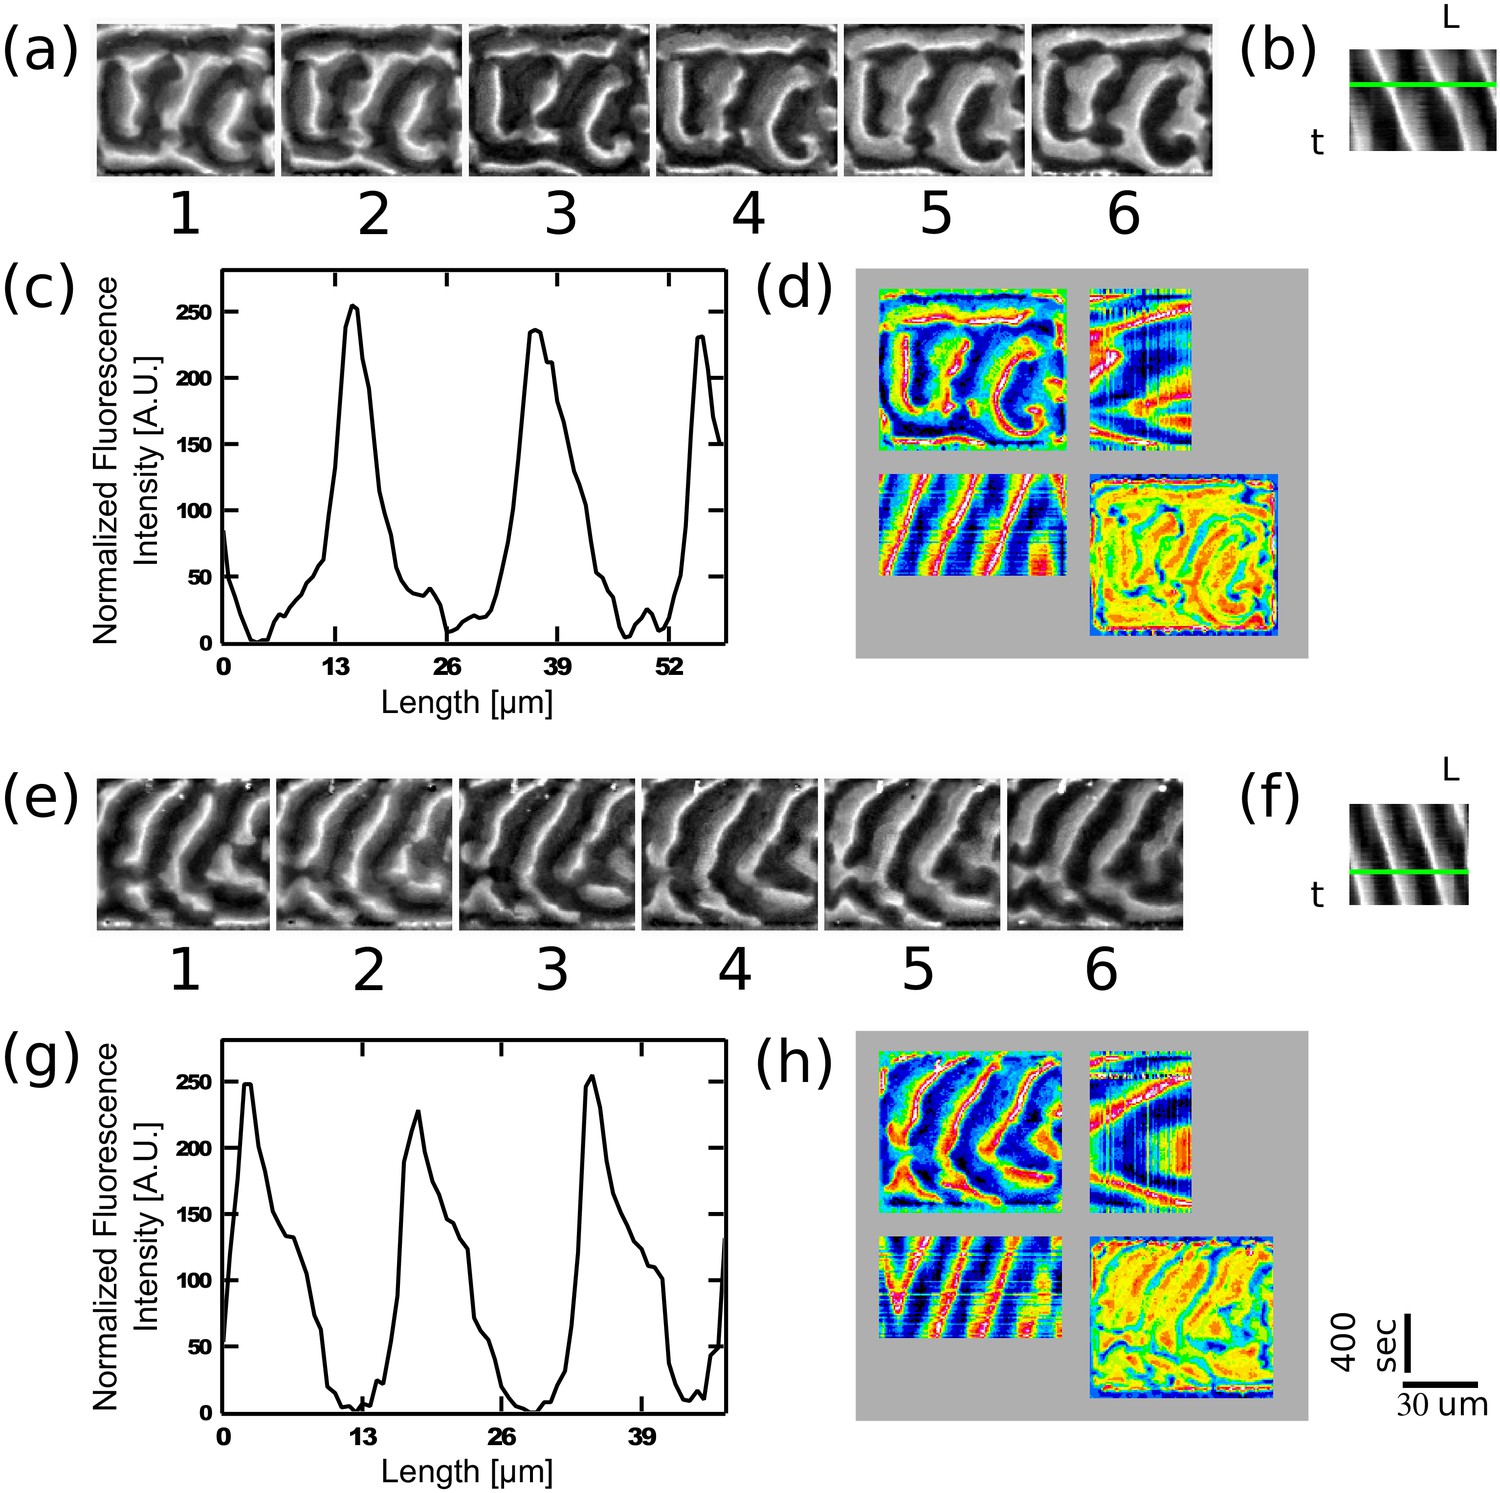
Examples of traveling waves in the chambers in the presence of a viscous media at 9.85 cP.
MinD (1.1 µM), MinE (1 µM), ATP (5 µM together with an ATP-regeneration system in a crowding solution (4% BSA, 4% PEG8000 and 4% Ficol 400) were injected into the chamber device. The panels show the MinE fluorescence signal. (a) and (e) Montage of the MinE signal in two chambers. Time difference between frames is 60 s. In order to calculate the wavelength, a self-written Matlab code was used (see Materials and methods section). A line was drawn manually along the wave propagation direction and the fluorescence intensity along this line was recorded and normalized for each frame. (b) and (f) Corresponding kymographs for (a) and (e) that were used in order to calculate the wavelength and the wave velocity. Wavelength was calculated by fitting a Gaussian function to the distribution of distances between the intensity peaks of these kymographs. Velocity was calculated based on the angle of the intensity peaks along the kymographs temporal direction. Wavelengths are equal to 20 ± 3 µm and 18 ± 0.7µm for (a) and (e) respectively. Velocities are equal to 0.024 ± 0.001 µm/s and 0.024 ± 0.001 µm/s for (a) and (e) respectively. (c) and (g) Normalized fluorescence intensity along the green line in panels (b) and (f) respectively. (d) and (h) Quadrant representation on the Min behavior in these two chambers. Format of the representation is similar to the one in Figure 2e. Scale bars for all panels (30 µm and 400 s) are shown on the bottom right.
Videos
Video 1
Isolation of 3D confined chambers from the rest of the chip.
After the SLB was formed in the device, as described in the Materials and methods, the chip was connected to a syringe pump containing Min buffer. A flow of 75−150 µl/h was applied (green traffic light). The application of buffer flow resulted in migration of the SUVs that did not splash during the previous incubation period on the chambers walls along the stream lines. After ∼3 min the valves were closed and the flow was stopped (red traffic light). This resulted in an immediate halt of the SUVs flow, showing that the chambers were isolated from the rest of the chip. In order to show reversibility of the valves operation, after additional ∼1.5 min, the valves were opened (second round of green traffic light). Immediately upon releasing the pressure in the pressure valves, the SUVs started to flow again, showing that the halting of the flow was the result of the valves operation and did not result from, say, stopping the syringe pump operation. Of course, stopping the operation of the syringe pump will also result in a halt of the flow in the microfluidic device. However, due to pressure-difference equilibration, this process usually lasts couple of minutes. In contrast, upon operating the valves, an immediate halt in the flow was observed.
Video 2
Movies of Min patterns formation in chambers with different sizes that were used for the construction of Figure 2e of the main text.
https://doi.org/10.7554/eLife.19271.010Additional files
-
Supplementary file 1
Examples of in vivo oscillations in live cells.
(a–d) Four examples of in vivo MinD oscillations in cells with various length of strain FW1919 (see Wu et al., 2016) Mol Sys Biol 12: 873). Panels show montages of the corresponding supporting Supplementary file 2. Time difference between frames is 12 s. Scale bar (5 μm) is shown to the left of panel (d). Cell boundaries are marked in white. (a) Pole-to-pole oscillations in a wild type cell of normal length (3.8 μm). (b) A triple-node oscillations in a Cephalexin-division-inhibited cell with a length of 11.9 μm. (c) Multiple-node oscillations in a Cephalexin-division-inhibited cell (19.9 μm). (d) Aberrant triple-node oscillations in a Cephalexin-division-inhibited cell (14.4 μm). For the last case, instead of the regular pattern, where triple-point-oscillations occur between a middle zone and the two poles (see panels (b and f)), the middle zone seems to originate in the center of the cell and while traveling toward one pole, a MinD zone is established on the opposite pole. (e–h) Corresponding kymographs of the MinD intensity along the cells’ length for panels (a–d) respectively. Scale bar for the kymographs are shown next to panel (h).
- https://doi.org/10.7554/eLife.19271.020
-
Supplementary file 2
Examples of Min oscillations in vivo in strain BN1919 (see Wu et al., 2016) Mol Sys Biol 12: 873).
Movie corresponds to Supplementary file 1. Fluorescence signal represents MinD oscillations.
- https://doi.org/10.7554/eLife.19271.021
Download links
A two-part list of links to download the article, or parts of the article, in various formats.
Downloads (link to download the article as PDF)
Open citations (links to open the citations from this article in various online reference manager services)
Cite this article (links to download the citations from this article in formats compatible with various reference manager tools)
Mapping out Min protein patterns in fully confined fluidic chambers
eLife 5:e19271.
https://doi.org/10.7554/eLife.19271


