Combinatorial bZIP dimers display complex DNA-binding specificity landscapes
- University of Wisconsin-Madison, United States
- Massachusetts Institute of Technology, United States
- University of Wisconsin-Madison, Unites States
Figures
Figure 1 with 5 supplements
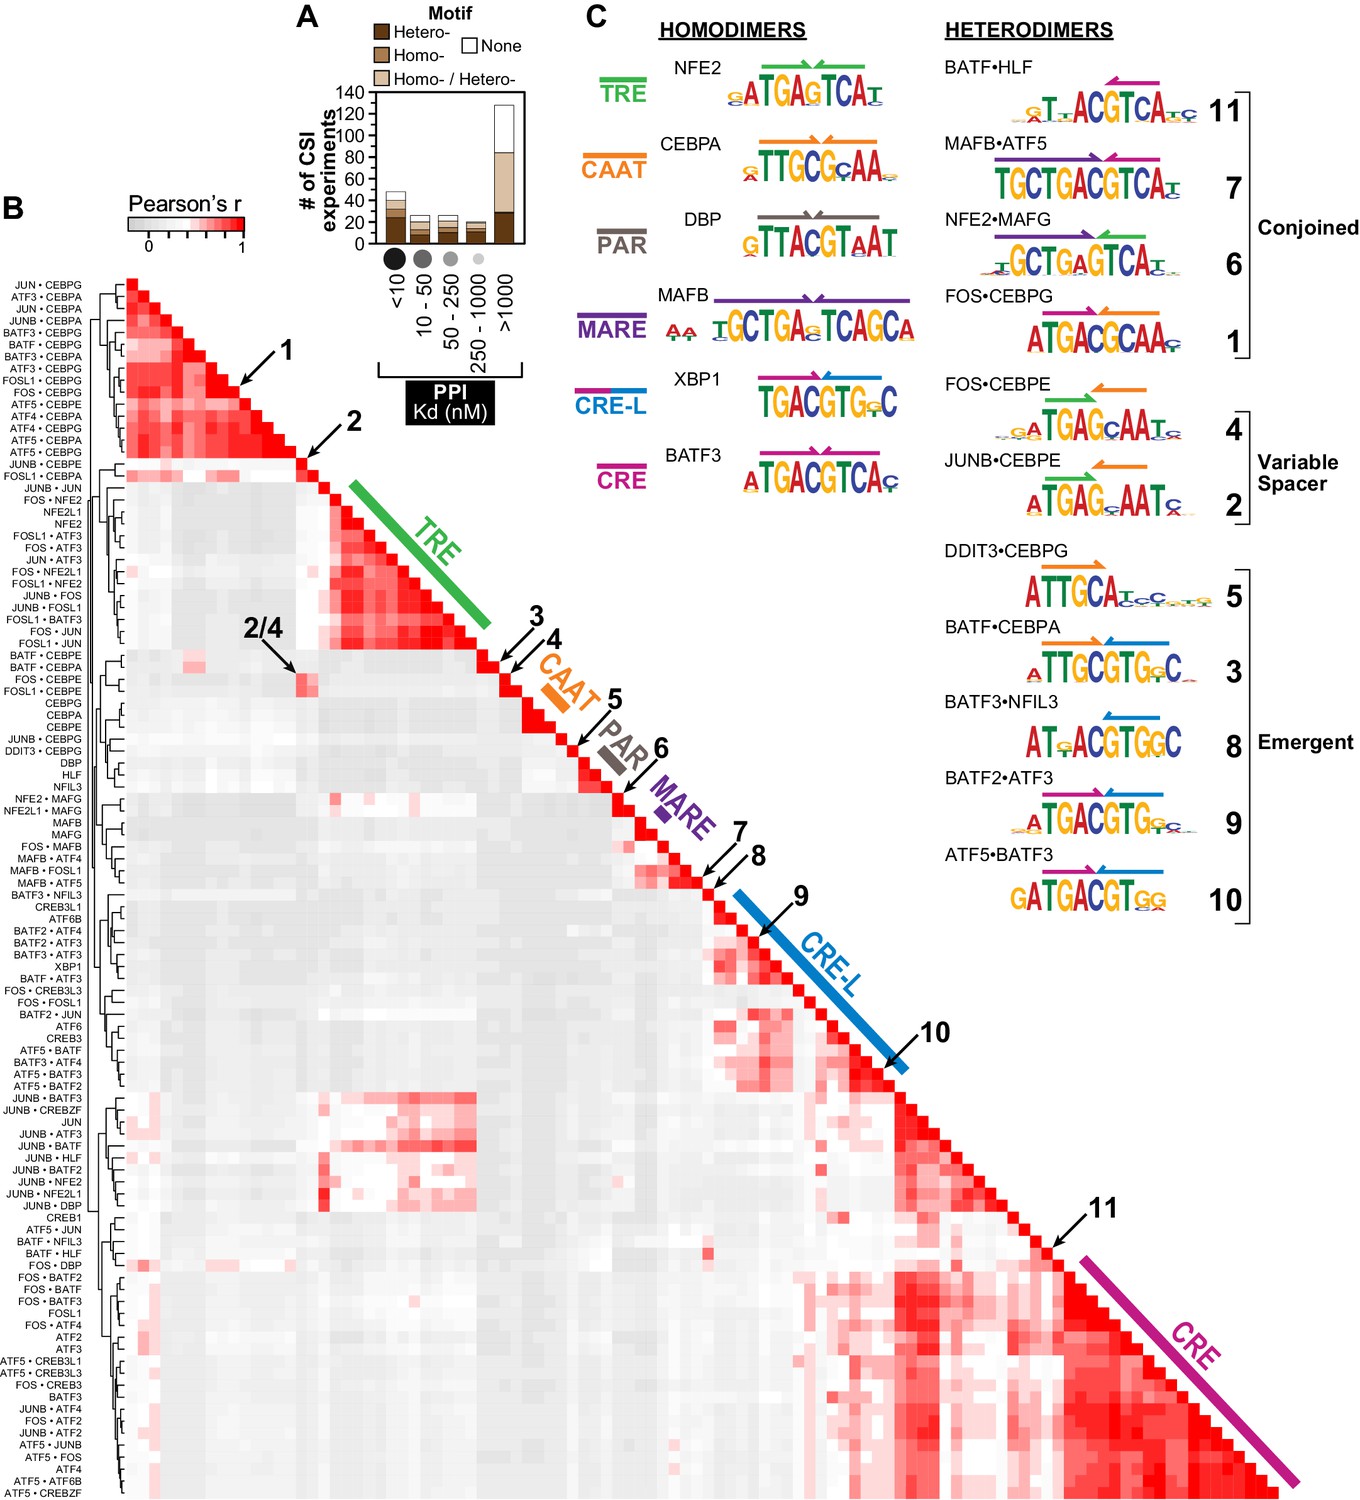
Overview of human bZIP homodimer and heterodimer DNA-binding specificities.
(A) Summary of SELEX-seq results categorized by protein-protein interaction (PPI) affinity (Reinke et al., 2013). Specificity profiles were classified as resulting in a motif arising from DNA binding by either a homodimer (brown) or a heterodimer (dark brown), or not resulting in a motif (white). Some profiles could not be unambiguously assigned to a homo vs. heterodimer (light brown). (B) Pairwise comparisons of the DNA-binding preferences of 102 bZIP dimers (22 homodimers and 80 heterodimers) using the z-scores for 1222 unique 10 bp sequences corresponding to the 50 top ranked sequences for each dimer. Throughout the paper, the biotinylated bZIP is listed first when describing a heterodimer. (C) Representative motifs bound by bZIP homodimers and heterodimers reported in this study. Heterodimer motifs were grouped as Conjoined, Variable spacer, and Emergent. The color code defined here for half sites (colored arrows above motifs) is used throughout the figures.
-
Figure 1—source data 1
Data for Figure 1C.
Pairwise comparison (Pearson's correlation) of the DNA-binding preferences of 102 bZIP dimers using the CSI intensity for 1222 10 bp sequences.
- https://doi.org/10.7554/eLife.19272.004
Figure 1—figure supplement 1
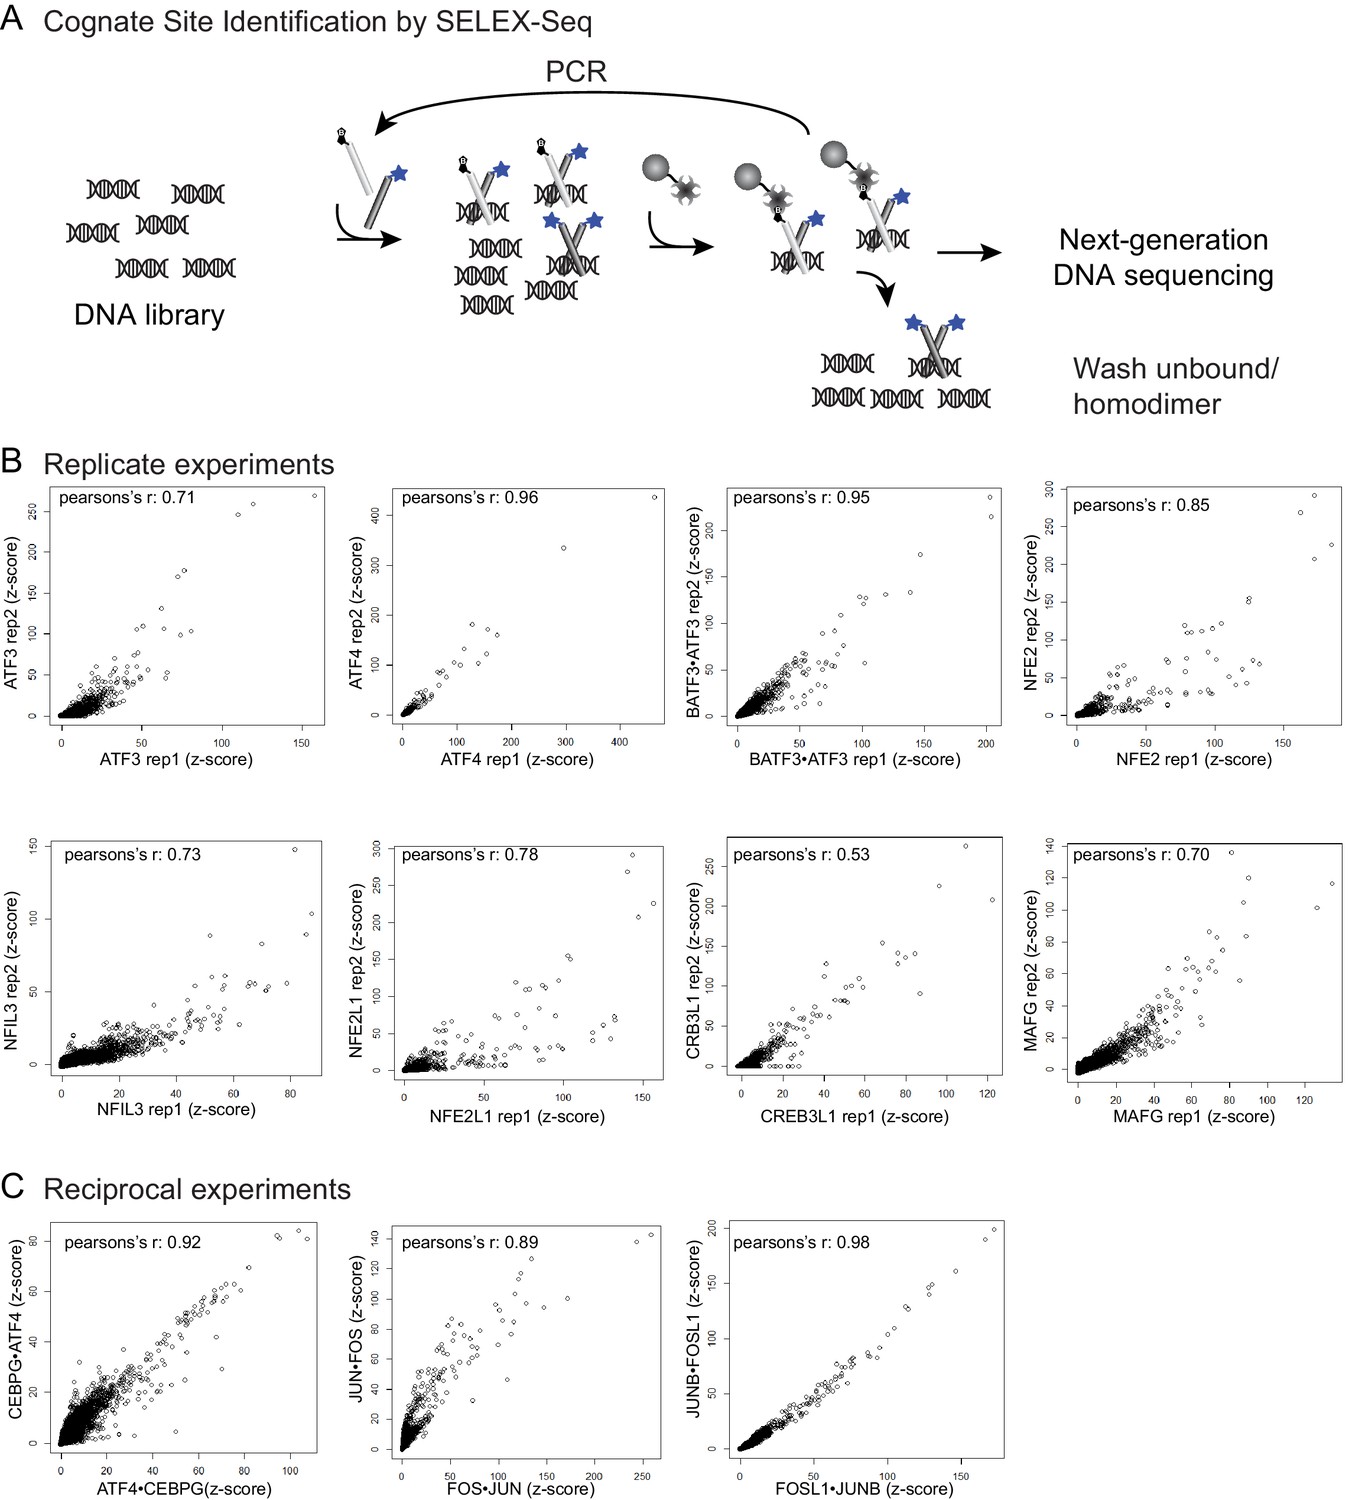
Cognate site identification by SELEX-sequencing.
(A) In CSI by SELEX-seq, a DNA library with a randomized 20 bp region is incubated with a bZIP pair in which one bZIP partner (light grey) was biotinylated and the other partner (light grey) was labeled with fluorescein (blue star). bZIP partners were mixed in 3:1 molar ratios with the biotinylated partner at the lower concentration. Affinity purification using the less abundant biotinylated partner enriched for heterotypic dimers. (B) Reproducibility of CSI by SELEX-Seq. Scatter plots of CSI intensities (z-scores) for all 10-mers for replicate samples and (C) reciprocal samples.
Figure 1—figure supplement 2
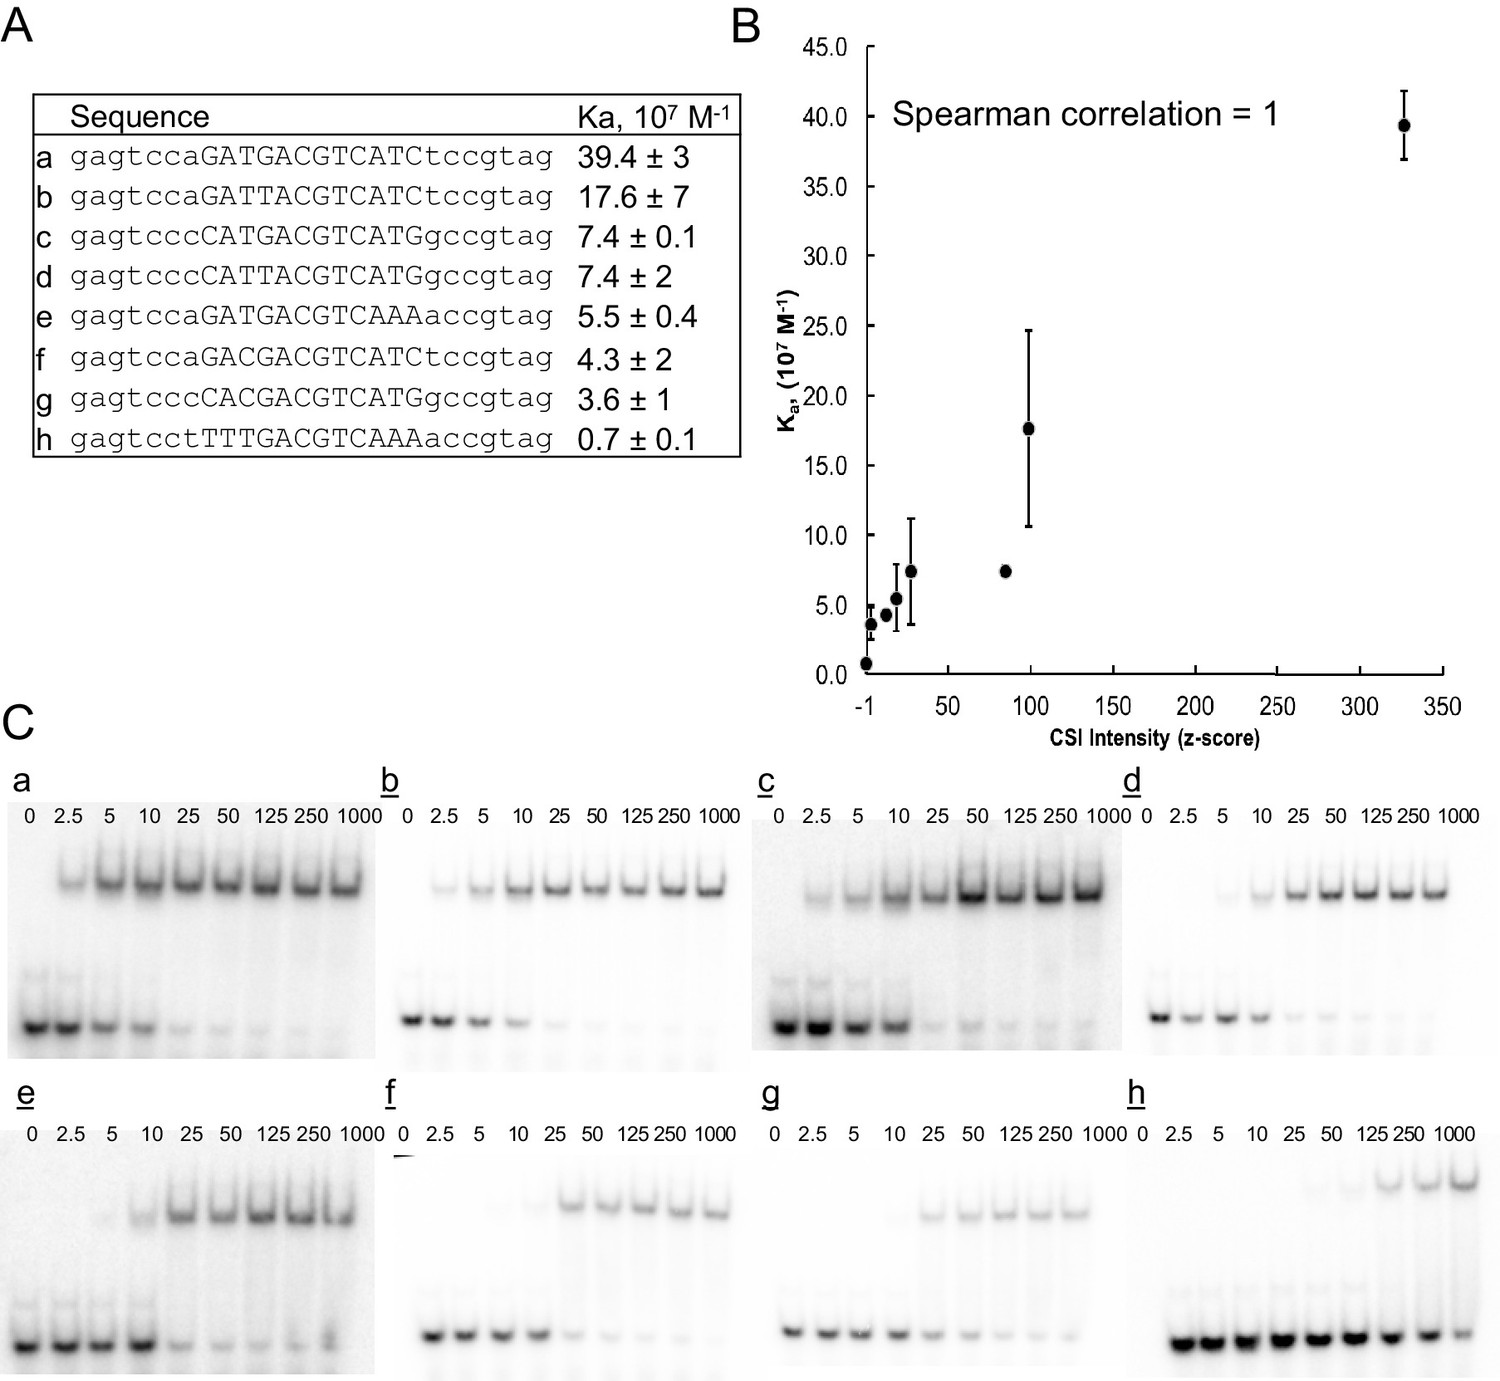
ATF3 CSI Intensity (z-score) correlates with equilibrium association constant.
(A) DNA sequence of oligonucleotides used for determining binding constants. (B) Correlation between CSI intensity (z-score) and association constant (Ka) for ATF3. Binding constants were measured by EMSA. Error bars are ± S.D. of at least duplicate measurements. (C) Representative autoradiographs of EMSA experiments from which binding constants were calculated using non-linear regression.
Figure 1—figure supplement 3

Pairwise comparison of bZIP homodimers reported in this study and bZIP dimers reported by Jolma et al.
(Jolma et al., 2013). (A) Hierarchical clustering was performed using the CSI intensities (z-scores) of 871 unique 10 bp sequences corresponding to the 50 top ranked sequences identified from each dimer. Corresponding bZIP pairs are highlighted in matching color. (B) Scatter plots comparing CSI intensity (z-score) for all 10-mers of bZIP dimers from this study with bZIP dimers previously reported by Jolma et al. (2013). (top left) BATF3 vs. BATF3; (top right) CEBPG vs. CEBPG; (bottom left) ATF4 vs. ATF4; (bottom right) ATF4 vs. ATF4•CEBPG.
Figure 1—figure supplement 4
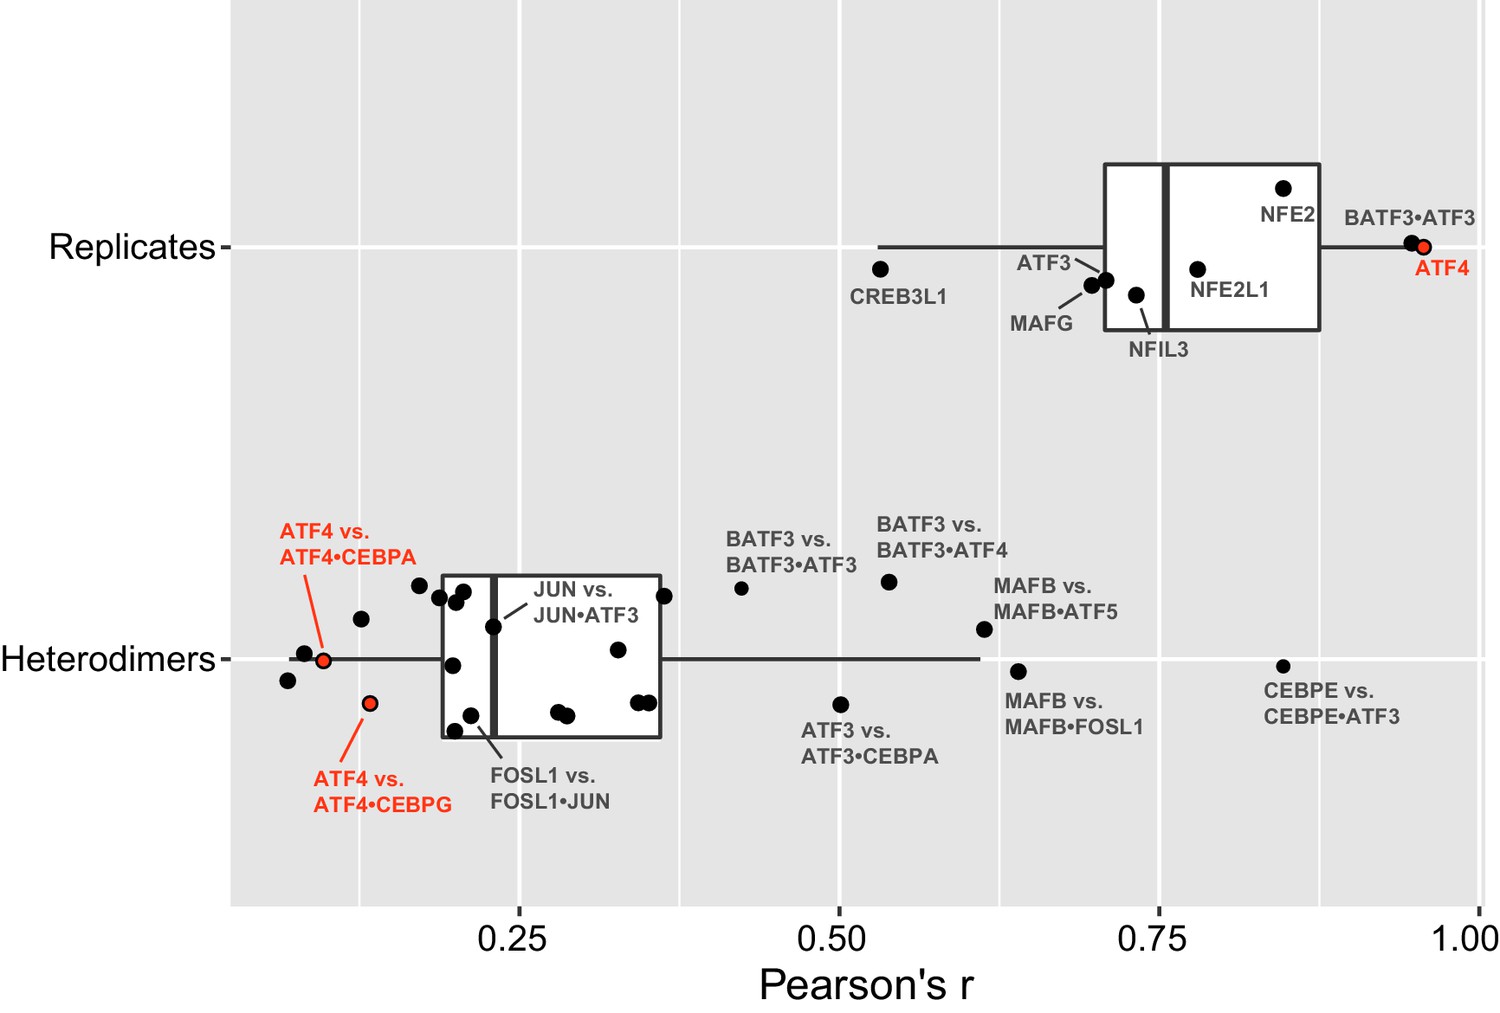
bZIP heterodimer specificity.
Pearson’s correlations (r) of all 10-mers between replicate experiments of bZIP dimers (top), and correlations between a bZIP heterodimer and the bZIP homodimer that was used to pull-down the heterodimer. The average (± standard deviation) Pearson’s correlation (r) for eight replicate samples was 0.8 ± 0.1.
Figure 1—figure supplement 5
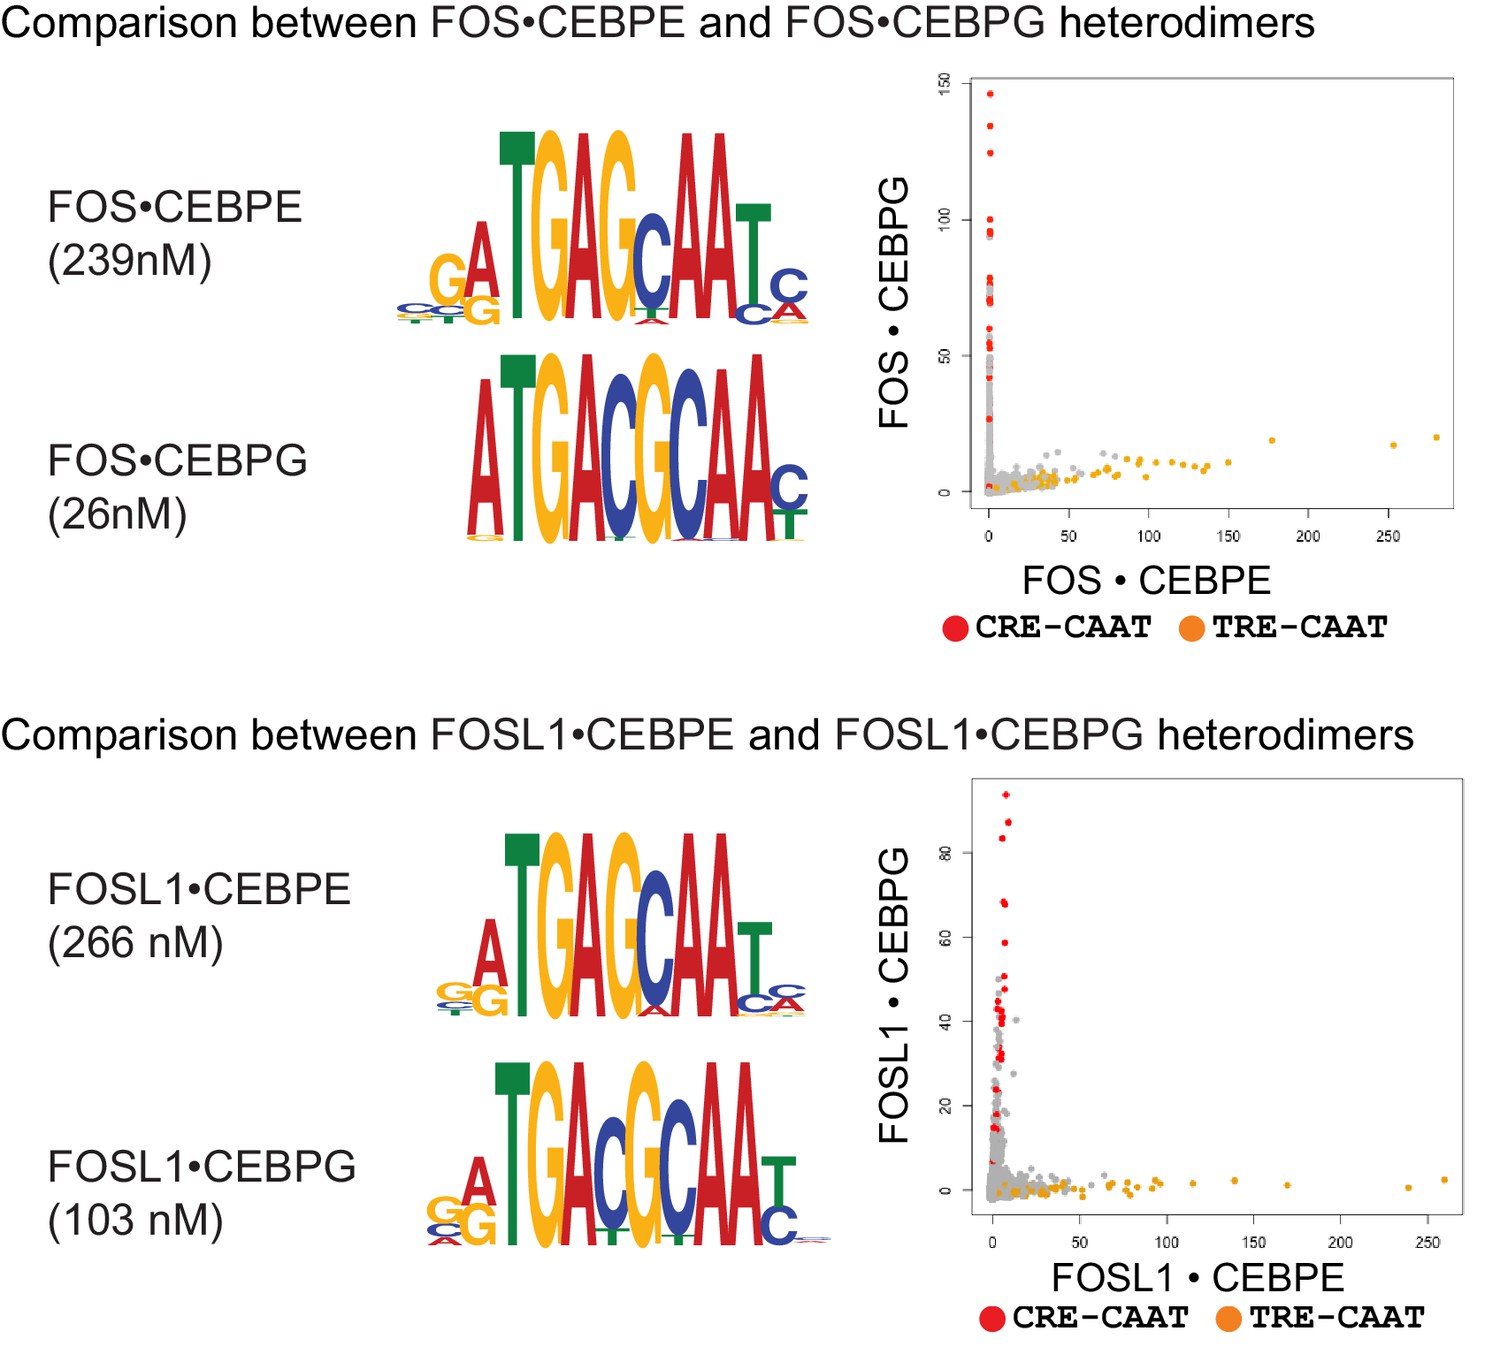
DNA sequence preferences for FOS•CEBPE, FOS•CEBPG, FOSL1•CEBPE, and FOSL1•CEBPG.
Left, PPI affinity for the corresponding heterodimer is shown. Middle, MEME motifs are represented as DNA logos. Right, 2-dimensional scatter plots comparing the CSI intensities for all 10-mers. CRE/CAAT (TGACGTAA) sites are colored red, and TRE/CAAT (TGAGCAA) sites are colored orange.
Figure 2
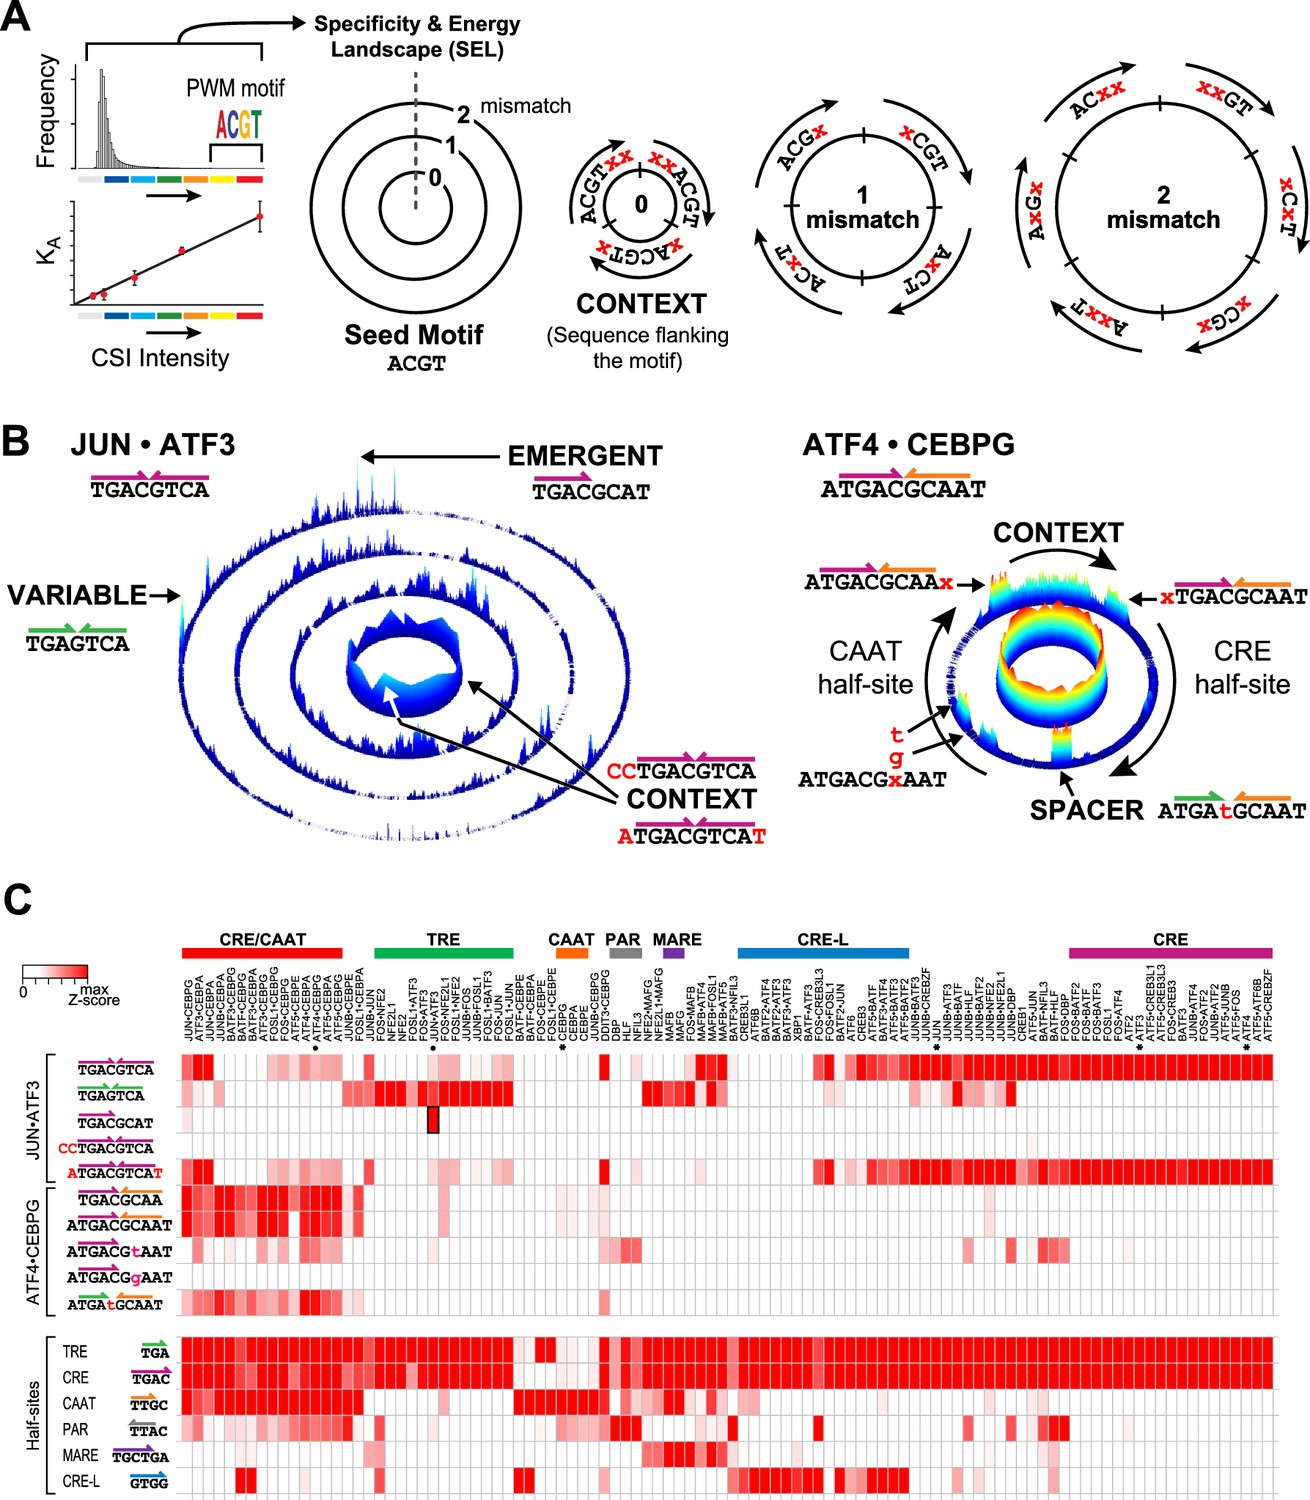
Specificity and energy landscapes (SELs) and motifs for bZIP heterodimers.
(A) SEL displays CSI intensities for all sequence permutations of a given binding site size (k-mers). Sequences are organized with respect to any selected seed motif; however, a k-mer representing PWM-derived motif is typically used. CSI intensities correlate with equilibrium binding affinities. As an example, the arrangement of 6-mer sequences for a simplified 4-mer seed motif is shown. The innermost circle displays the intensities for all sequences that have an exact match to the seed motif (0-mismatch ring). In this ring, sequences are arranged in a clockwise manner with sequences that include residues 5′ of the seed motif at the start, sequences with residues that flank both 5′ and 3′ ends in the middle, and 3′ flanking sequences at the end (context). The subsequent 1-mismatch ring contains the sequences that differ at one position from the seed. The sequences are organized clockwise starting with mismatches at the first position and ending with mismatches at the last position of the motif. Within each sector, the mismatches at a given position (indicated by x) are organized in alphabetical order (A, C, G, and T). The 2-mismatch ring contains all permutations with two positional differences with the seed, similarly ordered. (B) Left, SEL for JUN•ATF3 heterodimer using CRE (5′TGACGTCA3′) as the seed motif. By displaying the 10 bp sequence space, preferred sequences become apparent. Peaks corresponding to emergent and variably-spaced sites are identified by arrows. Right, SEL displaying 12 bp sequences for ATF4•CEBPG heterodimer using CRE-CAAT (5′ATGACGCAAT3′) as the seed motif. (C) Heatmap of the relative CSI intensities of 102 bZIP dimers (columns) for the 10 sites highlighted in Figure 2B as well as constituent half-sites of the six classic bZIP motifs (rows). Displayed is the maximum CSI intensity of all the 10 mers matching the site. bZIP dimers are listed in the same order as in Figure 1B. ATF3, ATF4, CEBPG, and JUN homodimers are marked by asterisks. While bZIPs do not bind as monomers to half-sites, the occurrence of bZIP half-sites within motifs is displayed in the second set of rows to enable comparison between the half-site preferences versus the CSI intensity for motifs that display these half-sites in different combinations or in different contexts.
-
Figure 2—source data 1
Data for Figure 2C.
Relative CSI intensity for 102 bZIP dimers for different DNA-binding sites and half-sites.
- https://doi.org/10.7554/eLife.19272.011
Figure 3 with 2 supplements
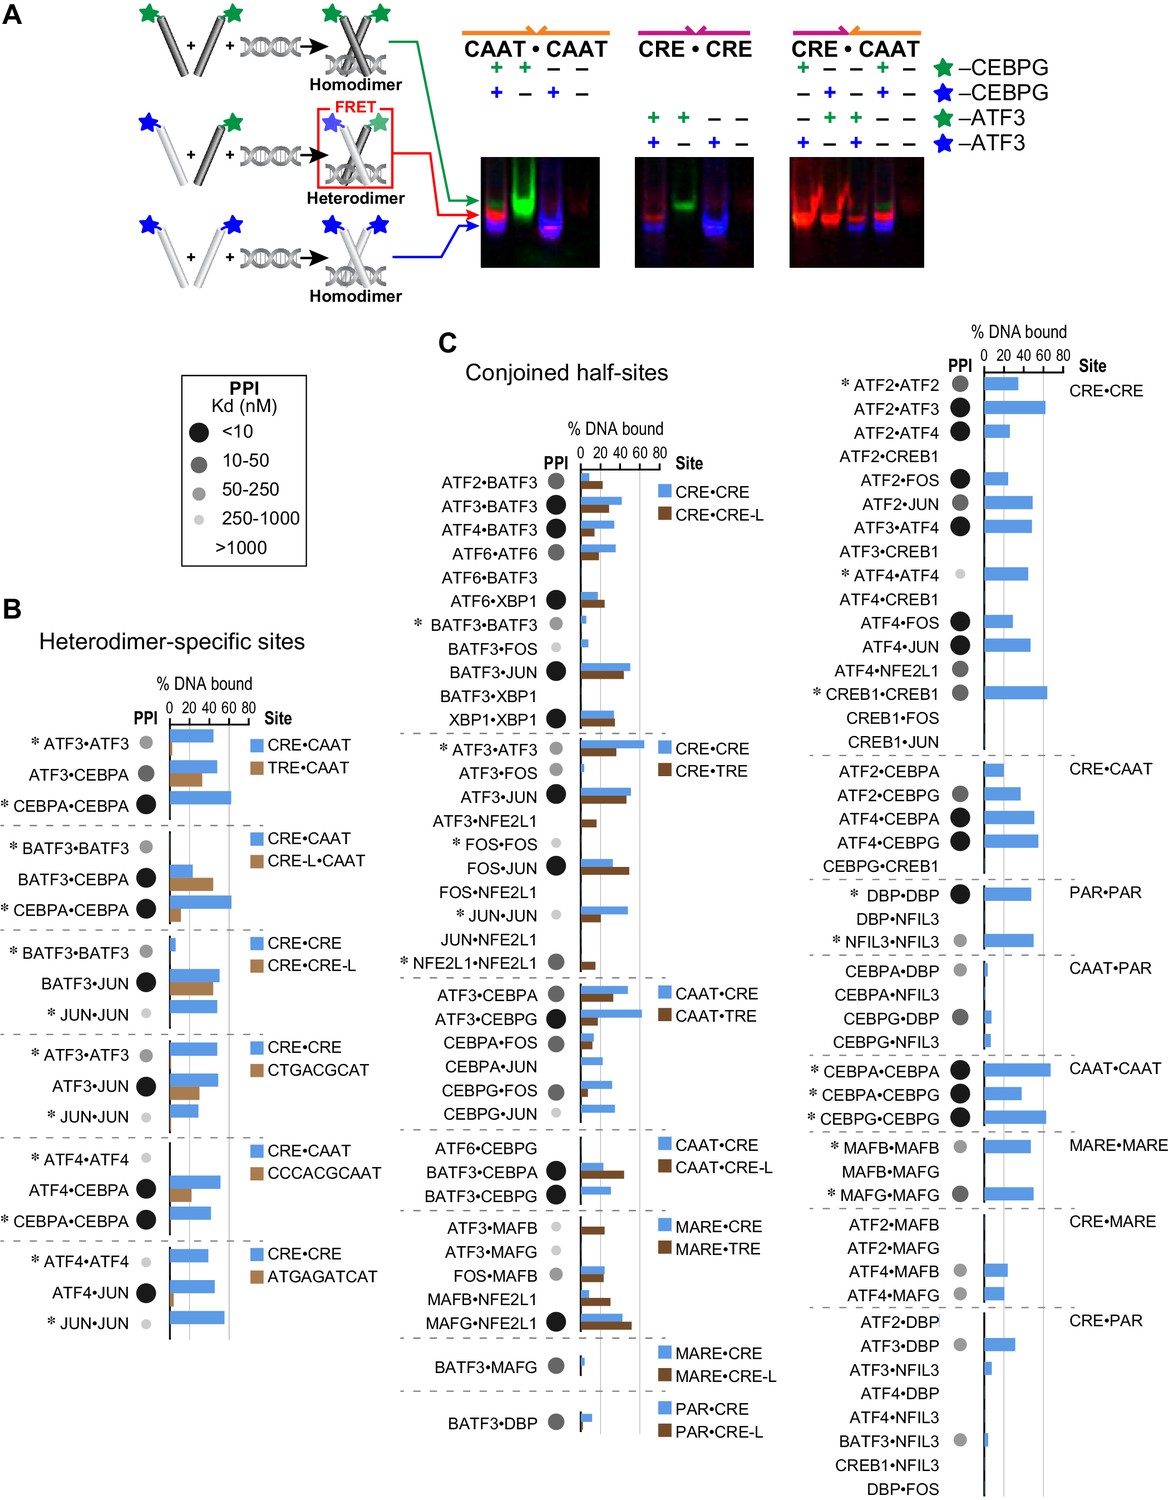
Influence of bZIP protein dimerization on DNA binding.
(A) EMSA-FRET assay used to quantify bZIP heterodimers and homodimers binding to DNA. Fluorescein and TAMRA are depicted as blue and green stars, respectively. In the EMSA gel, homodimers give rise to pseudo-colored blue (fluorescein) or green (TAMRA) signals, whereas heterodimers give a FRET signal that is pseudo-colored red. (B) EMSA-FRET results for bZIP dimers binding to selected heterodimer-specific emergent sites (brown) and conjoined half-sites (blue). Bar graphs show the percent of the indicated DNA oligomer bound by each dimer. The PPI strength of each dimer is indicated with gray-scale circles sized according to the Kd for a given protein-protein interaction. Homodimers are marked with an asterisk (*). (C) EMSA-FRET results for bZIP dimers tested for binding to DNA sites composed of conjoined half-sites. Left, dimers tested against two different sites composed of conjoined half-sites. Right, dimers tested against a single site. Data are displayed as in B.
Figure 3—figure supplement 1

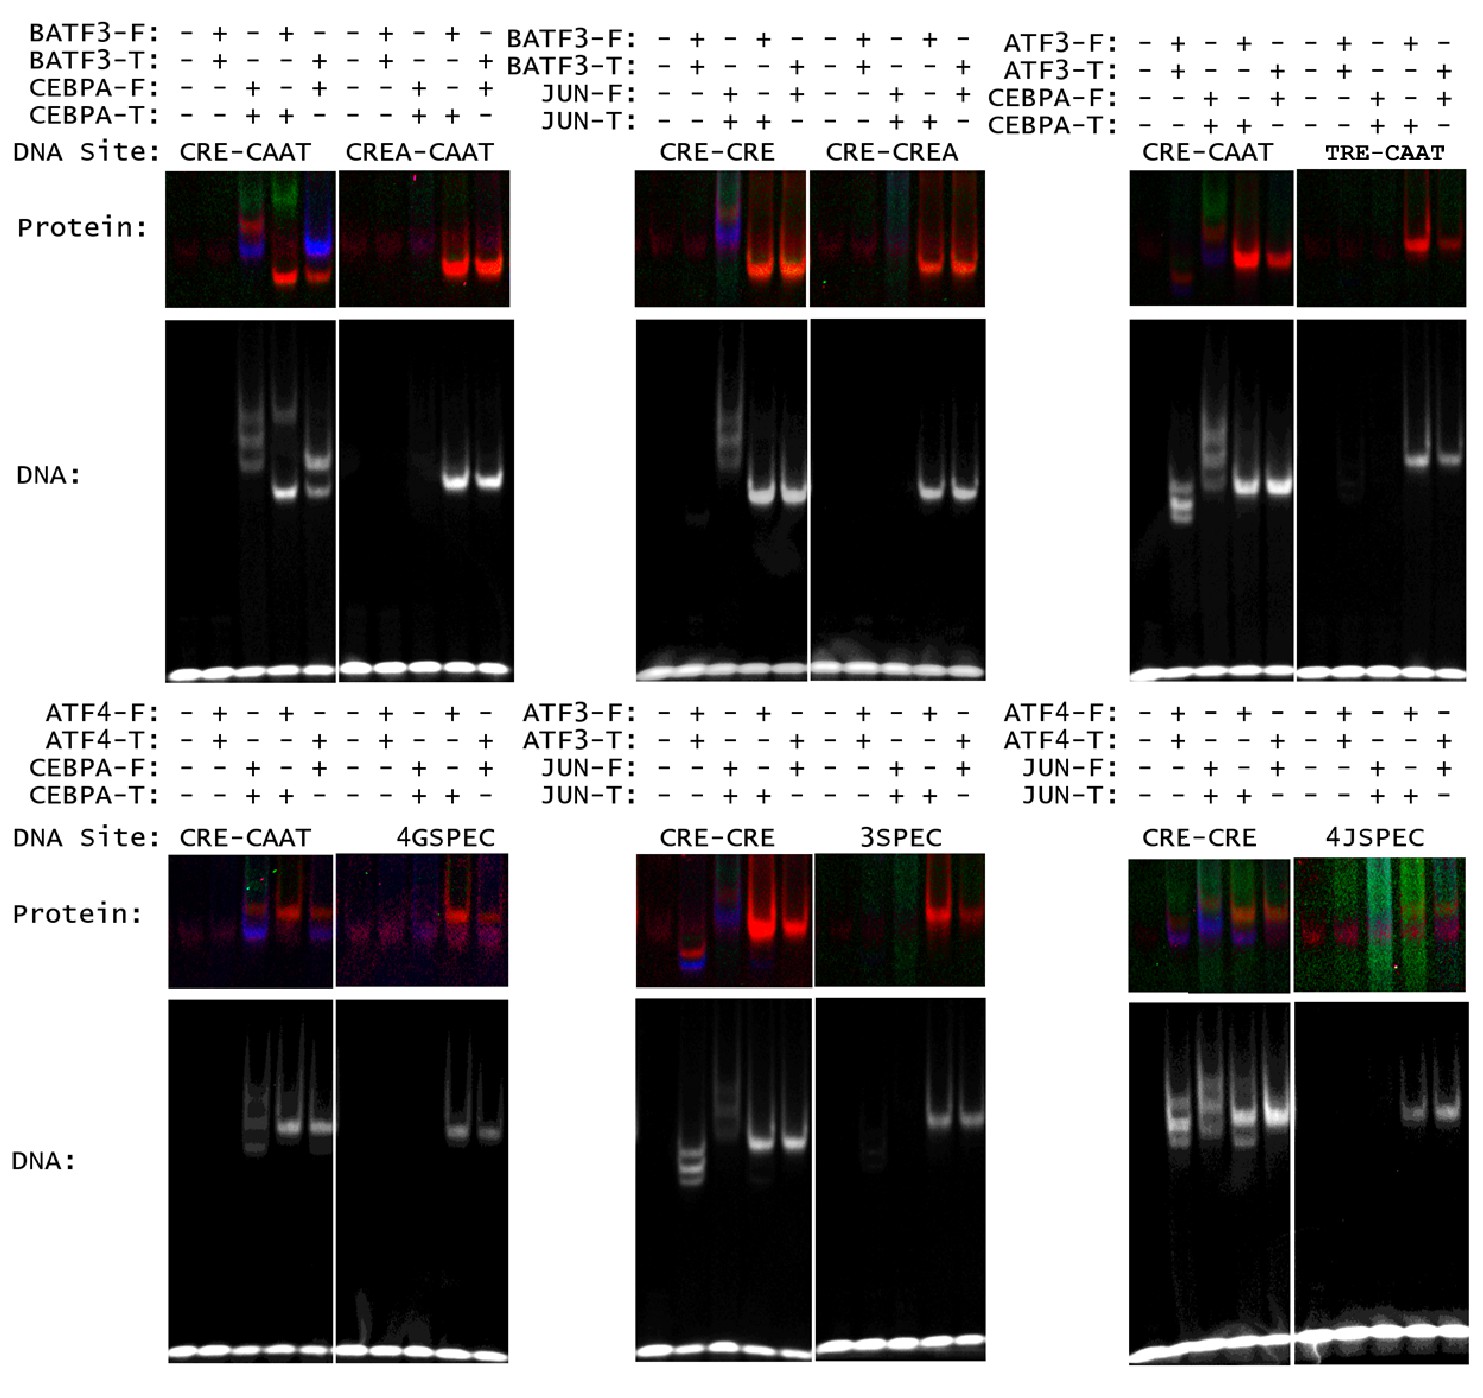
Influence of bZIP protein dimerization on DNA binding.
(A) Detecting heterodimer DNA complexes using an EMSA-FRET assay. Top, Fluorescein signal in blue, TAMRA signal in green, and FRET signal in red. Bottom, TYE 665 labeled DNA site. (B) Three examples to explain the notation used in part C summarize data for DNA binding by homodimers and heterodimers composed of (left) ATF3 and DBP, (middle) ATF3 and CEBPA and (right) BATF3 and JUN. Within each example, rows indicate different bZIP dimers. The top row describes the homodimer formed by the first-mentioned bZIP, the bottom row is for the other homodimer, and the middle row contains data for the heterodimer. Within each example, each column represents binding to a different DNA site composed of two half-sites. DNA-binding affinity is indicated using a green-scale heatmap with key indicating % binding at far right. The color of the cell border indicates strength of the protein-protein interaction as measured previously by FRET, indicated by yellow-scale heatmap at right. ATF3•DBP example: top row is ATF3 binding to CRE-PAR, middle row is ATF3 • DBP heterodimer binding to CRE-PAR, bottom is DBP homodimer binding to CRE-PAR. ATF3•CEBPA example: Top row is ATF3 homodimer, middle row is ATF3 • CEBPA heterodimer, and bottom row is CEBPA homodimer. Binding is to CRE-CAAT in left column and TRE-CAAT in right column. BATF3•JUN example: Top row is BATF3 homodimer, middle row is BATF3 • JUN heterodimer and bottom row is JUN homodimer. Binding is to CRE-CRE in left column and CRE-CREA in right column. (C) Complete set of EMSA-FRET data. Examples in B are included in this grid and other cells can be interpreted analogously.
Figure 3—figure supplement 2
Heterospecific binding of DNA.
Top, DNA sequences composed of optimal half sites. Bottom, comparison of an optimal DNA site to a heterodimer-specific non-optimal DNA site. DNA sequences for EMSA-FRET experiments are reported in Supplementary file 1D.
Figure 4
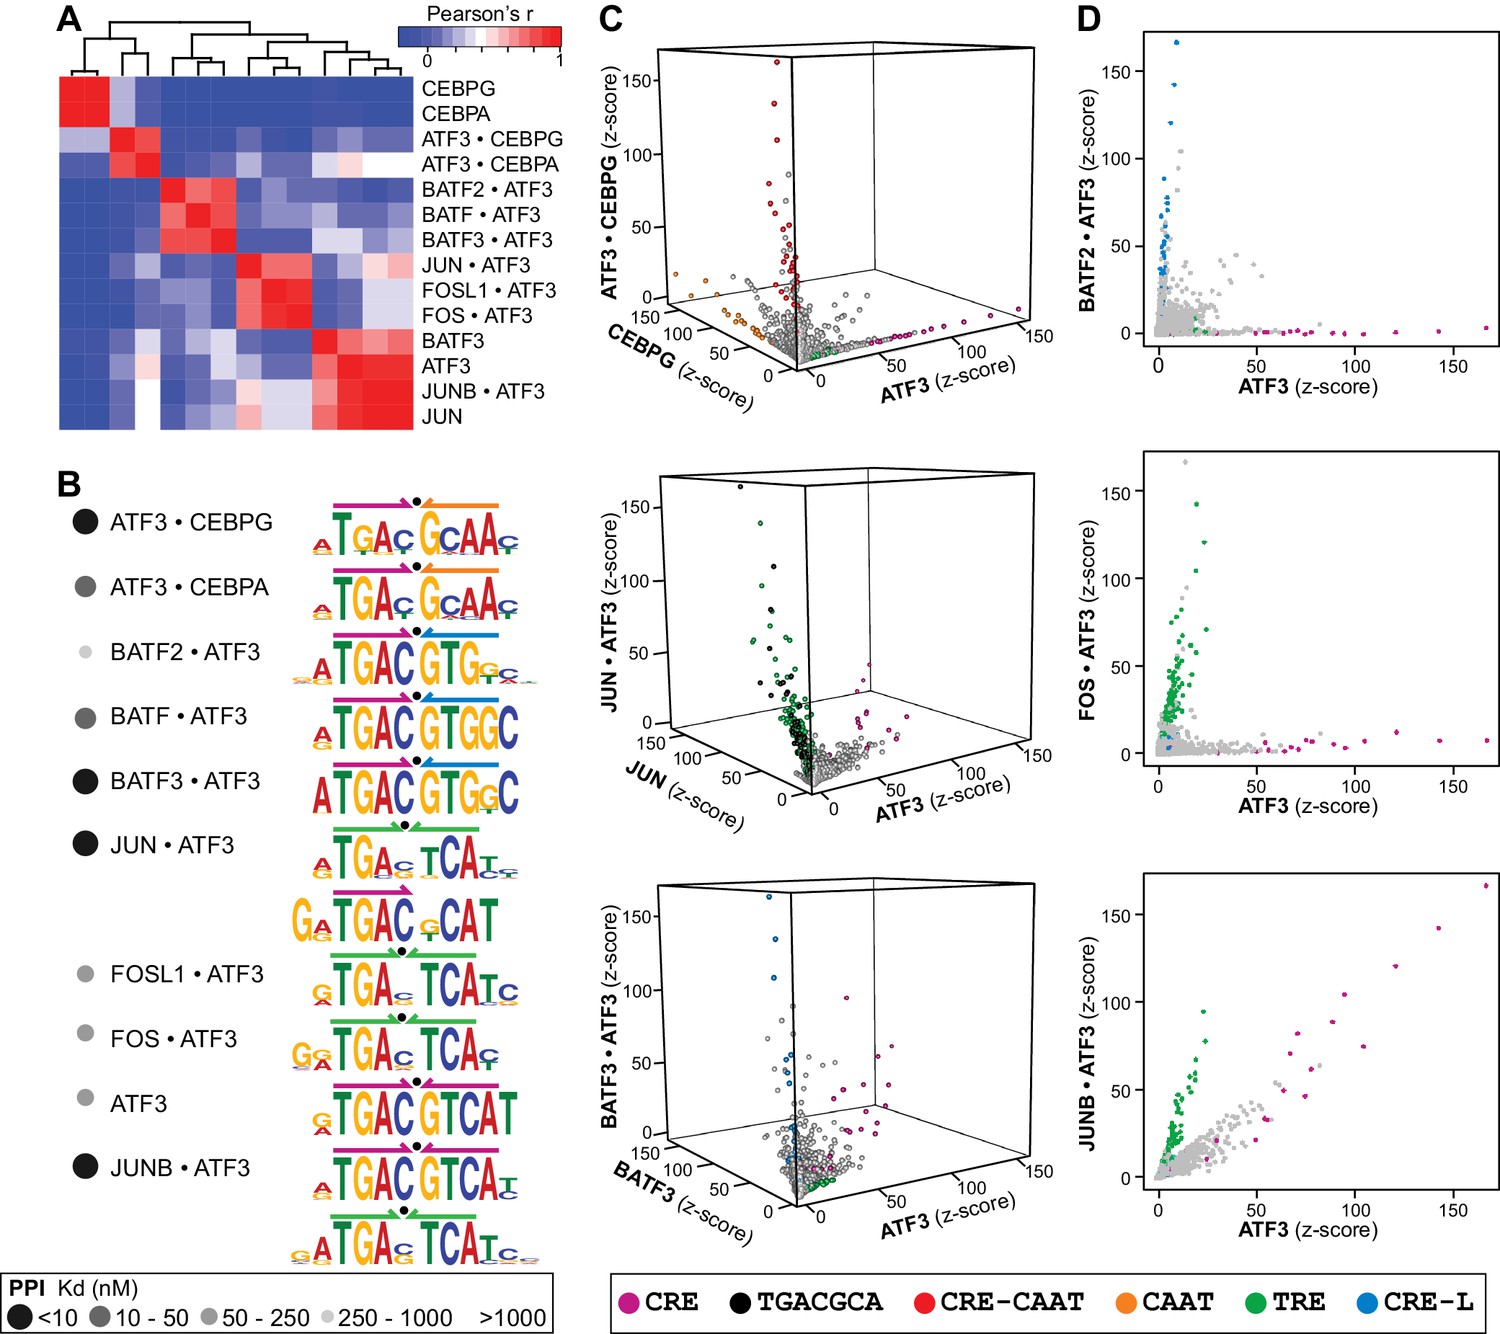
ATF3 heterodimers bind a range of distinct cognate sites.
(A) Hierarchical clustering of pairwise comparisons of DNA-binding specificity (10-mers) for ATF3 homodimer and 9 ATF3-containing heterodimers. (B) DNA logos showing the MEME motifs derived from the top 1000 12-mer sequences for ATF3 homodimer and ATF3-containing heterodimers. Grey-scale circles next to dimer names indicate PPI strength using the scale from Figure 3. (C) 3-dimensional and (D) 2-dimensional scatter plots comparing the DNA-binding specificities of bZIP homodimers vs. ATF3-containing heterodimers. Scatter plots of quantile-normalized CSI intensities (z-scores) of ATF3 dimers for 80,000 10-mers are shown.
Figure 5 with 1 supplement

ATF3 binds to different genomic regions using diverse motifs.
(A) Venn diagram of the numbers of ATF3-bound regions determined by ChIP-seq in different cell lines. (B) Heatmap of the False Positive Rate (FPR)-cutoffs at which ATF3 ChIP-seq peaks (rows) are detected as positive for ATF3 or ATF3-dimer binding. Peaks were scored using CSI intensities of the ATF3 homodimer or ATF3-containing heterodimers (columns) in H1hESCs, K562, and HEPG2 cells, and clustered by FPR-cutoffs across all dimers. (C) Same as (B) for the glioblastoma multiforme (GBM1) cell line. Highlighted clusters (blue and green) contain DNA motifs preferred by different ATF3 dimers and are enriched with different Gene Ontology Biological Process terms. False Discovery Rates (q-values) for each GO term are shown. See Supplementary file 1H.
Figure 5—figure supplement 1
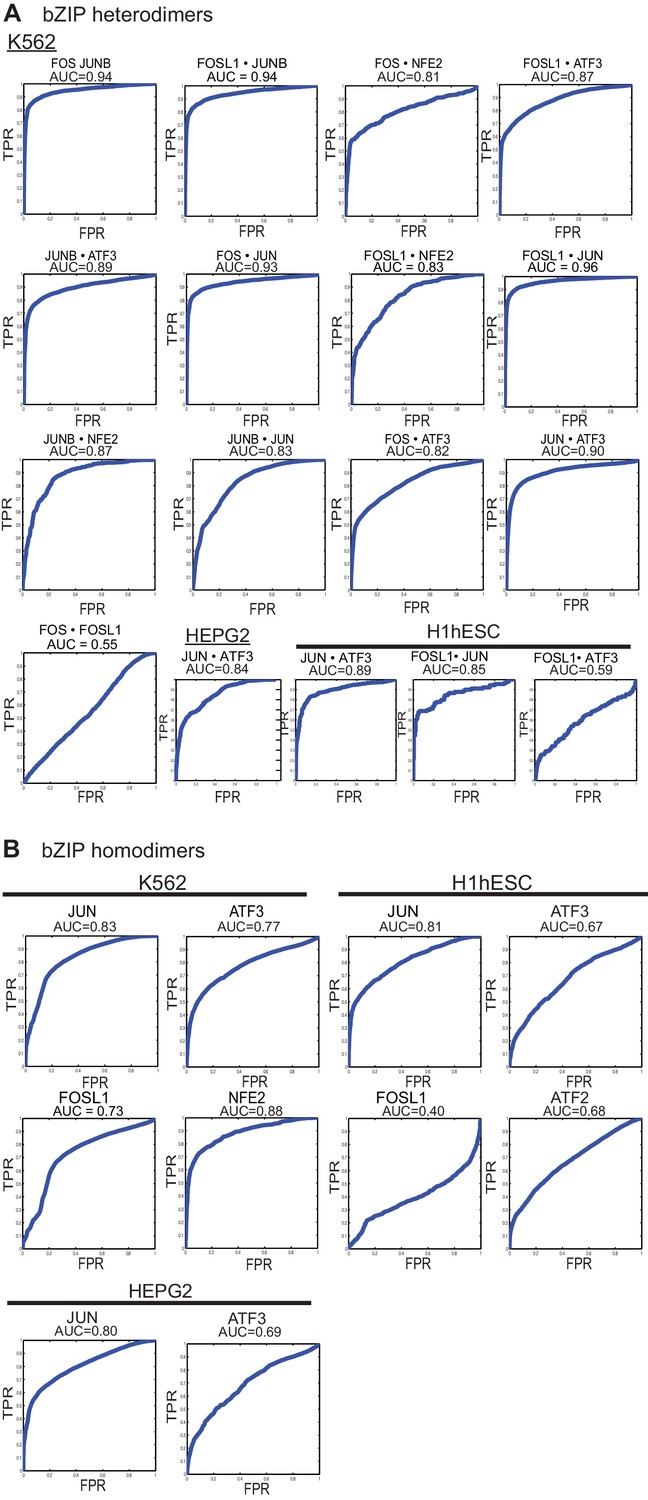
ROC curves.
(A) Area Under the Receiver Operating Characteristic curve (AUC-ROC) values for the intersection of ChIP-seq peaks determined using in vitro specificity profiles of the corresponding bZIP heterodimer, as described in Materials and methods. x-axis: False-Positive Rate; y-axis: True-Positive Rate (TPR). ChIP-seq peaks from specified cell lines were downloaded from the ENCODE project. (B) ROC curves and AUC values for ChIP-seq peaks (all peaks) determined using DNA-binding specificity profiles of the corresponding bZIP homodimer.
Figure 6 with 1 supplement
bZIP heterodimer DNA sites are bound in vivo.
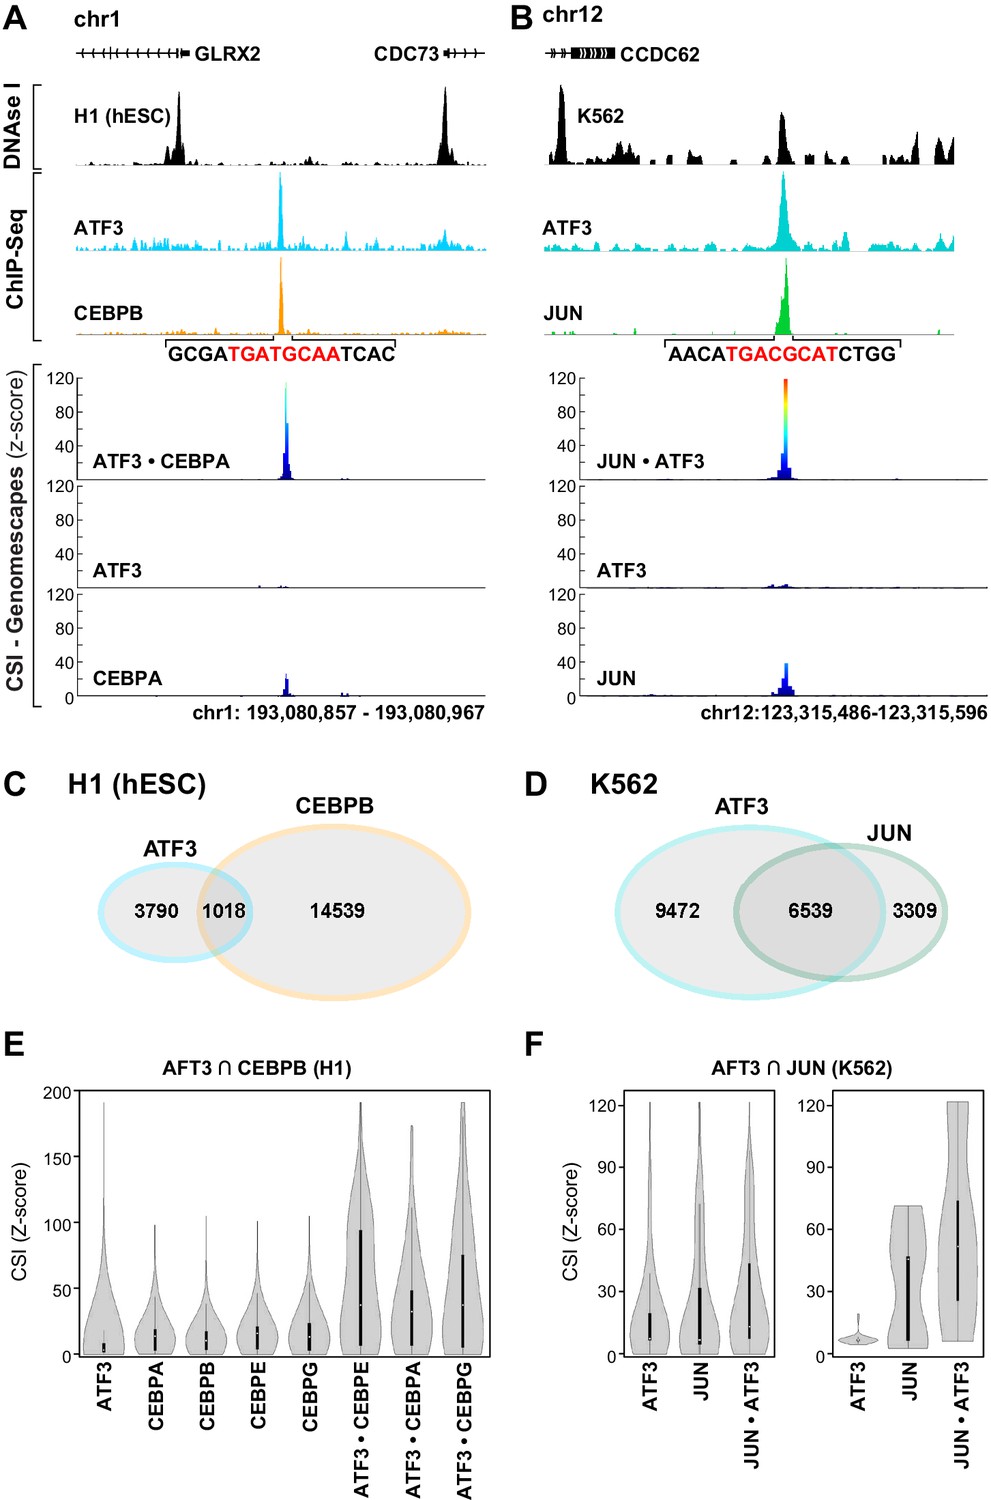
(A) ChIP-seq traces for ATF3 (blue) and CEBPB (orange) and DNase I hypersensitivity (black) trace for in H1 human embryonic stem cells. Below, CSI-Genomescape for bound genomic regions for ATF3 and CEBPA homodimers and ATF3•CEPBA heterodimer. CEBPA and CEBPB share 76% identity over their bZIP domain. (B) ChIP-seq traces for ATF3 (blue) and JUN (green) and DNAse I hypersensitivity trace (black) in K562 cells. Below, CSI-Genomescape for bound genomic region for ATF3 and JUN homodimers, and for JUN•ATF3 heterodimer. (C) Venn diagram of bound regions (ChIP-seq peaks) for ATF3 and CEBPB in H1hESC and for (D) ATF3 and JUN in K562 cells. (E) Violin plots of CSI-seq scores for the ChIP-seq peaks derived from the intersection of ATF3 and CEBPB ChIP peaks (1018 overlapping peaks) in H1 stem cells using in vitro data for ATF3, CEBPA, CEBPB (from Jolma et al.) (Jolma et al., 2013), CEBPE, CEBPG homodimers and ATF3•CEBPA, ATF3•CEBPE, and ATF3•CEBPG heterodimers. CSI intensities were quantile normalized. (F) Violin plots of CSI-seq scores for the ChIP-seq peaks derived from the intersection of ATF3 and JUN ChIP peaks (left, 6539 overlapping peaks) in K562 cells, left. Violin plots for the subset of overlapping peaks of ATF3 and JUN containing a match for the heterodimer-specific site TGACGCAT (39 peaks), right. Peaks were scored using ATF3 and JUN homodimers, and JUN•ATF3 heterodimers.
Figure 6—figure supplement 1
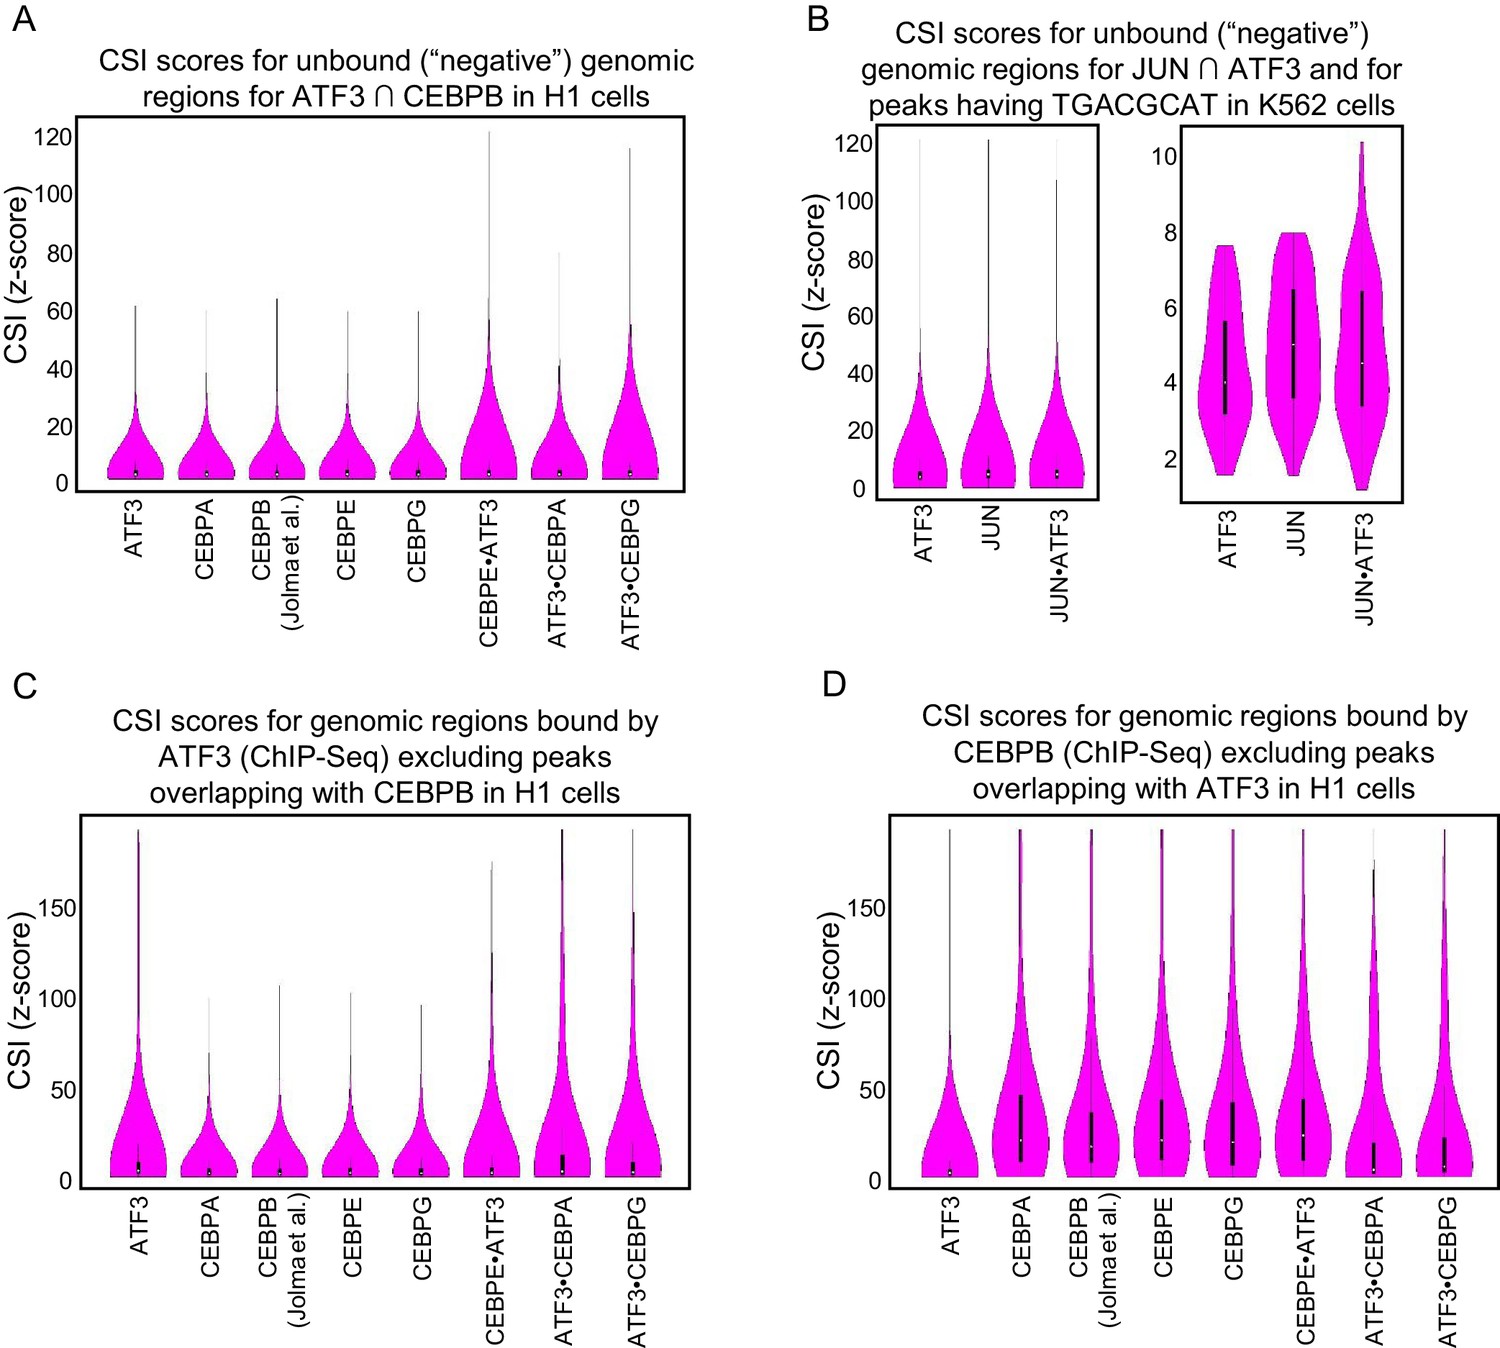
CSI intensities for bound genomic regions.
Violin plots of CSI intensities (z-scores) for (A) Negative regions were taken from ±5 kb from the center of each ATF3 and CEBPB overlapping ChIP peaks in H1 cells. (B) Negative regions were taken from ±5 kb from the center of each ATF3 and JUN overlapping ChIP peaks in K562 cells. (C) ATF3 ChIP-seq peaks after removing peaks that overlap with CEBPB in H1 cells. (D) CEBPB ChIP-seq peaks after removing peaks that overlap with ATF3 in H1 cells.
Figure 7 with 1 supplement
bZIP heterodimers and human diseases and traits.
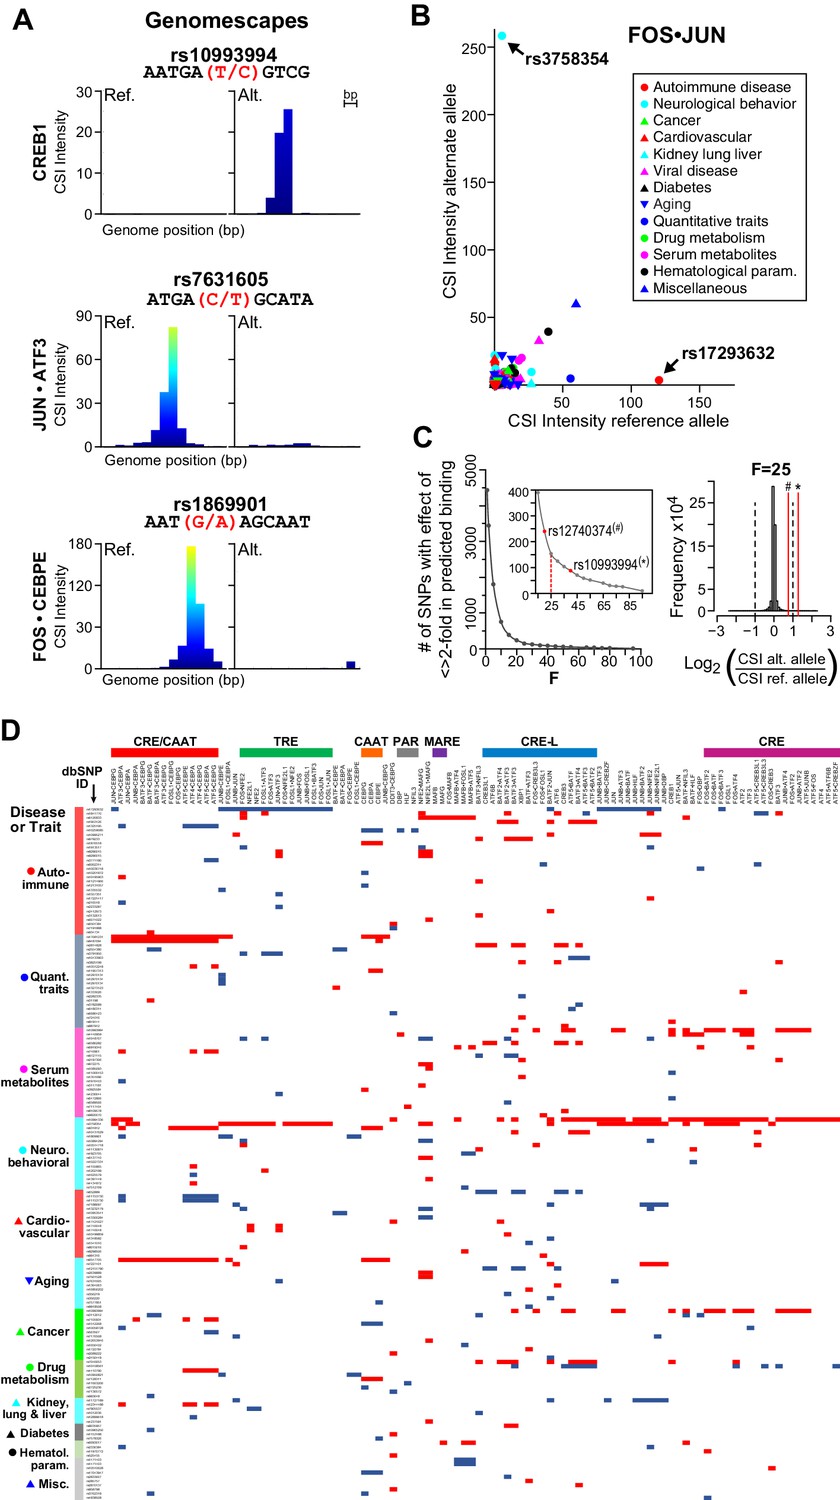
(A) CSI-Genomescape predicts increased binding by CREB1 to the alternate allele of rs10993994 and decreased binding to alternate alleles of rs7631605 and rs1869901 by JUN•ATF3 and FOS•CEBPE heterodimers, respectively. (B) Scatterplot of FOS•JUN predicted CSI intensities for reference and alternative alleles of 5076 autosomal SNPs linked to human diseases and quantitative traits identified in genome-wide association studies. SNPs and disease/traits classifications are from Maurano et al. (Maurano et al., 2012). (C) (left) Number of SNPs predicted to increase or decrease bZIP binding by twofold at different stringency levels determined by noise factor F (see Materials and methods). The F values at which a twofold difference in CSI score is predicted for rs12740374 (#) and rs10993994 (*) are indicated in red. (right) Distribution of predicted fold changes in bZIP binding for GWAS SNPs using CSI Intensities, using F = 25. Dashed lines mark a twofold change. Red lines indicate the predicted change in binding of CREB1 and CEBPA to rs10993994 (*) and rs12740374 (#). (D) Predicted fold-change in CSI score of sequences centered at SNPs linked to disease or quantitative traits. A total of 156 SNPs have a predicted increase (red) or decrease (blue) of ≥2 fold in CSI score for at least one bZIP dimer, when F = 25 (Materials and methods and Supplementary file 1I). Fold-changes are relative to the reference genome hg19. Rows (SNPs) are organized by class of disease/trait. Columns (bZIP dimers) are clustered by DNA specificity as in Figure 1.
Figure 7—figure supplement 1
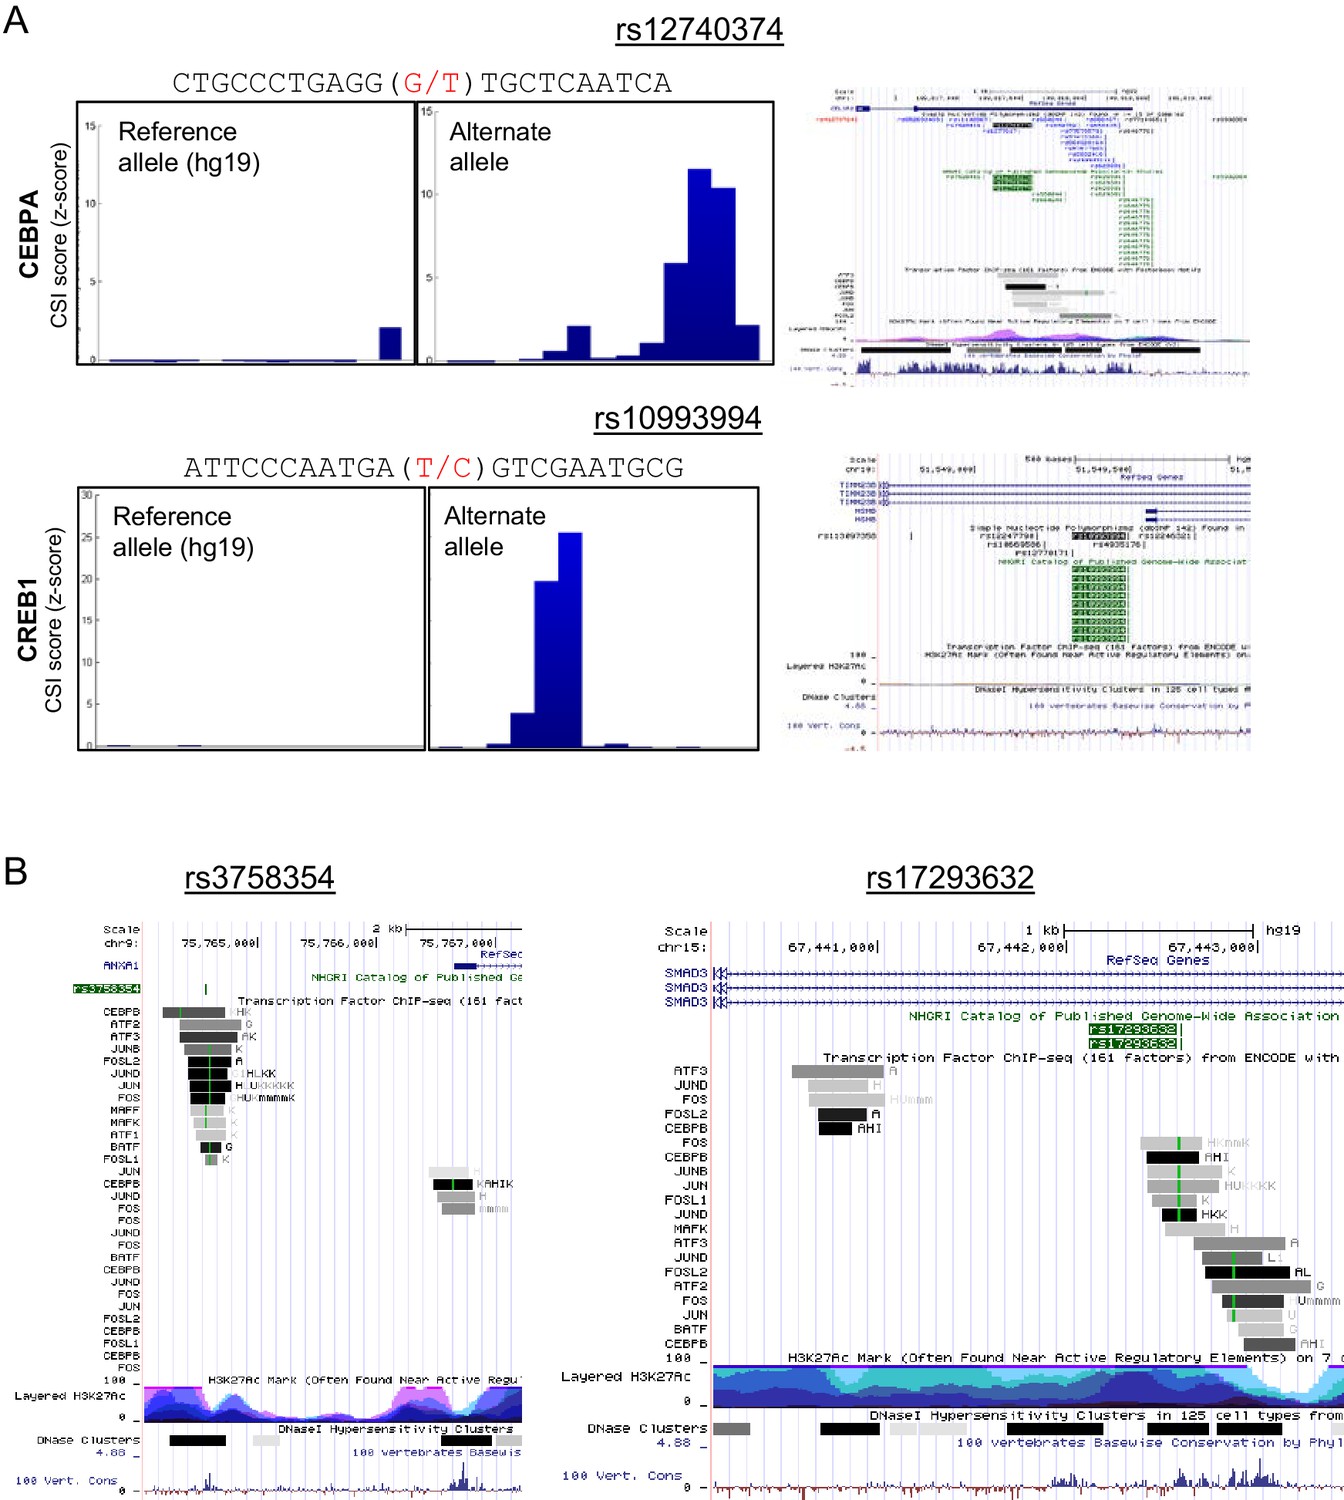
Genomescapes, transcription factor binding, and chromatin environment for selected SNPs.
(A) Left, CSI Genomescape and right, UCSC genome browser screen shots of the genomic and chromatin context of SNPs rs12740374 and rs10993994. (B) UCSC genome browser screen shots of the genomic and chromatin context of SNPs rs3758354 and rs17293632. UCSC genome browser tracks for ChIP-seq peaks for selected bZIPs in ENCODE cell lines, ChIP-seq signal for histone 3 lysine 27 acetylation (H3K27Ac marks), and DNAse I hypersensitive regions.
Additional files
-
Supplementary file 1
(A) bZIP sequences. (B) DNA library and primers. (C) DNA stabilized bZIP dimers. (D) Oligonucleotide sequences for EMSA. (E) ROC-AUC. (F) Expression of bZIP genes. (G) ATF3 dimers in ChIP-seq peaks. (H) GREAT GO annotations. (I) SNP fold-change predictions.
- https://doi.org/10.7554/eLife.19272.022
-
Supplementary file 2
MEME motifs and Sequence Specificity and Energy Landscapes (SEL) for human bZIP homodimers and heterodimers.
- https://doi.org/10.7554/eLife.19272.023
Download links
A two-part list of links to download the article, or parts of the article, in various formats.
Downloads (link to download the article as PDF)
Open citations (links to open the citations from this article in various online reference manager services)
Cite this article (links to download the citations from this article in formats compatible with various reference manager tools)
Combinatorial bZIP dimers display complex DNA-binding specificity landscapes
eLife 6:e19272.
https://doi.org/10.7554/eLife.19272


