Atomic structures of fibrillar segments of hIAPP suggest tightly mated β-sheets are important for cytotoxicity
- Howard Hughes Medical Institute, University of California, Los Angeles, United States
- University of California, Los Angeles, United States
- Janelia Research Campus, Howard Hughes Medical Institute, United States
- Uppsala University, Sweden
- University of California, Irvine, United States
- David Geffen School of Medicine, University of California, Los Angeles, United States
- King Abdulaziz University, Saudi Arabia
Figures
Figure 1 with 3 supplements
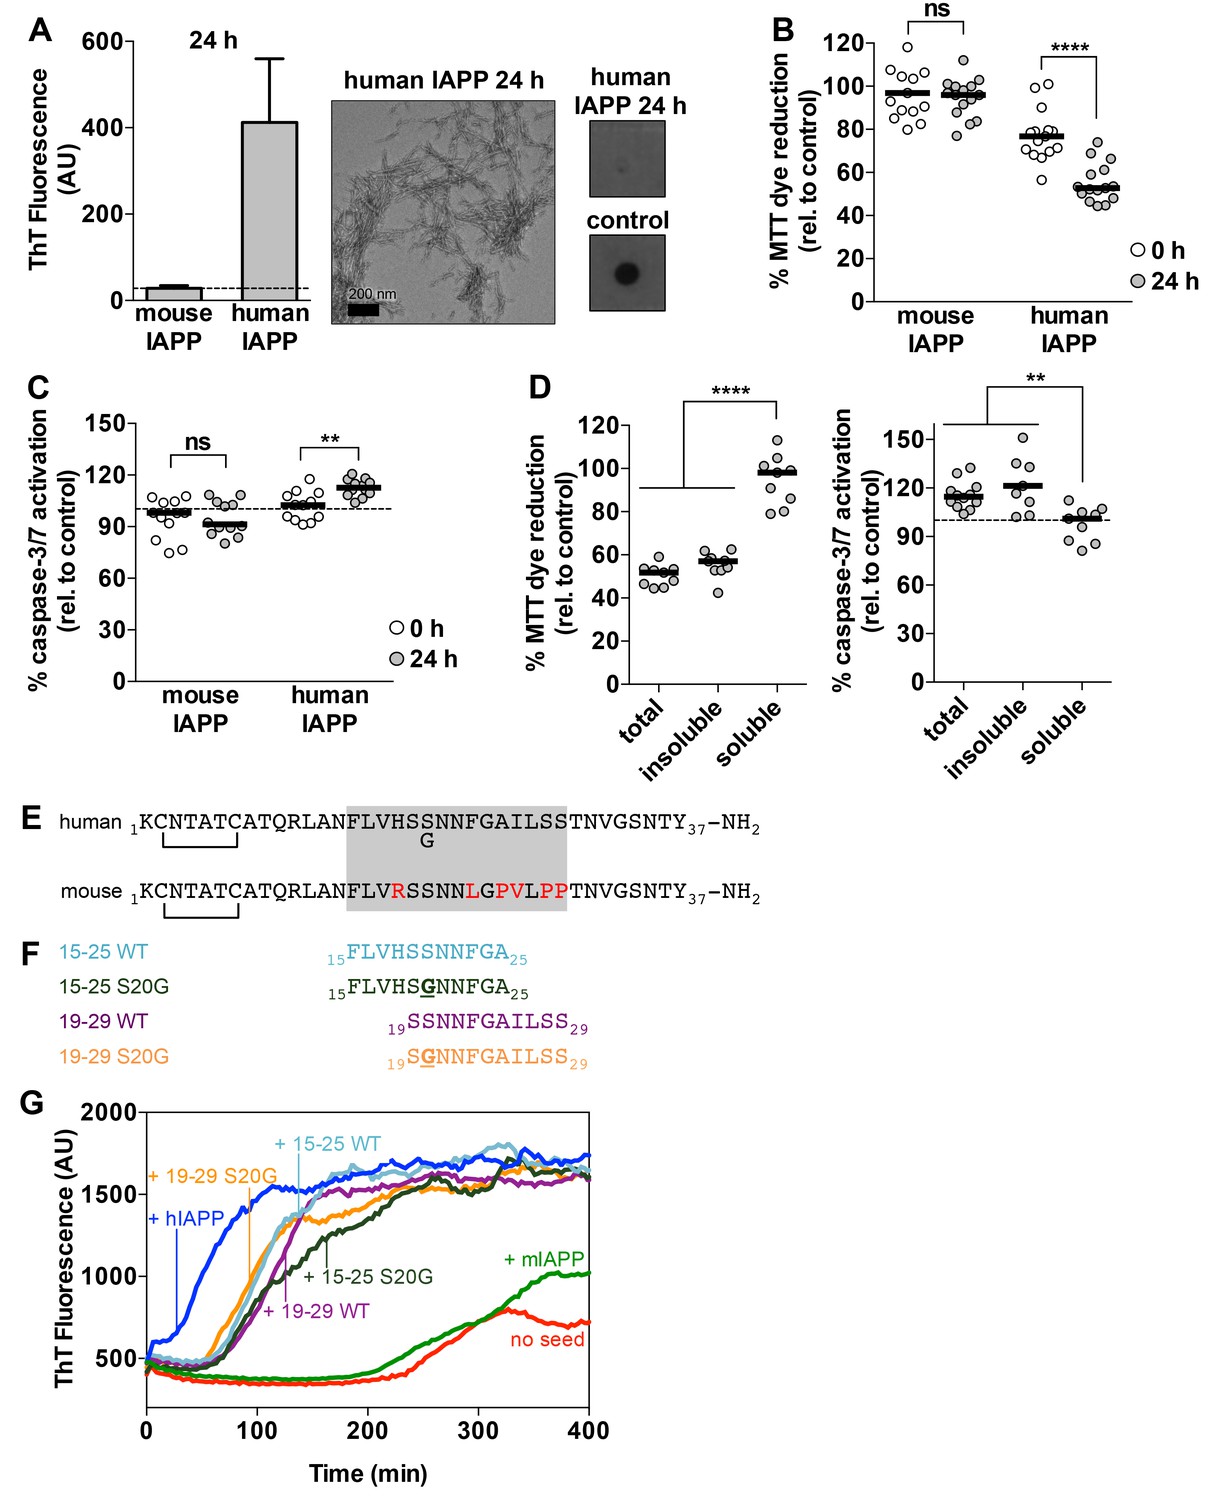
Preparations of hIAPP that contain amyloid fibrils are cytotoxic to a rat pancreatic β-cell line.
(A) Human IAPP (hIAPP) aged for 24 h contains amyloid fibrils and no detectable oligomers. Amyloid fibrils were observed using ThT binding and TEM. Oligomers were detected using a dot bot assay with the polyclonal anti-oligomer antibody, LOC. hIAPP oligomers were used as the positive control for LOC binding. The dashed line on the ThT binding graph indicates ThT fluorescence of vehicle alone. (B) and (C) hIAPP aged for 24 h is significantly more cytotoxic than hIAPP aged for 0 h. In these experiments, 50 μM human and mouse IAPP were aged for the designated time periods and then they were applied to cells at 5 μM final concentration. Mouse IAPP (mIAPP), which does not form amyloid fibrils, is not cytotoxic regardless of time period of aging. Black horizontal bars indicate the median (n = 12–15 across 4–5 biological replicates, each with three technical replicates). (B) Rin5F cells treated with hIAPP aged for 24 h reduce significantly less MTT dye than Rin5F cells treated with hIAPP aged for 0 h (ns=not significant; ****p<0.0001 using an unpaired t-test with equal standard deviations). (C) Rin5F cells treated with hIAPP aged for 24 h exhibit significantly higher caspase-3/7 activation than Rin5F cells treated with hIAPP aged for 0 h. Additionally, Rin5F cells treated with hIAPP aged for 24 h exhibit significantly higher caspase-3/7 activation than vehicle-treated cells (***p=0.0008 using an ordinary one-way ANOVA), but Rin5F cells treated with hIAPP aged for 0 h do not (p=0.4286 using an ordinary one-way ANOVA) (ns=not significant; **p=0.0011 using an unpaired t-test with equal standard deviations). (D) The insoluble fraction of hIAPP aged 24 h, which contains amyloid fibrils and no detectable oligomers, contains the cytotoxic species. Cytotoxicity was measured using MTT dye reduction and detection of caspase-3/7 activation (****p<0.0001; **p<0.0013; n = 9 across three biological replicates, each with three technical replicates). (E) Amino acid sequences of human IAPP and mouse IAPP. The location of the early onset familial mutation, S20G, is shown below the human sequence. Red residues in the mouse sequence differ from the human sequence. The amyloid spine of human IAPP and the corresponding region in the mouse sequence is enclosed in the gray box. (F). Schematic of protein segments that span the amyloid spine, hereon referred to as spine segments, targeted for characterization. (G) Fibrils of spine segments seed hIAPP fibril formation, suggesting that spine segments embody structural characteristics of full-length hIAPP fibrils. 10 μM hIAPP was seeded with 10% (v/v) monomer equivalent of pre-formed, unsonicated seed of each spine segment. mIAPP, which does not contain amyloid fibrils, does not seed hIAPP fibril formation. Curves show average of 4 technical replicates.
Figure 1—figure supplement 1
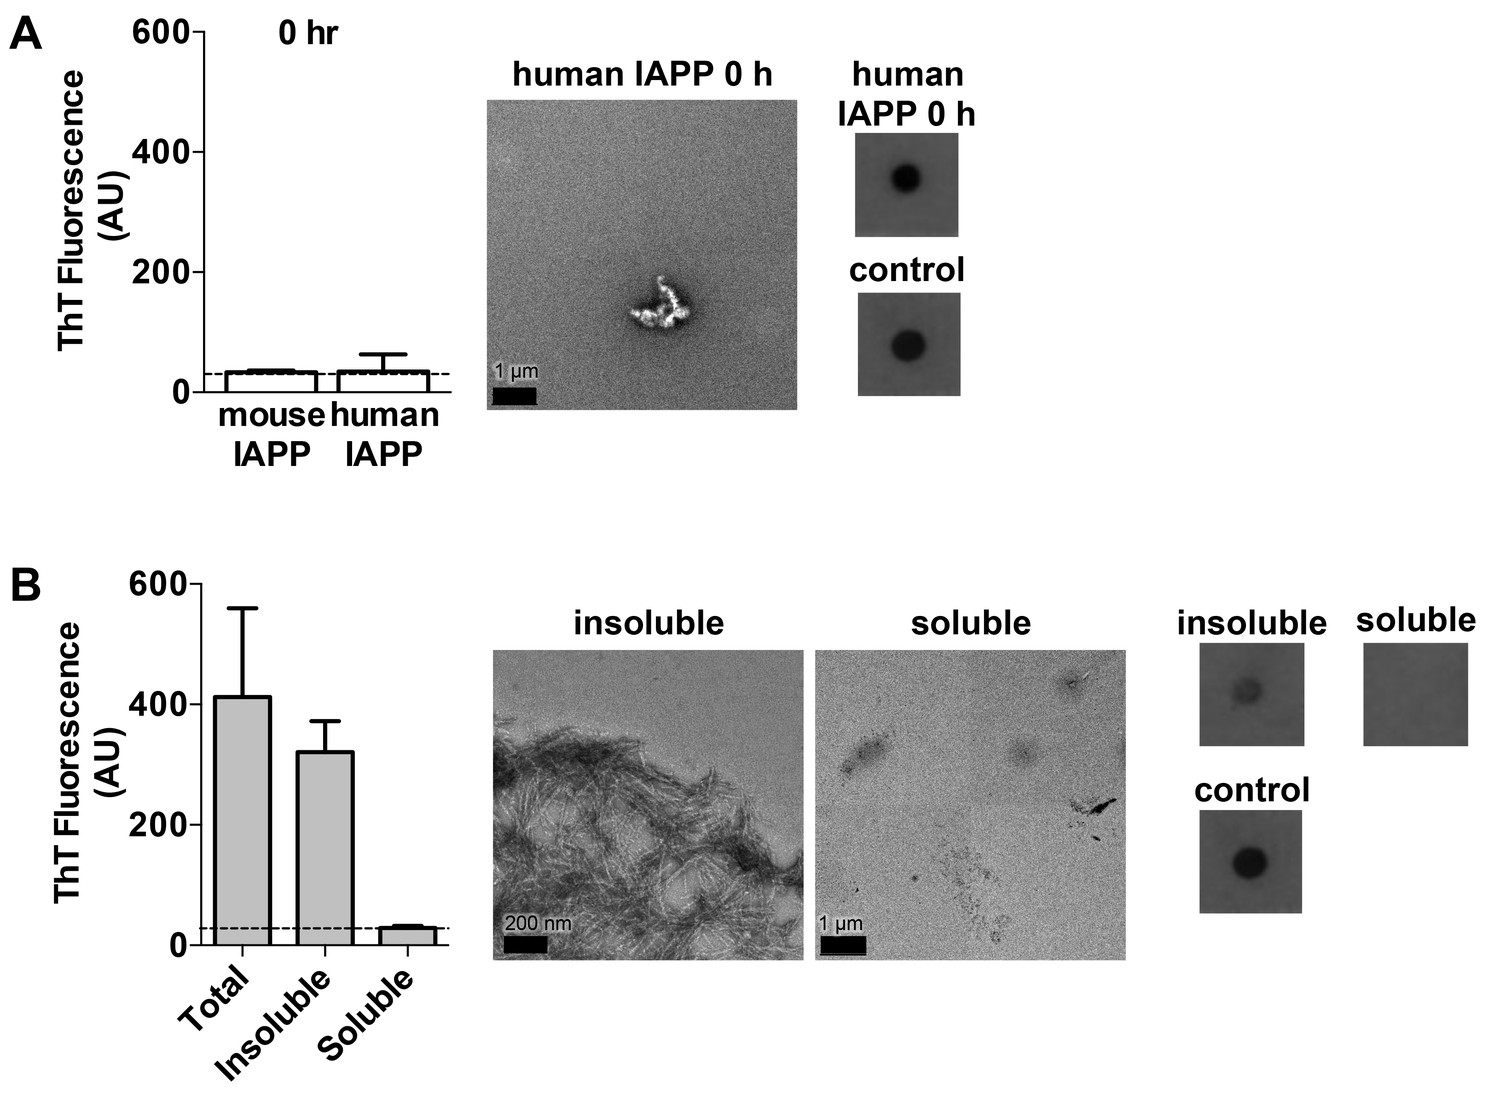
Characterization of hIAPP aged for 0 h and the soluble and insoluble fractions of hIAPP aged for 24 h.
(A) hIAPP aged for 0 h contains oligomers and no detectable amyloid fibrils as assessed by ThT binding, TEM, and a dot blot assay using the anti-oligomer antibody, LOC. hIAPP oligomers were used as the positive control for LOC binding. (B) The insoluble fraction of hIAPP aged for 24 h, which contains the cytotoxic species, is composed of amyloid fibrils and no detectable oligomers. The soluble fraction, which is not cytotoxic, contains no detectable amyloid fibrils or oligomers. The dashed line on the ThT binding graphs indicates ThT fluorescence of vehicle alone.
Figure 1—figure supplement 2
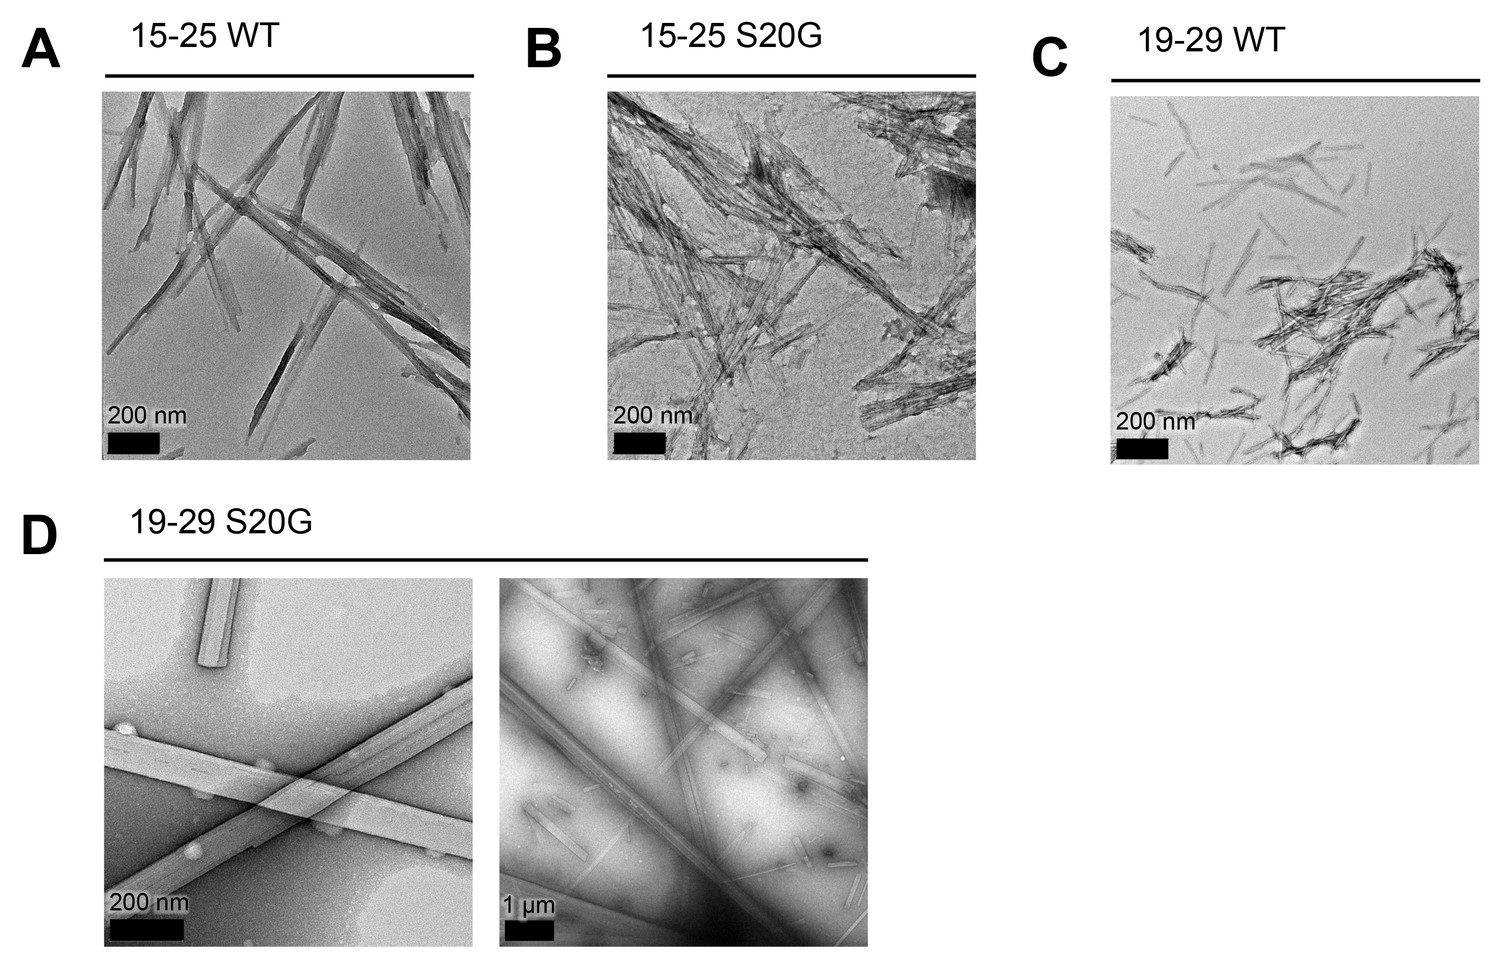
All spine segments form amyloid fibrils or 3D crystals only a few hundred nanometers thick, as observed using TEM.
Fibrils and 3D crystals were formed by dissolving lyophilized protein segments at 1 mM in PBS and 1% DMSO and incubating them for one week at room temperature under quiescent conditions. Fibril and crystal formation occurred as quickly as a few hours (19–29 S20G) to as long as overnight (15–25 WT and 15–25 S20G). (A) 15–25 WT forms striated ribbons. (B) 15–25 S20G forms striated ribbons. (C) 19–29 WT forms both striated ribbons and twisted fibrils of varying widths. (D) 19–29 S20G forms 3D crystals only a few hundred nanometers thick. Right panel scale bar is 1 μm.
Figure 1—figure supplement 3
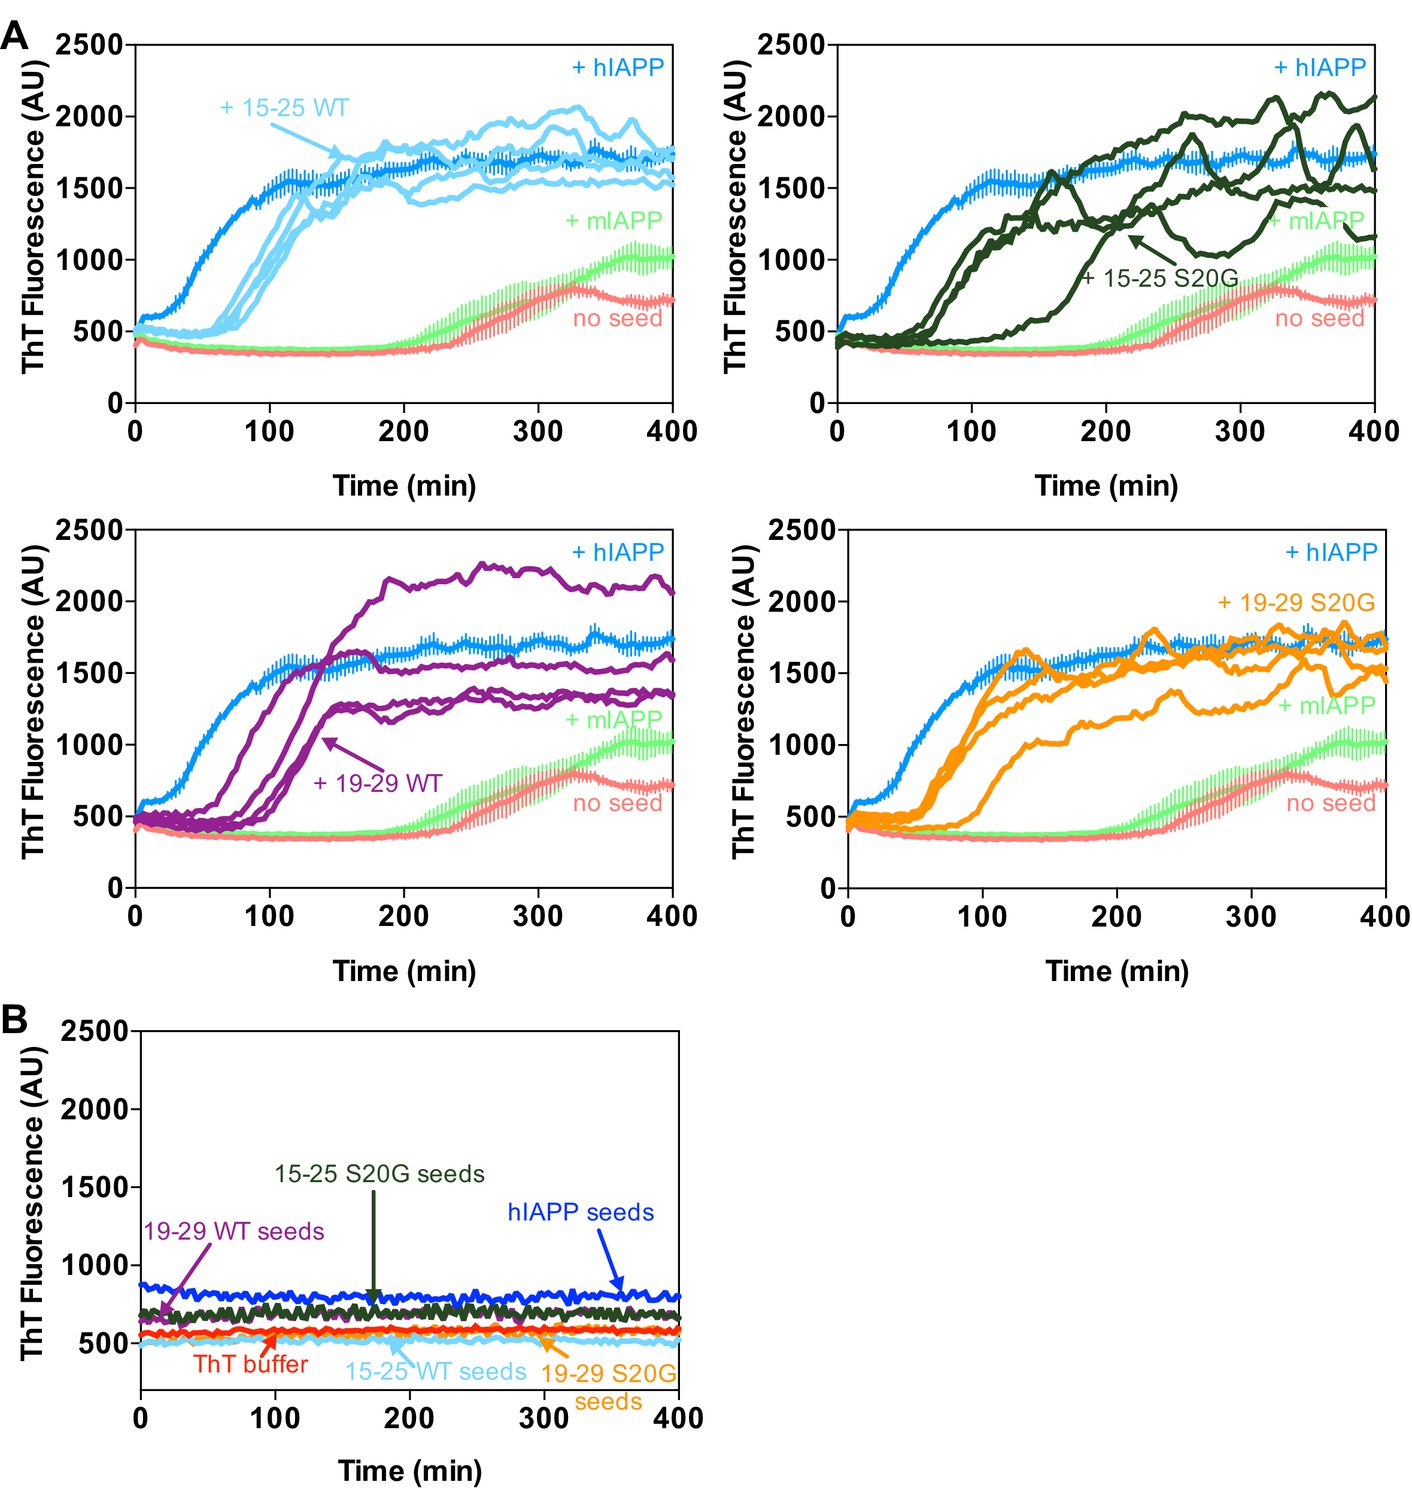
Technical replicates and control samples for ThT assay in Figure 1G.
(A) Fibrils of spine segments seed hIAPP fibril formation. All four technical replicates performed in the experiment in Figure 1G are shown. (B) Seeds of spine segments (1 μM) do not bind ThT. The graph shows mean ThT fluorescence across four technical replicates.
Figure 2

Bragg peaks produced by MicroED from 3D crystals only a few hundred nanometers thick are observed at higher resolution than peaks produced by X-ray diffraction at a microfocus beamline from microcrystals 10,000 times larger.
(A) 3D crystals of 19–29 S20G (right, inset) diffract to 1.6 Å using MicroED, a whole angstrom better resolution than the microcrystals of 19–29 S20G (left, inset). (B) 3D crystals of 15–25 WT (right, inset) diffract to 1.4 Å using MicroED, whereas microcrystals of 15–25 WT diffract to 2.2 Å using Microfocus X-rays (left, inset).
Figure 3 with 4 supplements
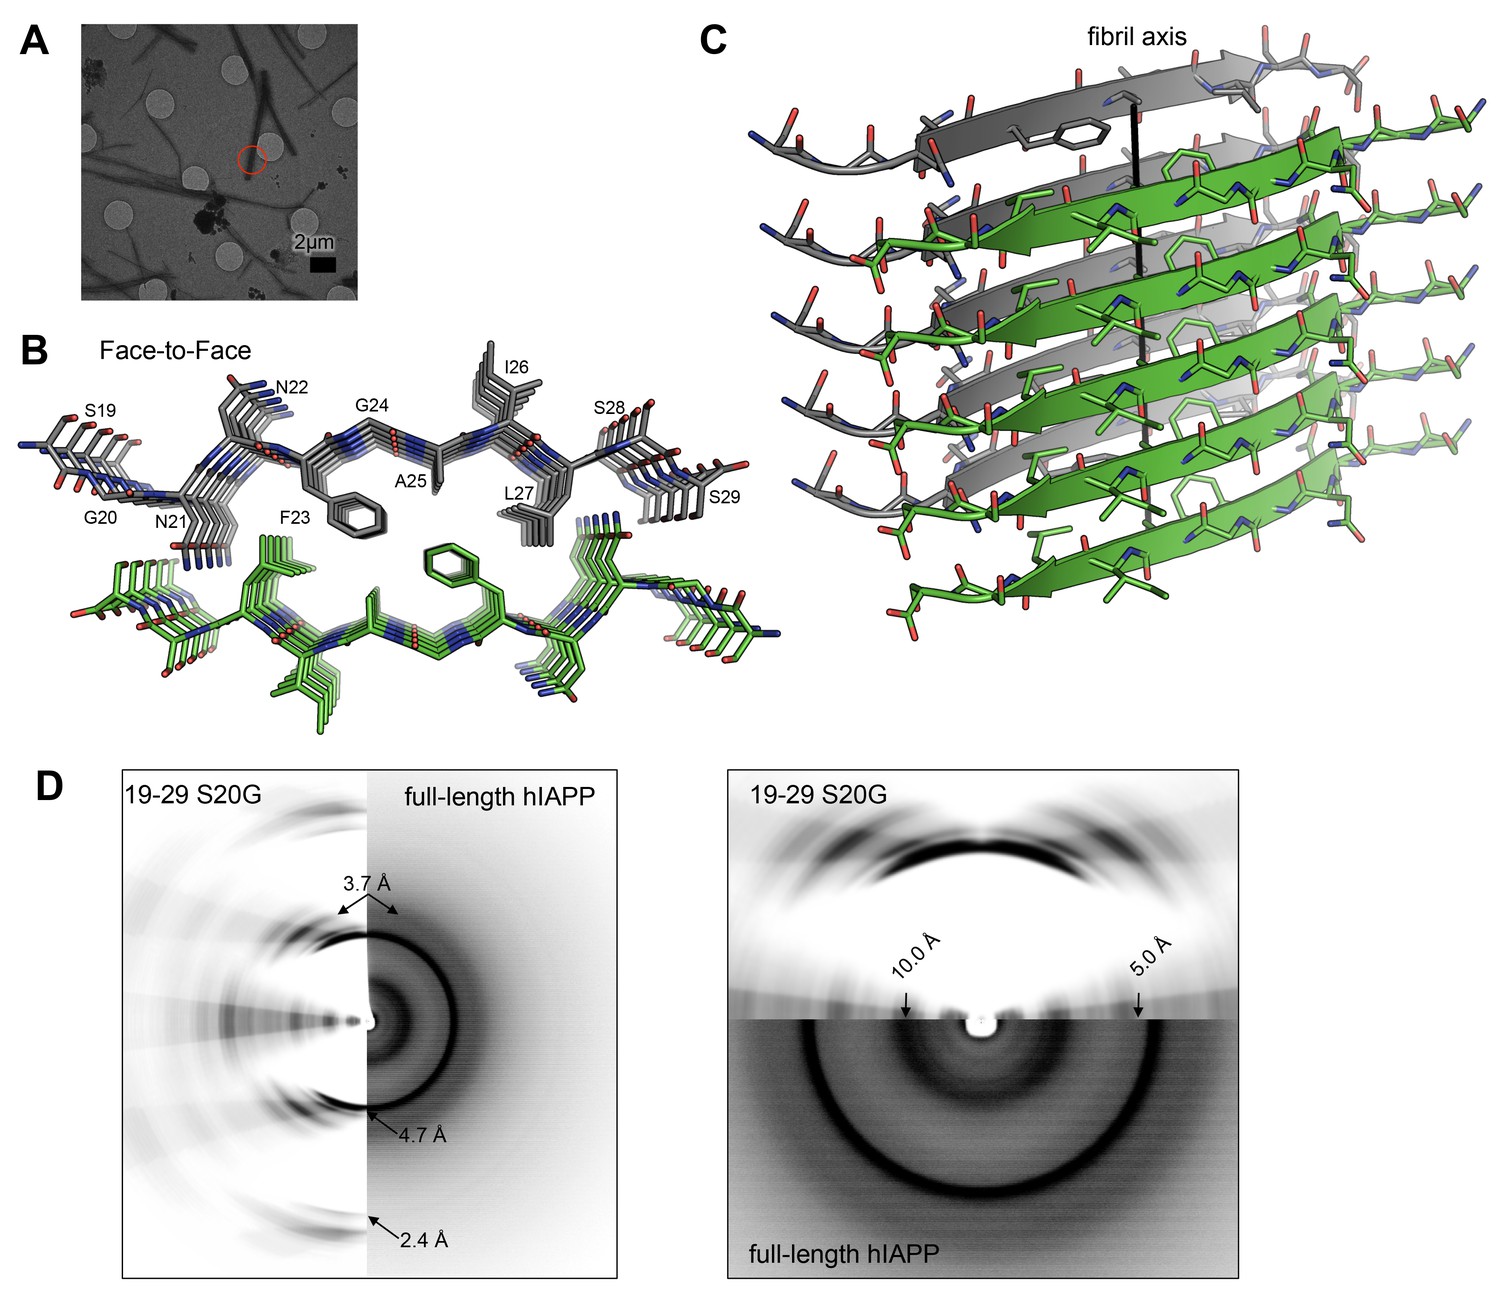
The MicroED atomic structure of segment 19–29 S20G reveals pairs of β-sheets mated by a dry interface.
(A) Electron micrograph of 3D crystals used for data collection. The red circle represents the area of the crystal used for diffraction. (B) Pairs of β-sheets are oriented face-to-face and they are tightly mated by a dry interface that excludes water. The dry interface is formed by tightly packed, interdigitating side-chains. This panel shows 5 β-strands or layers along the ‘a’ dimension of the unit cell; the average crystal used for data collection is 10,400 layers long in the ‘a’ dimension. (C) Orthogonal view of the steric-zipper formed by the dry interface. (D) The similarity between the fiber diffraction pattern calculated from the structure shown in Panel C and the fiber diffraction observed from full-length hIAPP fibrils supports the dry interface as a model for the amyloid spine of full-length hIAPP fibrils. Along the meridian (left panel), the dry interface and full-length hIAPP fibrils share reflections at 4.7 Å and and 2.4 Å (black arrows). Additionally, along the off-meridonal, the diffraction patterns share a reflection at 3.7 Å. It is difficult to see the reflection at 2.4 Å in the full-length hIAPP fiber diffraction image, but the reflection is clearly visible in the radial profile in Figure 3—figure supplement 1. Along the equator (right panel), the dry interface and full-length hIAPP fibrils share reflections at 10.0 Å and 5.0 Å (black arrows). The right panel is magnified 2X to more clearly show the low-resolution reflections along the equator.
Figure 3—figure supplement 1
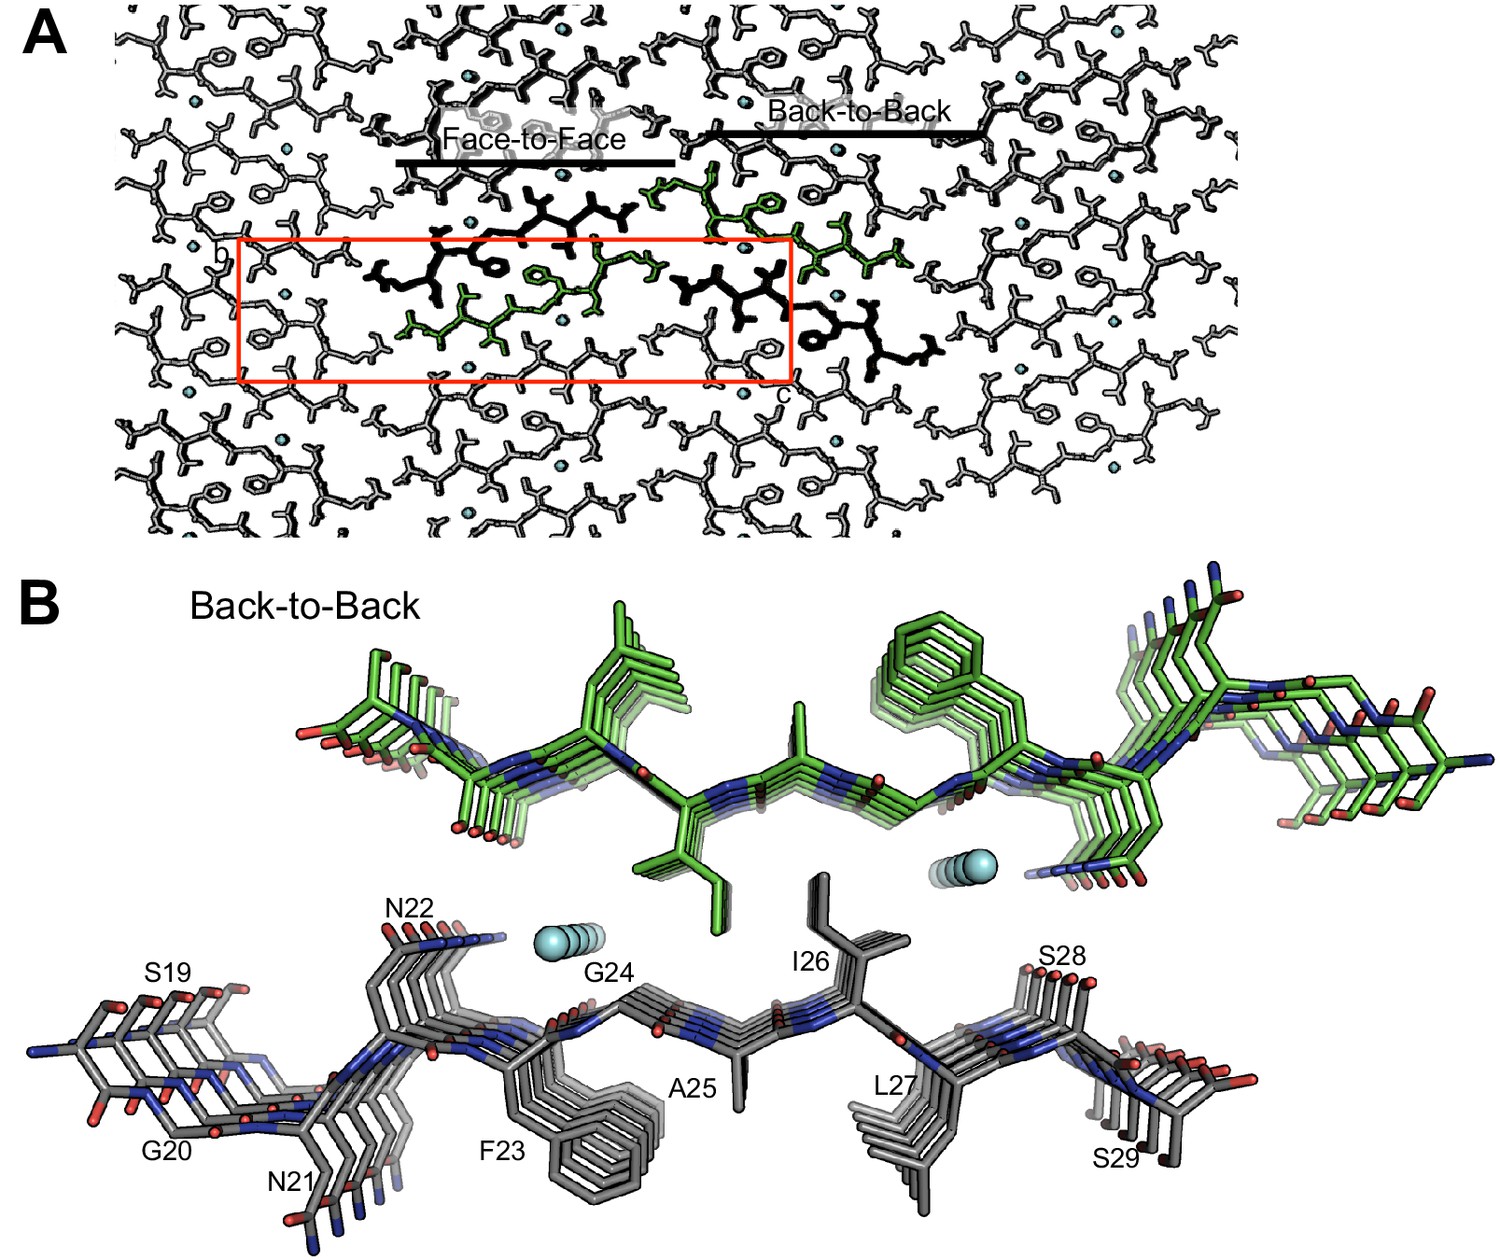
The crystal packing of segment 19–29 S20G reveals a second interface, termed the ‘Back-to-Back’ or wet interface, which does not form the amyloid spine.
The wet interface does not form the amyloid spine because (1) the fiber diffraction pattern calculated from this interface does not match the fiber diffraction pattern collected from full-length hIAPP fibrils, (2) it contains waters, and (3) it possesses less side-chain interdigitation than the dry interface. (A) View of crystal packing down the ‘a’ dimension of the unit cell reveals the two different interfaces. The unit cell is outlined in red; waters are shown in cyan. (B) Orthogonal view of the wet interface. The wet interface buries only 153 Å2 of surface area per strand and it possesses a shape complementarity of 0.64.
Figure 3—figure supplement 2
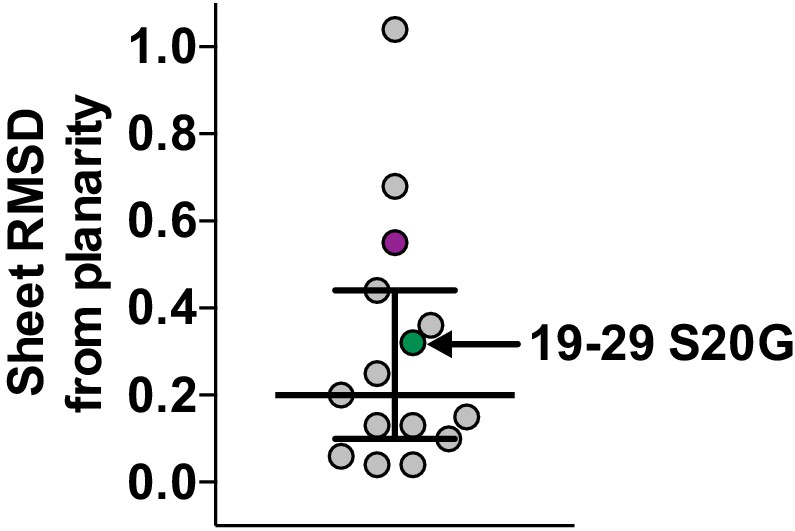
Scatter plot of sheet RMSD from planarity values for all hIAPP protein segment structures determined to date.
The values for the 19–29 S20G and 15–25 WT atomic structures are highlighted in green and purple, respectively.
Figure 3—figure supplement 3
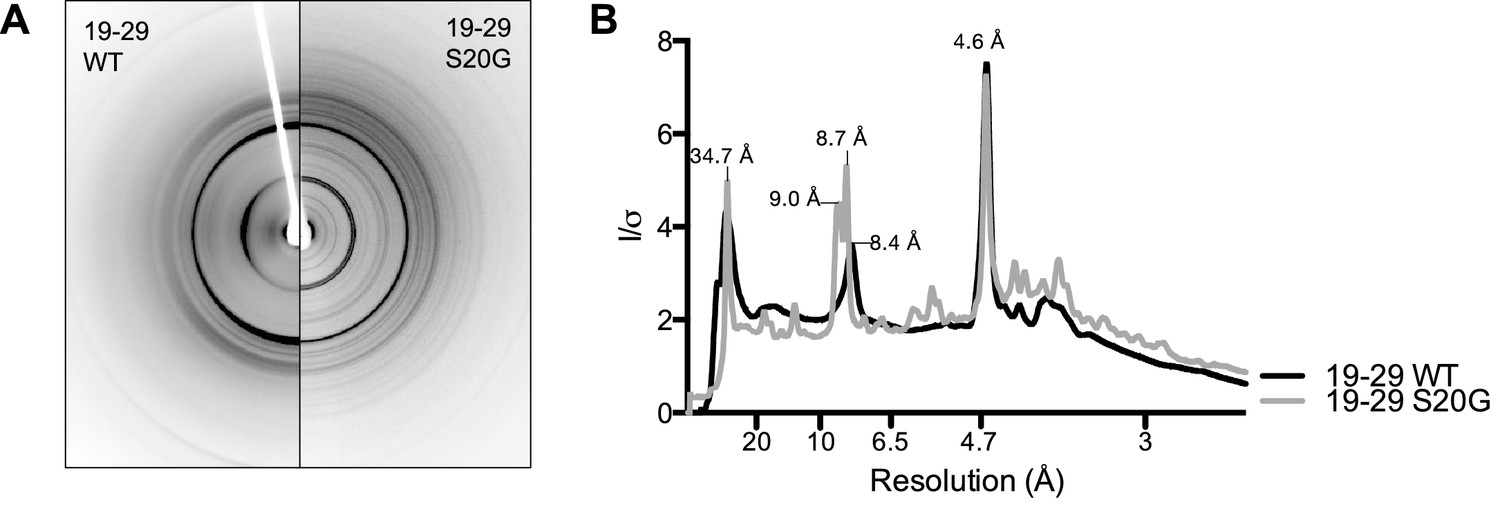
19-29 WT and S20G have similar fibrillar structures.
(A) Side-by-side comparison of X-ray diffraction from 19–29 WT fibrils (left) and 19–29 S20G fibrils (right). (B). Overlaid radial profiles calculated from X-ray fiber diffraction in panel A. 19–29 WT (black) and S20G (gray) fibrils share strong reflections at 4.6 Å, 8.4–9 Å, and 34.7 Å.
Figure 3—figure supplement 4
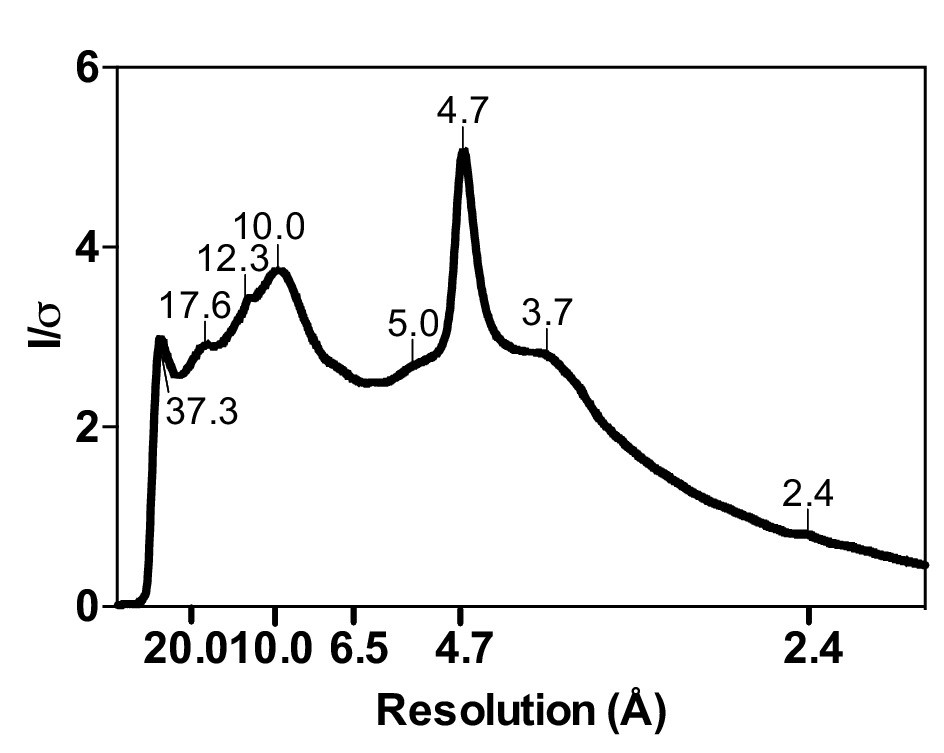
Radial profile calculated from the X-ray diffraction pattern given by cytotoxic full-length hIAPP fibrils.
Cytotoxic full-length hIAPP fibrils were prepared under the same conditions as in the cytotoxicity assays. Next, the fibrils were pelleted by centrifugation, washed with water to remove salt, and then applied between two glass capillary tubes as described by Sunde and co-workers (Sunde et al., 1997). The first peak on the left, which occurs at 37.3 Å, may represent a legitimate feature of full-length hIAPP fibrils, but it is too close to the beam stop to definitively makes this conclusion.
Figure 4 with 3 supplements
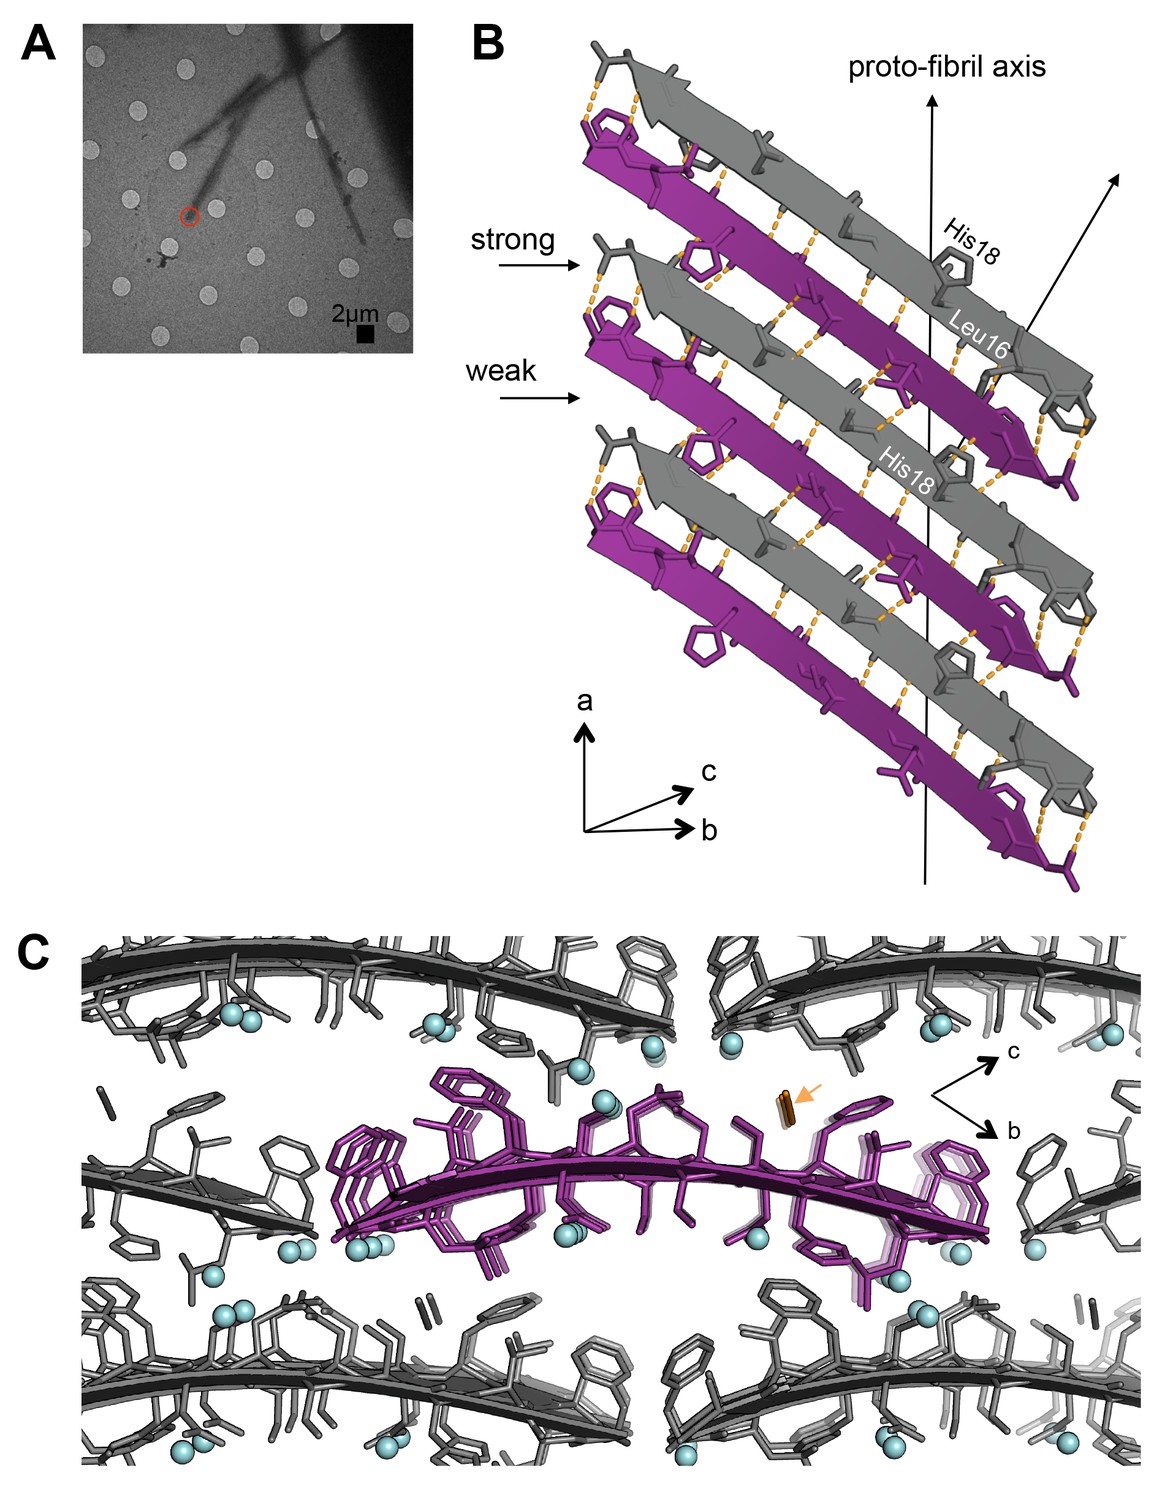
Segment 15–25 WT forms an arrangement of unmated β-sheets that is uncharacteristic of pathogenic amyloid fibrils.
(A) Electron micrograph of 3D crystals used for data collection. The red circle represents the area of the crystal used for diffraction. (B) A single β-sheet contains anti-parallel out-of-register β-strands stabilized by two distinct, unequal interfaces: a stronger interface with twelve hydrogen bonds, and a weaker interface with eight hydrogen bonds. The β-strands are out-of-register by two residues because Leu16 on the first β-strand is directly above His18 on the third β-strand. (C) The view down the proto-fibril axis reveals hydrated interfaces between partially overlapping β-sheets. Notice that adjacent β-sheets lack side-chain interdigitation. Water molecules are shown as cyan spheres. The thiocyanate molecule is highlighted in gold in the central β-sheet and colored gray in the peripheral β-sheets.
Figure 4—figure supplement 1
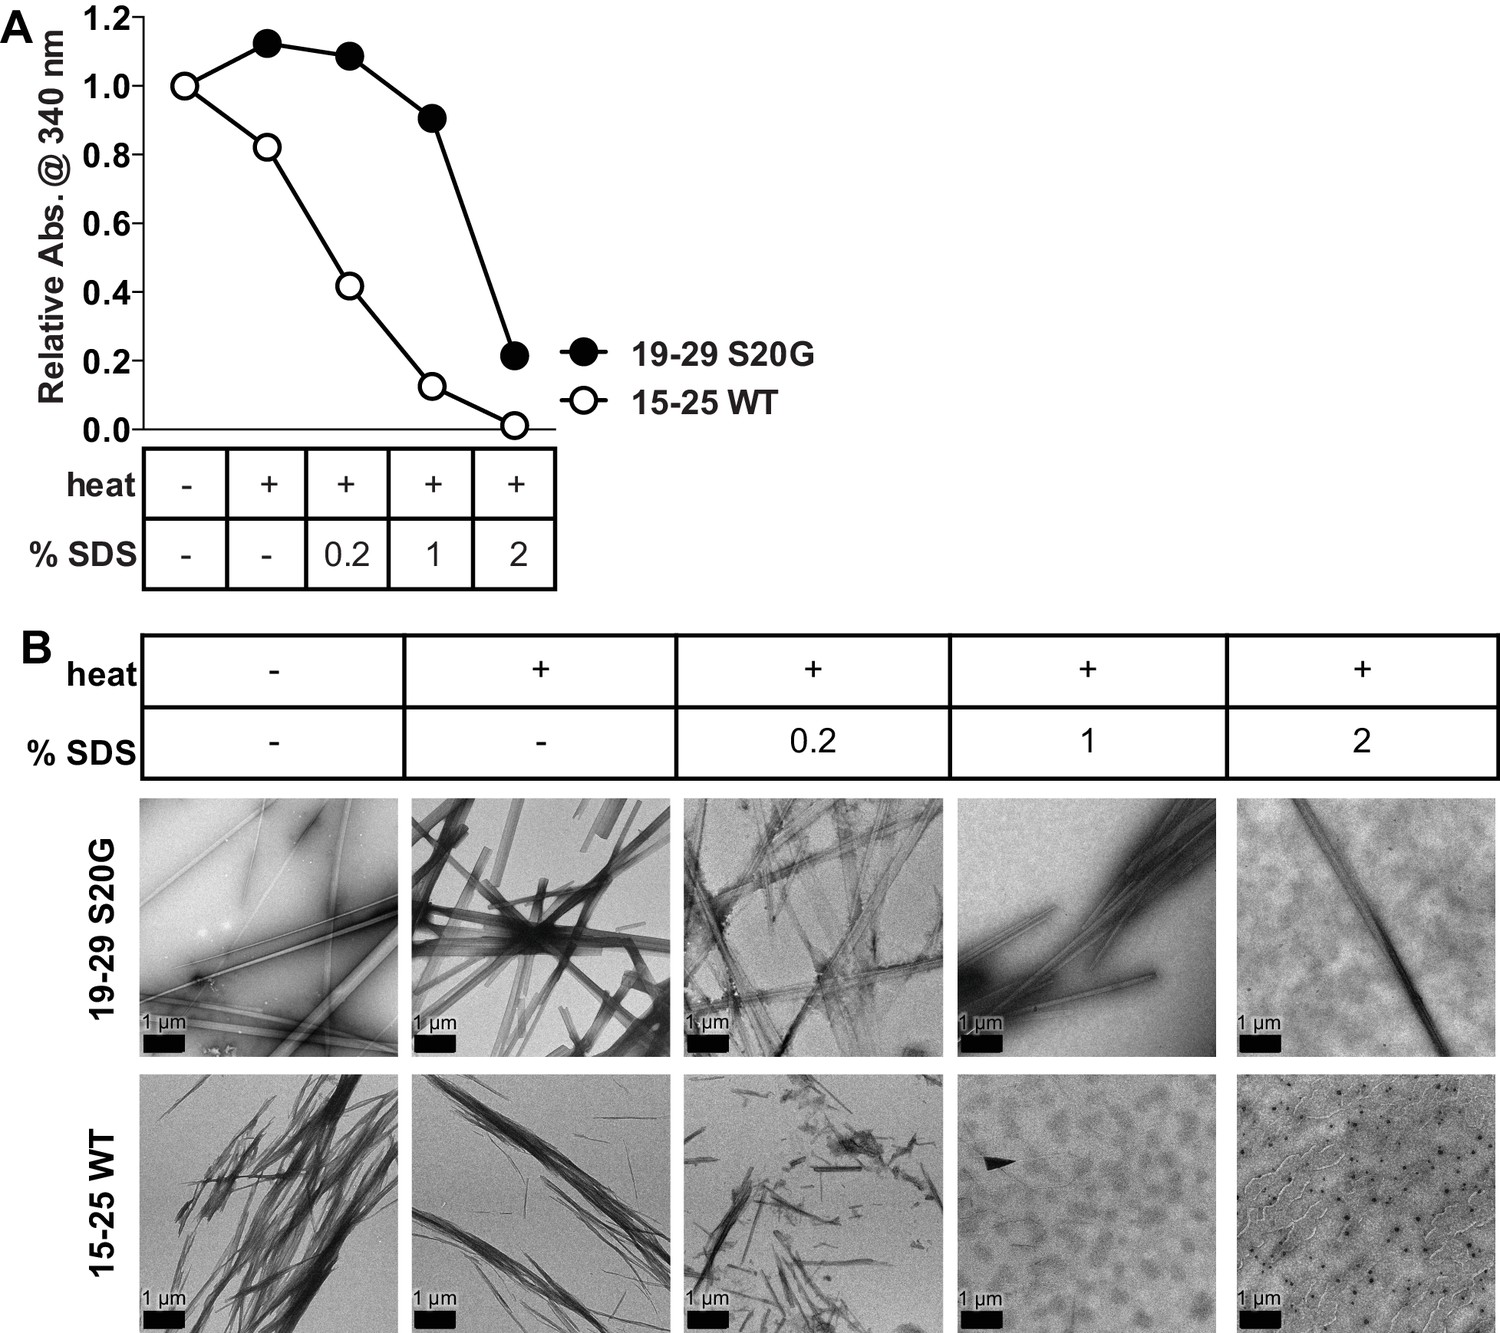
15-25 WT fibrils are relatively weak and reversible compared to 19–29 S20G fibrils.
Equimolar concentrations of 15–25 WT and 19–29 S20G fibrils were treated with increasing amounts of SDS and then heated at 55°C for 20 min. (A) Turbidity measurements of the fibrils treated with heat and increasing amounts of SDS reveal that 15–25 WT fibrils disaggregate more readily than 19–29 S20G fibrils. Turbidity measurements were obtained by recording absorbance at 340 nm. (B) Negative-stain electron micrographs corroborate the results observed in the turbidity measurements. Scale bars are 1 μm.
Figure 4—figure supplement 2
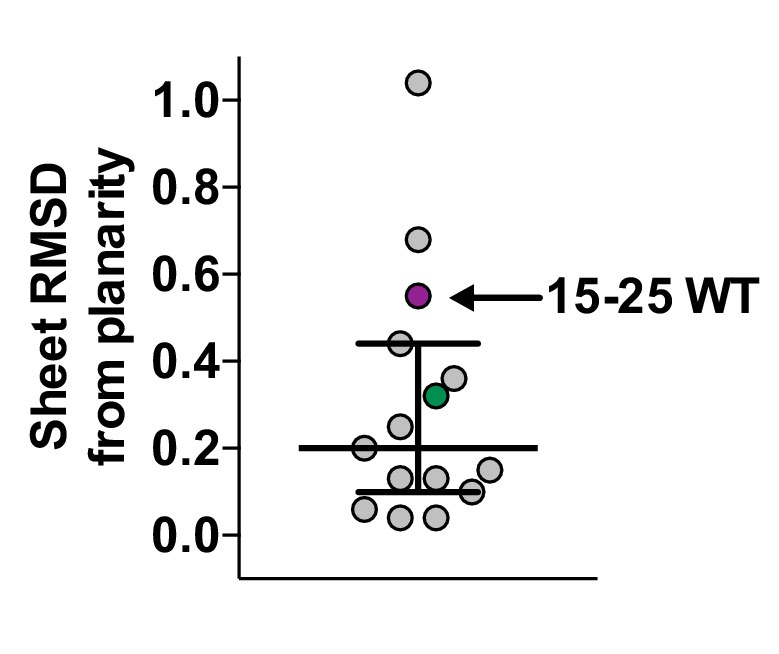
Scatter plot of sheet RMSD from planarity values for all hIAPP protein segment structures determined to date.
The values for the 19–29 S20G and 15–25 WT atomic structures are highlighted in green and purple, respectively.
Figure 4—figure supplement 3
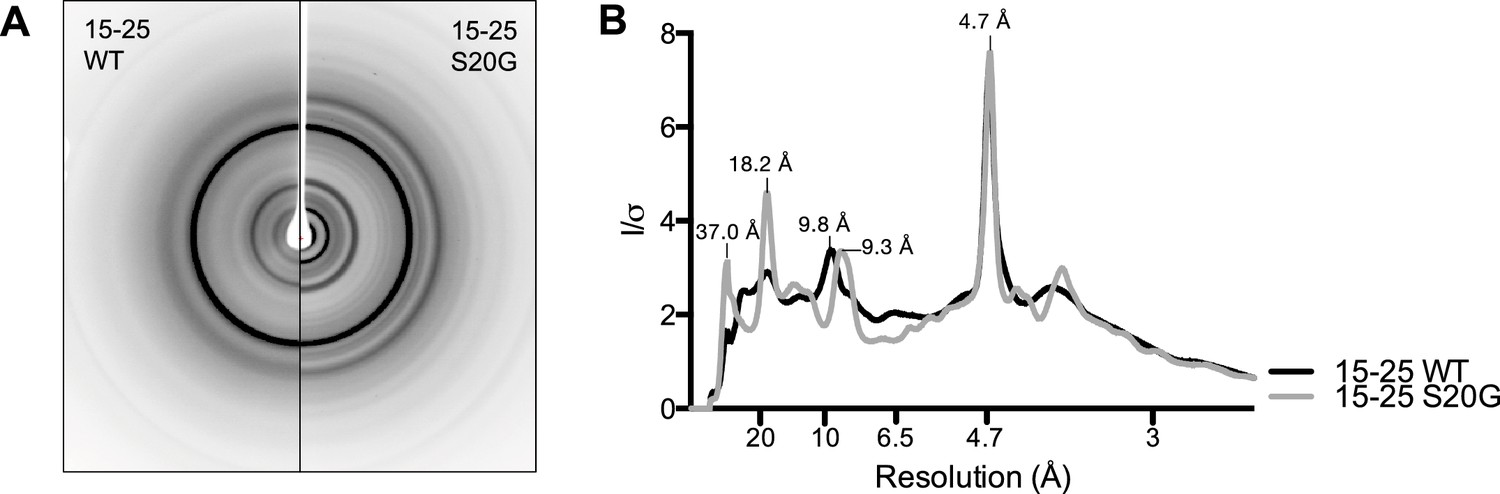
15-25 WT and S20G have similar fibrillar structures.
(A) Side-by-side comparison of X-ray diffraction from 15–25 WT fibrils (left) and 15–25 S20G fibrils (right). (B) Overlaid radial profiles calculated from X-ray fiber diffraction in panel A. 15–25 WT (black) and S20G (gray) fibrils display strong reflections at 4.7 Å, 9.3–9.8 Å, 18.2 Å, and 37.0 Å.
Figure 5 with 2 supplements
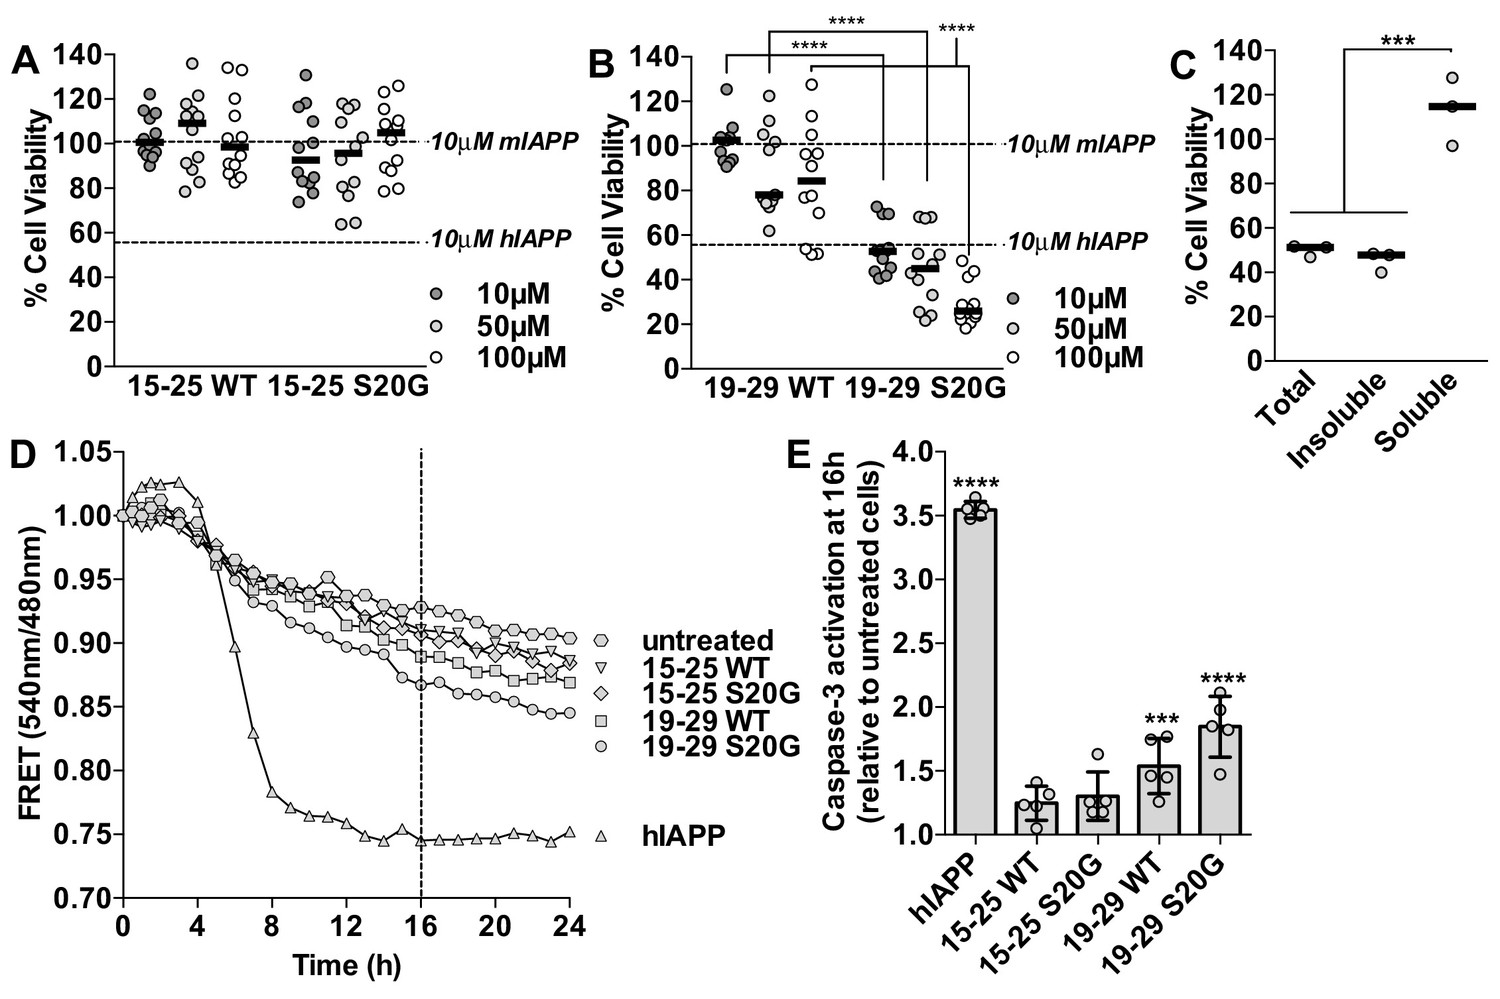
Segment 19–29 S20G forms the toxic core of hIAPP and segments 15–25 are not toxic.
(A and B) Fibrils were formed by incubating the spine segments overnight under quiescent conditions, the same conditions used to prepared full-length hIAPP fibrils. Next, the samples were applied to HEK293 cells at the specified concentrationsand then cell viability was quantified using MTT dye reduction. Bars show median cell viability; dashed lines show median cell viability from 10 μM mIAPP and hIAPP. (A) 15–25 WT and 15–25 S20G fibrils are not toxic compared to full-length hIAPP fibrils (n = 12 across four biological replicates, each with three technical replicates). (B) 19–29 WT fibrils are mildly cytotoxic and 19–29 S20G fibrils are significantly more cytotoxic than 19–29 WT fibrils (****p<0.0001 using a Mann-Whitney U test; n = 12 across four biological replicates, each with three technical replicates). 19–29 S20G fibrils (10 μM) are similarly cytotoxic to full-length hIAPP fibrils at the same concentration (lower dashed line) (p=0.09 using an unpaired t-test with equal standard deviations). (C) The insoluble fraction of the 50 μM 19–29 S20G cytotoxic preparation contains the cytotoxic species. 19–29 S20G fibrils were formed overnight at room temperature and then pelleted by centrifugation. The soluble fraction was carefully removed and then filtered to ensure it contained no insoluble material. The insoluble material was resuspended in its original volume. Each sample was applied to HEK293 cells and then cell viability was quantified with MTT dye reduction (***p<0.0002 using an ordinary one-way ANOVA; n = 3 technical replicates) (D) and (E) Using a FRET-based biosensor assay for monitoring caspase-3 activity in real-time, 19–29 S20G fibrils induce the most caspase-3 activity, whereas segments 15–25 did not induce caspase-3 activity, consistent with the MTT dye reduction assay results. 50 μM of each spine segment seeded with 166 nM seeds was applied to stably transfected CHO cells. (D) Fold difference was recorded over 24 h. Datapoints represent average fold difference. The dashed line represents the 16 h mark. (E) Average levels of caspase-3 activation after a 16 h incubation relative to untreated cells (***p<0.0002; ****p<0.0001 using an ordinary one-way ANOVA, Bonferroni correction; n = 5 technical replicates).
Figure 5—figure supplement 1
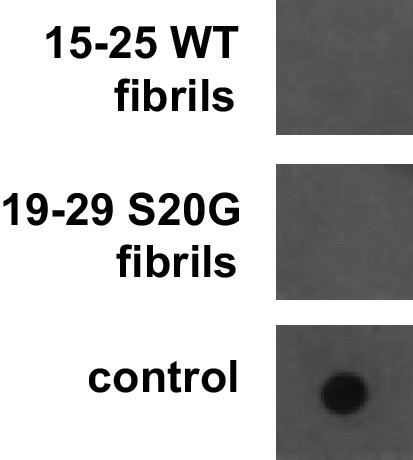
Fibrillar samples of 15–25 WT and 19–29 S20G do not contain detectable amyloid oligomers.
Oligomers were probed using a dot bot assay with the polyclonal anti-oligomer antibody, LOC. hIAPP oligomers were used as the positive control for LOC binding.
Figure 5—figure supplement 2
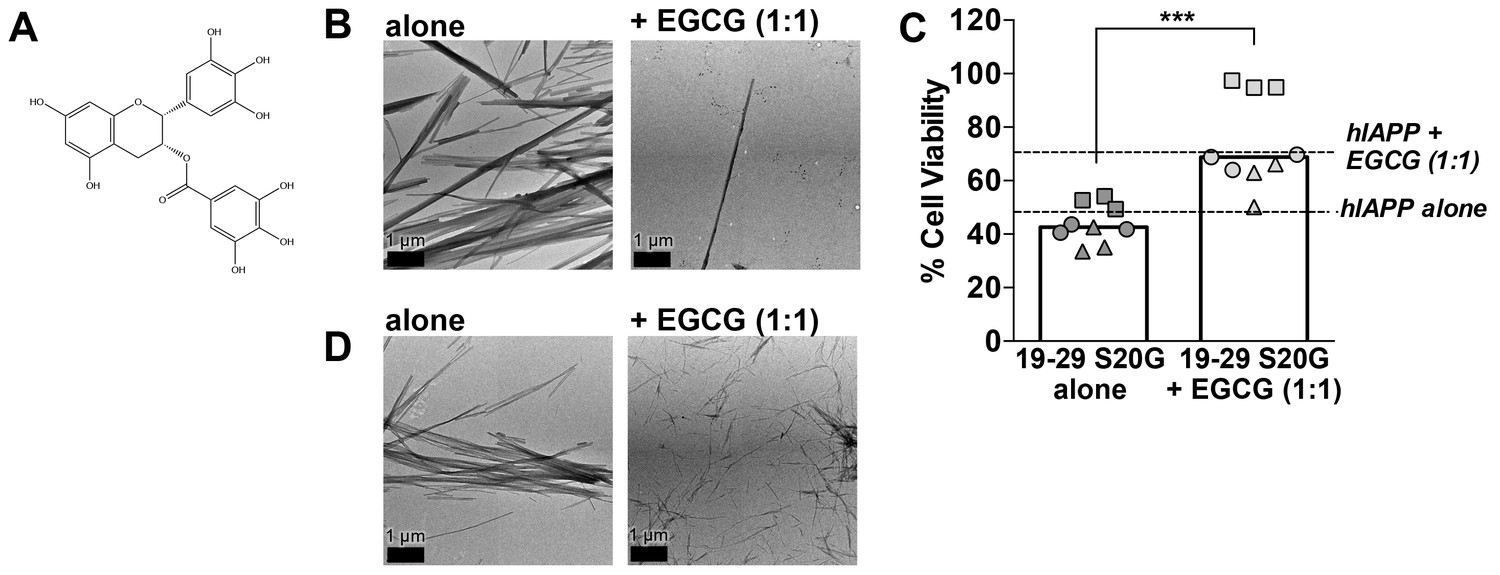
(−)-epigallocatechin gallate (EGCG), a flavanol known to mitigate full-length hIAPP cytotoxicity by preventing it from forming fibrils, likewise mitigates 19–29 S20G cytotoxicity by preventing it from forming fibrils.
(A) Chemical structure of EGCG. (B) Negative-stain electron micrographs reveal that EGCG mitigates 19–29 S20G fibril formation. 19–29 S20G was incubated overnight at room temperature under quiescent conditions in buffer alone or with equimolar concentration of ECGC. Next, the samples were spotted onto carbon-coated copper grids for negative-stain EM analysis. (C) EGCG mitigates 19–29 S20G cytotoxicity. Samples were generated as described in panel B and then applied to HEK293 cells. Cell viability was quantified using MTT dye reduction. Columns indicate median cell viability. Different symbols correspond to values observed in each independent experiment (***p=0.0004 using a unpaired t-test with Welch’s correction for unequal variances; n = 9 across three biological replicates, each with three technical replicates). (D) Negative-stain EM reveals that EGCG does not mitigate fibril formation of 15–25 WT, a spine segment that does not possess a hydrophobic core. 15–25 WT was incubated for five days under shaking conditions with equimolar concentrations of EGCG. Next, the samples were spotted onto carbon-coated copper grids for negative-stain EM.
Figure 6 with 1 supplement
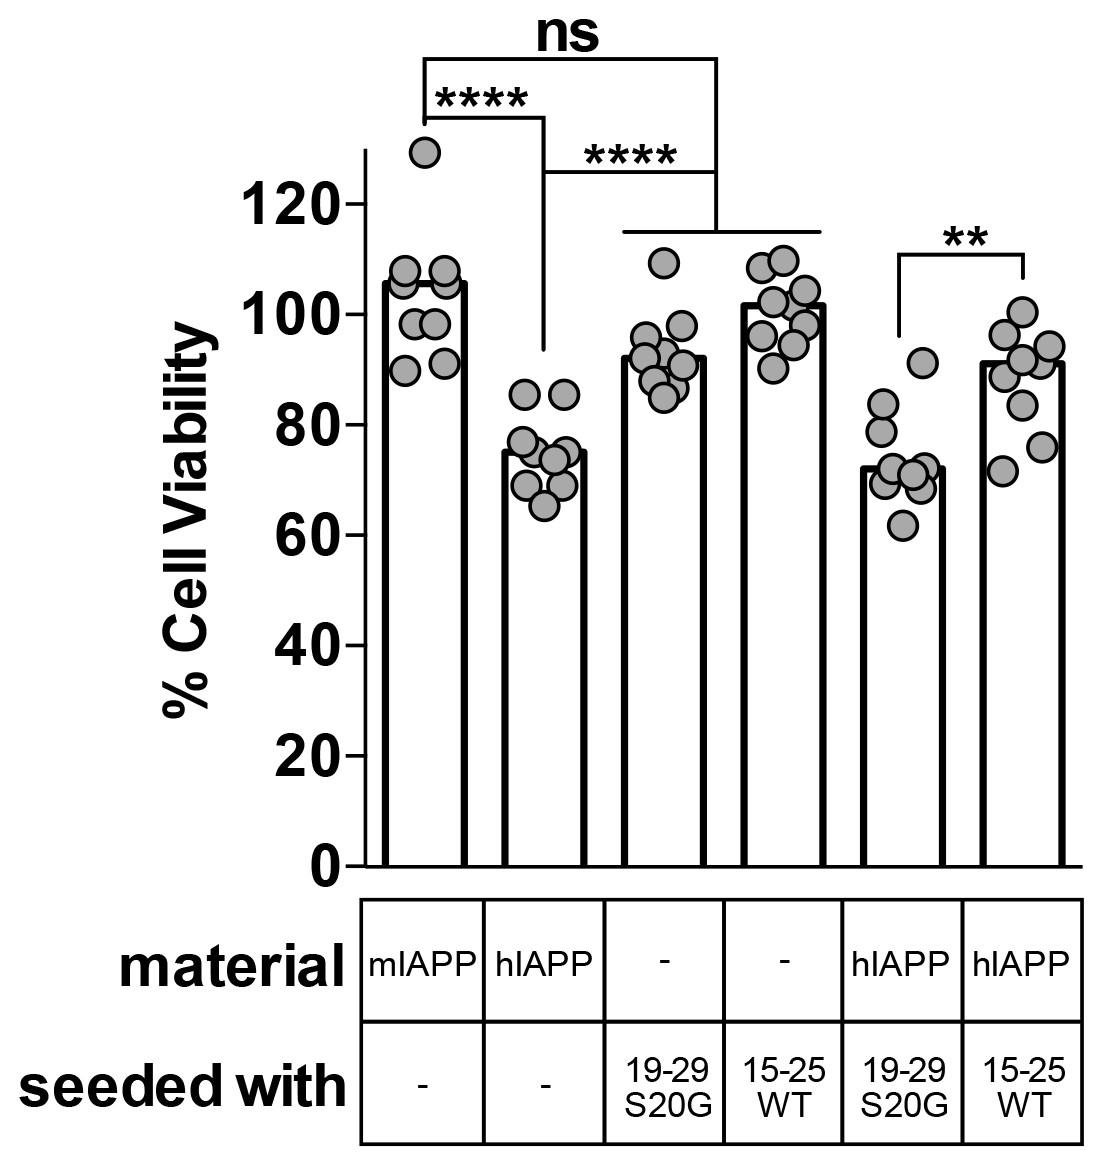
Fibril seeds of 15–25 WT reduce the cytotoxicity of full-length hIAPP.
In this experiment, we incubated 10 μM hIAPP with or without 10% monomer equivalent of pre-formed seeds overnight under quiescent conditions, the same conditions used to seed full-length hIAPP fibril formation in Figure 1. Next, we diluted the samples 1 to 10 in culture media containing pre-plated Rin5F cells. Note: the concentration of IAPP used in this experiment is less than the IAPP concentrations used in the cytotoxicity assays in Figures 1 and 5. hIAPP seeded with stable, toxic 19–29 S20G fibrils is more cytotoxic to Rin5F cells than hIAPP seeded with labile, non-toxic 15–25 WT fibrils. Columns indicate median cell viability (ns = not significant; **p=0.006; ****p<0.0001 using an unpaired t-test with equal standard deviations, n = 9 across three biological replicates, each with three technical replicates). 19–29 S20G seeds and 15–25 WT seeds (100 nM each) are not cytotoxic to Rin5F cells.
Figure 6—figure supplement 1
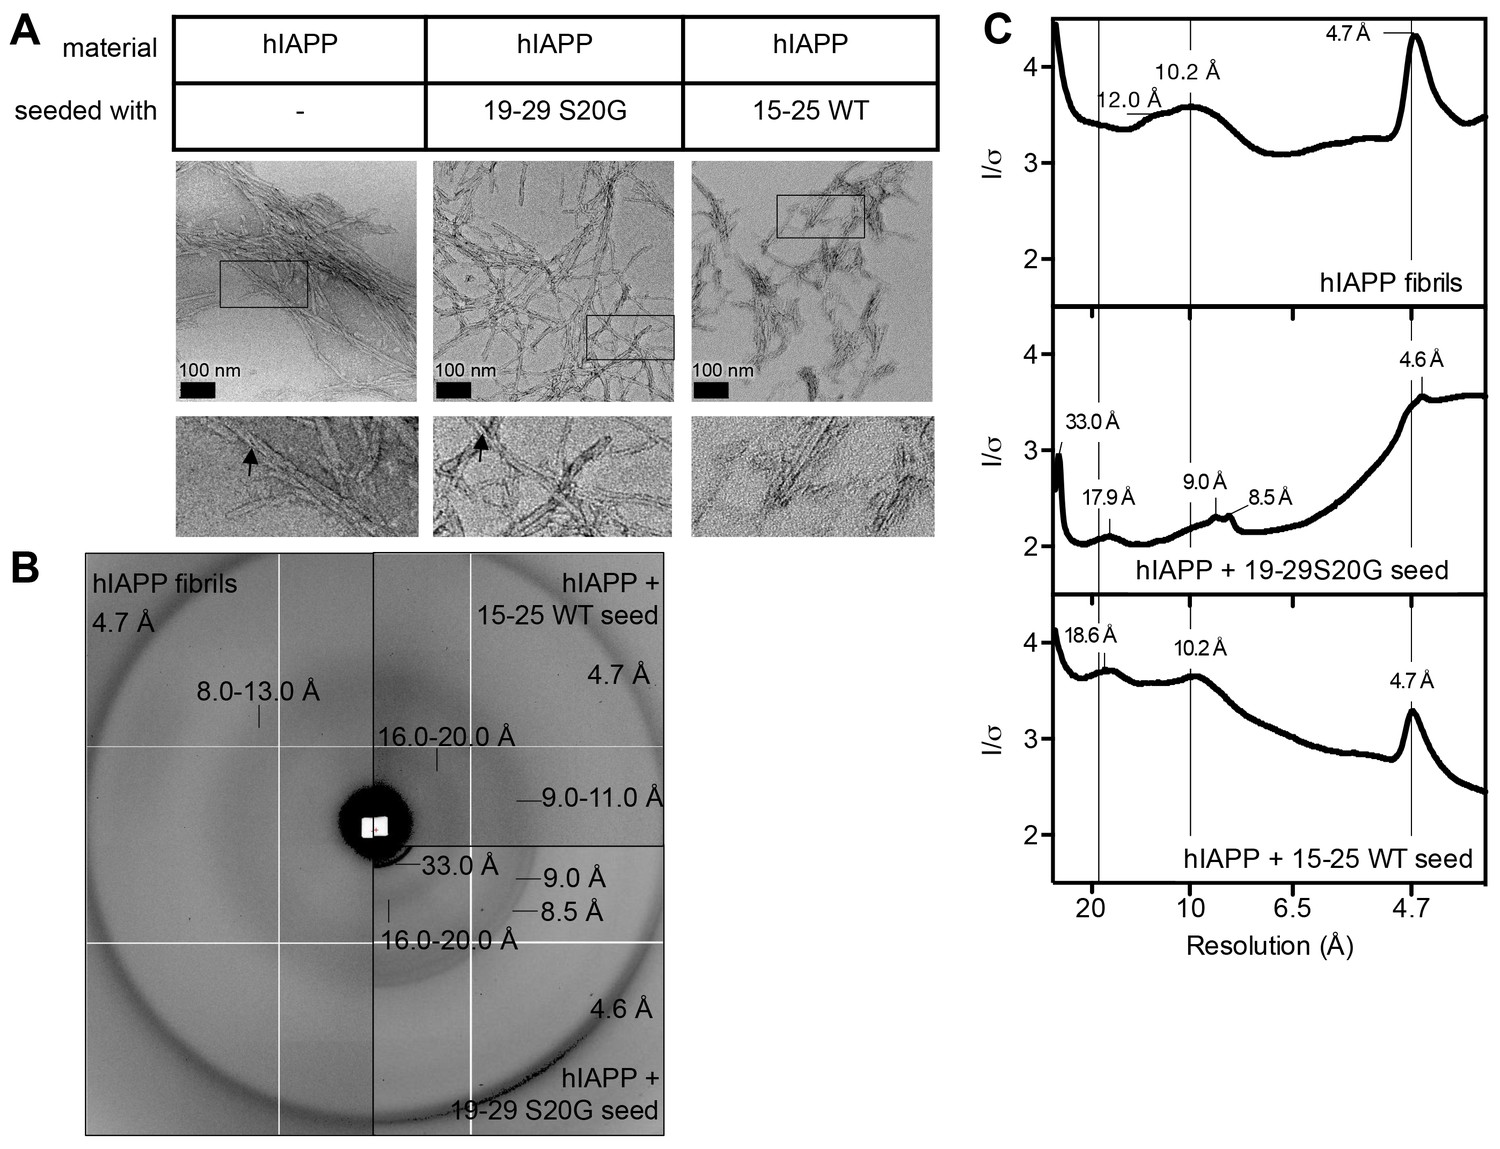
hIAPP fibrils made by seeding with each spine segment have slightly different structural features.
(A) Negative-stain electron micrographs reveal fibrils made by seeding with each spine segment do not have markedly different morphologies. Unseeded hIAPP forms pre-dominantly striated ribbons of uniform width that bundle together; some fibrils have twists (black arrow head). hIAPP fibrils made by seeding with stable, toxic 19–29 S20G fibrils form striated ribbons of varying widths and some twisted fibrils (black arrow head). hIAPP fibrils made by seeding with labile, non-toxic 15–25 WT fibrils form striated ribbons that appear slightly thinner than unseeded hIAPP fibrils. (B) and (C) X-ray fiber diffraction and radial profile analysis suggest hIAPP fibrils made by seeding with toxic and non-toxic segments have slightly different structures. hIAPP fibrils made by seeding with stable, toxic 19–29 S20G fibrils display shorter Bragg spacings compared to hIAPP fibrils made by seeding with labile, non-toxic 15–25 WT fibrils. The shorter spacings suggest tighter fibril packing.
Figure 7
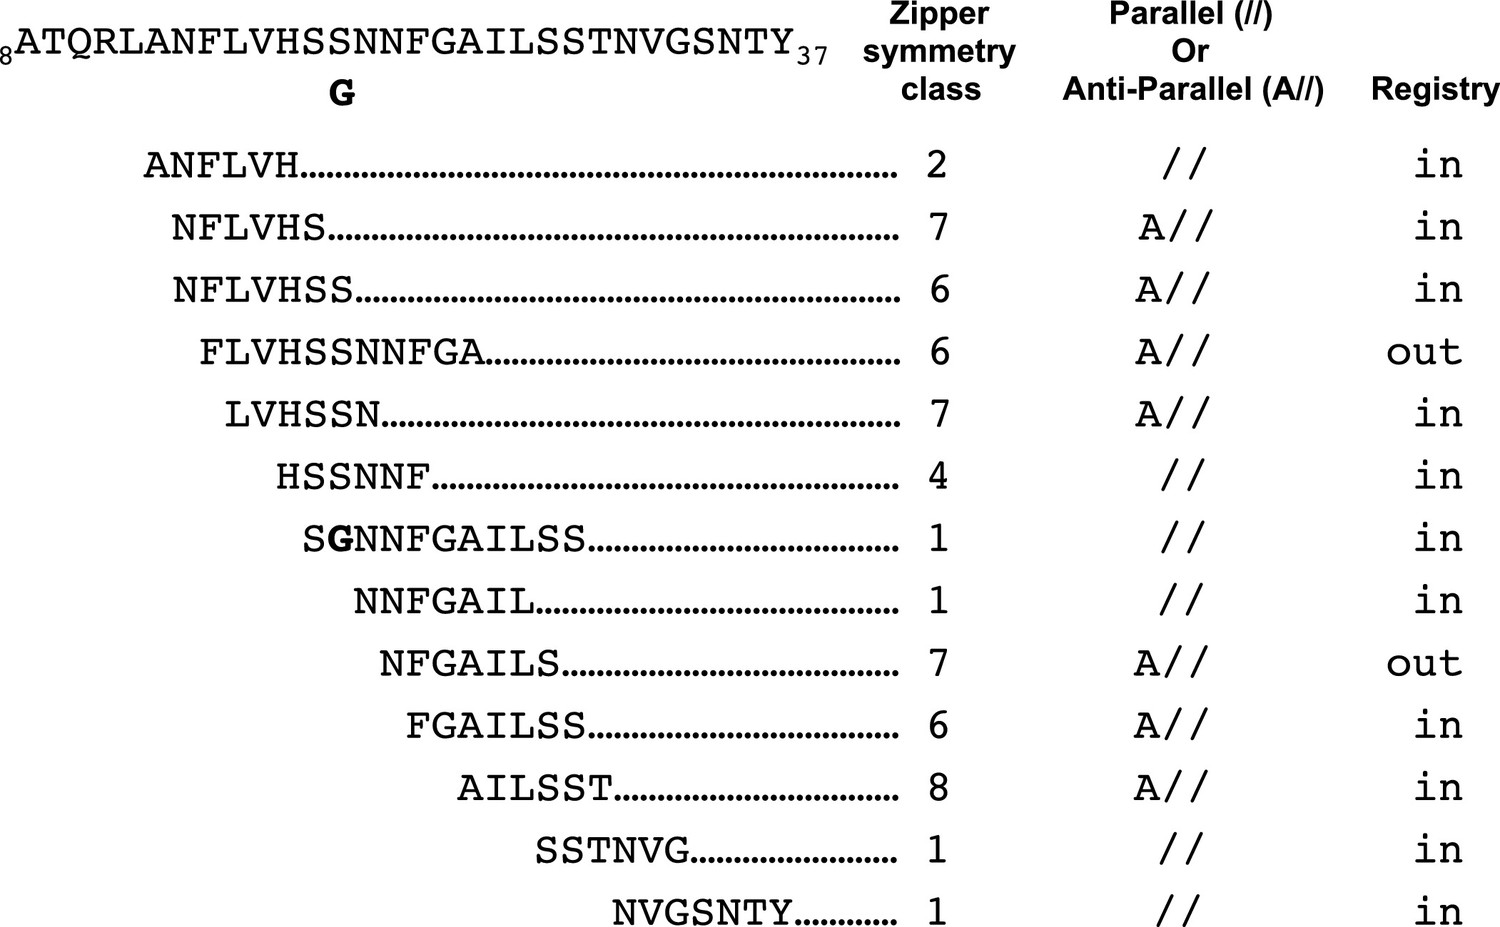
Schematic of structural features of all hIAPP protein segment structures determined to date.
Parallel (//) or Anti-parallel (A//) refers to the orientation of β-strands within β-sheets. Registry refers to the translational offset of β-sheets perpendicular to the fiber axis.
Tables
Table 1
Statistics of MicroED data collection and atomic refinement.
Sample | 19–29 S20G | 15–25 WT |
|---|---|---|
Excitation Voltage (kV) | 200 | 200 |
Electron Source | field emission gun | field emission gun |
Wavelength (Å) | 0.0251 | 0.0251 |
Total dose per crystal (e−/ Å2) | 3.4 | 2.9 |
Frame rate (frame/s) | 0.3–0.5 | 0.3–0.5 |
Rotation rate (°/s) | 0.3 | 0.3 |
# crystals used | 6 | 6 |
Total angular rotation collected (°) | 68 | 68 |
Merging Statistics | 19–29 S20G | 15–25 WT |
space group | P212121 | P1 |
Unit cell dimensions | ||
a, b, c (Å) | 4.78, 18.6, 70.8 | 11.68, 18.18, 19.93 |
α, β, γ (°) | 90, 90, 90 | 62.8, 88.9, 87.6 |
Resolution (Å) | 1.9 | 1.4 |
Rmerge | 10.6% (15.0%) | 19.9% (50%) |
# of reflections | 1380 (221) | 9014 (153) |
Unique reflections | 548 (115) | 2180 (84) |
Completeness | 83% (65%) | 75% (35.3%) |
Multiplicity | 2.5 (1.9) | 4.1 (1.8) |
I/σ | 5.65 (3.65) | 4.33 (1.10) |
CC1/2 (Diederichs, 2013) | 98.9% | 98.5% |
Refinement Statistics | 19–29 S20G | 15–25 WT |
Reflections in working set | 546 | 2177 |
Reflections in test set | 53 | 218 |
Rwork† | 22.75% | 22.47% |
Rfree | 27.49% | 25.90% |
RMSD bonds (Å) | 0.01 | 0.008 |
RMSD angles (°) | 1.2 | 1.2 |
Ramachandran (%)‡ | ||
Favored | 100 | 100 |
Allowed | 0 | 0 |
Outliers | 0 | 0 |
PDB ID code | 5KNZ | 5KO0 |
EMDB ID code | EMD-8272 | EMD-8273 |
-
*Highest resolution shell shown in parenthesis.
-
†
-
Fcalc and Fobs are the calculated and observed structure factor amplitudes, respectively. Rwork refers to the Rfactor for the data utilized in the refinement and Rfree refers to the Rfactor for 10% of the reflections randomly chosen that were excluded from the refinement.
-
‡Percentage of residues in Ramachandran plot regions were determined using Molprobity (Chen et al., 2010).
Additional files
-
Supplementary file 1
Summary of structural features and biophysical properties of all hIAPP protein segment structures determined to date.
- https://doi.org/10.7554/eLife.19273.024
Download links
A two-part list of links to download the article, or parts of the article, in various formats.
Downloads (link to download the article as PDF)
Open citations (links to open the citations from this article in various online reference manager services)
Cite this article (links to download the citations from this article in formats compatible with various reference manager tools)
Atomic structures of fibrillar segments of hIAPP suggest tightly mated β-sheets are important for cytotoxicity
eLife 6:e19273.
https://doi.org/10.7554/eLife.19273


