Neuronal cell fate diversification controlled by sub-temporal action of Kruppel
- Linköping University, Sweden
- Universidad Autónoma de Madrid, Spain
Figures
Figure 1
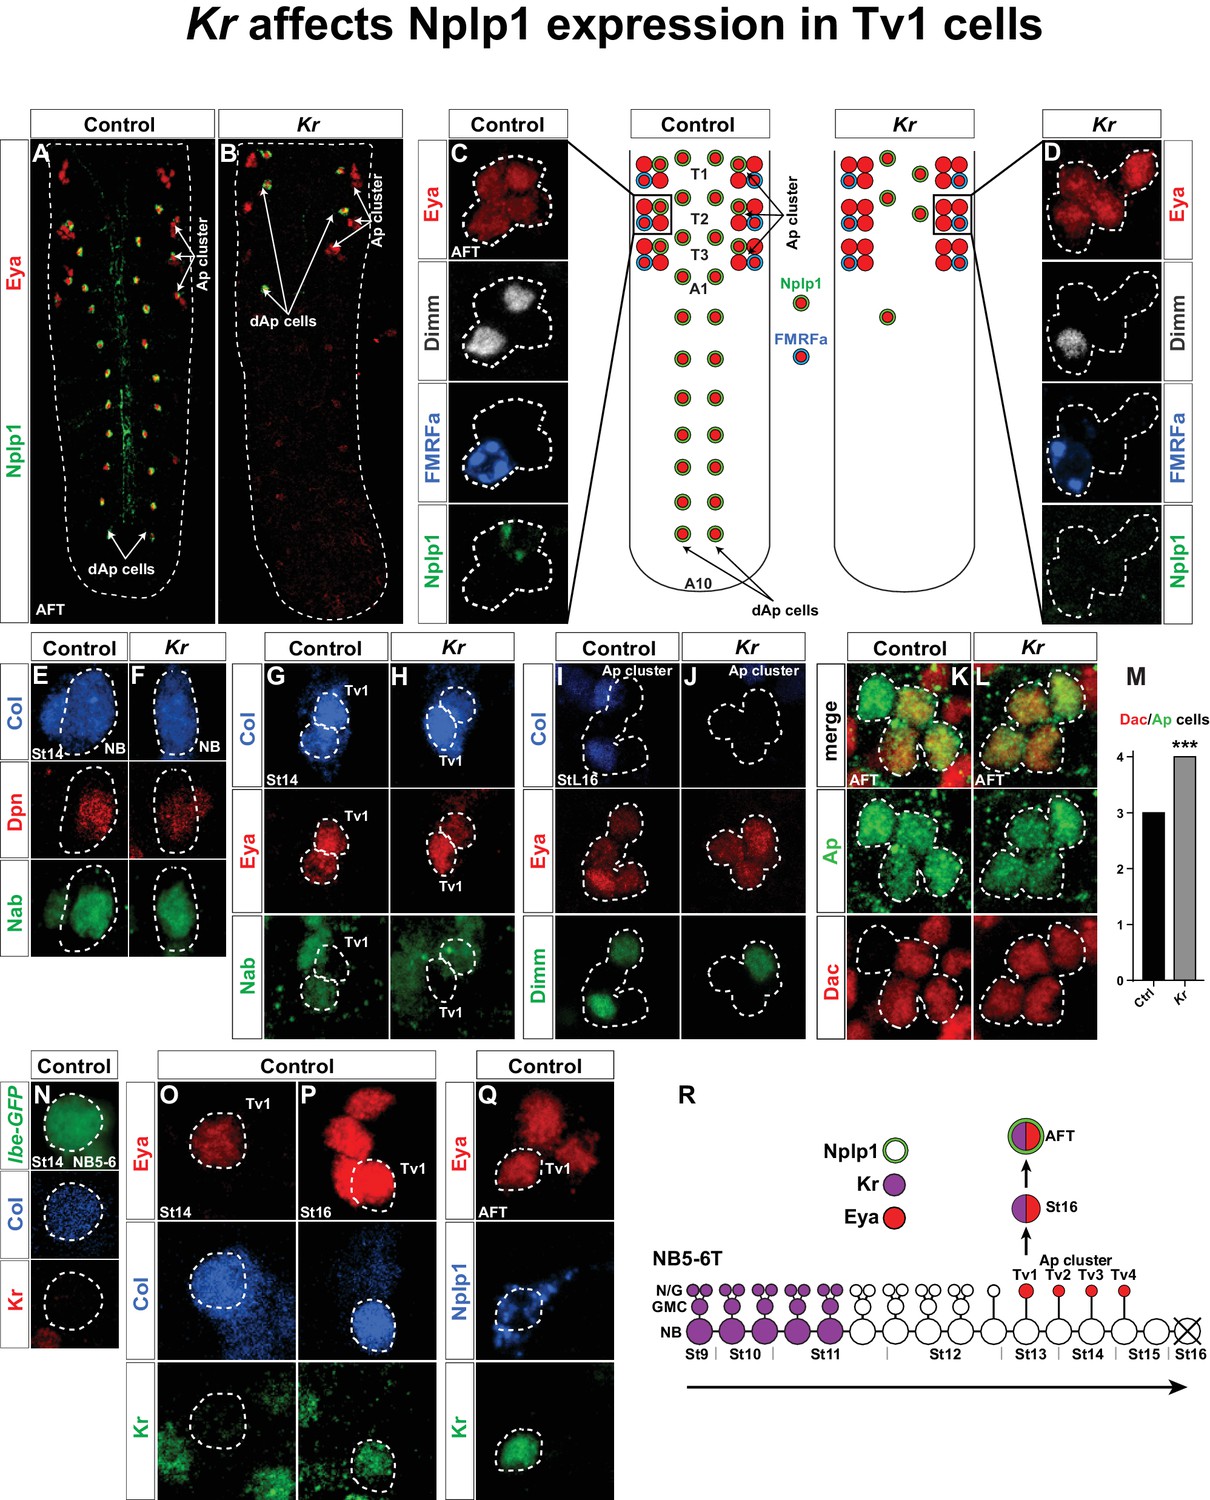
Kr affects Nplp1 expression in Tv1 cells.
(A–B) Whole VNCs of control and Kr mutants, at AFT, reveal loss of Nplp1 expression in the dAp cells, but also in the Tv1 cells. (C–D) Ap cell clusters at AFT, showing an expression of Eya, Dimm, FMRFa and Nplp1, in control (C) and Kr mutants (D). In mutants, while Eya is normally expressed in four cells, Dimm and Nplp1 expression is lost in the Tv1 cell. Dimm and FMRFa expression in the Tv4 cell is not affected in Kr mutants compared to control. (E–F) Nab and Col expression, in the NB5-6T at St14, is similar in control and Kr mutants. (G–H) In Tv1 cells (dashed circles) at St14 (distinguishable from Tv2 cells by positive Eya but negative Nab expression) Col expression is similar in control and Kr mutants. (I–J) At late St16, while Eya is un-affected, Col and Dimm expression is lost in the Tv1 cell in Kr mutants. (K–L) While Dac is usually expressed in three out of four cells in the Ap clusters at AFT, we find that in Kr mutants Dac expression is observed in all four Ap cluster cells. (M) Dac is significantly upregulated in Kr mutants when compared to control (***p<0.001, nctrl = 7 clusters, nKr = 10 clusters, Chi-square test). (N–Q) Timeline of Kr expression in control shows late onset of Kr expression specifically in the Tv1 cell. (N) Kr is not expressed in the NB5-6T or (O) the Tv1 cell at St14. (P) At St16, Kr expression commences in Tv1 (dashed circle), which is characterized by maintenance of strong Col expression. (Q) Variably, Kr expression in Tv1 is maintained into AFT, identifiable by co-staining for Eya and Nplp1. (R) Model of NB5-6T, showing the early Kr expression commencing at St9 and persisting until St11, together with the Eya positive postmitotic Ap cluster cells, out of which Tv1 starts to express Kr at St16, to ultimately specify into the Nplp1 positive Tv1 cells. Genotypes: (A, C, E, H, J, L, O, P, Q) OregonR. (B, D, F, I, K, M) Kr1, KrCD. (N) lbe(K)-EGFP.
Figure 2
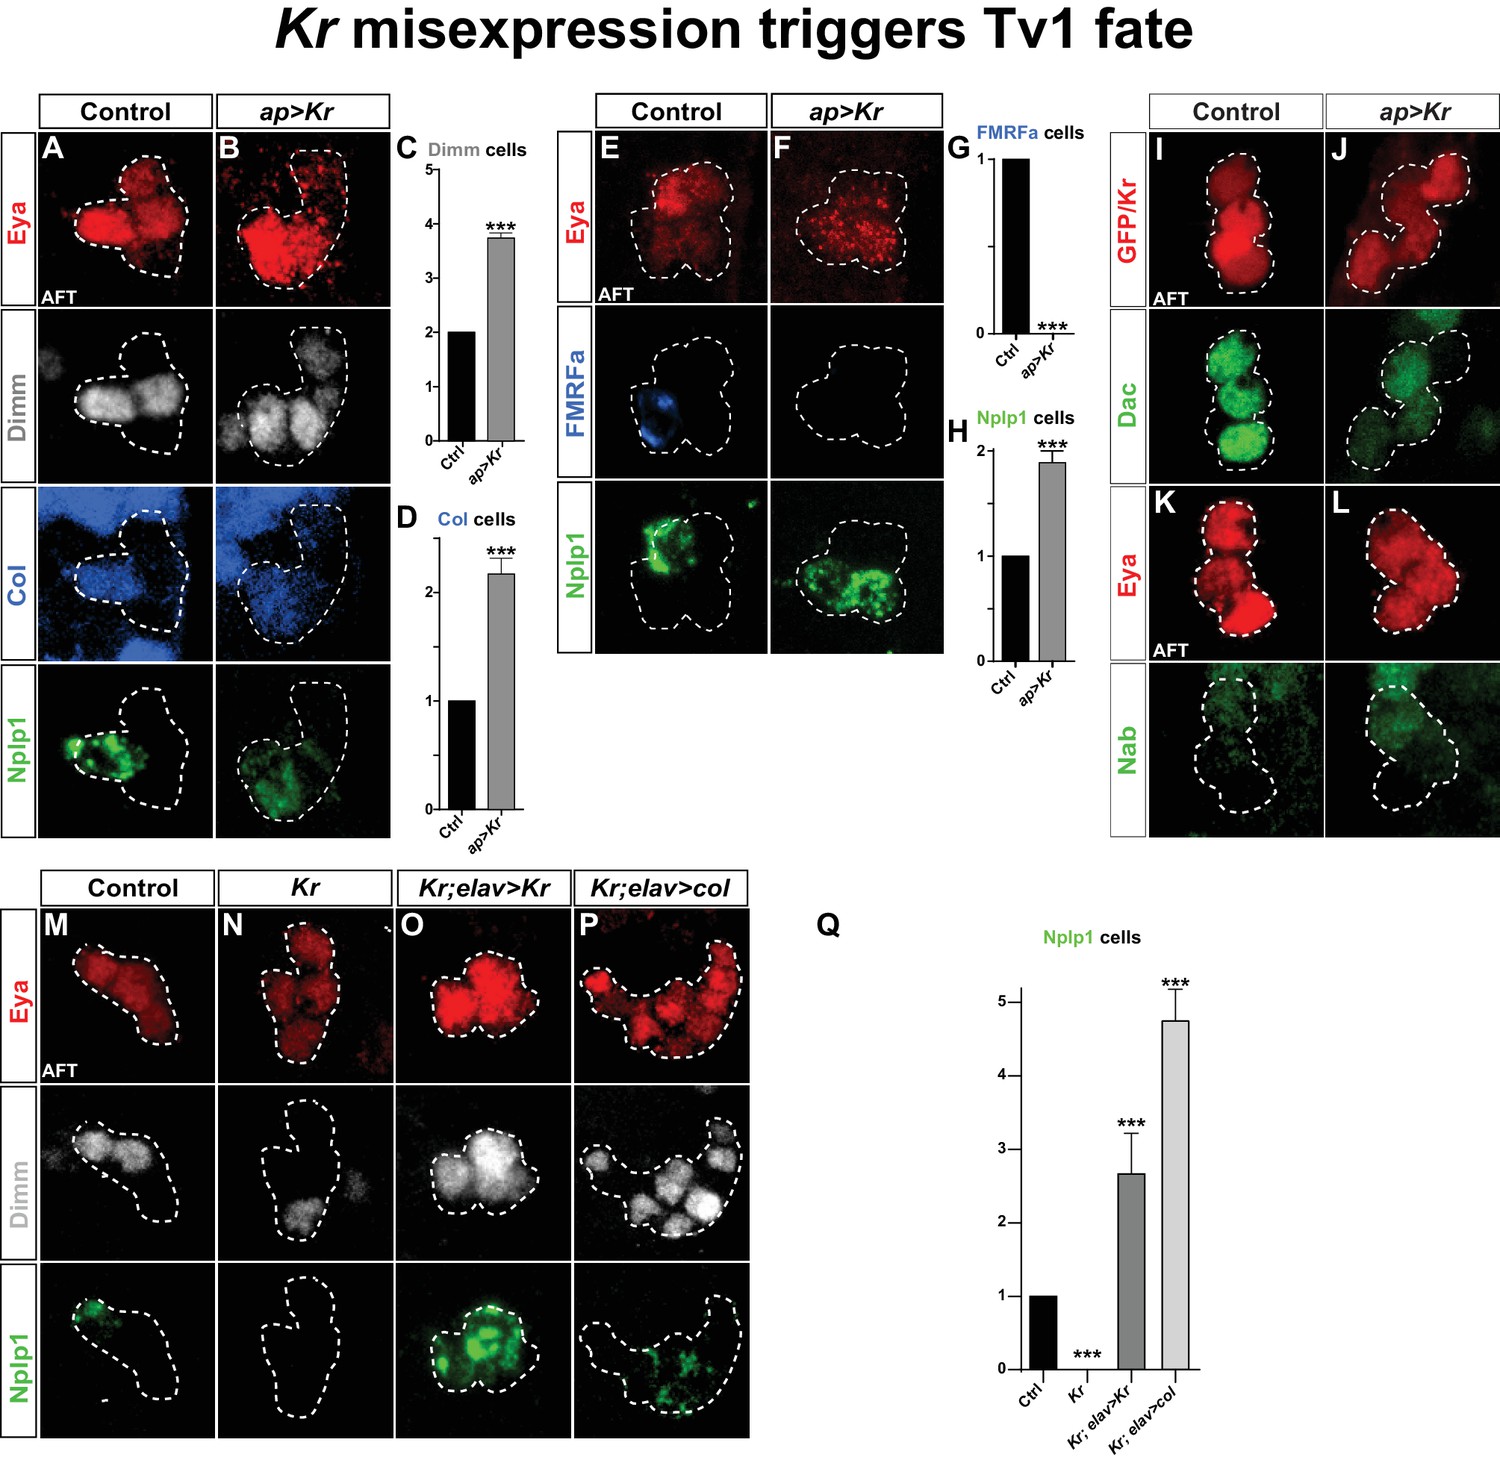
Kr misexpression triggers Tv1 fate.
(A–D) Postmitotic misexpression of UAS-Kr driven by ap-Gal4 results in ectopic expression of Dimm, Col and Nplp1 in the Ap cluster cells. (C–D) Quantification of Dimm and Col cells in the Ap cluster shows a significant increase when Kr is misexpressed (***p<0.001; n ≥ 12 clusters; Chi-square test +/- SEM). (E–H) Kr misexpression triggers ectopic expression of Nplp1 in the Ap cluster, but loss of FMRFa expression. (G–H) Quantification of FMRFa and Nplp1 expressing cells in the Ap cluster (***p<0.001; n ≥ 9 clusters; Chi-square test +/- SEM). (I–L) Misexpression of Kr, does not affect Dac or Nab expression. (M–O) Kr rescue by UAS-Kr driven from elav-Gal4 restores Dimm and Nplp1 specifically to Tv1. (P) Cross-rescue of Kr with UAS-col from elav-Gal4 rescues Kr mutants, evident by Dimm and Nplp1 expression in the Ap clusters. In both rescue and cross-rescue, driving each UAS transgene from elav-Gal4 triggers supernumerary Tv1 cells. (Q) Quantification of the number of cells expressing Nplp1 in the Ap cluster (***p<0.001; n ≥ 9 clusters; Chi-square test +/-SEM). Genotypes: (A, E, K, M) OregonR. (B, F, J, L) ap-Gal4/UAS-Kr; +/UAS-Kr. (I) UAS-GFP/ap-Gal4. (N) Kr1, KrCD. (O) elav-Gal4/+; Kr1, KrCD; UAS-Kr/+. (P) Kr1, KrCD; UAS-col/elav-Gal4.
Figure 3 with 1 supplement
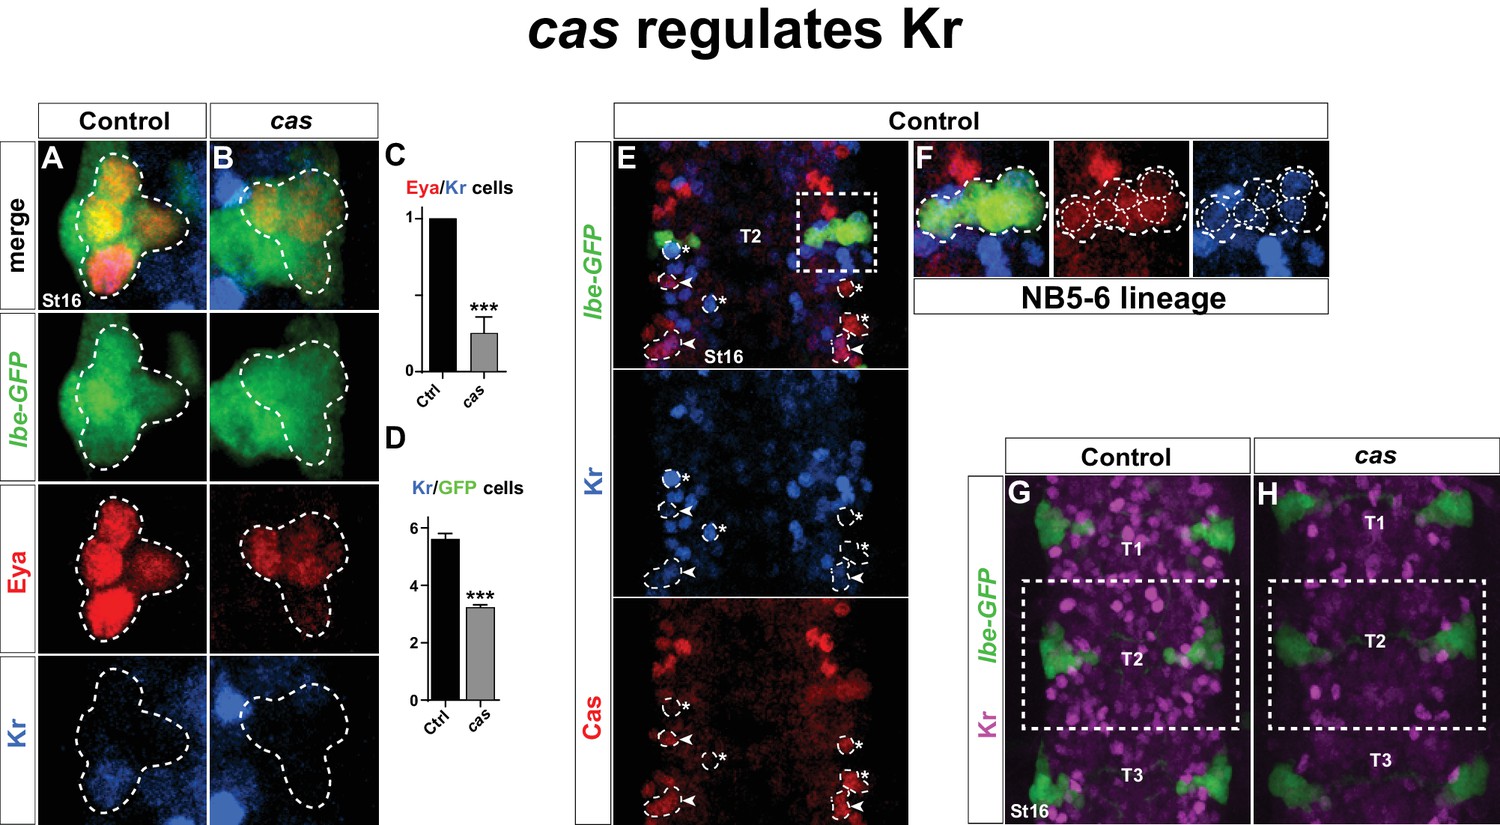
castor regulates Kr.
(A–B) Kr expression in the Ap cluster cells is frequently lost in cas mutants at St16. Ap cluster cells were identified using Eya as a marker for the Ap cluster and lbe(K)-eGFP as a marker for the NB5-6T lineage. (C–D) Quantification of Eya/Kr cells and Kr/GFP cells in the Ap cluster and NB5-6T lineage, respectively (***p<0.001, n ≥ 18 clusters, Chi-square test ± SEM, for (C), and Student's t-test ± SEM, for (D)). (E–F) Kr expression overlaps with Cas in the NB5-6T (F), as well as in many cells in the entire thorax (arrowhead marks overlapping cells, asterisk marks non-overlapping cells). (G–H) Kr expression is globally reduced in the thoracic region T1-T3 in cas mutants. Genotypes: (A, K) lbe(K)-EGFP. (B, L) lbe(K)-EGFP /+; casΔ3/casΔ1.
Figure 3—figure supplement 1
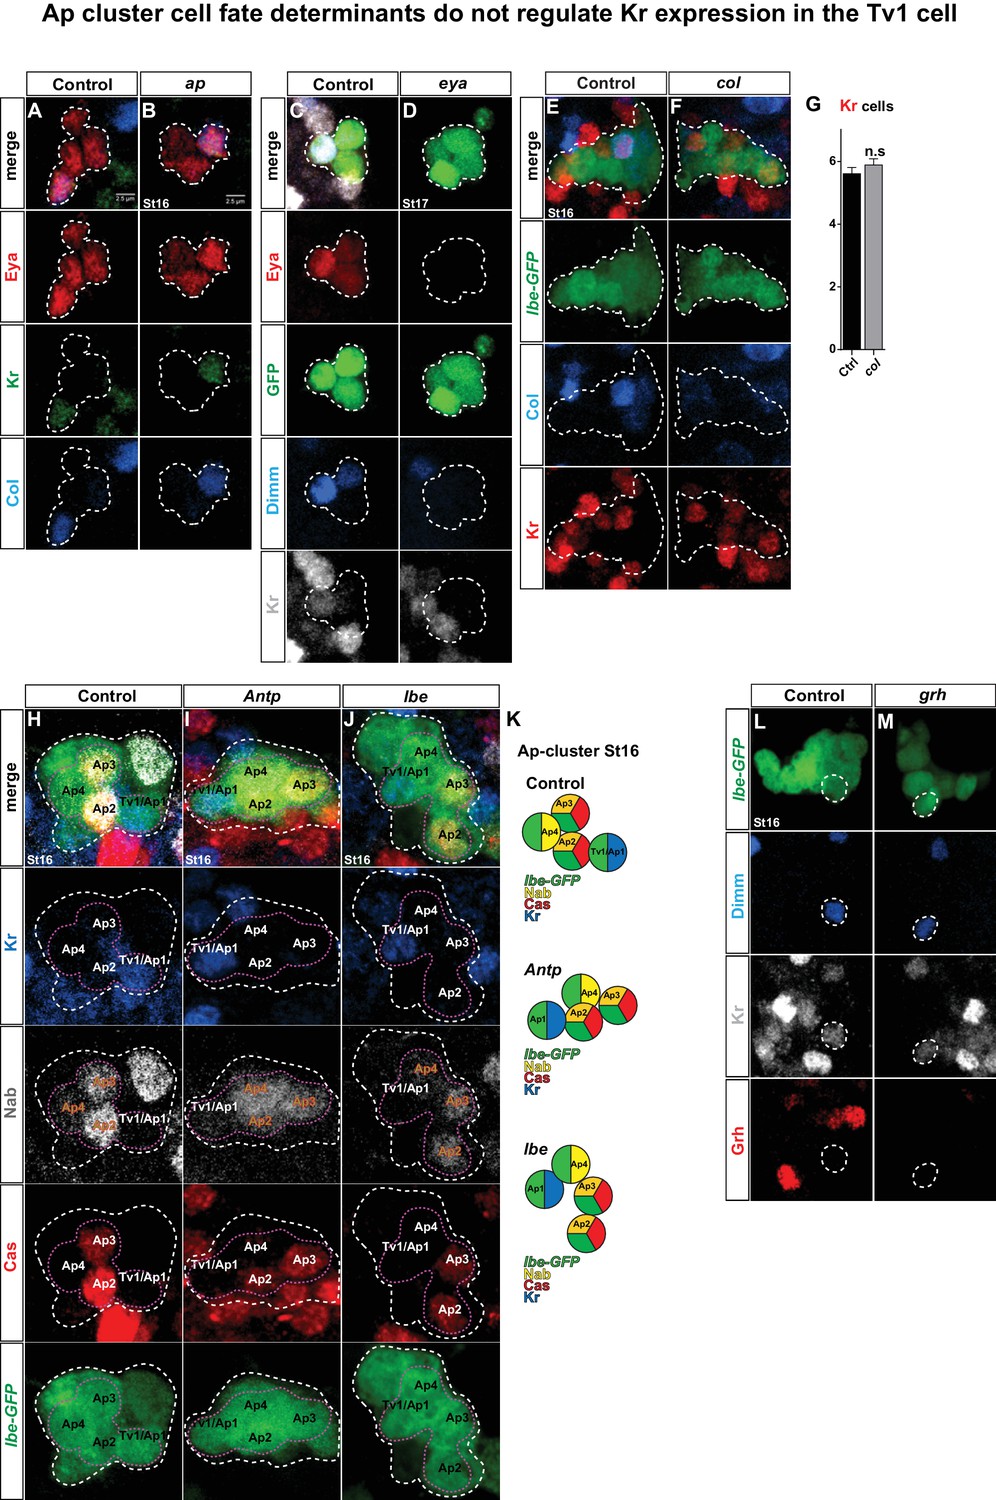
Ap cluster cell fate determinants do not regulate Kr in Tv1.
(A–B) Staining for Eya, Col and Kr in ap mutants, at St16, has no effect on Eya, Col and Kr expression. (C–D) Staining for Eya, GFP, Dimm and Kr in eya mutants, at St17, shows loss of Eya and Dimm expression, but Kr expression is unaffected in the Ap cluster. (E–G) col mutants do not show any effects on Kr expression in the Ap cluster at St 16 (n = 18 lineages; Student's t-test ± SEM). (H–J) Staining for GFP, Kr, Nab and Cas in control, Antp and lbe mutants, at St16, shows that Kr expression is not affected in the Tv1 cell. (K) Cartoon depicting the Ap cluster composition at St16, with the markers analyzed for control, Antp and lbe mutants. (L–M) grh mutants show normal Dimm and Kr expression in Tv1 at St16. Genotypes: (A) OregonR. (B) apP44/apP44. (C) UAS-GFP/ap-Gal4. (D) eyaCli/eyaDf; ap-Gal4/UAS-nmEGFP. (E, H, L) lbe(K)-EGFP. (I) lbe(K)-EGFP/+; Antp12/Antp25. (J) lbe(K)-EGFP/+; lbDf/lbe12C005. (M) grhDf3064/grh370,lbe(K)-Gal4; UAS-nmEGFP.
Figure 4
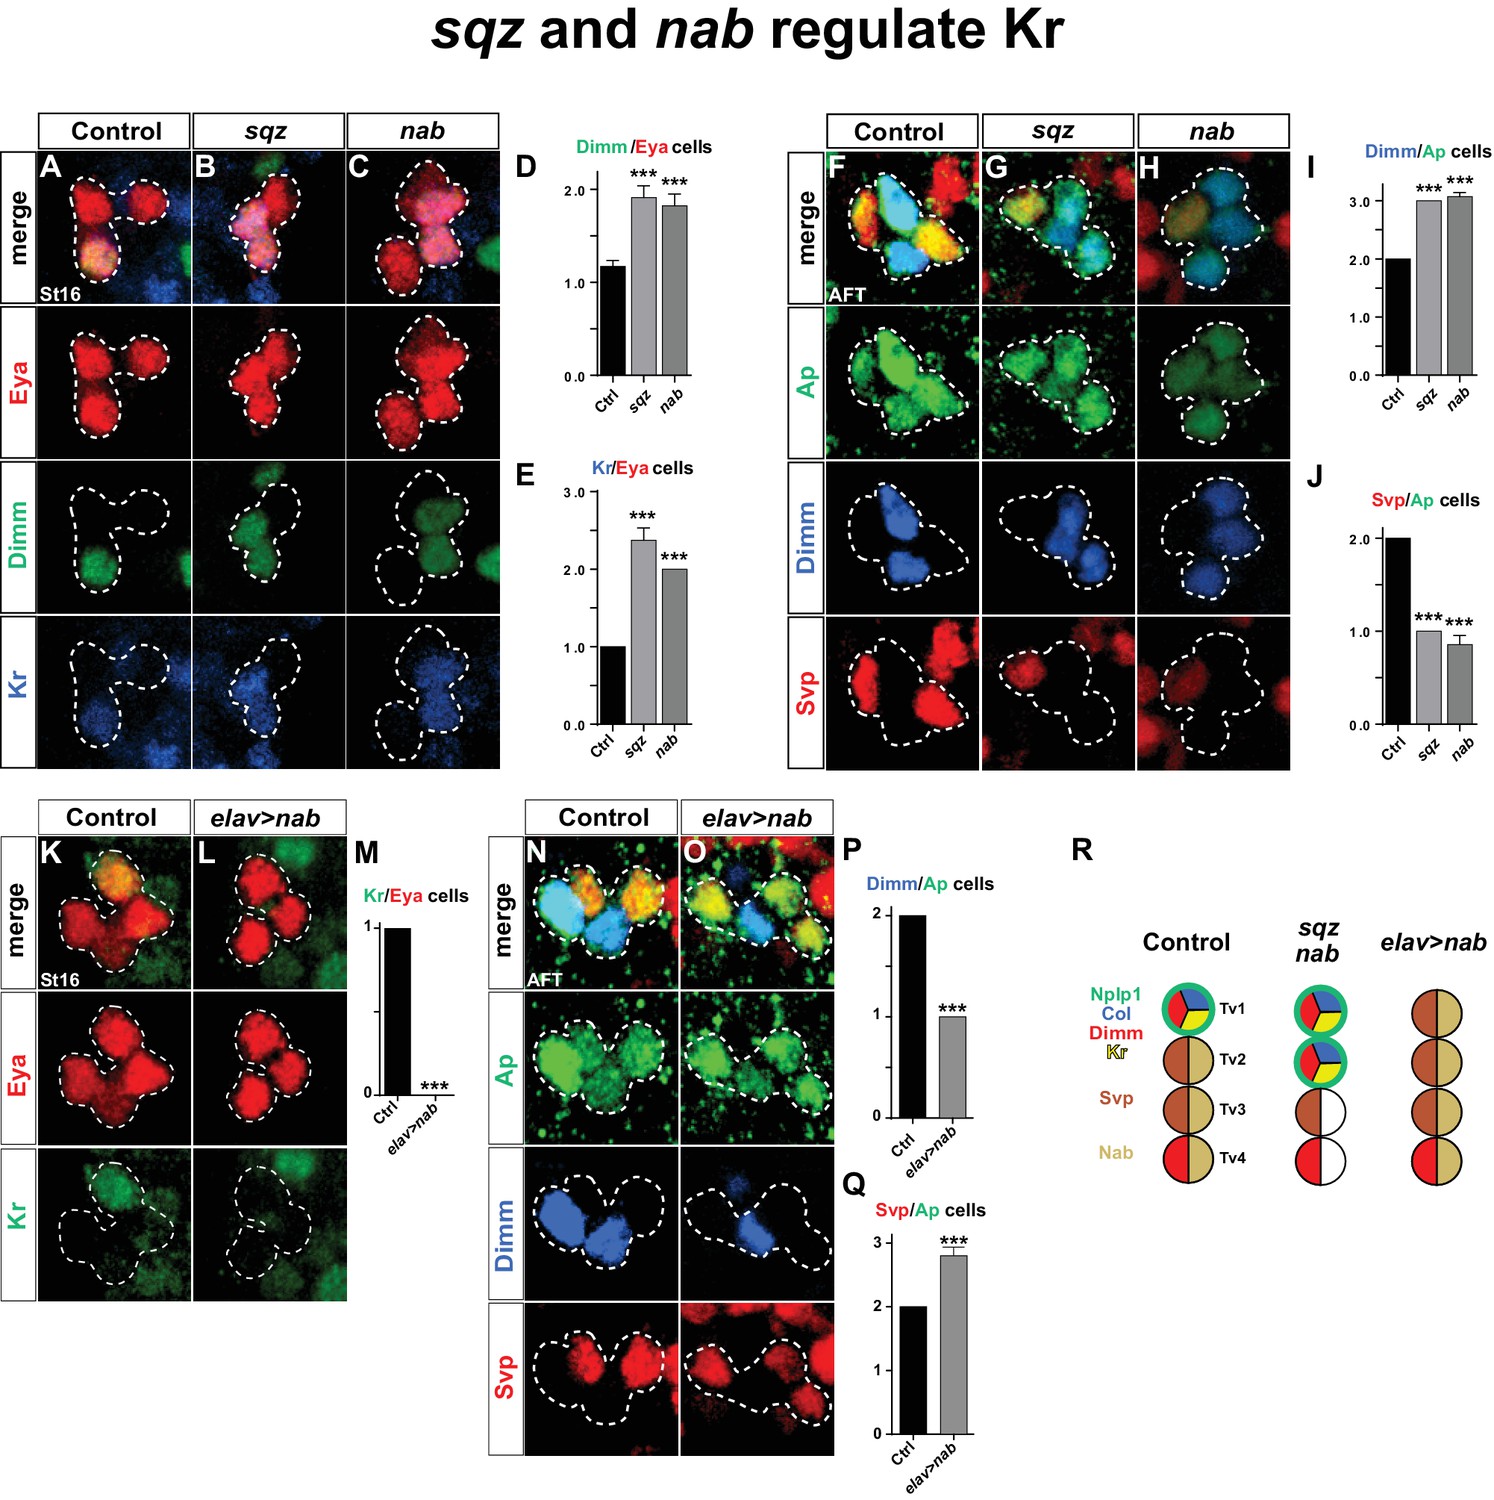
squeeze and nab regulate Kr.
(A–C) At St16, both sqz and nab mutants show additional Dimm and Kr expressing cells in the Ap cluster. (D–E) Quantification of Dimm and Kr expressing Ap cluster cells in sqz and nab mutants (***p<0.001; n ≥ 17 clusters; Student's t-test +/-SEM for (D) and between Ctrl and sqz in (E); Chi-square test for Ctrl and nab in (E)). (E–H) Similar to St16, at AFT, both sqz and nab mutants show an increase in the numbers of Dimm expressing Ap cluster cells. (I–J) Quantification of Dimm/Ap and Svp/Ap cells (***p<0.001; n ≥ 14 clusters; Chi-square test; +/-SEM). (K–L) Misexpression of nab from elav-Gal4 results in a significant decrease in Kr expressing Ap cluster cells, at St16. (M) Quantification of Kr/Eya Ap cluster cells (***p<0.001; n ≥ 16 clusters; Chi-square test). (N–O) nab misexpression from elav-Gal4 at AFT shows a reduction of Dimm expressing and an increase in Svp expressing Ap cluster cells. (P–Q) Quantification of Dimm/Ap and Svp/Ap cluster cells (***p<0.001; n ≥ 10 clusters; Chi-square test; ± SEM). (R) Cartoon showing the Ap cluster in control, sqz and nab mutants, as well as nab misexpression, at AFT. Control Ap clusters show stereotyped expression of Nplp1, Col and Kr in the Tv1 cell. Dimm is present in both neuropetidergic Tv1/Nplp1 and Tv4/FMRFa cells. While Tv2-Tv4 cells all express nab, svp expression is restricted to Tv2 and Tv3. In nab and sqz mutants one of the 'generic' Tv2/Tv3 Ap neurons is converted into a Tv1/Nplp1 cells, by expression of Kr, which in turn suppresses svp expression, which allows for col and dimm expression. The misexpression of nab shows the reciprocal phenotype of the mutants, with one extra Svp expressing cell, loss of Kr, Col, Dimm and Nplp1. Genotypes: (A, F, K, O) OregonR. (B, G) sqzie/sqzie. (C, H) nabR52/nabR52. (L, P) UAS-nab/+; elav-Gal4/+.
Figure 5 with 1 supplement
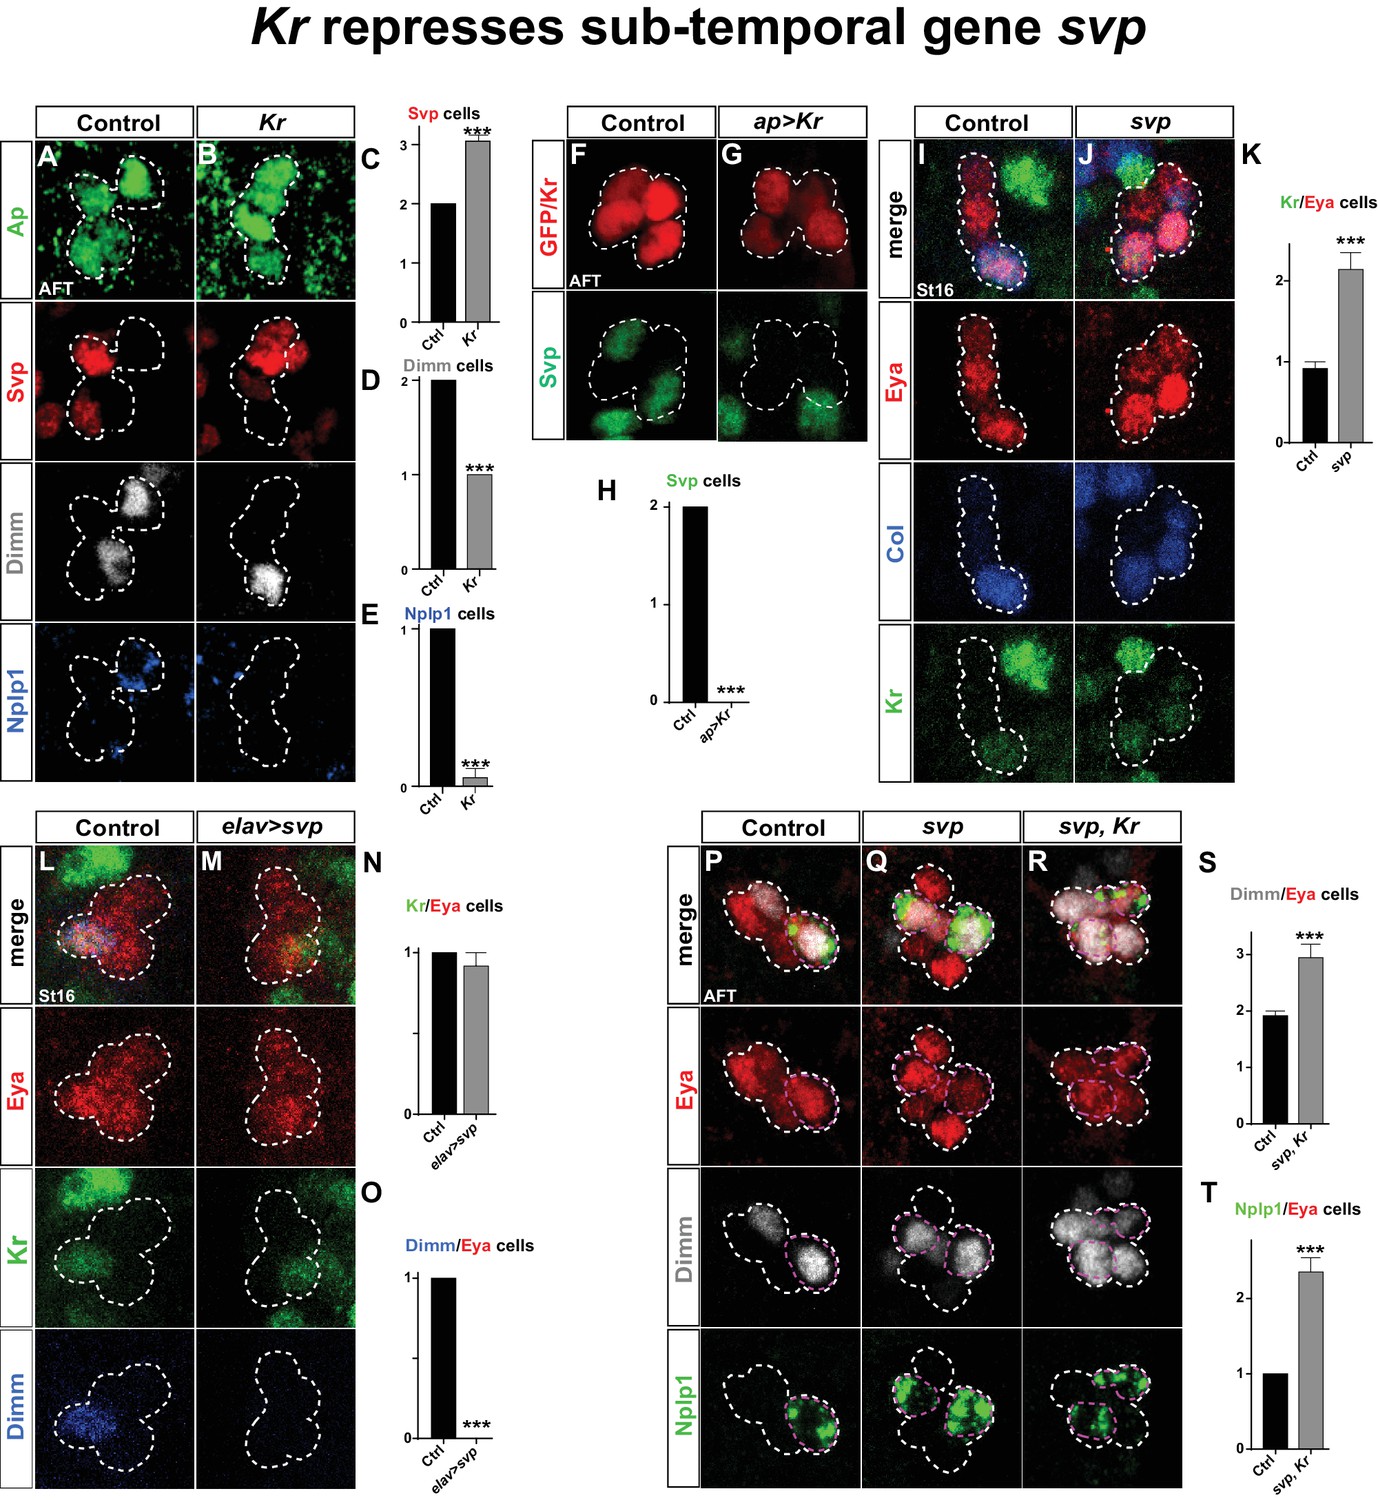
Kr represses the sub-temporal gene svp.
(A–B) Kr mutants at AFT, reveals ectopic Svp expression in the Tv1 cell, accompanied by loss of Dimm expression. (C–E) Quantification of Svp/Ap, Dimm/Ap and Nplp1/Ap expressing cells (***p<0.001; n ≥ 16 clusters; Chi-square test ± SEM). (F–G) Misexpression of Kr from the late and Ap cluster specific driver ap-Gal4, results in loss of Svp expression from Ap2/3, at AFT. (H) Quantification of Svp/GFP or Svp/Kr expressing cells (***p<0.001, n ≥ 12 clusters, Chi-square test). (I–J) svp mutants show increased number of Kr expressing cells in the Ap cluster. (K) Quantification of Kr/Eya expressing cells (***p<0.001, n ≥ 12 clusters, Student's t-test ± SEM). (L–M) Misexpression of svp from elav-Gal4 suppresses Dimm expression, but has no effect on Kr. (N–O) Quantification of Kr/Eya and Dimm/Eya expressing cells (***p<0.001; n ≥ 12 clusters; Chi-square test ± SEM). (P–R) Both svp and svp,Kr double mutants show an increase of Dimm and Nplp1 expressing cells in the Ap cluster. (S–T) Quantification of Dimm/Eya and Nplp1/Eya cells (***p<0.001, n ≥ 12 clusters, Student's t-test ± SEM in (S) and Chi-square test +/-SEM in (T)). Genotypes: (A, I, L, P) OregonR. (B) Kr1, KrCD/Kr1, KrCD. (F) ap-Gal4/+;UAS-nmEGFP/+. (G) ap-Gal4/UAS-Kr; UAS-Kr/+. (J, Q) svp1/svp1. (M) elav-Gal4/UAS-svp. (R) Kr1, KrCD/Kr1, KrCD; svp1/svp1.
Figure 5—figure supplement 1
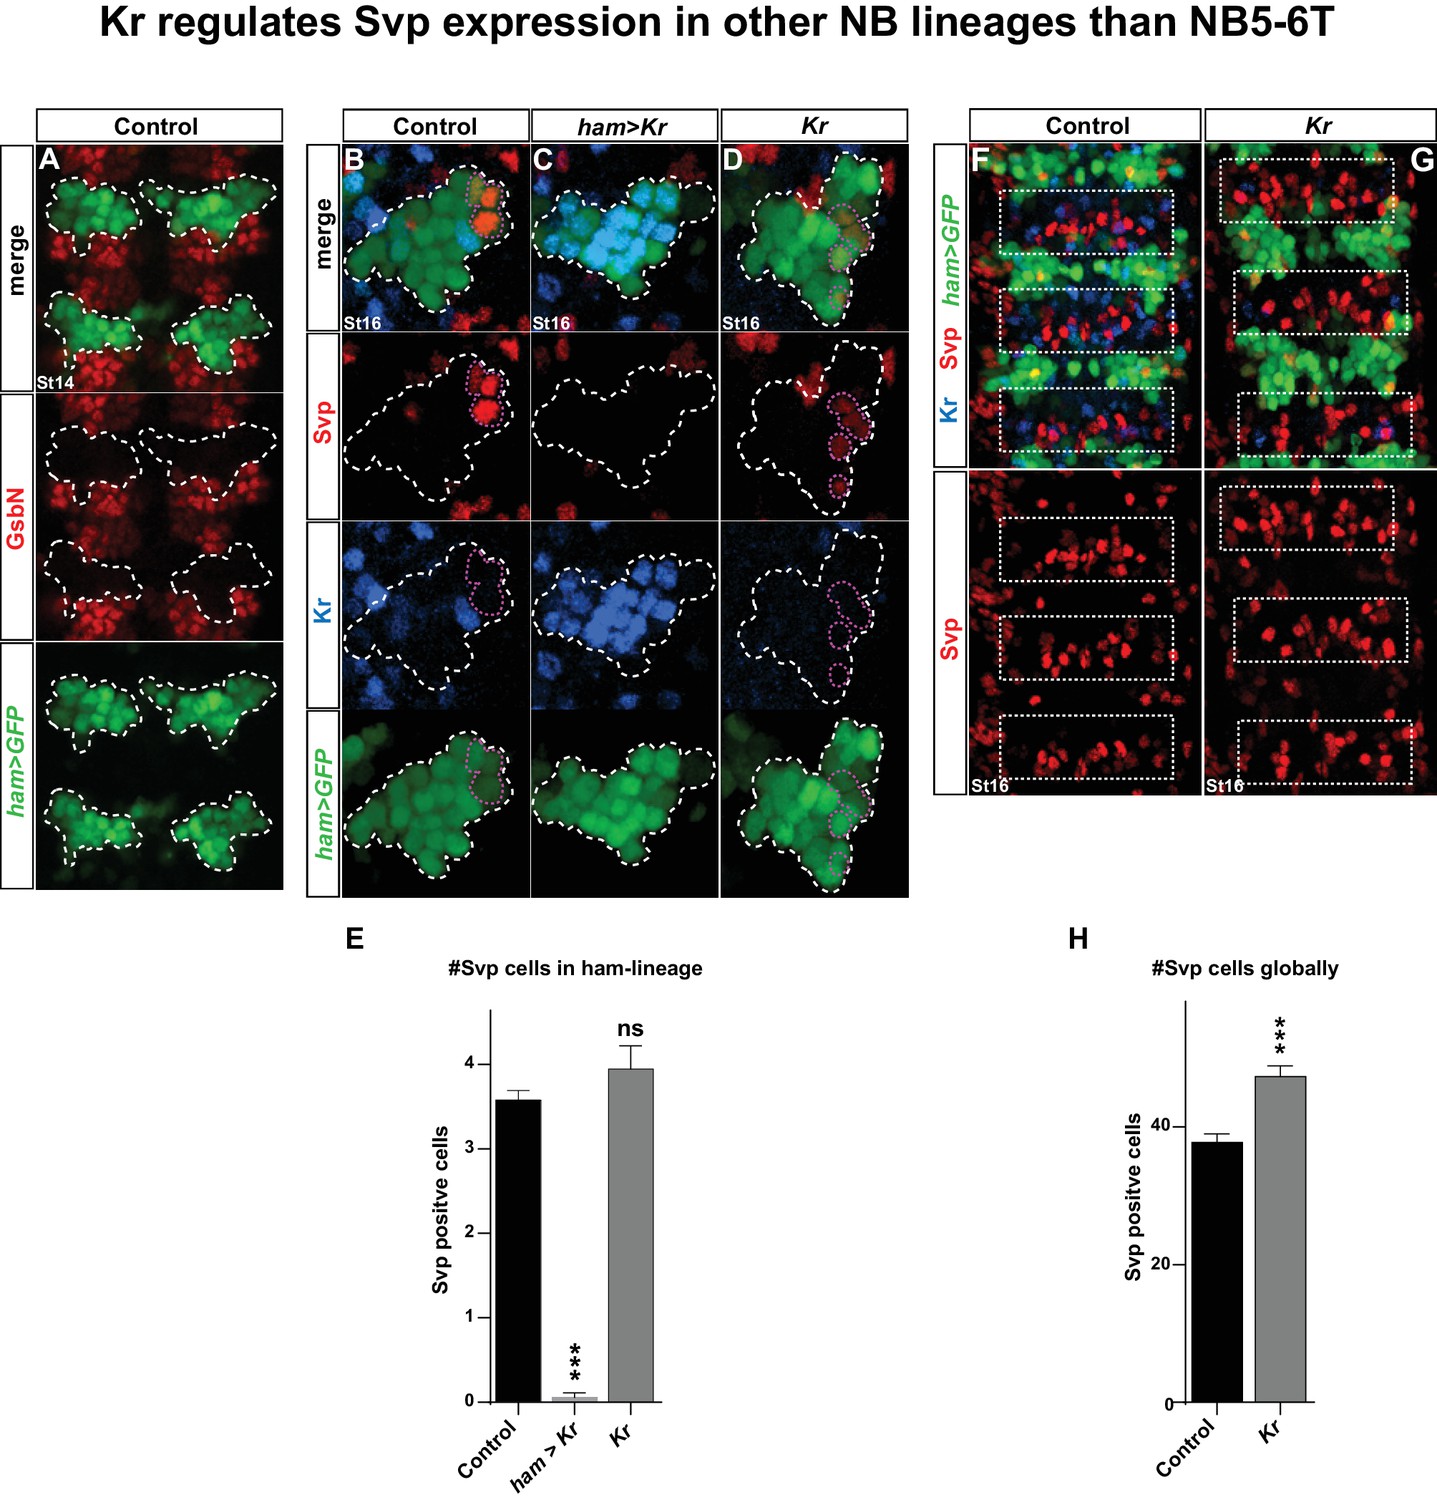
Kr regulates Svp expression in other NB lineages than NB5-6T.
(A) Staining for GFP and Gsb-n shows no overlap between the GFP signal from ham-Gal4 and Gsb-n, showing that ham-Gal4 is not expressed in NB5-6T. (B–D, F–G) Staining for GFP, Svp and Kr in (B, F) control, (C) Kr misexpression, and (D, G) Kr mutants. (C) Kr misexpression triggers loss of Svp expression in the lateral-most cells of the ham-Gal4 lineage. (D) In Kr mutants the number of Svp positive cells are slightly increased, however not significant. (E) Quantification of Svp positive cells in control, Kr misexpression and Kr mutants, at stage 16, shows a significant reduction of Svp positive cells when Kr is misexpressed from ham-gal4 (***p<0.0001, nCtrl = 40 lineages, nUAS-Kr = 18 lineages, students t-test, ± SEM). Quantification of Svp positive cells in the ham-Gal4 lineage in Kr mutants reveals no significant differences (p=0.14, nCtrl = 40 lineages, nKr = 18 lineages, students t-test, ± SEM). (F–G) Comparison of the number of Svp positive cells in the intermediate region between the ham-Gal4 lineages (white dashed boxes), reveals additional Svp positive cells in Kr mutants. (H) Quantification of the number of Svp cells in the ham-Gal4 intermediate regions reveals significant increase in Svp expressing cells (***p<0.0001, nCtrl = 11 segments, nKr = 12 segments, students t-test, +/- SEM). Genotypes: (A, B, F) ham-Gal4,UAS-nm-GFP. (C) ham-Gal4,UAS-GFP/UAS-Kr. (D,G) Kr1, KrCD/Kr1, KrCD;ham-Gal4,UAS-GFP.
Figure 6
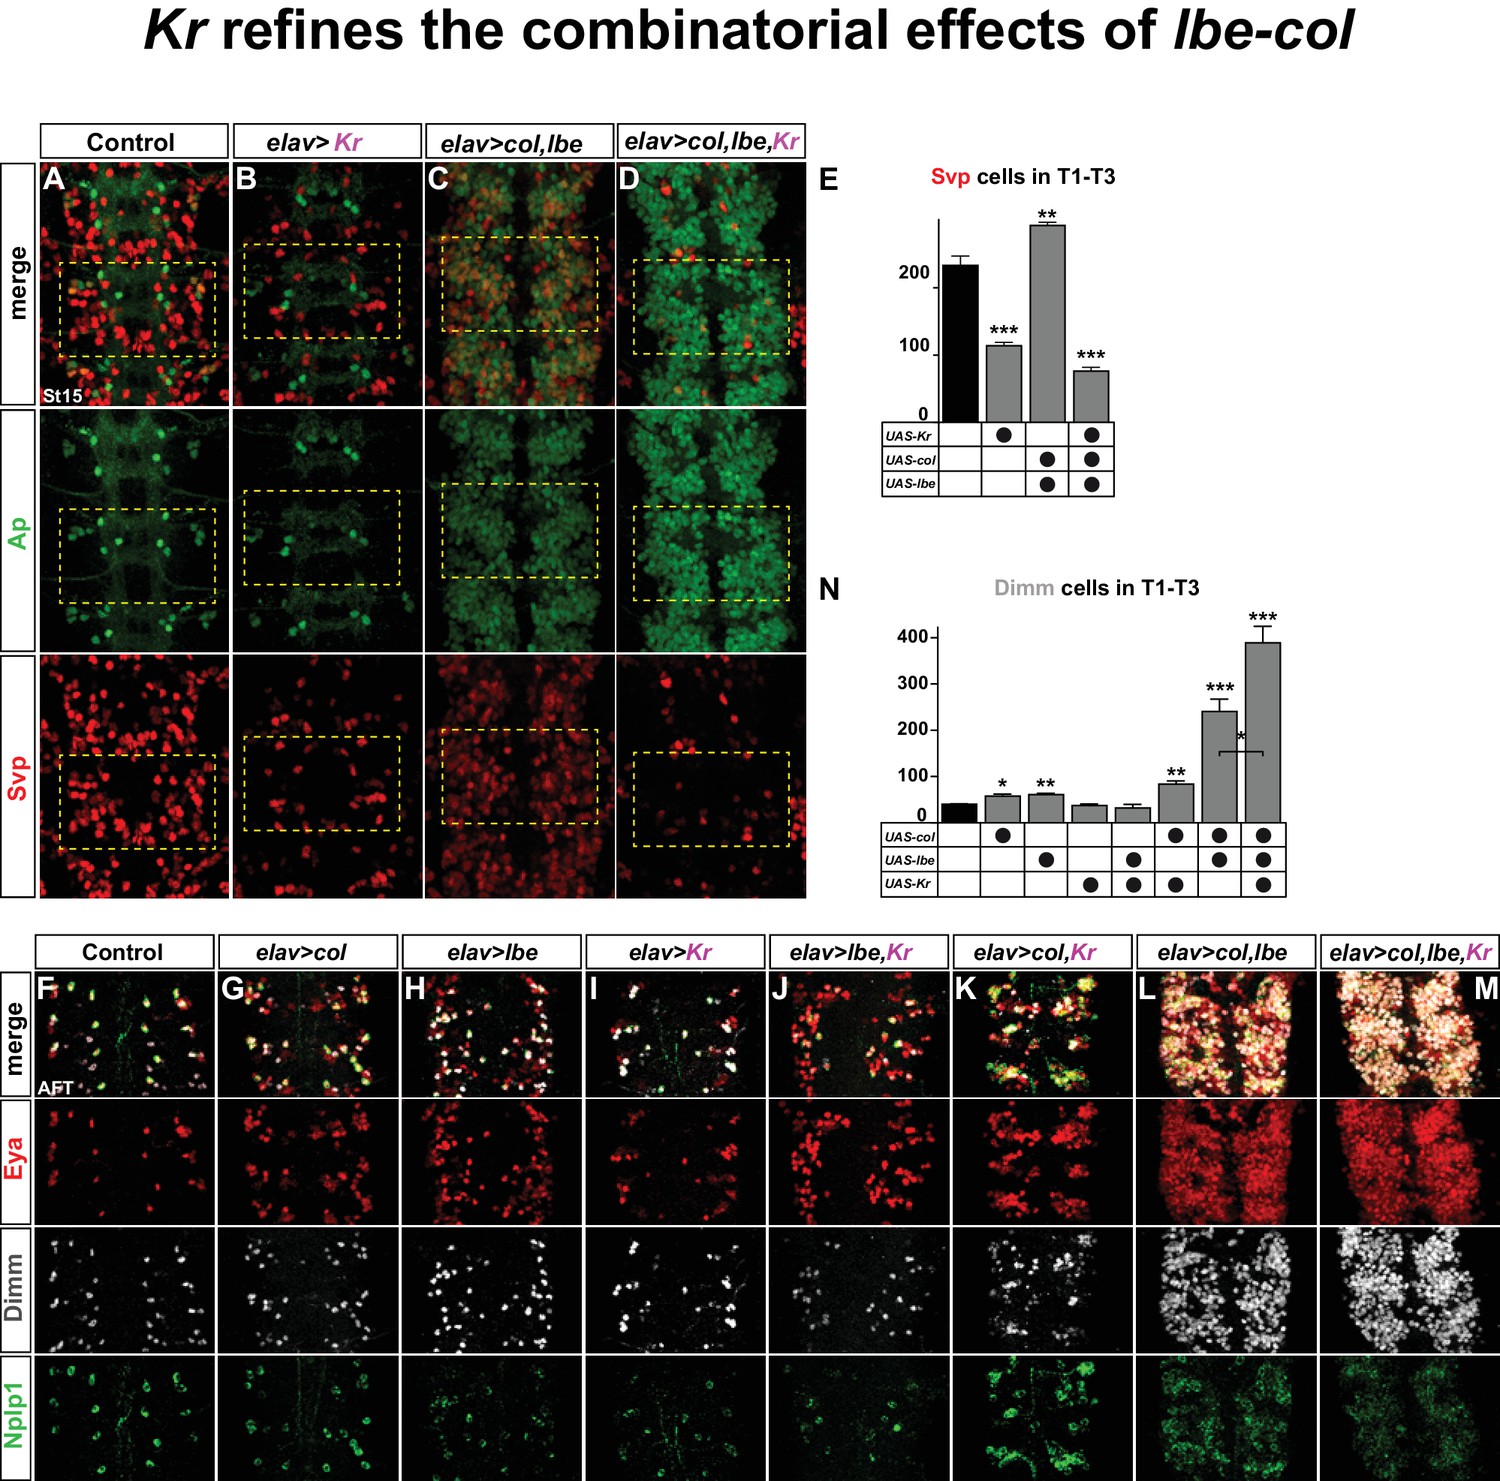
Kr refines the combinatorial effects of lbe-col.
(A–B) Single misexpression of Kr results in reduced numbers of Svp positive cells in thoracic segments T1-T3 compared to control. (C) Combinatorial misexpression of col with lbe results in ectopic Ap and Svp expressing cells. (D) Triple misexpression of col, lbe and Kr still results in ectopic Ap cells, but the number of Svp expressing cells is significantly reduced when compared to control. (E) Quantification of Svp expressing cells (**p<0.01; ***p<0.001; Student's t-test; n = 3 thoracic regions per group; ±SEM). (F–M) Single, double and triple co-misexpression of col, lbe and Kr at AFT from elav-Gal4. (F–H) Single misexpression of col or lbe results in ectopic Eya, Dimm and Nplp1 cells, when compared to control. (I–J) Single misexpression of Kr or double misexpression with lbe results in ectopic Eya and Nplp1 expression, but not of Dimm, when compared to control. (K) Co-misexpression of col and Kr results in ectopic Eya, Dimm and Nplp1 cells. (L) Co-misexpression of col and lbe results in extensive ectopic Eya, Dimm and Nplp1 expression. (M) Triple co-misexpression of col, lbe and Kr results in ectopic Eya, Dimm and Nplp1 cells, with Dimm cell numbers increased in comparison to double misexpression. (N) Quantification of Dimm expressing cells in thoracic segments T1-T3 (*p<0.05; **p<0.01; ***p<0.001; n = 3 thoracic regions; Student's t-test +/- SEM). Genotypes: (A, F) OregonR. (B, I) elav-Gal4; UAS-Kr/+; UAS-Kr/+. (C, L) elav-Gal4/UAS-col, UAS-lbe. (D, M) UAS-Kr; UAS-col, UAS-lbe/elav-Gal4. (G) elav-Gal4/UAS-col. (H) elav-Gal4/UAS-lbe, (J) UAS-lbe/+, UAS-Kr/elav-Gal4. (K) UAS-Kr/+, UAS-col/elav-Gal4.
Figure 7
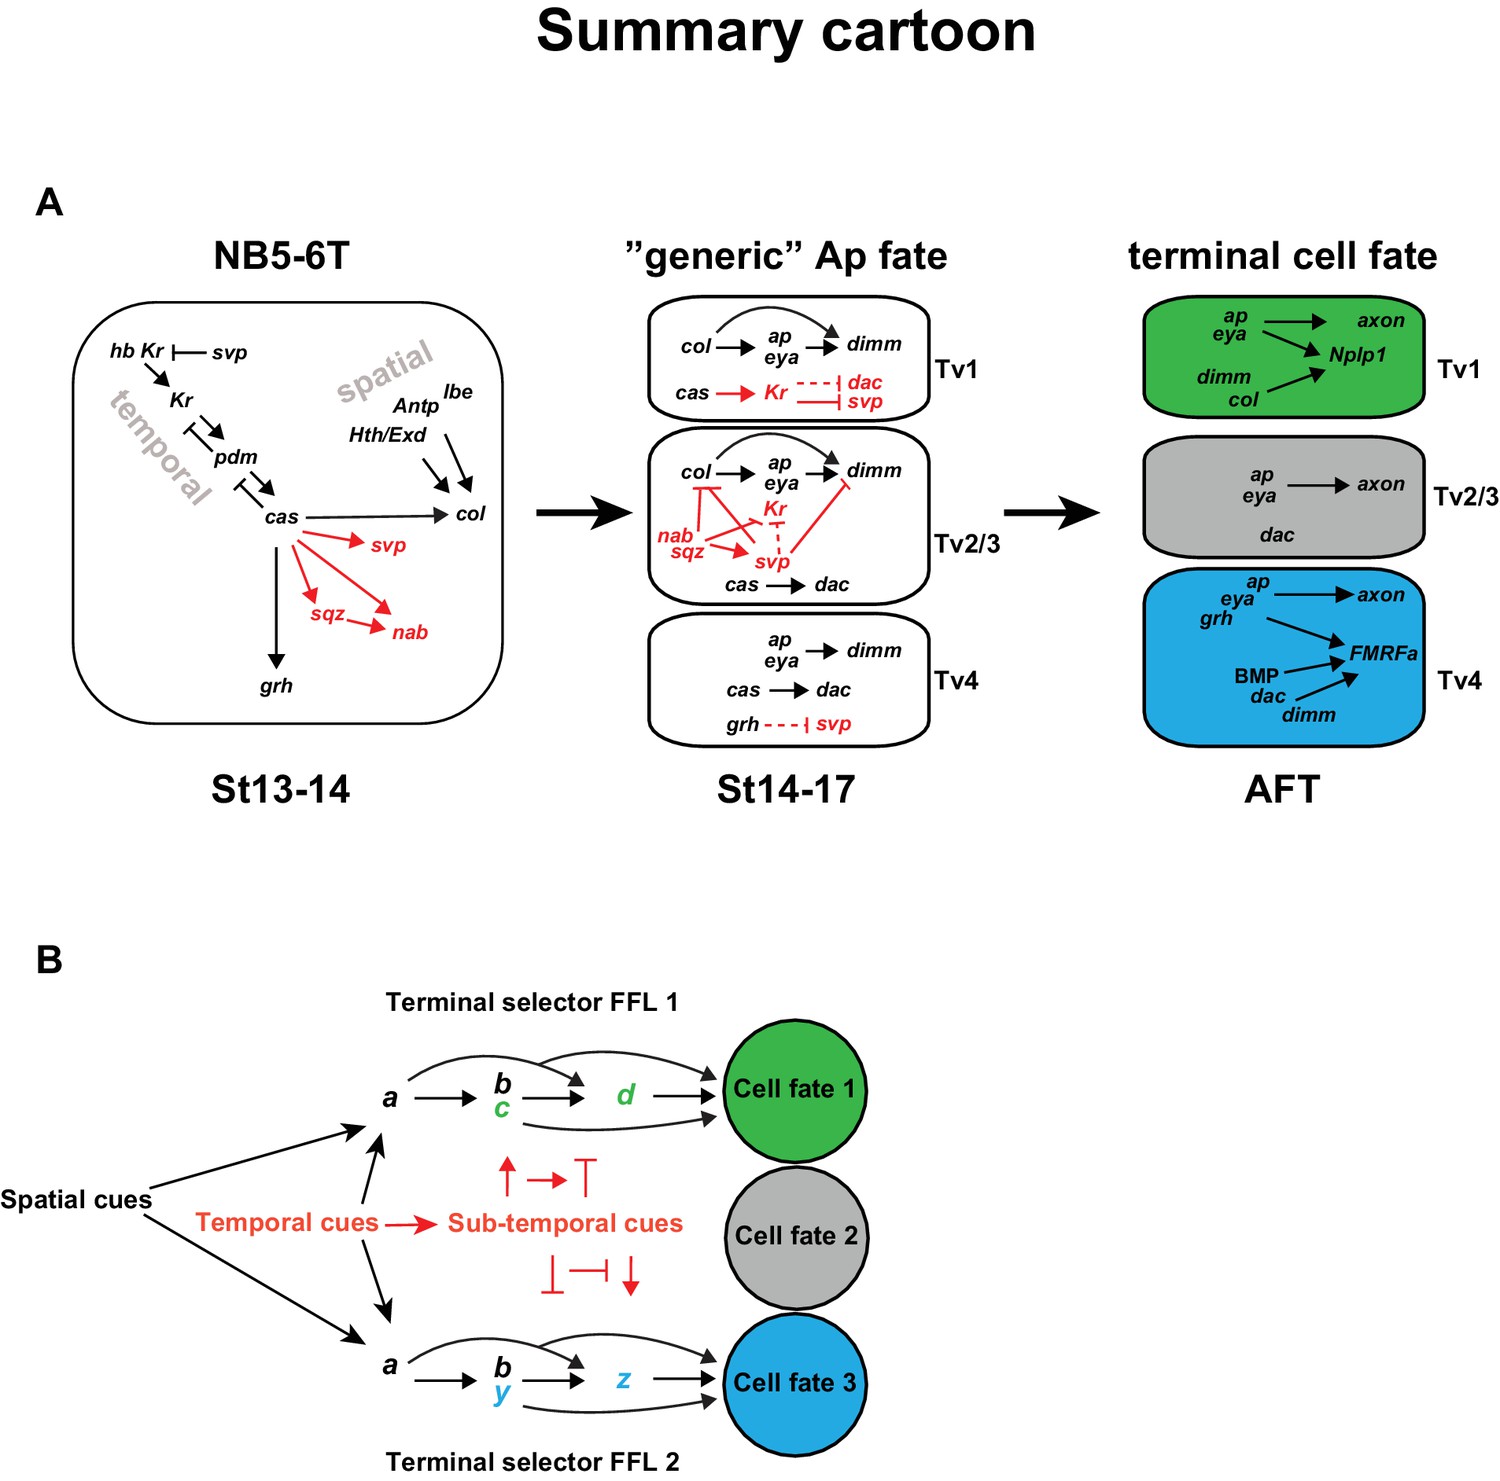
Model.
(A) Cartoon outlining the temporal progression of the NB5-6T and the specification of the Ap cluster cells (based on this and previous studies; see text for references). In the NB, cas triggers the sub-temporal genes sqz, nab, svp (red) and the temporal factor grh (black), and together with spatial input from Antp, lbe, Hth/Exd (black), the terminal selector col. In the generic Ap cluster cells, the suppressive role of Kr on svp allows for the col>ap/eya>dim>Nplp1 FFL to progress. The suppressive roles of the sub-temporal genes sqz, nab and svp on Kr, allows for continued svp expression, which prevents the progression of the Nplp1 FFL. dac and grh expression in Tv4 ensures the final cell fate of the Tv4/FMRFa neuron. (B) Model of how spatial (black) and temporal (red) cues can act to initiate different FLLs (black). In addition, temporal cues can initiate a sub-temporal program (red), which controls the FLL progression (FFL1 and FLL2) in different cell types, by either activating or repressive roles on the terminal selectors (green or blue) crucial for the specification of a distinct cell fate 1 (green) or cell fate 2 (blue).
Additional files
-
Supplementary file 1
DNA sequences.
DNA sequences for new UAS constructs.
- https://doi.org/10.7554/eLife.19311.012
-
Supplementary file 2
Quantification data.
Raw cell counts for the graphs in this study.
- https://doi.org/10.7554/eLife.19311.013
Download links
A two-part list of links to download the article, or parts of the article, in various formats.
Downloads (link to download the article as PDF)
Open citations (links to open the citations from this article in various online reference manager services)
Cite this article (links to download the citations from this article in formats compatible with various reference manager tools)
Neuronal cell fate diversification controlled by sub-temporal action of Kruppel
eLife 5:e19311.
https://doi.org/10.7554/eLife.19311


