Direct assessment of substrate binding to the Neurotransmitter:Sodium Symporter LeuT by solid state NMR
- University of Copenhagen, Denmark
- Leibniz-Institut für Molekulare Pharmakologie FMP, Germany
Figures
Figure 1 with 6 supplements
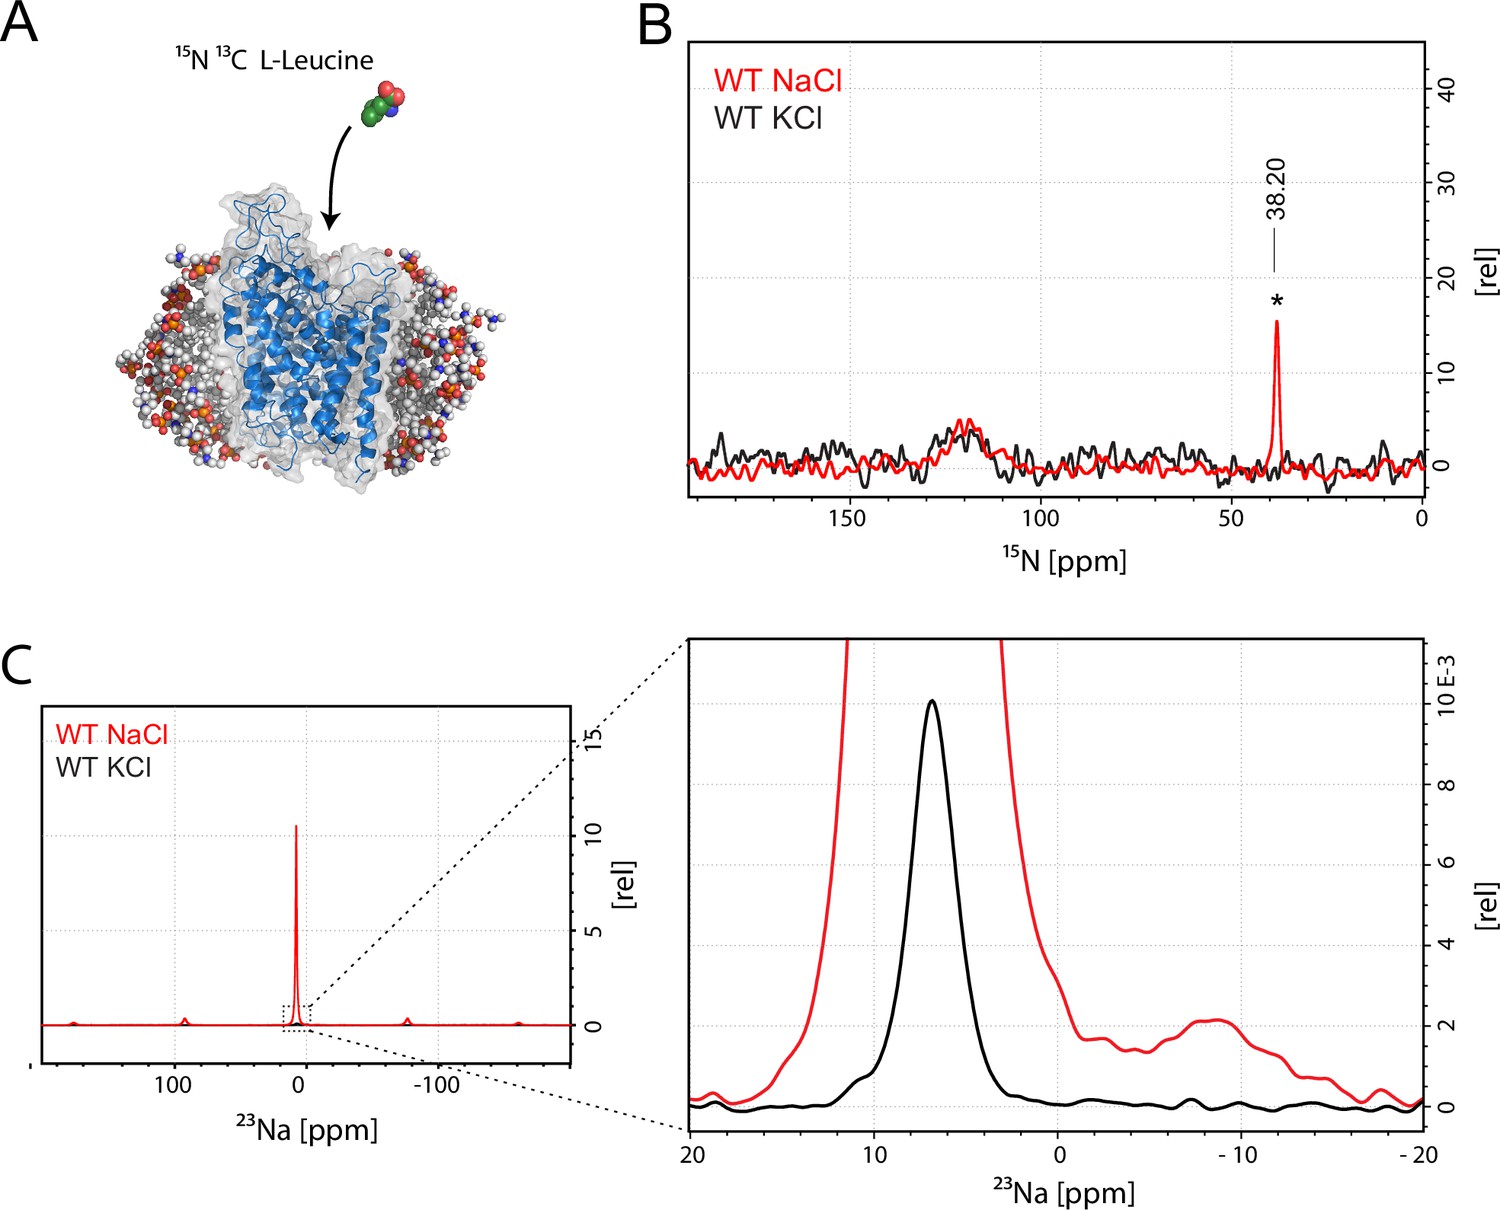
Assessment of L-leucine binding to LeuT WT by solid state NMR.
(A) Cartoon illustration of experimental approach. 15N enriched L-leucine substrate is added to detergent reconstituted LeuT, which is subsequently crystallized using large scale sitting drop vapour diffusion. Rod-shaped microcrystals form within 24 hr and can be readily harvested. (PDB ID: 3F3E) (B) LeuT WT purified in NaCl (red) and LeuT purified in KCl (black). 15N L-Leucine specific peak is indicated by an asterix with a chemical shift of 38.2 ppm. Spectra are tentatively intensity normalized to the 15N natural abundance signal from the LeuT backbone amides. Signal-to-noise is calculated to be 21. (C) 23Na-NMR of LeuT WT (red) and LeuT WT in KCl (black) in presence of leucine. Minor peak at −8.9 ppm represents the shape of one or two structural sodium molecules. Despite inequivalent location of the two sodium sites in the LeuT, the coordination mechanism is almost identical which might account for the observation of a single peak in the 23Na-NMR spectrum instead of two distinct peaks.
Figure 1—figure supplement 1
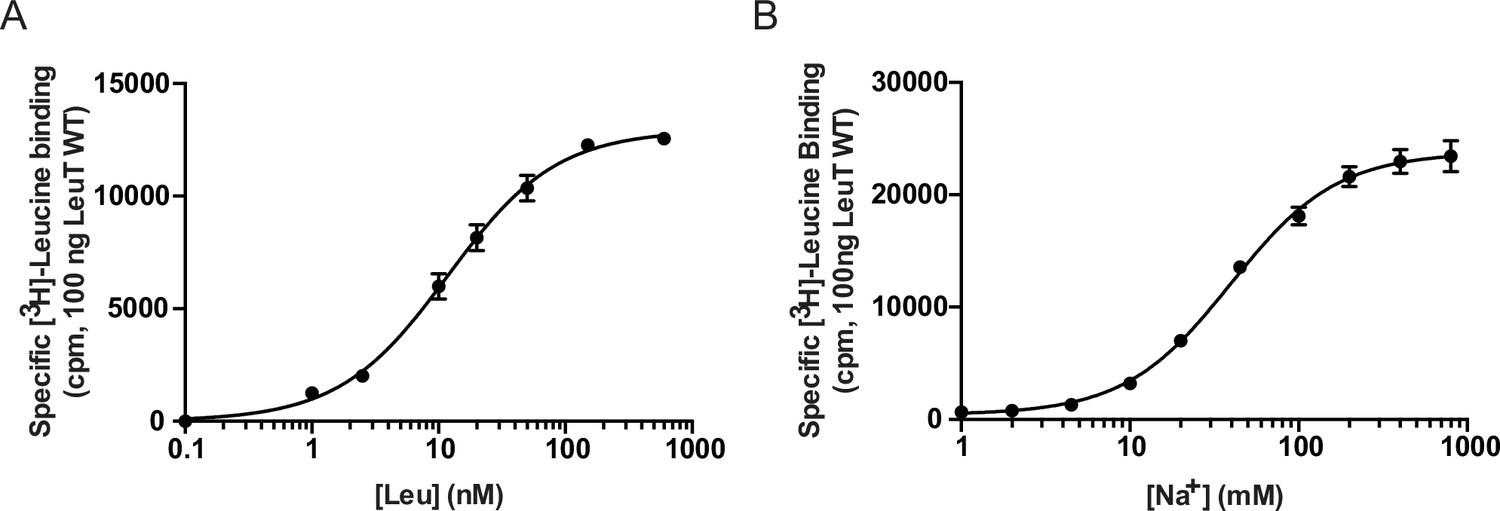
Functional characterization of LeuT WT.
LeuT WT was purified in KCl and eluted in 0.05% DDM (pH 8.0). Scintillation proximity assay-based measurements of (A) [3H]leucine saturation binding to 100 ng LeuT in the presence of 200 mM NaCl and (B) Na+-dependent [3H]leucine binding (100 nM) by 100 ng LeuT. Ionic strength was compensated with KCl. Data are displayed as means ± s.e.m., performed in triplicates, n = 3.
Figure 1—figure supplement 2
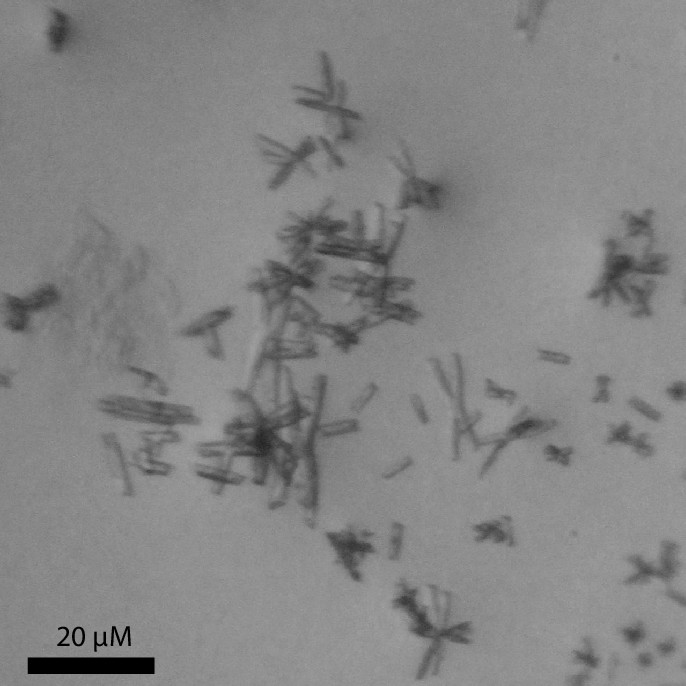
Microscopy image of LeuT microcrystals.
LeuT microcrystals are needle-shaped and have a length of 1–10 μm. The microscopic image was solely used to assess the quality of the microcrystalline material.
Figure 1—figure supplement 3
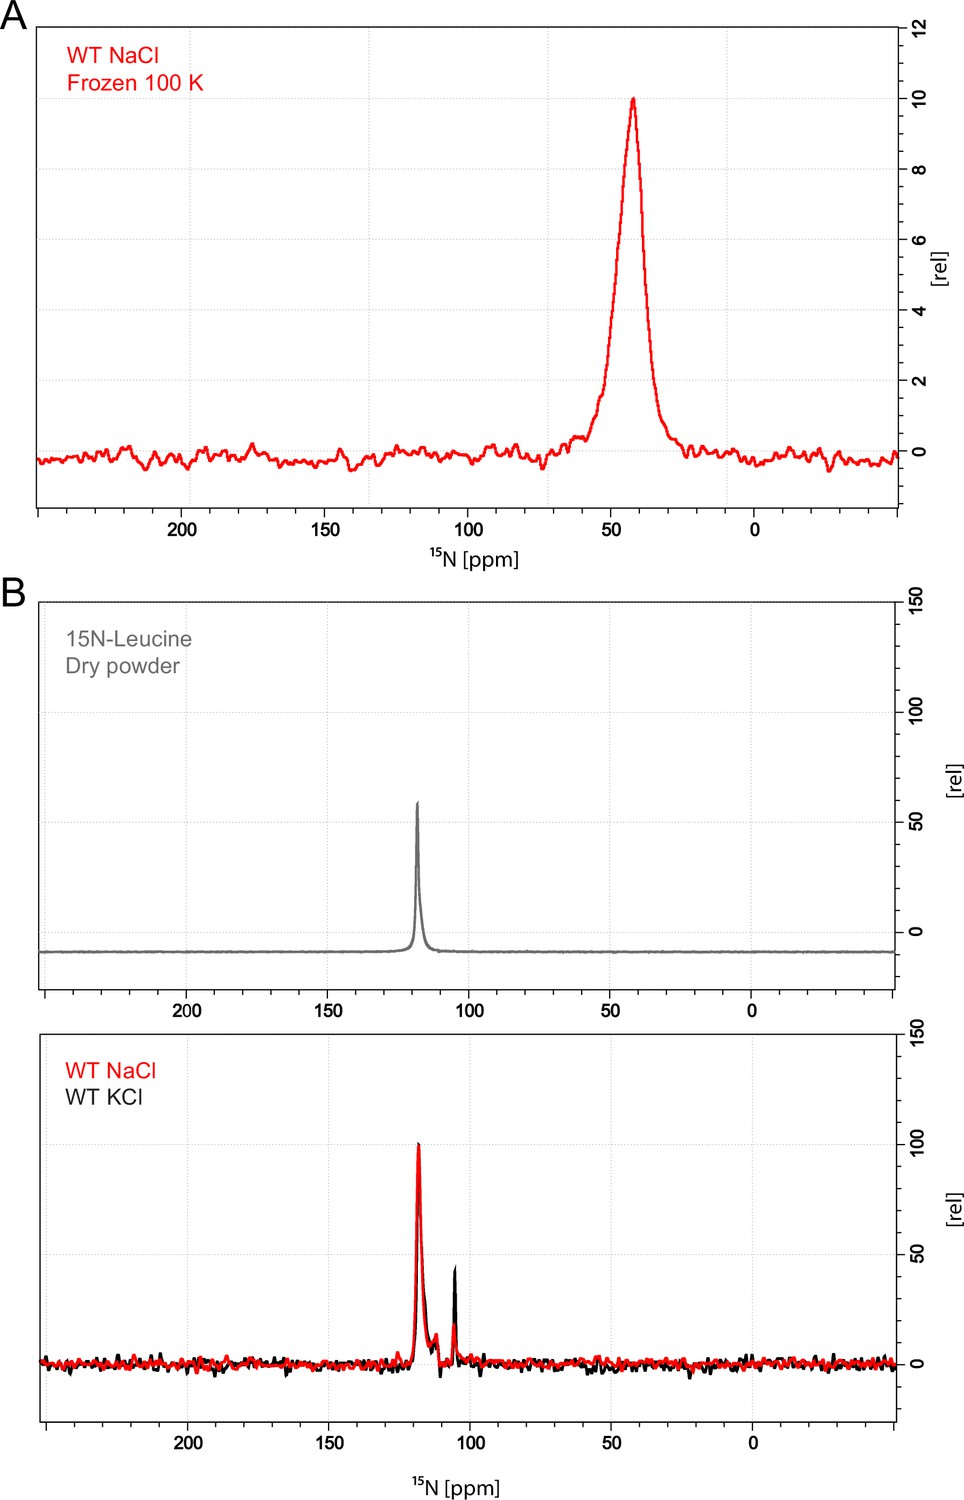
1D 15N CP/MAS spectrum of frozen and lyophilized LeuT WT samples.
(A) Protein concentration: 2 mg/ml, leucine concentration: 1 mM. The spectrum is dominated by the signal arising from the free unbound leucine, at ~42 ppm. Spectrum was recorded on a 400 MHz Bruker shielded wide bore magnet equipped with a 3.2 mm MAS HCN operating at ~100 K. Spinning rate: 8000 kHz. CP contact time: 1000 us, recycling delay: 3 s. 24 k scans were required to record presented spectrum. (B) 15N CP/MAS spectra from dry L-leucine powder (top panel) and from lyophilized leuT samples (bottom panel). Free 15N L-Leucine has a distinct chemical shift at 118 ppm. For the LeuT WT NaCl preparation (red) several additional peaks appear around the dominating free state peak. Though these peaks vary slightly in intensity when compared to LeuT WT KCl (dark). These peaks do not originate from structural leucine. Spectra were recorded on a 700 MHz Bruker shielded wide bore magnet equipped with a 4 mm MAS HCN probe operating at 298 K. Spinning rate: 12500 KHz, CP contact time: 1500 us, recycling delay: 2.5 s. 65 K scans were required to record presented spectra.
Figure 1—figure supplement 4
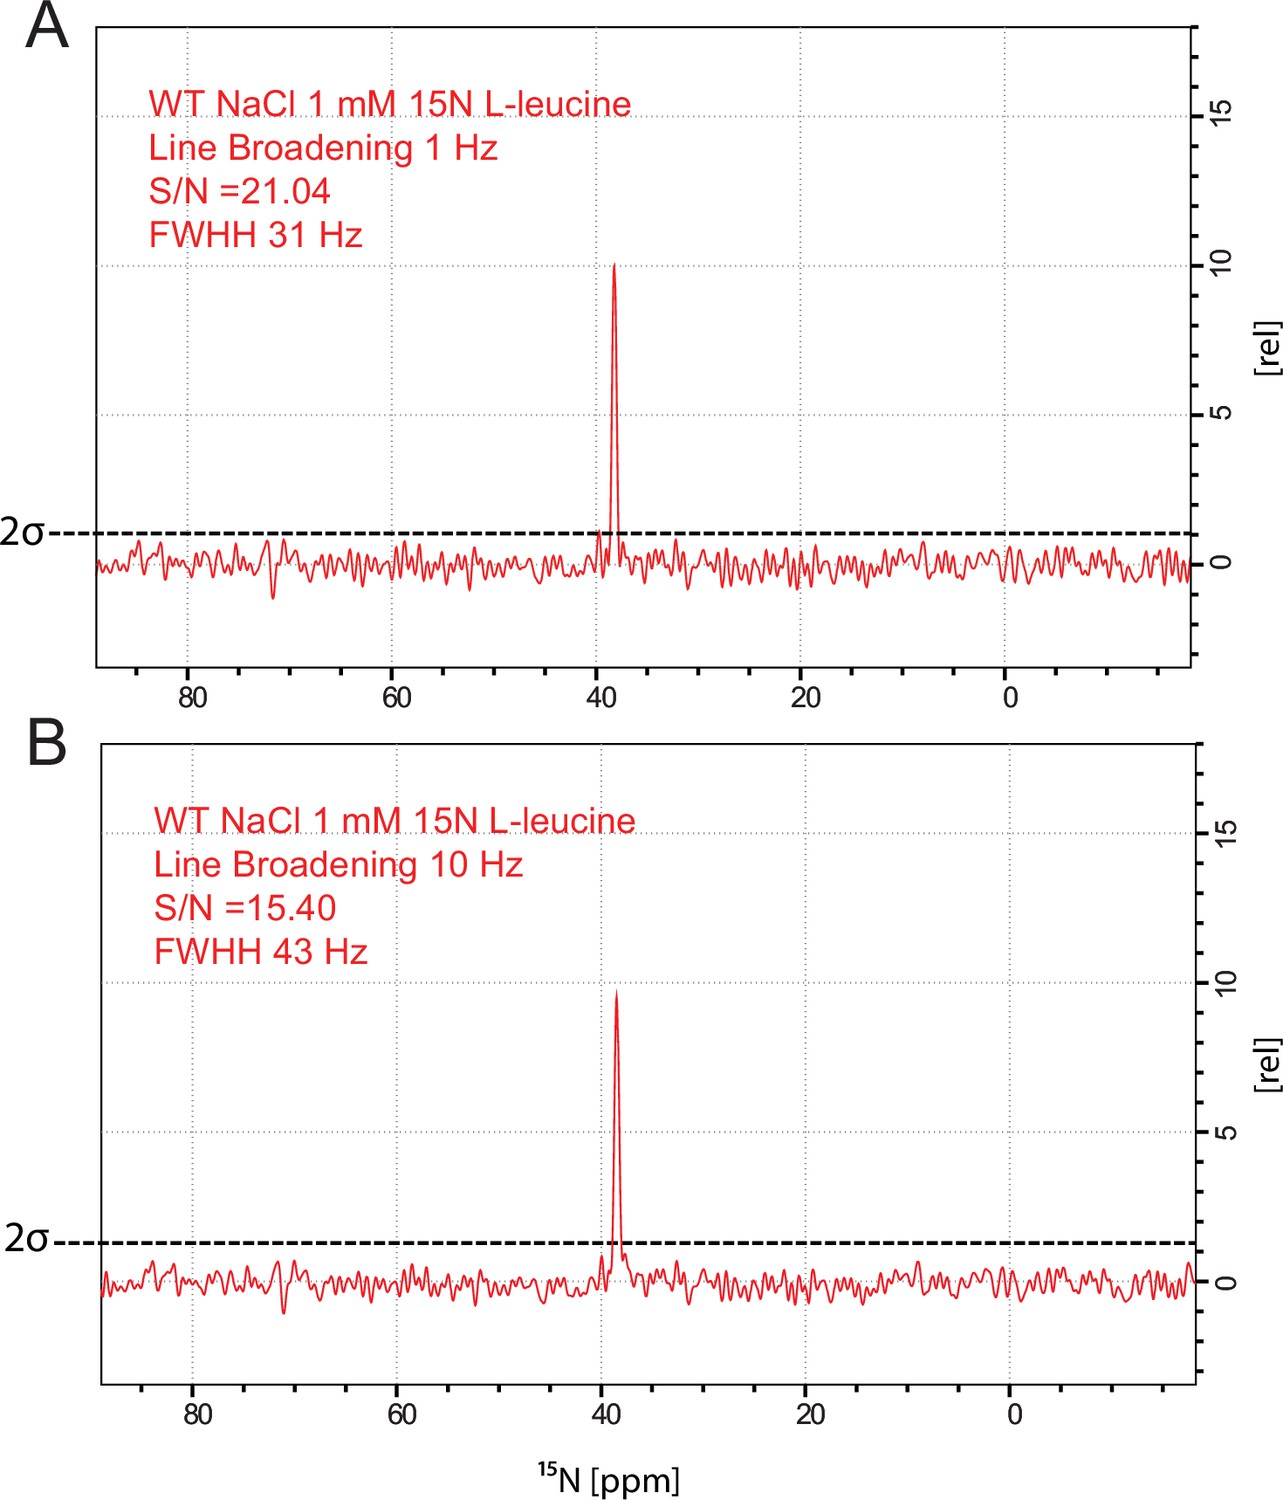
15N L-leucine spectrum substrate peak for LeuT WT.
(A) Line broadening for window function 1 Hz, Signal-to-noise in calculated to be 21, Full width half height (FWHH) of the substrate peak is 31 Hz. (B) Line broadening for window function 10 Hz.
Figure 1—figure supplement 5

In-solution 1D 15N spectra of free 98% 15N L-leucine at different pH.
(A) pH titration of the L-leucine amine. The 1D 15N spectra are recorded for 1024 scans at 25°C. (B) 15N chemical shift of the L-leucine amine as a function of pH. From the sigmoidal curve fit the pI is estimated to be 9.72 ± 0.06.
Figure 1—figure supplement 6
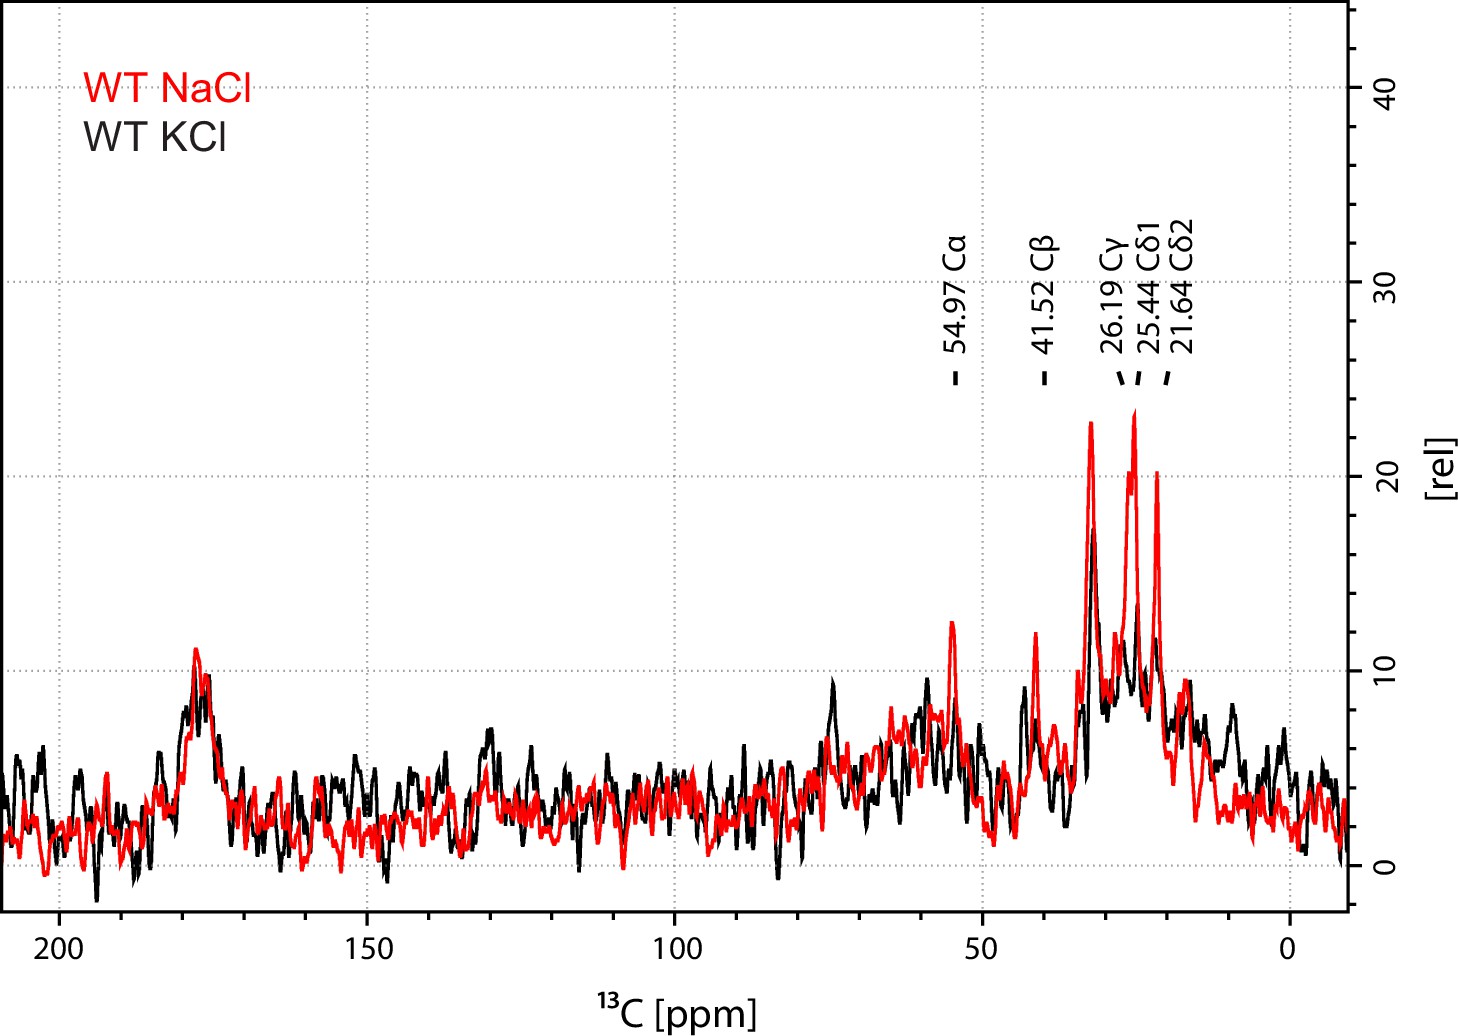
1D 13C CP/MAS spectrum of microcrystalline LeuT WT samples.
Spectra for samples prepared in NaCl or KCl are colored in red and black, respectively. Resonances originating from labelled leucine are indicated by their chemical shifts and their respective assignments. These results are in good agreement with the 15N 1D spectra, and only one set of chemical shifts from the ligand can be observed.
Figure 2 with 4 supplements
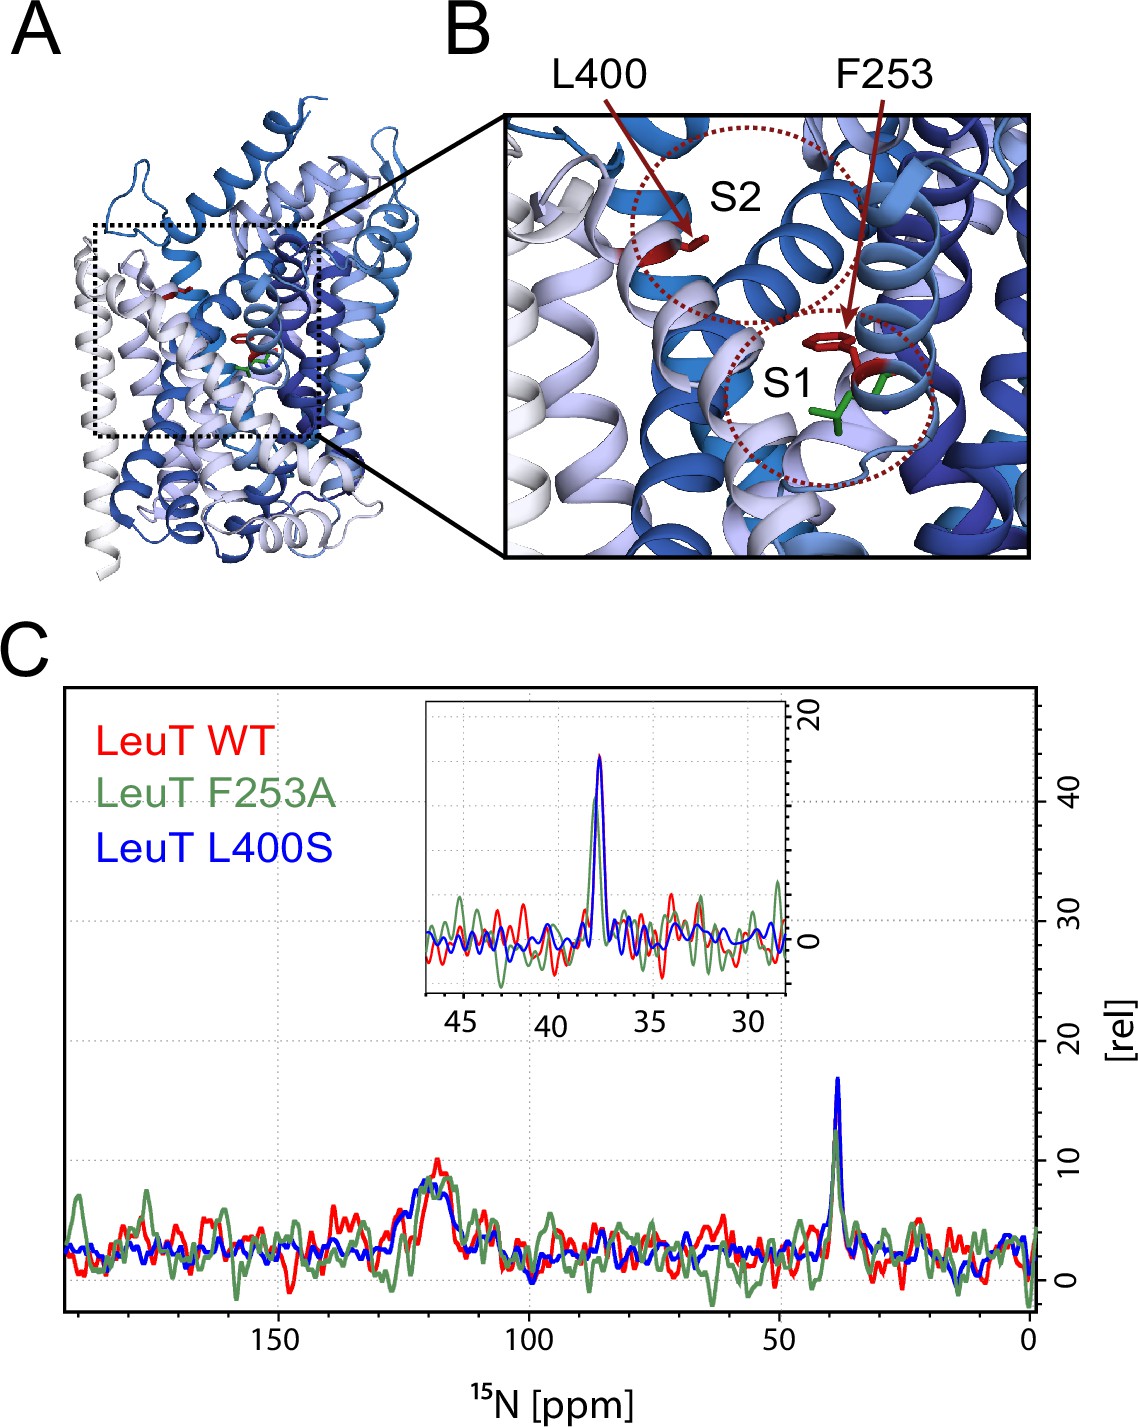
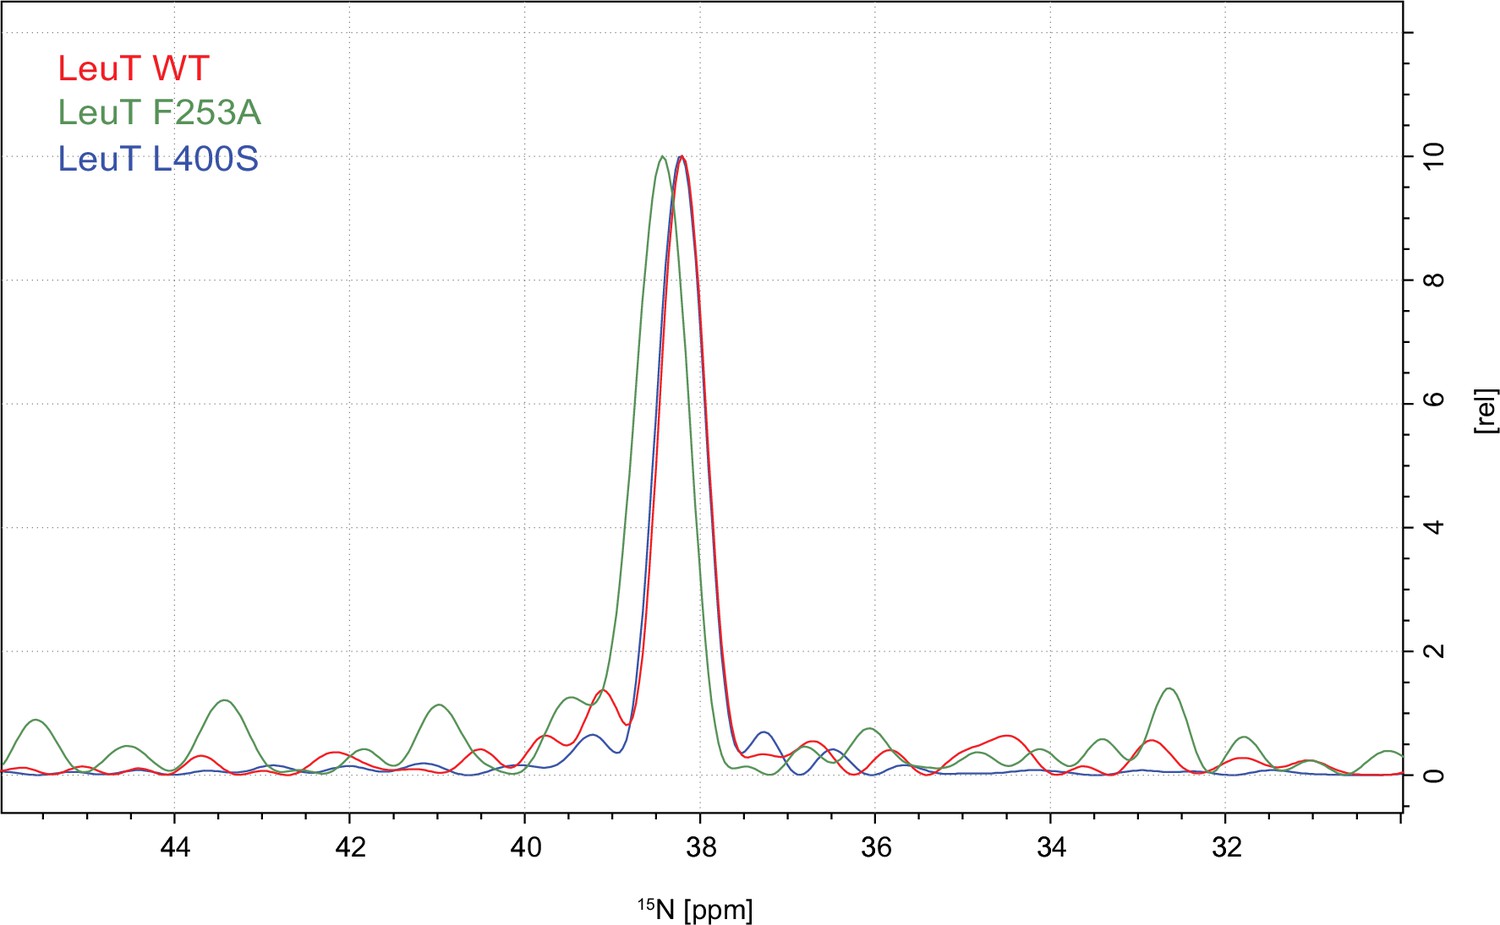
Effects of S1 and S2 site mutations on the L-leucine chemical shift .
(A–B) Cartoon representation displaying the location of F253 in the S1 site and L400 in the proposed S2 site based on PDB: 3USG (Wang et al., 2012a). (C) 15N 1D NMR spectrum of LeuT WT (red), F253A (green) and L400S (blue). Inset: Close-up of L-leucine specific peak. Spectra are tentatively intensity normalized to the 15N natural abundance signal from the LeuT amides.
Figure 2—figure supplement 1
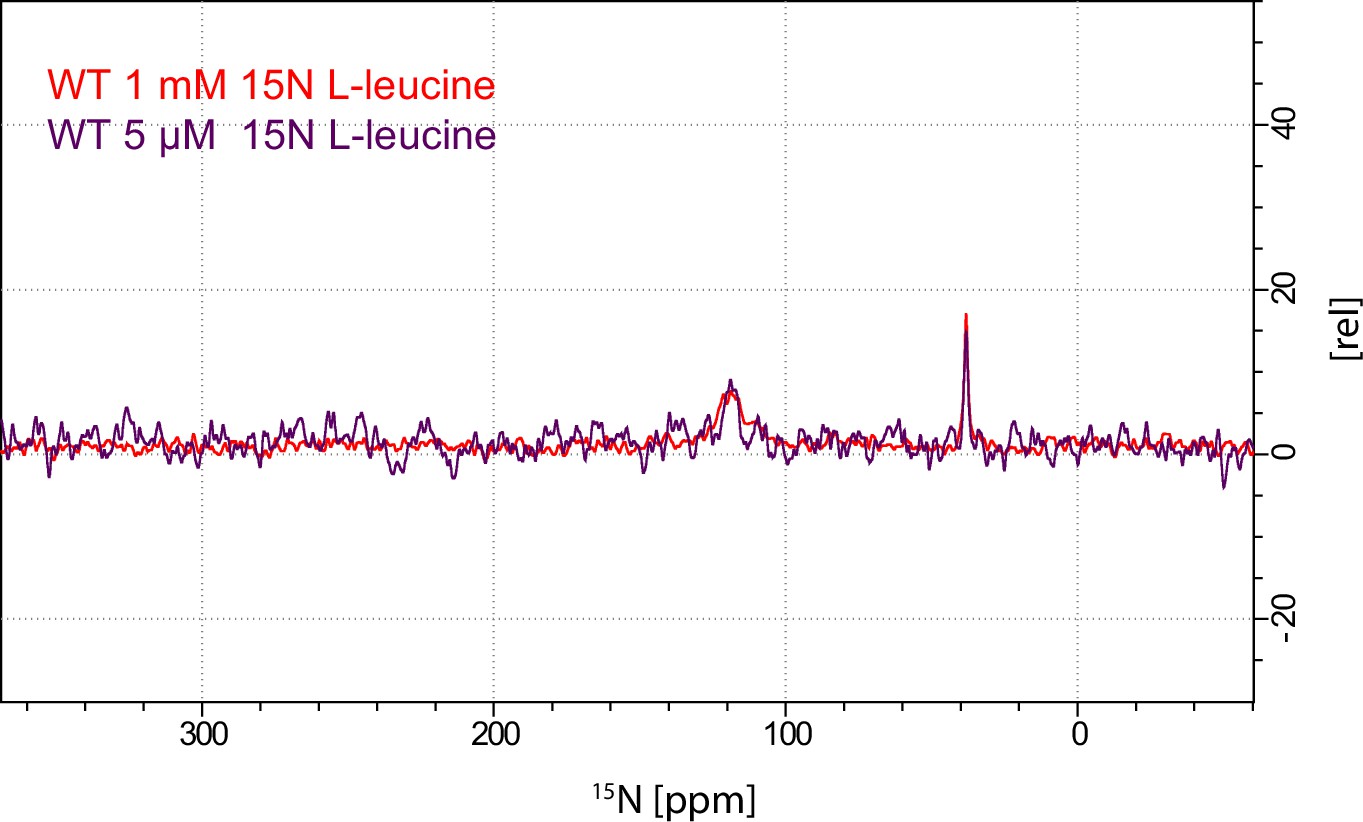
Comparison of spectra derived from LeuT WT purified and crystallized in either 1 mM (red) or 5 uM (purple) free leucine.
Spectra are tentatively normalized to the LeuT natural abundance amide signal. As expected the substrate peak relates to LeuT concentration and not to the added free leucine concentration.
Figure 2—figure supplement 2
Power spectra of LeuT WT (red), F253A (green) and L400S (blue).
To rule out that wrong phasing would cause the chemical shift difference observed for the substrate peak of the spectra presented in Figure 2C, we present the them also as power spectra (which is ultimately a squared magnitude spectra) where phase signs are not preserved. We have intensified the F253A signal to only demonstrate the chemical shift difference.
Figure 2—figure supplement 3
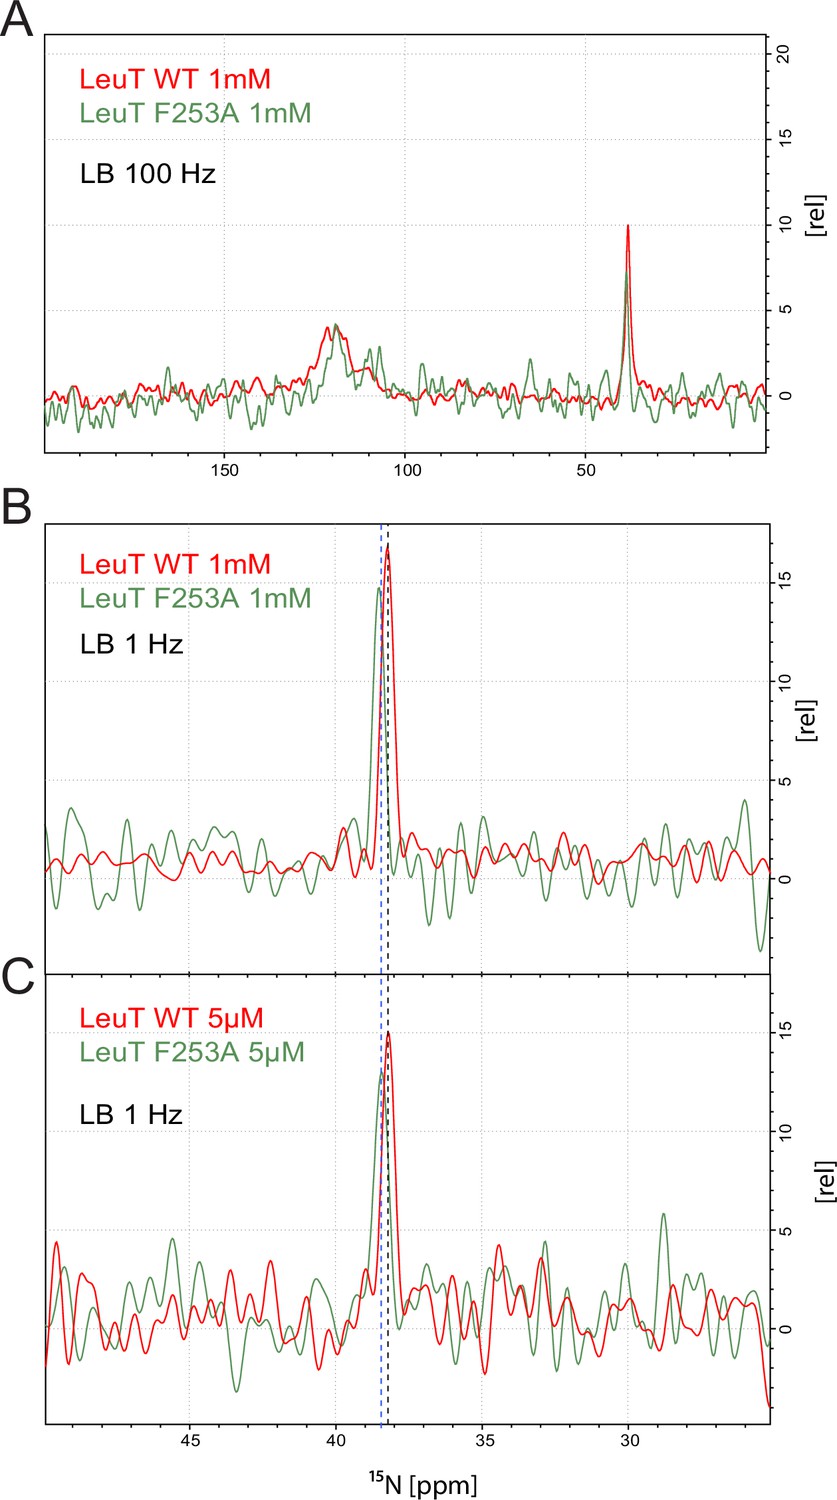
Comparison of LeuT WT and LeuT F253A in the presence of 1 mM free substrate.
(A) Full spectrum displayed with a line broadening of the windows function of 100 Hz. Tentatively intensity normalized using natural abundance signals. (B and C) Close up of the substrate peak region showing preserved chemical shift difference between the substrate bound in LeuT WT (black dashed line) and LeuT F253A (blue dashed line) in two different free substrate concentrations.
Figure 2—figure supplement 4
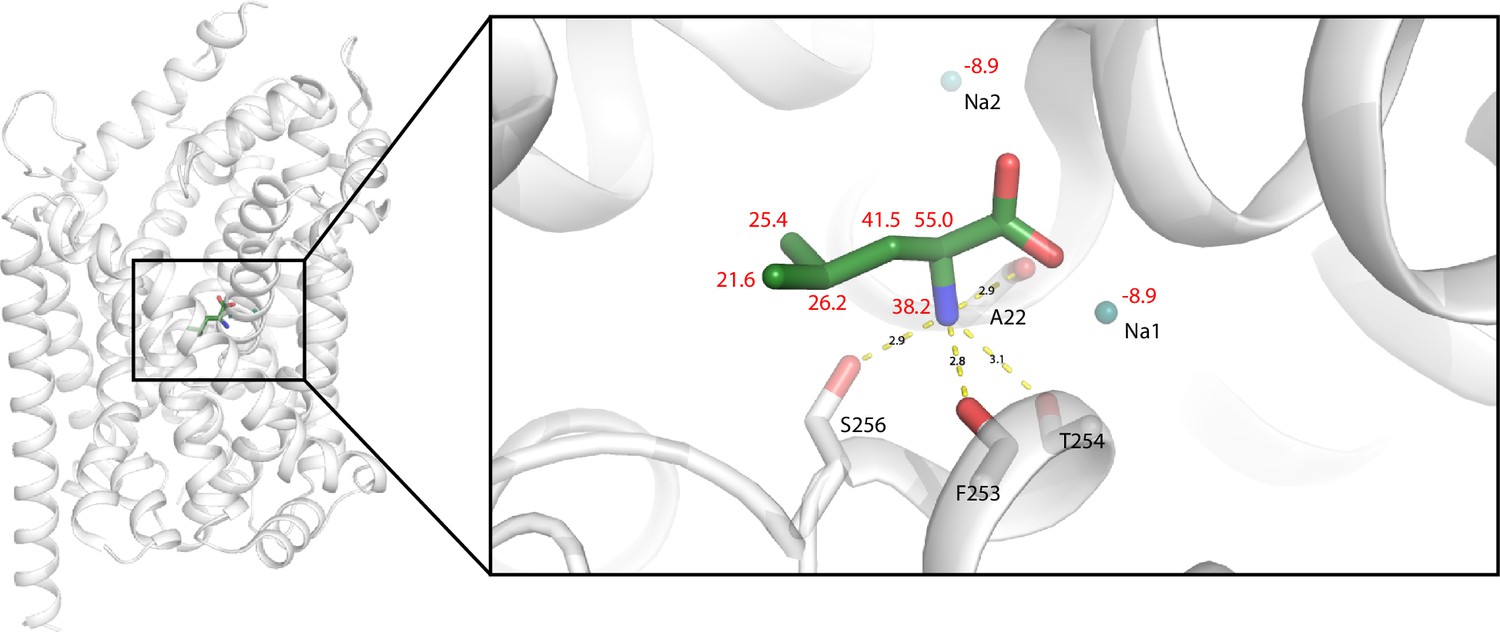
Cartoon representation of S1 bound substrate (green).
Sodium ions are depicted in blue. Measured chemical shift values in red (in ppm) and measured distances in black (in Å). Image is made from PDB file: 3F3E.
Download links
A two-part list of links to download the article, or parts of the article, in various formats.
Downloads (link to download the article as PDF)
Open citations (links to open the citations from this article in various online reference manager services)
Cite this article (links to download the citations from this article in formats compatible with various reference manager tools)
Direct assessment of substrate binding to the Neurotransmitter:Sodium Symporter LeuT by solid state NMR
eLife 6:e19314.
https://doi.org/10.7554/eLife.19314


