Recruitment of inhibition and excitation across mouse visual cortex depends on the hierarchy of interconnecting areas
- Washington University School of Medicine, United States
- Allen Institute for Brain Science, United States
Figures
Figure 1 with 3 supplements
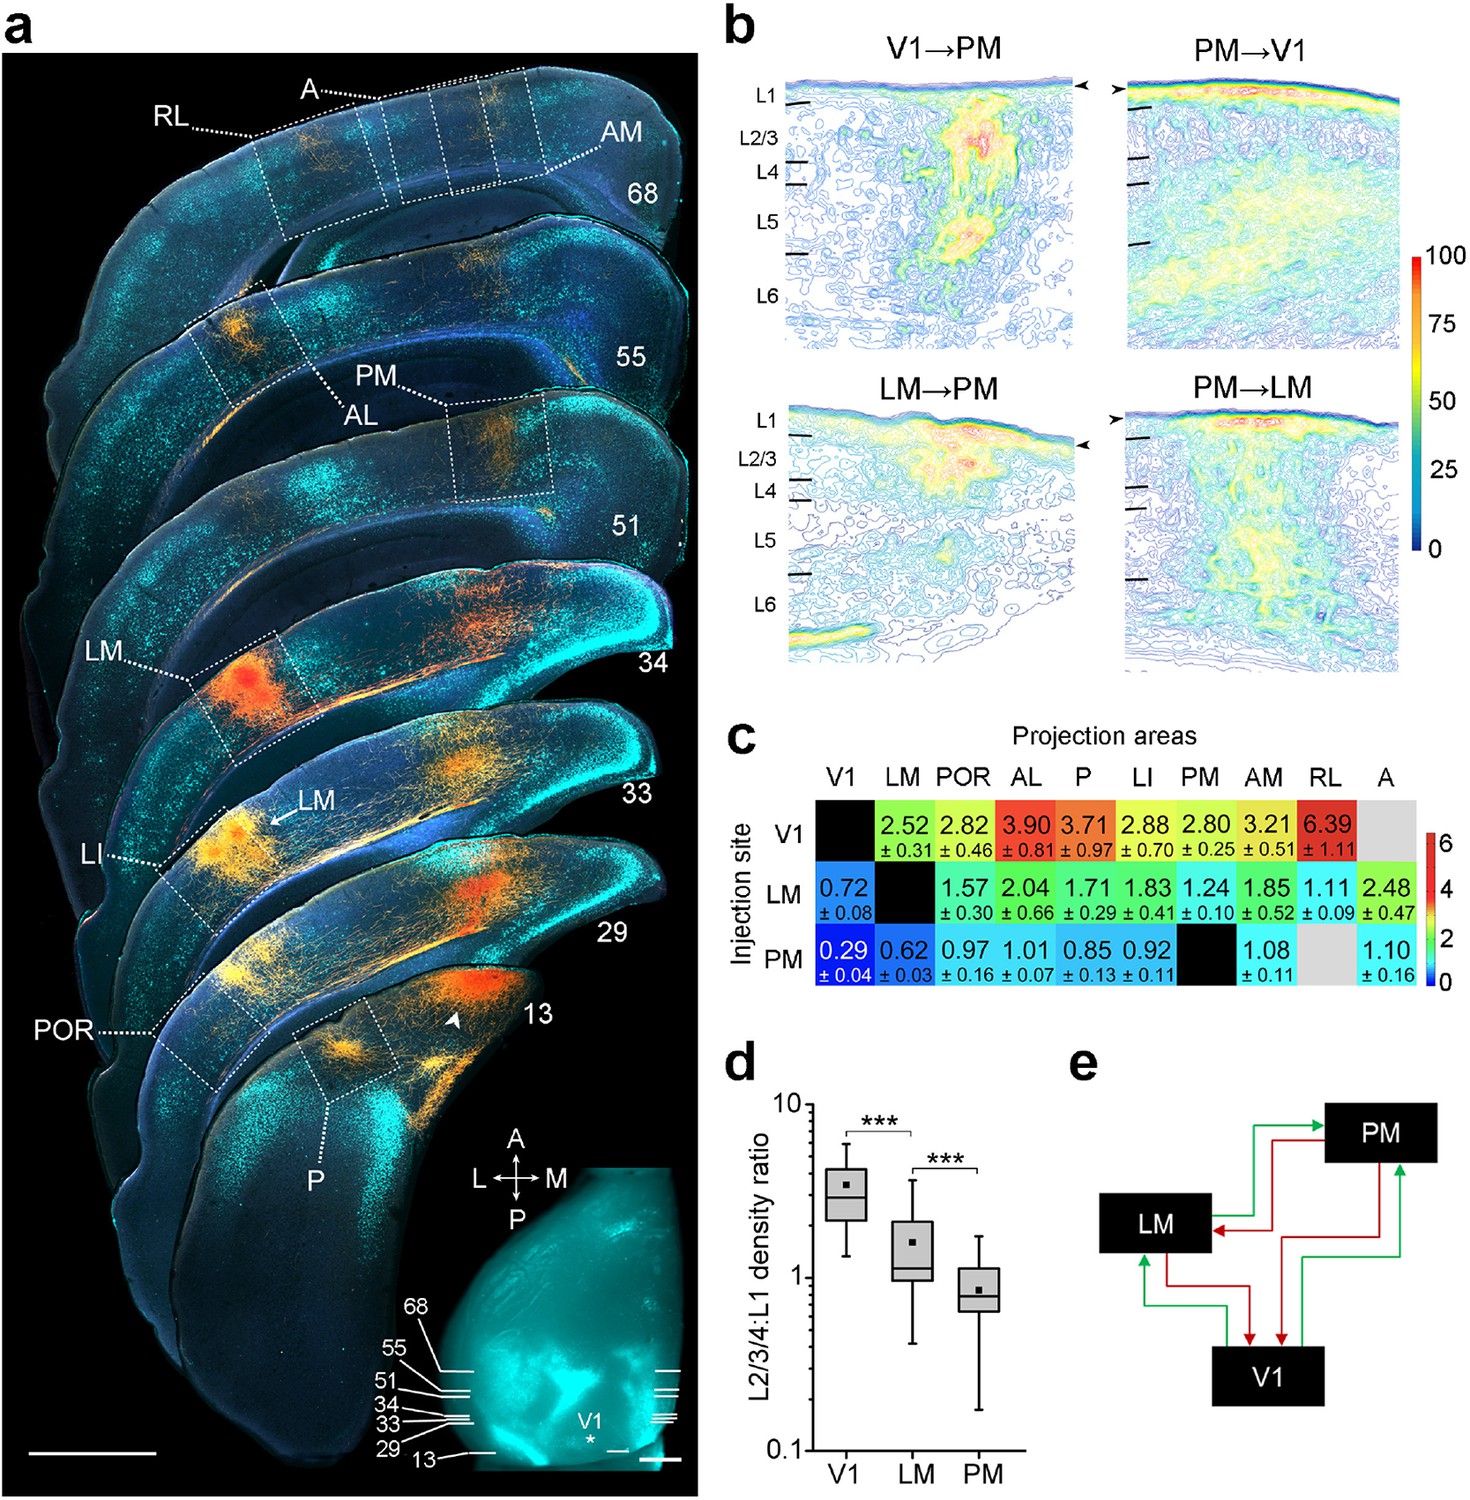
Hierarchy between V1, LM, and PM.
(a) Rostrocaudal series of coronal slices through the left hemisphere showing anterogradely labelled axonal projections (yellow/orange) after V1 was injected with BDA. Retrogradely labelled callosally projecting neurons (light cyan), upon injection of bisbenzimide in the right hemisphere, act as landmarks for identification of areas (Wang and Burkhalter, 2007). Numbers denote sections corresponding to the positions shown in inset. See Figure 1—figure supplement 1 for higher magnification of areas within dotted squares. Projection to LM adjacent to LI in section 33 is indicated. Arrowhead indicates a region in V1 near the injected site. In situ image of retrograde bisbenzimide-labelled callosally projecting neurons in the left hemisphere. Injection site in V1 (asterisk) and positions of coronal slices shown above are indicated. Scale bars, 1 mm. (b) Optical density of axonal projections in the target areas of the indicated pathways, normalized to peak density. Contours connect regions with similar optical densities. Arrowheads denote the edge of the slice and edge artifacts due to interpolation of optical density with dark background. (c) Color-coded heat map of L2-4:L1 density ratio (DR) for each of 25 distinct cortico-cortical connections. Blocks in grey indicate projections that were too weak to analyze. V1 exhibits the highest DRs, and PM the lowest, indicating the relative hierarchical positions of the areas. (d) The mean DR for all target areas is highest for V1, intermediate for LM, and lowest for PM; ***p<0.001, Mann-Whitney U-test. (e) Our schematic interpretation of the hierarchy of V1, LM, and PM in visual processing. Feedforward pathways are denoted in green, feedback in red.
Figure 1—figure supplement 1
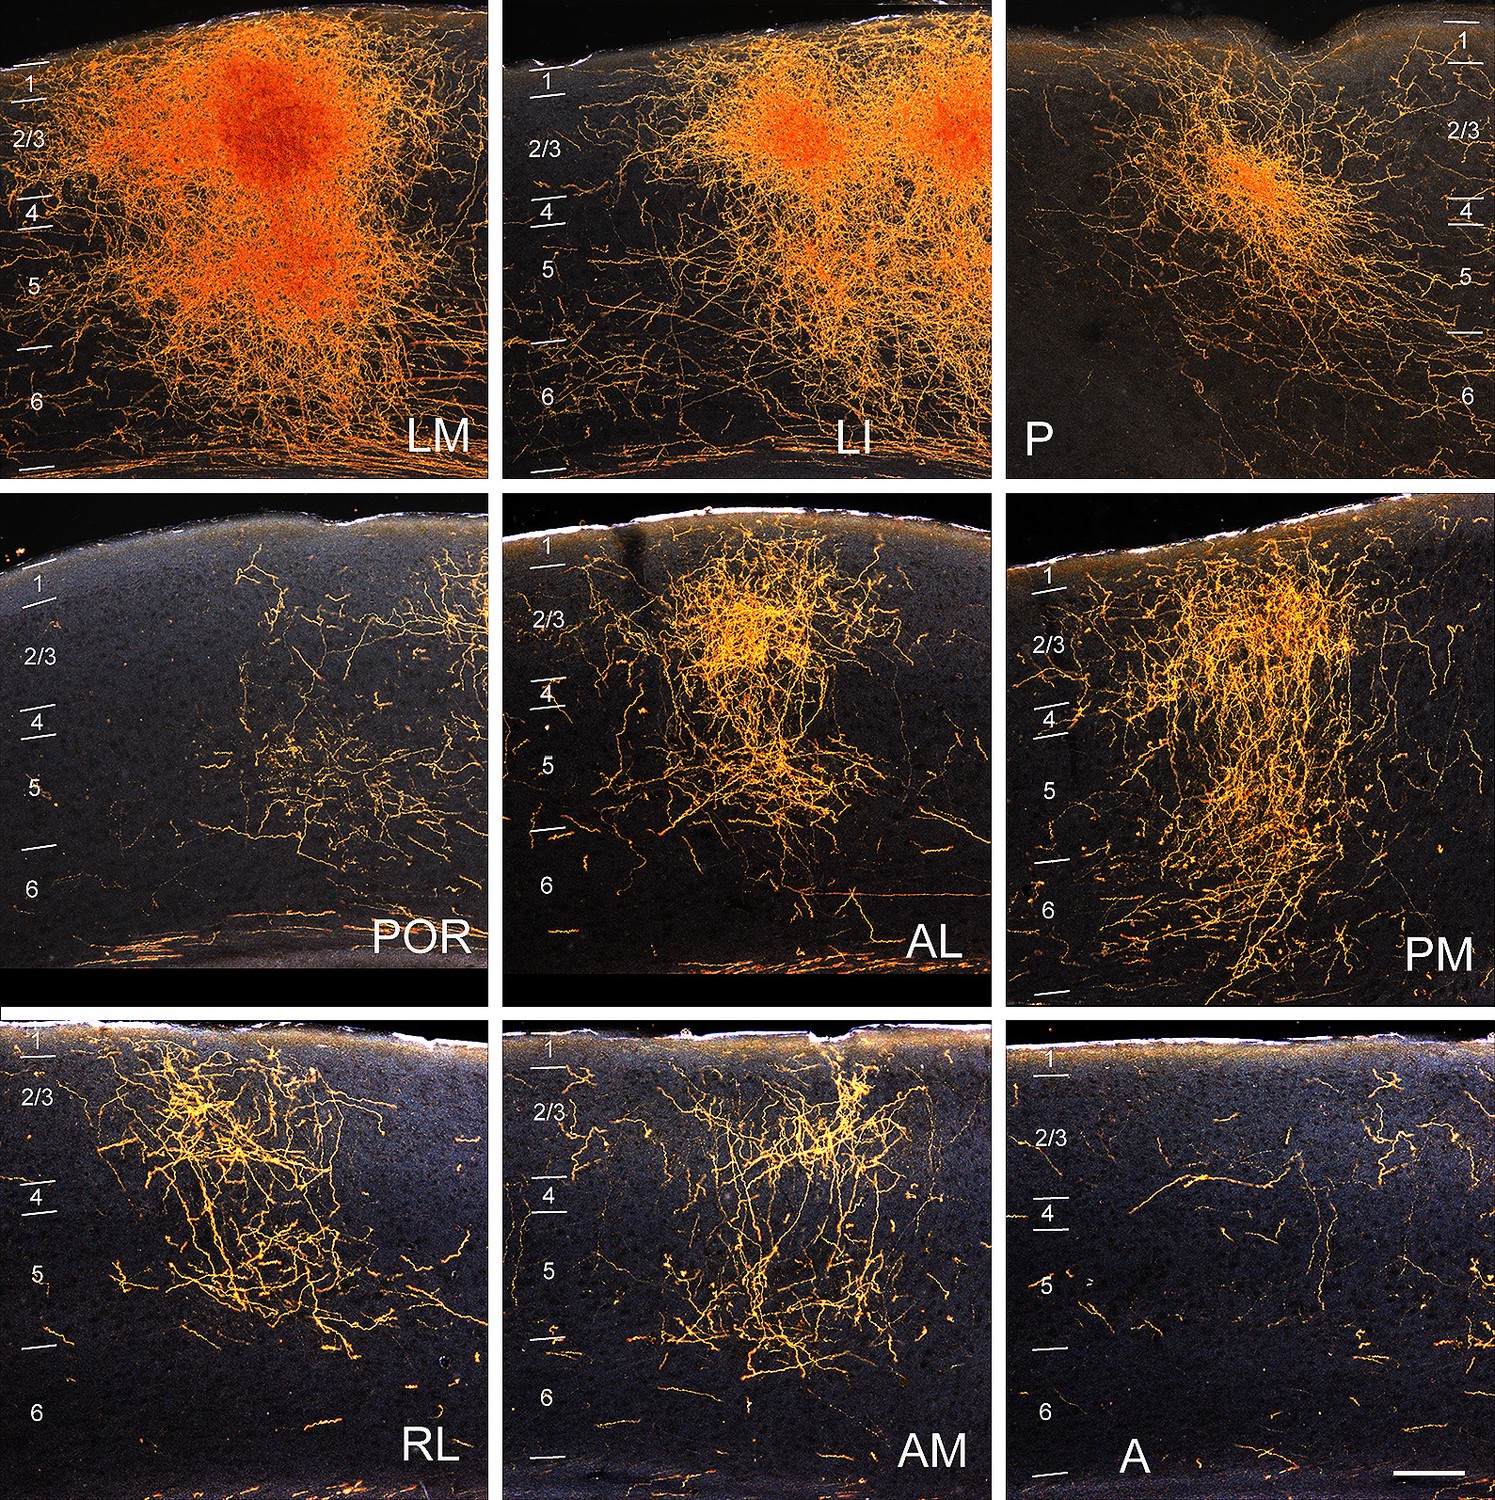
Darkfield images of the termination patterns of BDA-labelled axonal projections from V1 to LM, LI, P, POR, AL, PM, RL, AM and A.
Images are taken from the boxed regions shown in 1A. All projections are FF, which target L2-4 more strongly than L1. Scale bar, 0.5 mm.
Figure 1—figure supplement 2
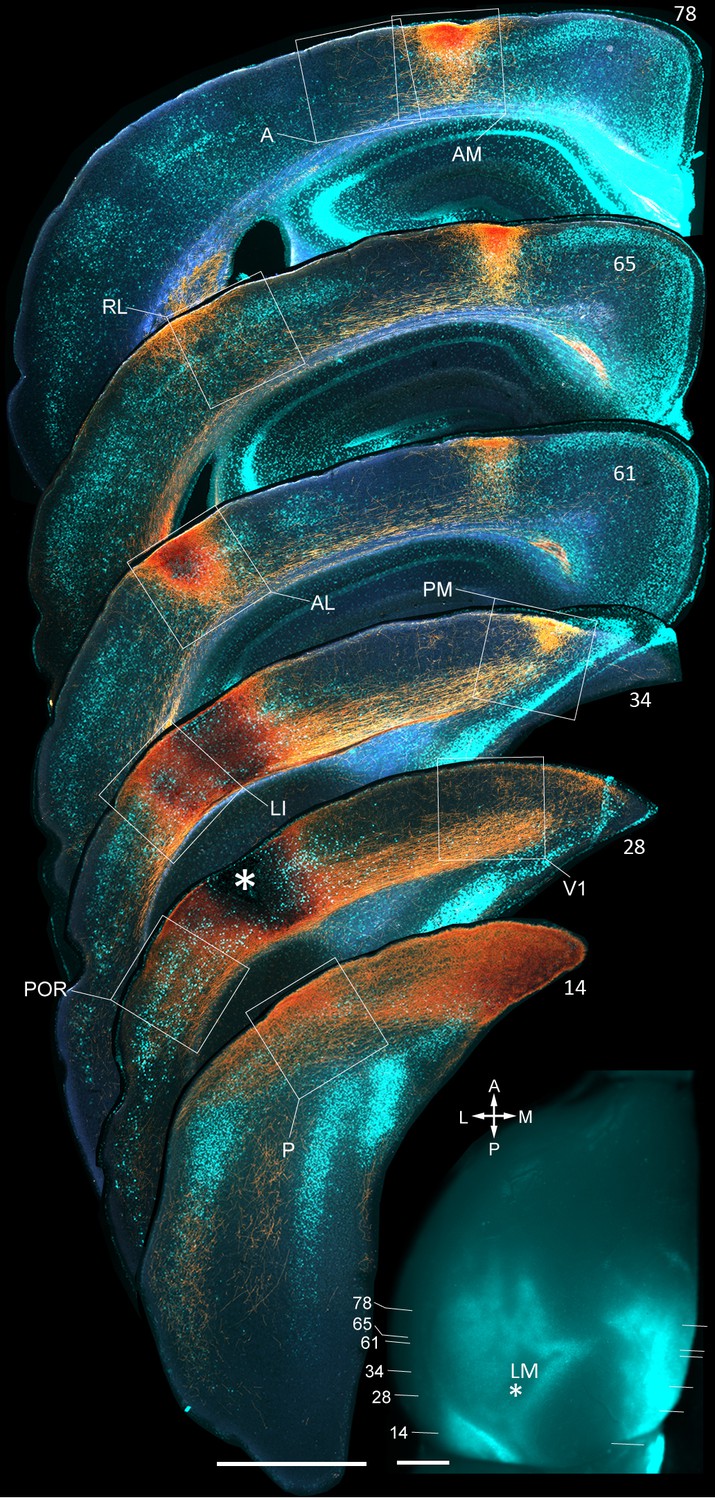
Coronal sections showing anterogradely labelled axons (yellow/orange) from LM to V1, LI, P, POR, AL, PM, RL, AM and A, upon BDA injection into LM.
Calossally projecting neurons (light cyan) are labelled retrogradely after injection of bisbenzimide into the opposite hemisphere. Boxed regions show projections to each of the nine target areas. Asterisk in coronal section 28 denotes injection site in LM. Scale bar, 1 mm. In situ image of left hemisphere shows retrogradely bizbenzimide-labelled neurons marking callosal landmarks. Injection site in LM (asterisk) and numbers of coronal slices shown above are indicated. Scale bar, 1 mm.
Figure 1—figure supplement 3
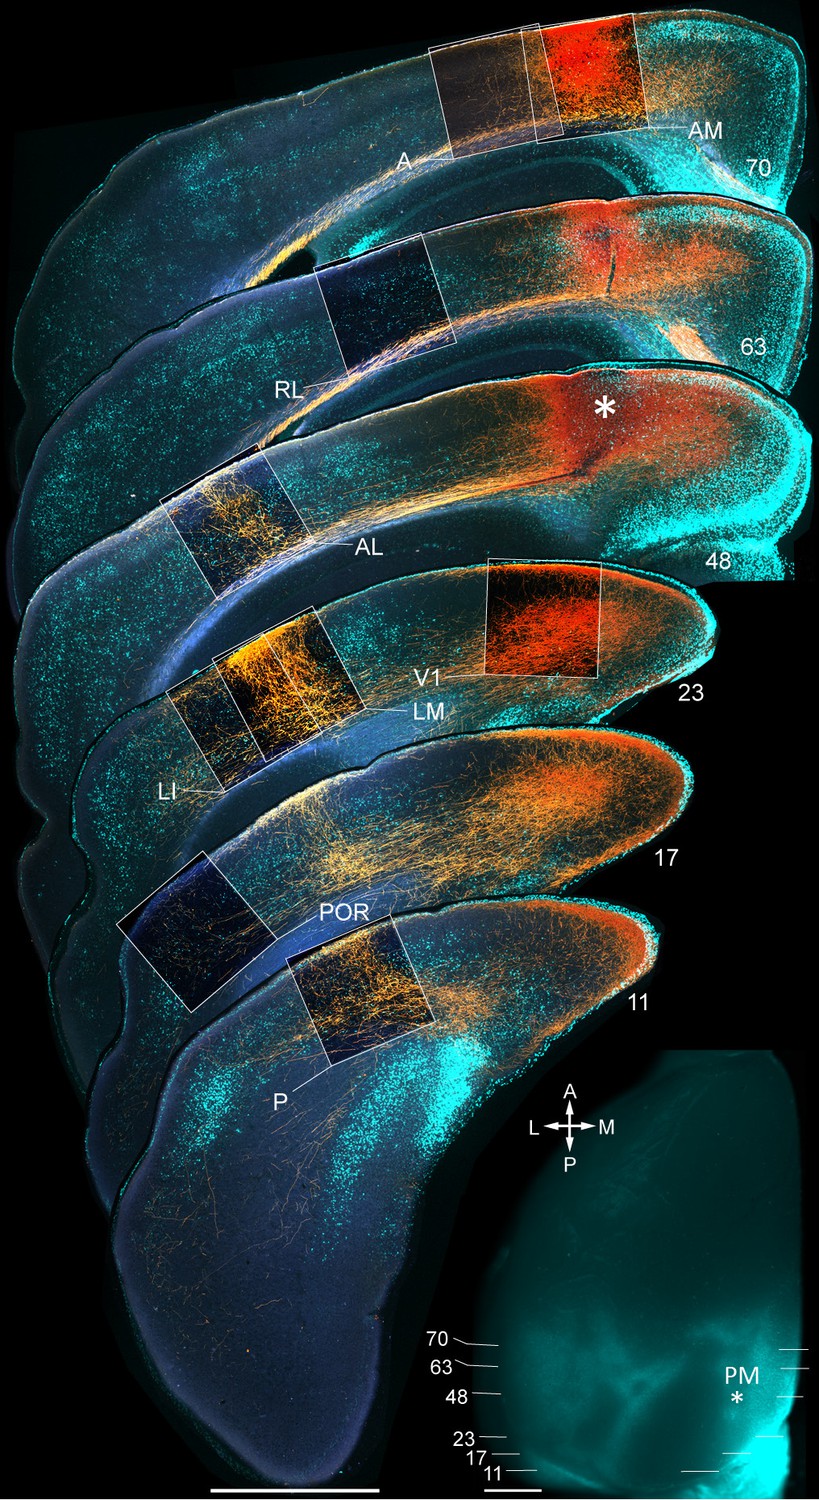
Axonal projections (yellow/orange) from PM to V1, LM, LI, P, POR, AL, RL, AM and A, upon BDA injection into PM.
Calossally projecting neurons (light blue, labeled with bisbenzimide) provide landmarks for areal identification (Wang and Burkhalter, 2007). Boxed regions show projections to target areas. Asterisk in section 48 denotes a region in PM adjacent to the injection site. Inset: Left hemisphere in situ shows injection site in PM (asterisk) and positions of coronal slices shown above. Scale bars, 1 mm.
Figure 2 with 2 supplements
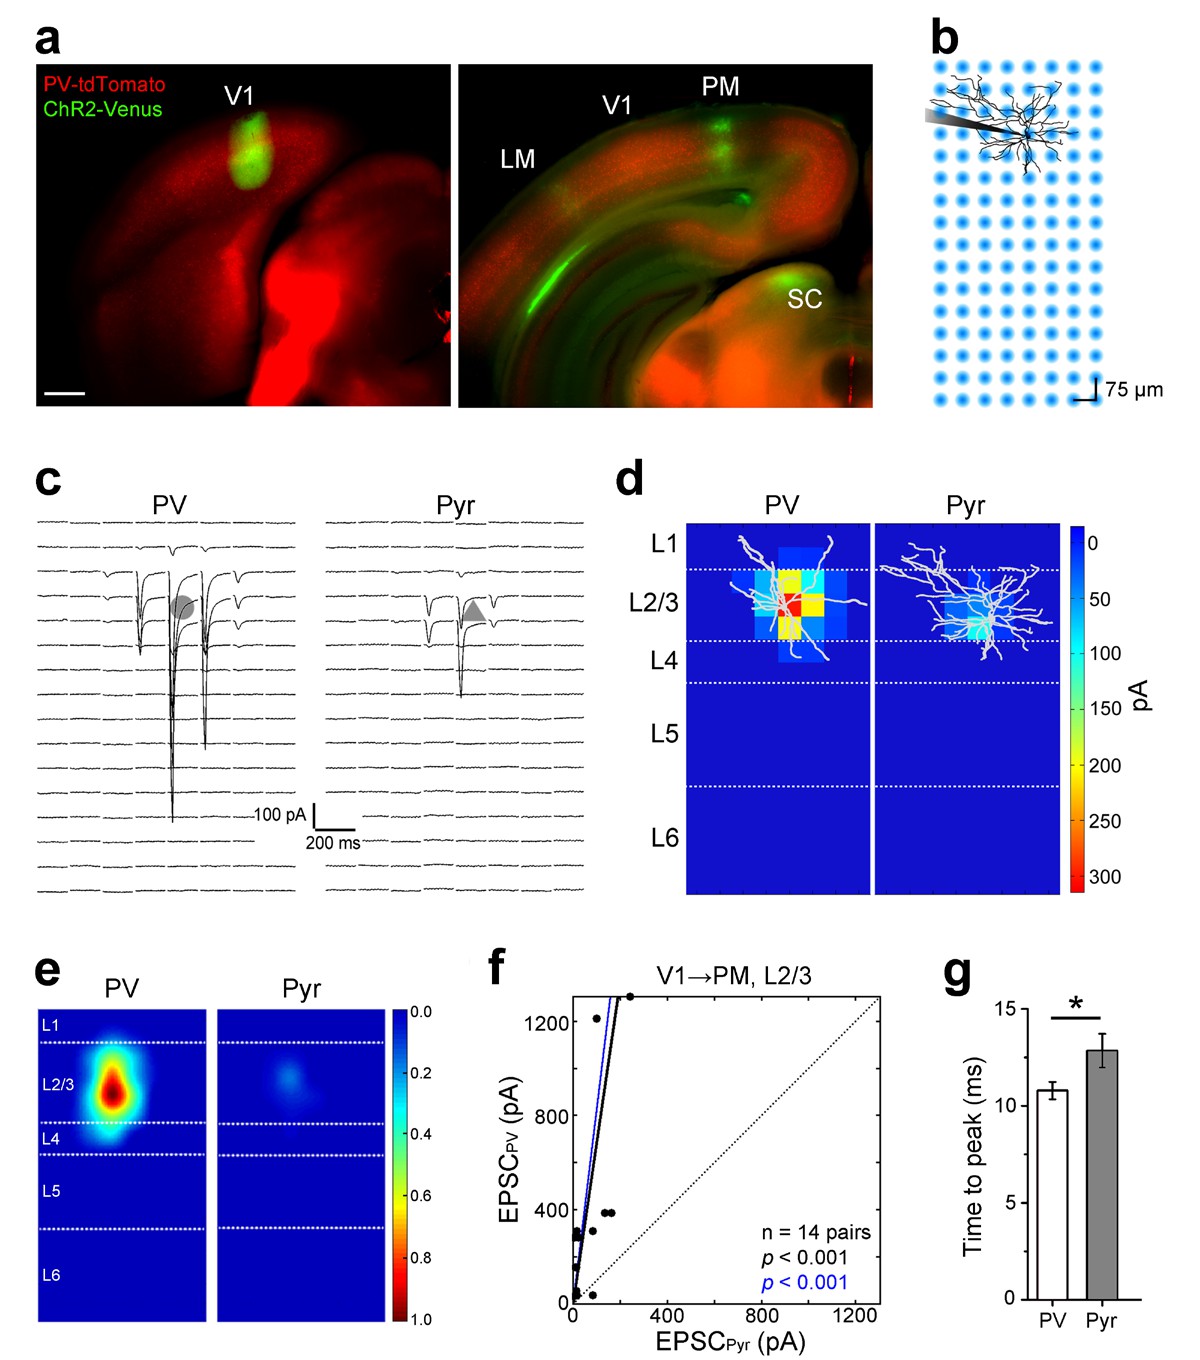
Subcellular ChR2-assisted mapping of V1→PM connections to L2/3 PV and Pyr cells.
(a) Coronal slices showing injection (left) and target (right) sites two weeks after the injection of AAV2/1.CAG.ChR2-Venus.WPRE.SV40 into V1. Scale bar, 500 µm. Select target areas indicated in right panel. SC, superior colliculus. (b) Schematic of laser-scanning photostimulation of ChR2-expressing axon terminals during whole-cell recording of a biocytin-filled neuron. TTX and 4-AP are added to the bath solution, and the blue laser is delivered successively one spot at a time in a grid pattern separated by 75 µm. (c) EPSCssCRACM in a PV (left) and a neighboring Pyr (right) cell upon photostimulation. Grey shapes denote the location of the cell body of the recorded neuron. (d) Heat map of mean EPSCs within 75 µs after photostimulation for the EPSCs in 3c. Reconstructions of respective biocytin-filled neurons are superimposed on heat map. (e) Average heat map of 14 neighboring PV-Pyr cell pairs in L2/3 receiving V1→PM input, normalized to largest pixel value between a pair. PV cells receive substantially stronger input. (f) Scatter plot denoting the relative input strengths to 14 PV-Pyr cell pairs. Each data point represents a pair with the respective EPSCs in the PV (vertical axis) and the Pyr (horizontal axis) cell. The total EPSC in PV cells is significantly larger than that in neighboring Pyr cells (p<0.001, Wilcoxon signed-rank test). Solid black line: mean slope, blue line: mean slope after normalizing currents to mean cell conductance. (g) The mean time to peak of EPSCs after photostimulation is larger in Pyr cells than in PV cells (*p<0.05, paired t-test).
Figure 2—figure supplement 1
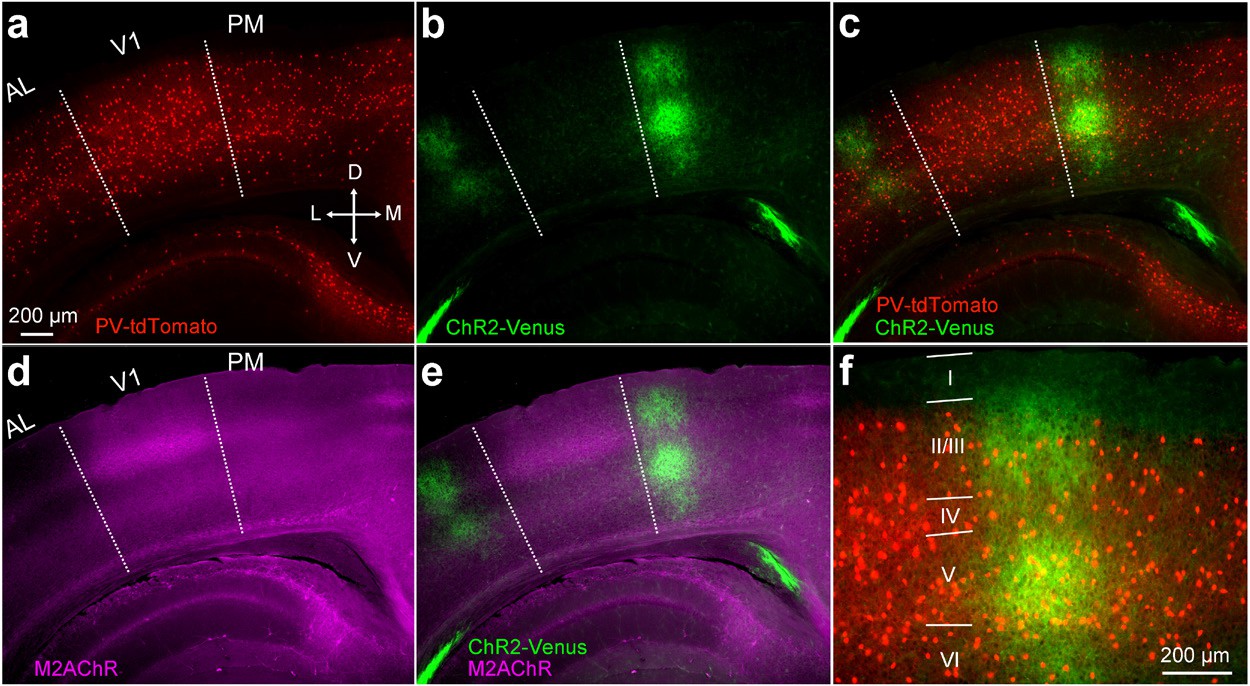
V1→PM pathway in a PV-tdT mouse.
(a−e) Image of coronal section two weeks after the injection of AAV2/1.CAG.ChR2-Venus.WPRE.SV40 into V1. Slice includes areas PM, AL, and V1. PV cells in red (a,c), ChR2-Venus-expressing axons in green (b,c). Merged image in (c). Dotted lines demarcate AL/V1 and V1/PM boundaries indicated by the sharp decline of M2 expression between V1 and surrounding areas (d). V1 is characterized by a thick band of M2 expression (purple) in L4, showing that the axonal terminations (green) lie outside V1 (d,e). (f) Higher magnification view of PM from (c) with layers indicated.
Figure 2—figure supplement 2
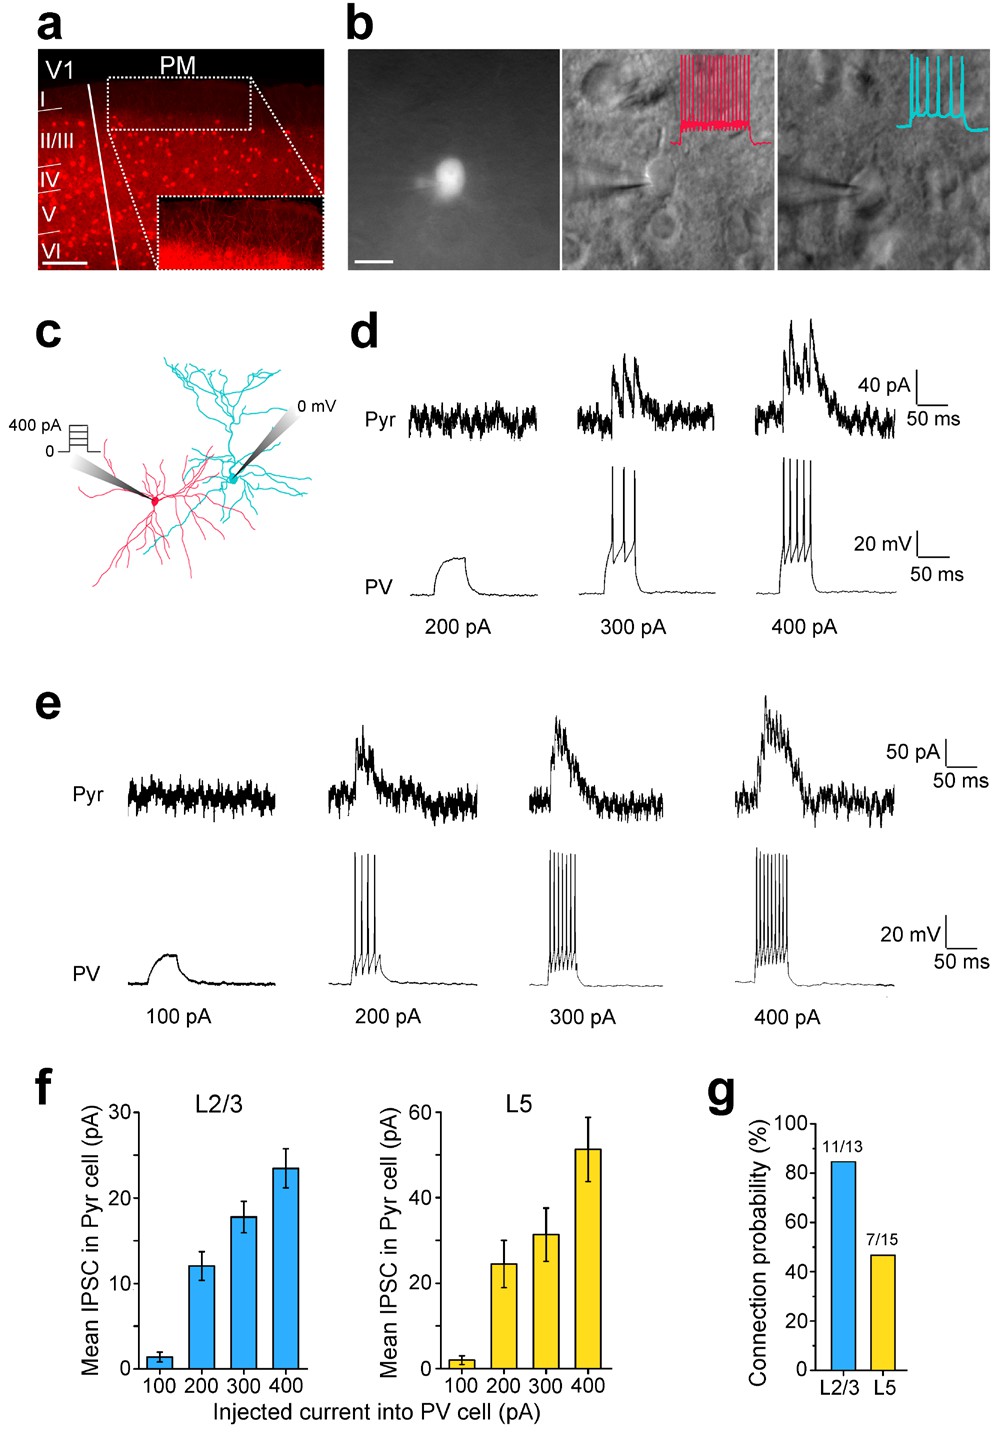
Paired recordings of excitation-dependent, PV cell-mediated inhibition of Pyr cells.
(a) Coronal section through V1 and PM of a PV-Cre × Ai9 mouse in which PV cells express tdT (red). Scale bar, 200 µm. Inset: Higher magnification of the boxed region shows a high density of tdT-expressing dendrites in L1 even though PV cell bodies are not found in this layer. (b) Left, PV cell identified by tdT expression targeted for whole-cell recordings. Scale bar, 20 µm. Middle, same cell as in left panel, imaged under DIC-IR optics. PV cell shows a non-adapting, fast-spiking firing pattern (inset, red trace) upon current injection. Right, A Pyr cell under infrared optics exhibits an adapting spiking physiology (blue trace) upon current injection. (c) Schematic of paired recordings of a PV (red) and a Pyr (blue) cell. Successively increasing current steps (100, 200, 300 and 400 pA) were injected into the PV cell under current clamp, and inhibitory currents (IPSCs) were recorded in the Pyr cell held at 0 mV under voltage clamp. (d) Example trace in a L2/3 PV-Pyr connected pair in PM. Increasing current injections into the PV cell results in stronger inhibitory drive to the Pyr cell. (e) Example traces of a connected PV-Pyr cell pair in L5 of PM. (f) Pooled data from connected PV-Pyr pairs in L2/3 (left) and L5 (right) show that increasing the excitation of PV cells results in stronger inhibition of synaptically connected Pyr cells (p<0.001 for both sets of data; ANOVA). Mean IPSCs measured over 75 ms after start of current step. (g) Probability of a PV cell connected to a neighboring Pyr cell (<100 µm) in L2/3 and L5 of PM.
Figure 3 with 1 supplement
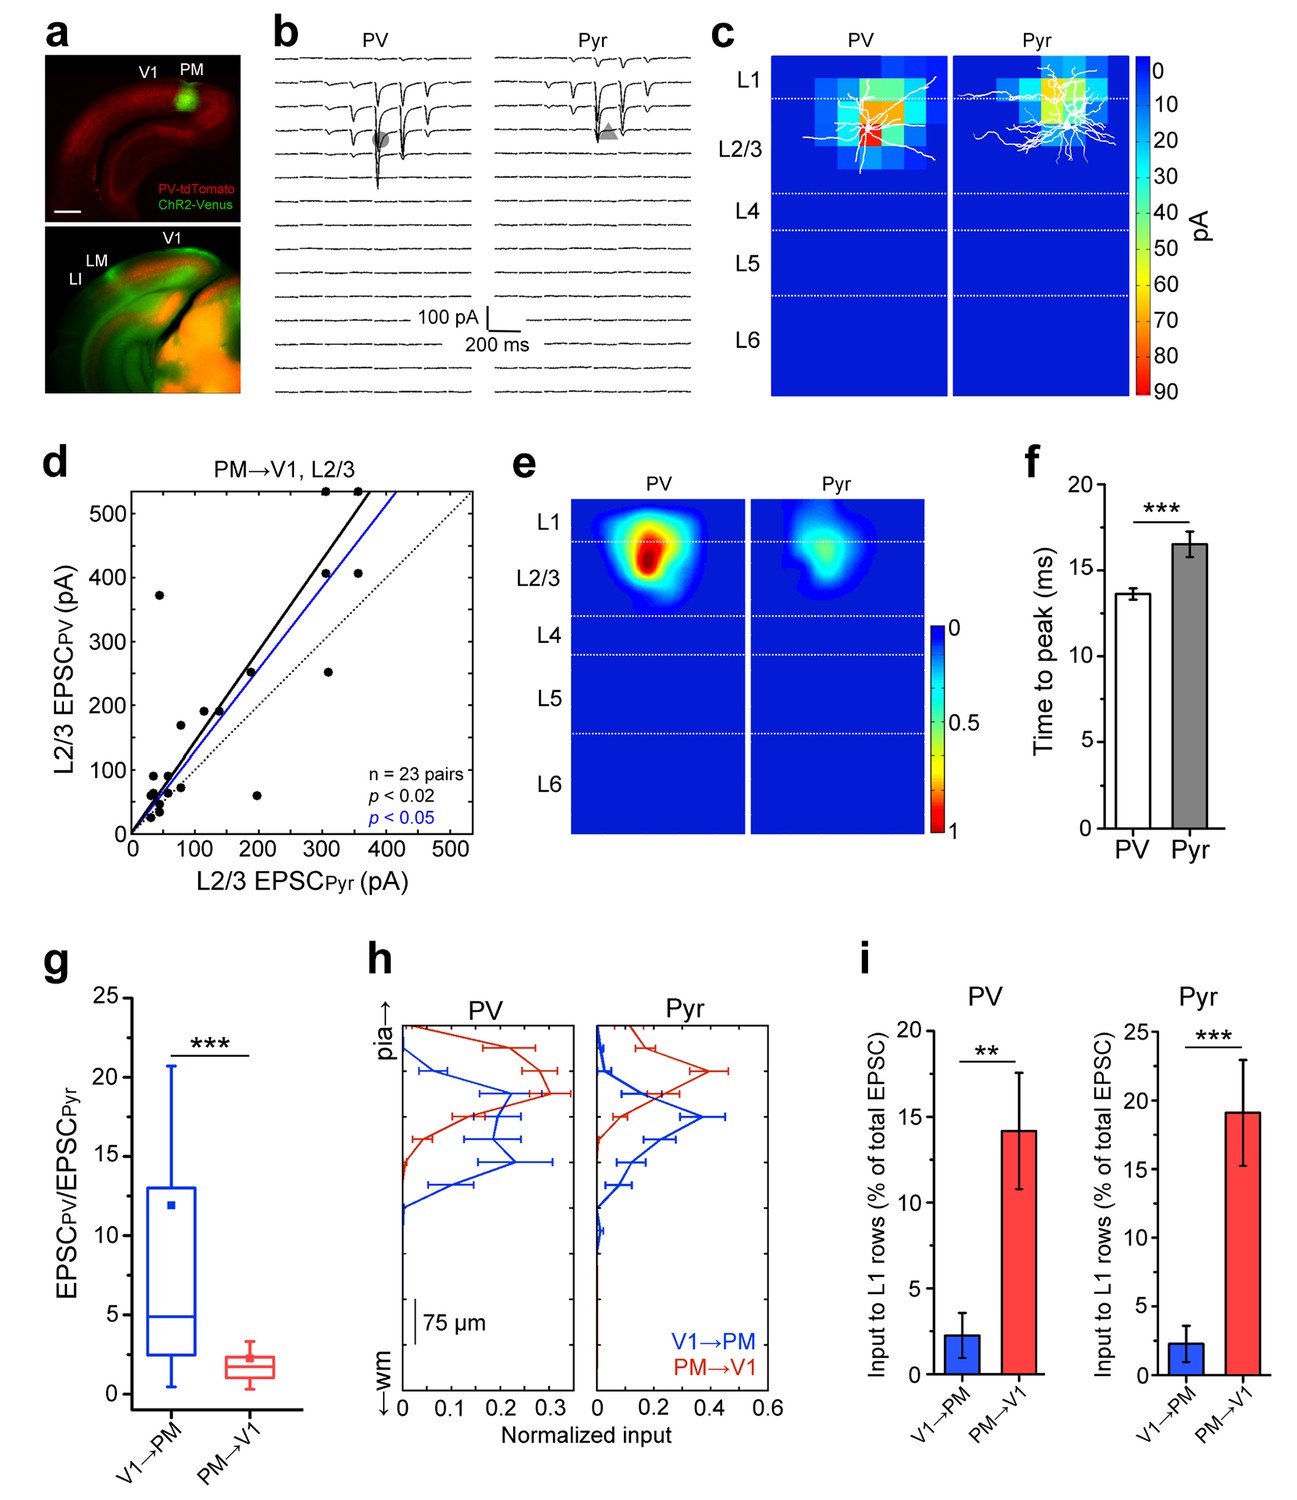
Lower I/E balance in PM→V1 pathway.
(a) Coronal slices showing AAV2/1.CAG.ChR2-Venus (green) injection in PM (top) and axonal labelling in target areas (bottom) of a PV-tdT (red) mouse. Scale bar, 1 mm. (b) EPSCssCRACM in a pair of neighboring PV (left) and Pyr cells (right) in V1. (c) Heat map of the currents in 4b superimposed with biocytin-filled neurons (white). Note significant input into L1 of both cell types. (d) PV cells, on average, exhibit larger EPSCssCRACM than neighboring Pyr cells in the PM→V1 pathway (p<0.02, Wilcoxon signed-rank test). Solid black line: mean slope of data points; blue line: mean slope after normalization to cell conductance. (e) Normalized, mean heat map of all L2/3 pairs in the FBPM→V1 pathway. (f) EPSCs are faster in L2/3 PV than in neighboring Pyr cells upon stimulation of FBPM→V1 axon terminals (*p<0.001, paired t-test). (g) The interareal excitation of PV cells, normalized to that of neighboring Pyr cells, is on average larger in the FFV1→PM than in the FBPM→V1 pathway (***p<0.001, Mann-Whitney U-test). (h) Total currents in each row of the 8 × 16 grid for FFV1→PM and FBPM→V1 pathways plotted against relative position of each of the 16 rows. EPSCs normalized to total EPSC in each cell-type. pia, pia mater; wm, white matter. (i) Interareal input to L1 is stronger in the FBPM→V1 than in the FFV1→PM pathway in both cell types (**p<0.01, ***p<0.001, Mann-Whitney U-test). L1 input was calculated as the mean of the total input to each row of the 8 × 16 grid that resided in L1, presented as the percentage of the total input to the neuron.
Figure 3—figure supplement 1
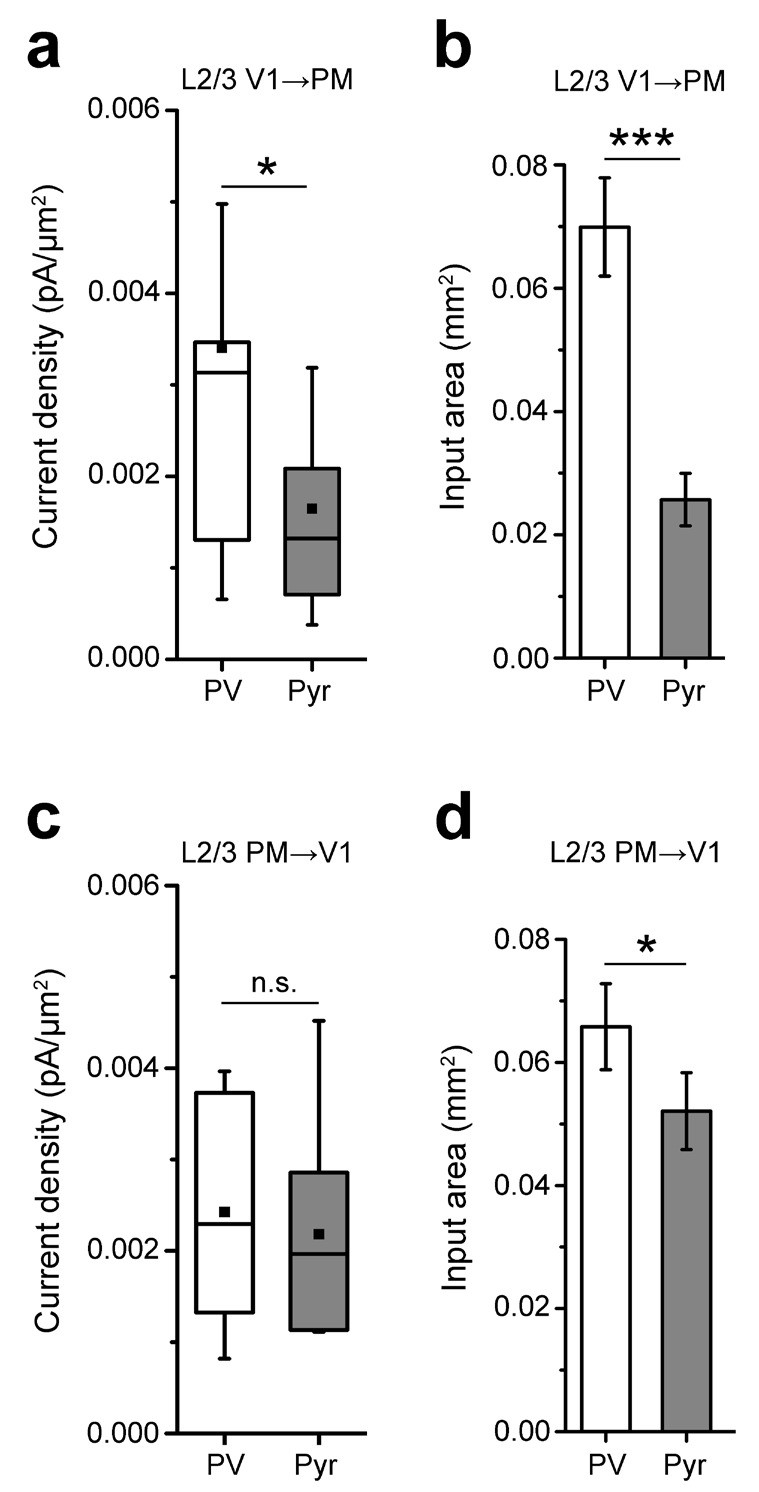
Analyses of inputs to L2/3 PV and Pyr neurons in the reciprocal pathways between V1 and PM.
(a) The EPSC per 75 × 75 µm pixel, calculated as pA/µm (2), is larger in PV than in Pyr cells in FFV1→PM. (b) Individual PV cells receive interareal FFV1→PM input over a larger area than Pyr cells (***p<0.001). (c) The EPSC per pixel in PV and Pyr cells is not significantly different in the FBPM→V1 pathway. (d) PV cells receive input over a larger area than Pyr cells in the FBPM→V1 pathway (*p<0.05).
Figure 4 with 2 supplements
Interareal recruitment of L2/3 PV cells depends on the pathway and the hierarchical distance between areas.
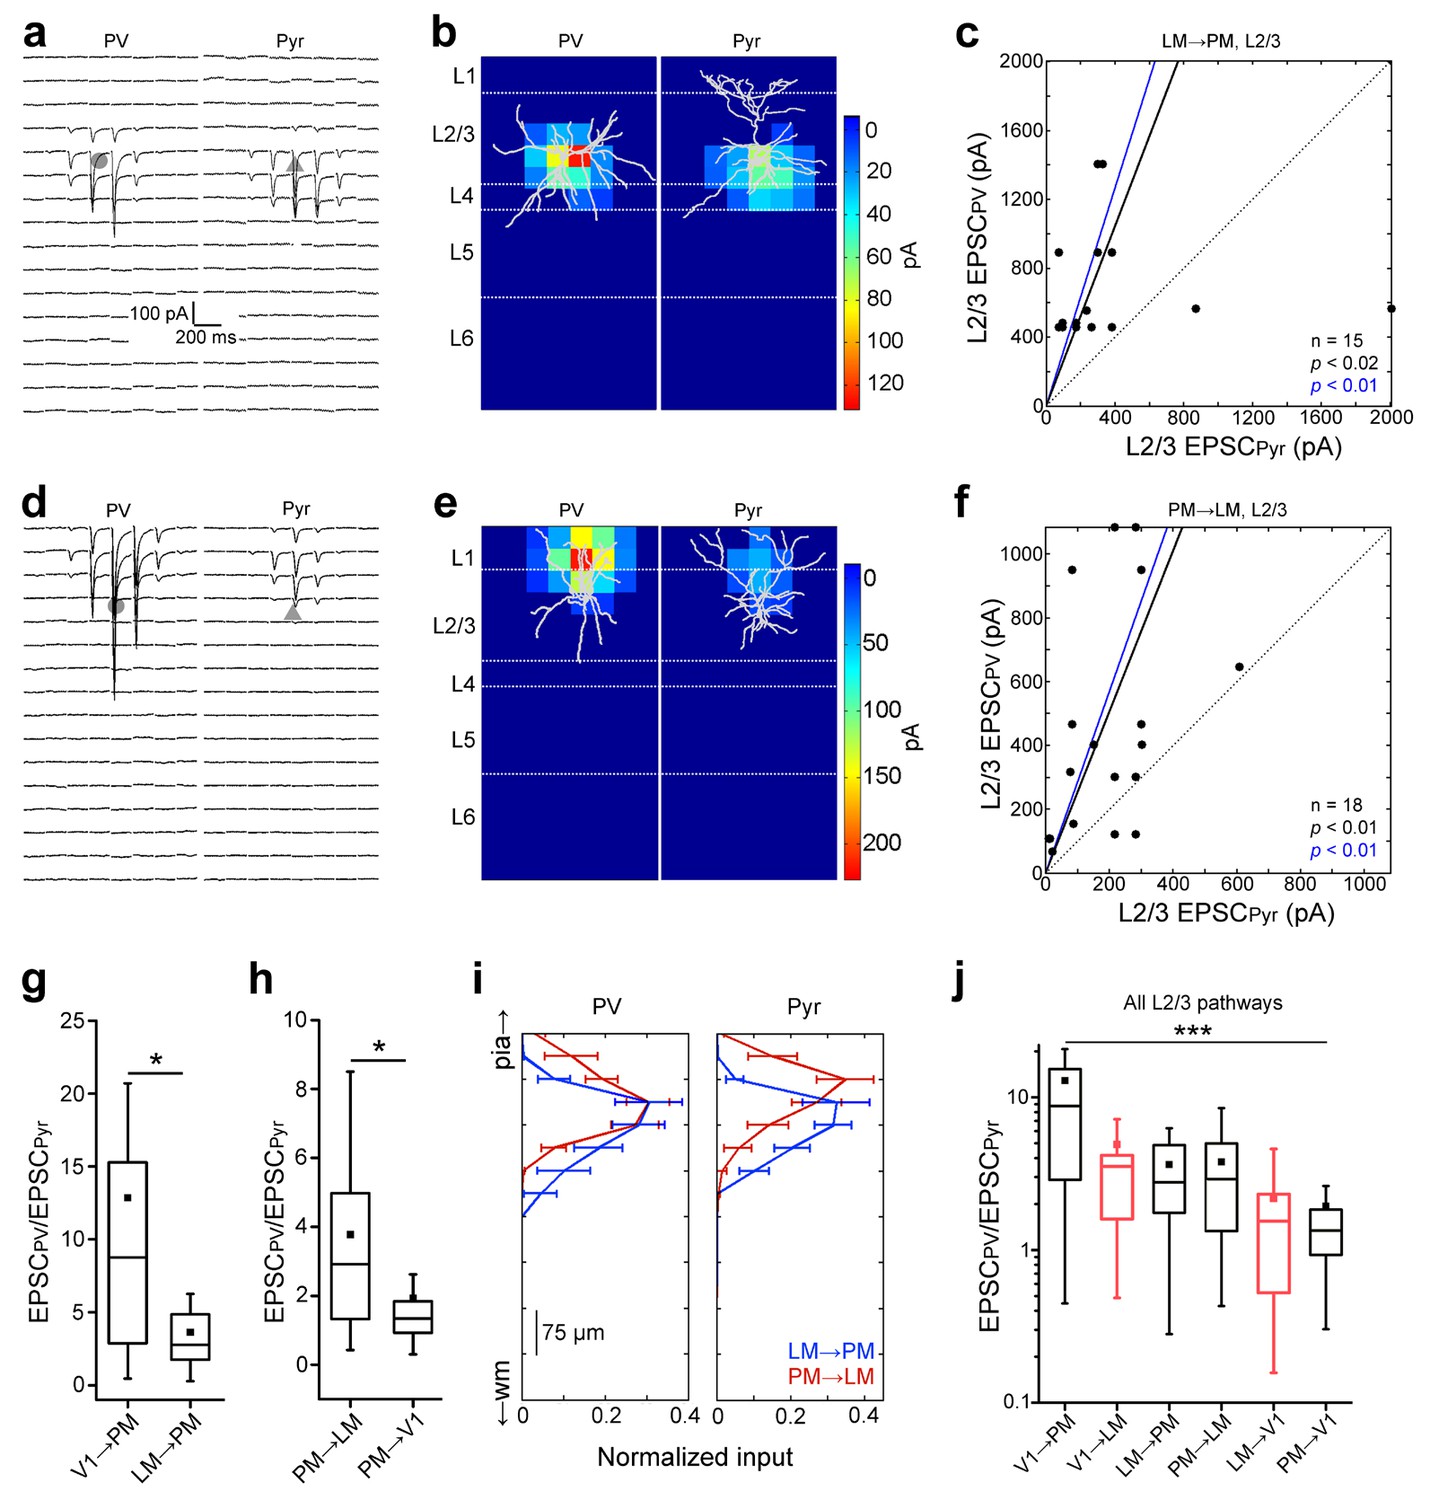
(a) EPSCssCRACM in a L2/3 PV (left) and Pyr (right) cell in the FFLM→PM pathway. (b) sCRACM map of EPSCs in 5a with reconstructed neuron positions. (c) Scatter plot of all PV-Pyr cell pairs in the L2/3 FFLM→PM pathway. PV cells exhibit larger currents than Pyr cells. (d–f) Similar data as in (a–c) but for the L2/3 FBPM→LM pathway. Note stronger L1 input in this pathway. (g) PV cell excitation, normalized to that of a neighboring Pyr cell, is stronger in the FFV1→PM than in the hierarchically shorter FFLM→PM pathway (*p<0.05, Mann-Whiteney U-test). (h) Normalized PV cell excitation is stronger in the FBPM→LM than in the hierarchically longer FBPM→V1 pathway (*p<0.05, Mann-Whiteney U-test). (i) Normalized plot of the total current in each row of the 8 × 16 grid, plotted against row position. EPSCs normalized to total current in each cell-type. (j) The total EPSCssCRACM in a PV cell, normalized to the total EPSCssCRACM in a neighboring Pyr cell, depends on the directionality of the pathway and hierarchical distance between areas. Red boxes represent data describing connections between V1 and LM from Yang et al. (2013). ***p<0.001, Kruskal-Wallis test.
Figure 4—figure supplement 1
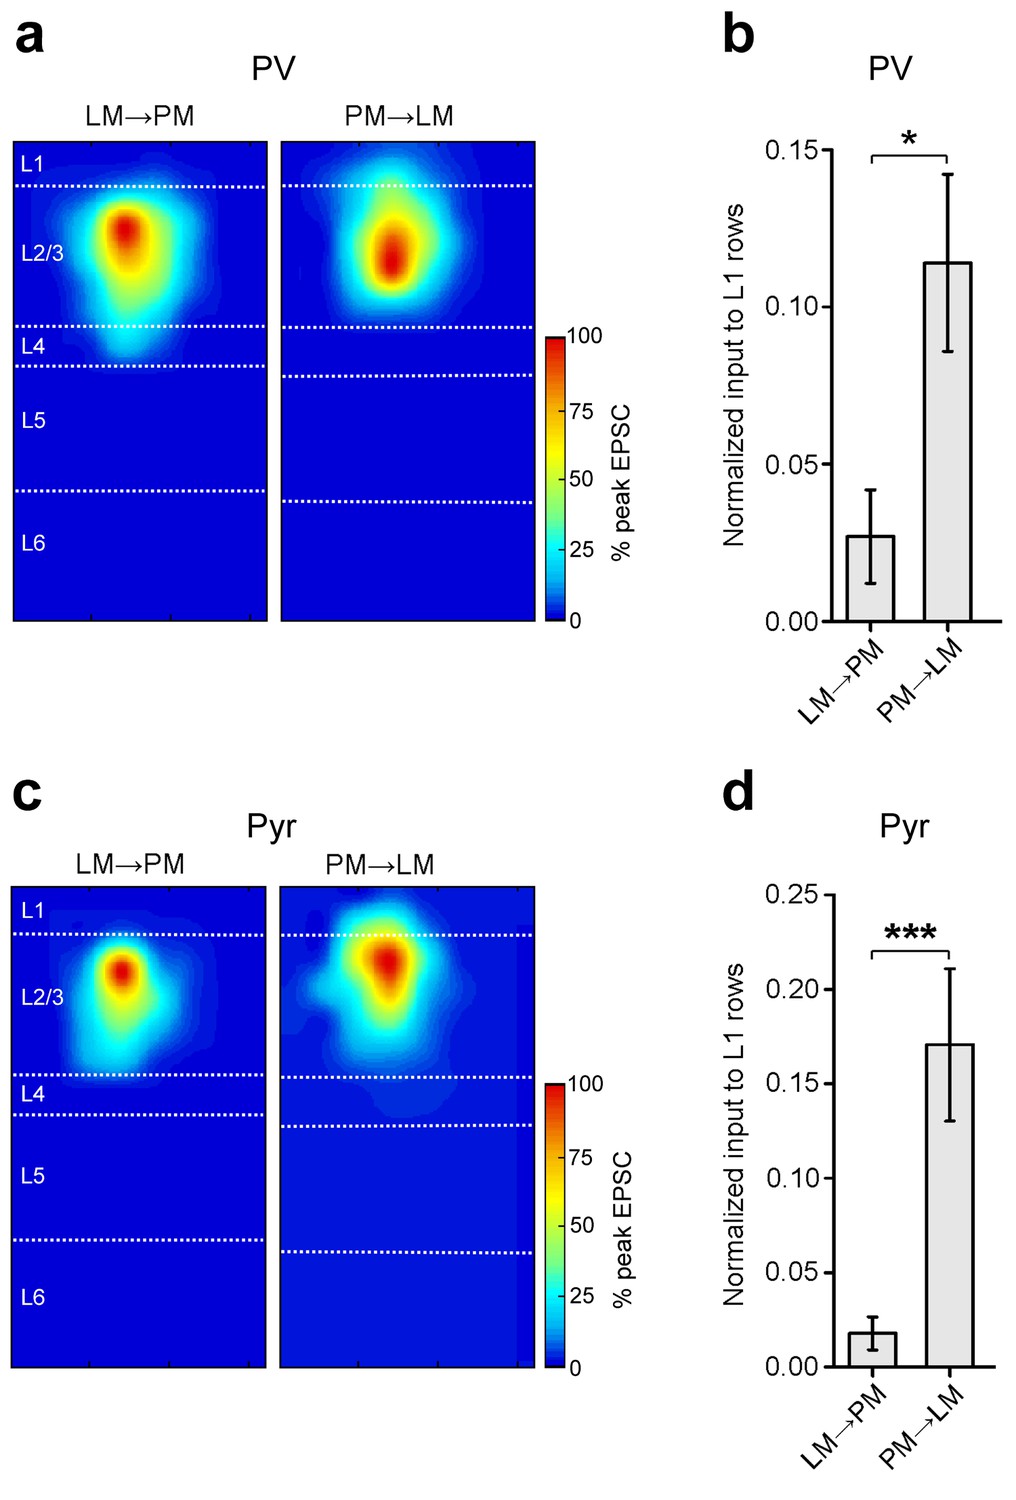
Stronger input to L1 in the PM-to-LM than in the LM-to-PM pathway.
(a) Normalized heat maps of average EPSCs in L2/3 PV cells in the FFLM→PM and FBPM→LM pathways. EPSC values normalized to peak pixel in each panel. (b) Interareal input to L1 is stronger for PV cells in the FBPM→LM pathway than in FFLM→PM. L1 input calculated as average input to each row of the 8 × 16 grid that resided in L1, normalized to total EPSC recorded from the cell. (c) Normalized heat maps of average EPSCs in L2/3 Pyr cells in FFLM→PM and FBPM→LM. EPSC values normalized to peak value within panel. (d) Interareal input to L1 is stronger for Pyr cells in the FBPM→LM than in the FFLM→PM pathway.
Figure 4—figure supplement 2
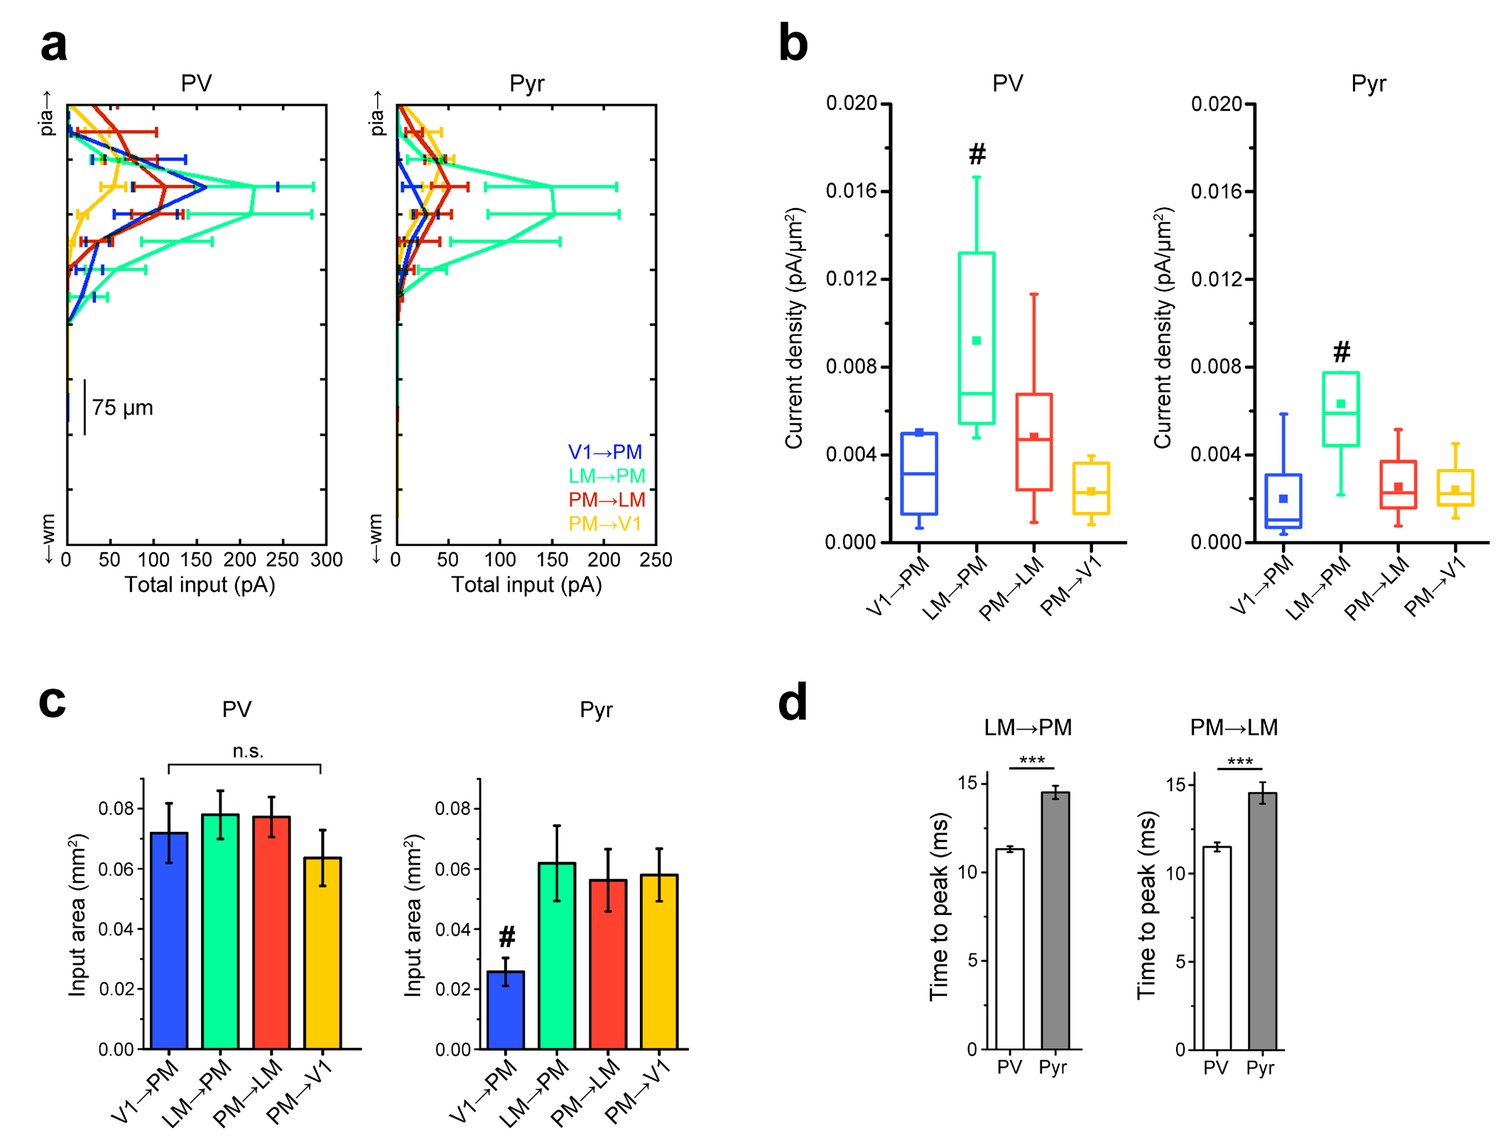
Comparisons of strengths, extent, and rise times of inputs in L2/3 pathways.
(a) Total EPSC per row plotted against row position for L2/3 PV and Pyr cells in the FFV1→PM, FFLM→PM, FBPM→LM and FBPM→V1 pathways. Strongest EPSCs in both cell types are observed in the LM→PM pathway, with weak EPSCs to Pyr cells in the FFV1→PM pathway. (b) FFLM→PM inputs result in the strongest current density (measured as EPSC/pixel, converted to pA/µm [Coogan and Burkhalter, 1993]) among all examined L2/3 pathways for both PV and Pyr cells (#p<0.05 against each of the other three pathways) (c) The total area over which individual PV cells receive input is not significantly different for PV cells. Pyr cells in the FFV1→PM pathway receive input over the smallest area (#p<0.05 against each of the other pathways). (d) The mean time to peak for interareal EPSCs is smaller in PV than in Pyr cells in both FFLM→PM and FBPM→LM pathways.
Figure 5

FF input to L5 neurons.
(a) FFV1→PM EPSCssCRACM in a pair of neighboring L5 PV (left) and Pyr (right) cells. (b) Heat map of EPSCs in 6a superimposed with respective biocytin-filled L5 neurons. (c) Scatter plot, as previously described, of EPSCssCRACM in PV and Pyr cell pairs in L5 FFV1→PM. The total current in PV and Pyr cells were not significantly different. (d–f) Similar data as in Figure 6a—c but for L5 FFLM→PM. (g,h) PV cell excitation, normalized to the excitation of a neighboring Pyr cell, is stronger in L2/3 than in L5 for both V1→PM (g) and LM→PM pathways (h). (i) Total EPSC in each row of the 8 × 16 grid normalized to total current recorded, plotted against row position (16 rows). Note that L5 PV cells do not show significant differences in the laminar distribution of EPSCs in the two pathways, but L5 Pyr cells receive more input in the upper layers from LM than from V1. (j) Interareal input in L2-4 for L5 PV cells (left) in PM is not significantly different for the two pathways. L5 Pyr cells (right) receive more L2-4 input in the FFV1→PM than in the FFLM→PM pathway. L2-4 input calculated as the average EPSC in each row that resided in L2-4, shown as the percentage of the total EPSC in the cell (***p<0.001, Mann-Whitney U-test).
Figure 6

FB input to L5 neurons.
(a) FBPM→LM EPSCssCRACMin a pair of neighboring L5 PV (left) and Pyr (right) cells. (b) Heat map of EPSCs from 7a superimposed with the respective biocytin-filled L5 neurons. (c) Scatter plot of all L5 PV-Pyr neuron pairs receiving input from FBPM→LM. Total EPSC in the two cell types are not significantly different. (d–f) Similar data as 7a-c but for the FBPM→V1 pathway. (g) Total EPSC in each row of the stimulation grid plotted against row position. The grids of the two different pathways are aligned to pial surface. (h) EPSCs in PV cells normalized to EPSCs in neighboring Pyr cells (EPSCPV/EPSCPyr) for all L5 pathways arranged from most FF to most FB. Unlike in L2/3, the EPSCPV/EPSCPyr ratios in L5 are not significantly different in different pathways (p>0.2, Kruskal-Wallis test). Red boxes describe data from Yang et al. (2013). (i) Interareal EPSCs are faster in PV than in Pyr cells in all L5 pathways (*p<0.05, ***p<0.001, paired t-test).
Download links
A two-part list of links to download the article, or parts of the article, in various formats.
Downloads (link to download the article as PDF)
Open citations (links to open the citations from this article in various online reference manager services)
Cite this article (links to download the citations from this article in formats compatible with various reference manager tools)
Recruitment of inhibition and excitation across mouse visual cortex depends on the hierarchy of interconnecting areas
eLife 5:e19332.
https://doi.org/10.7554/eLife.19332


