Methylglyoxal, a glycolysis side-product, induces Hsp90 glycation and YAP-mediated tumor growth and metastasis
- University of Liège, Belgium
- Maastricht University, Netherlands
- Cardiovascular Research Institute Maastricht, The Netherlands
- University of Nagoya, Japan
- Yale University, United States
- University of Melbourne, Australia
- Association for Research and Treatments Against Cancer, France
Figures
Figure 1
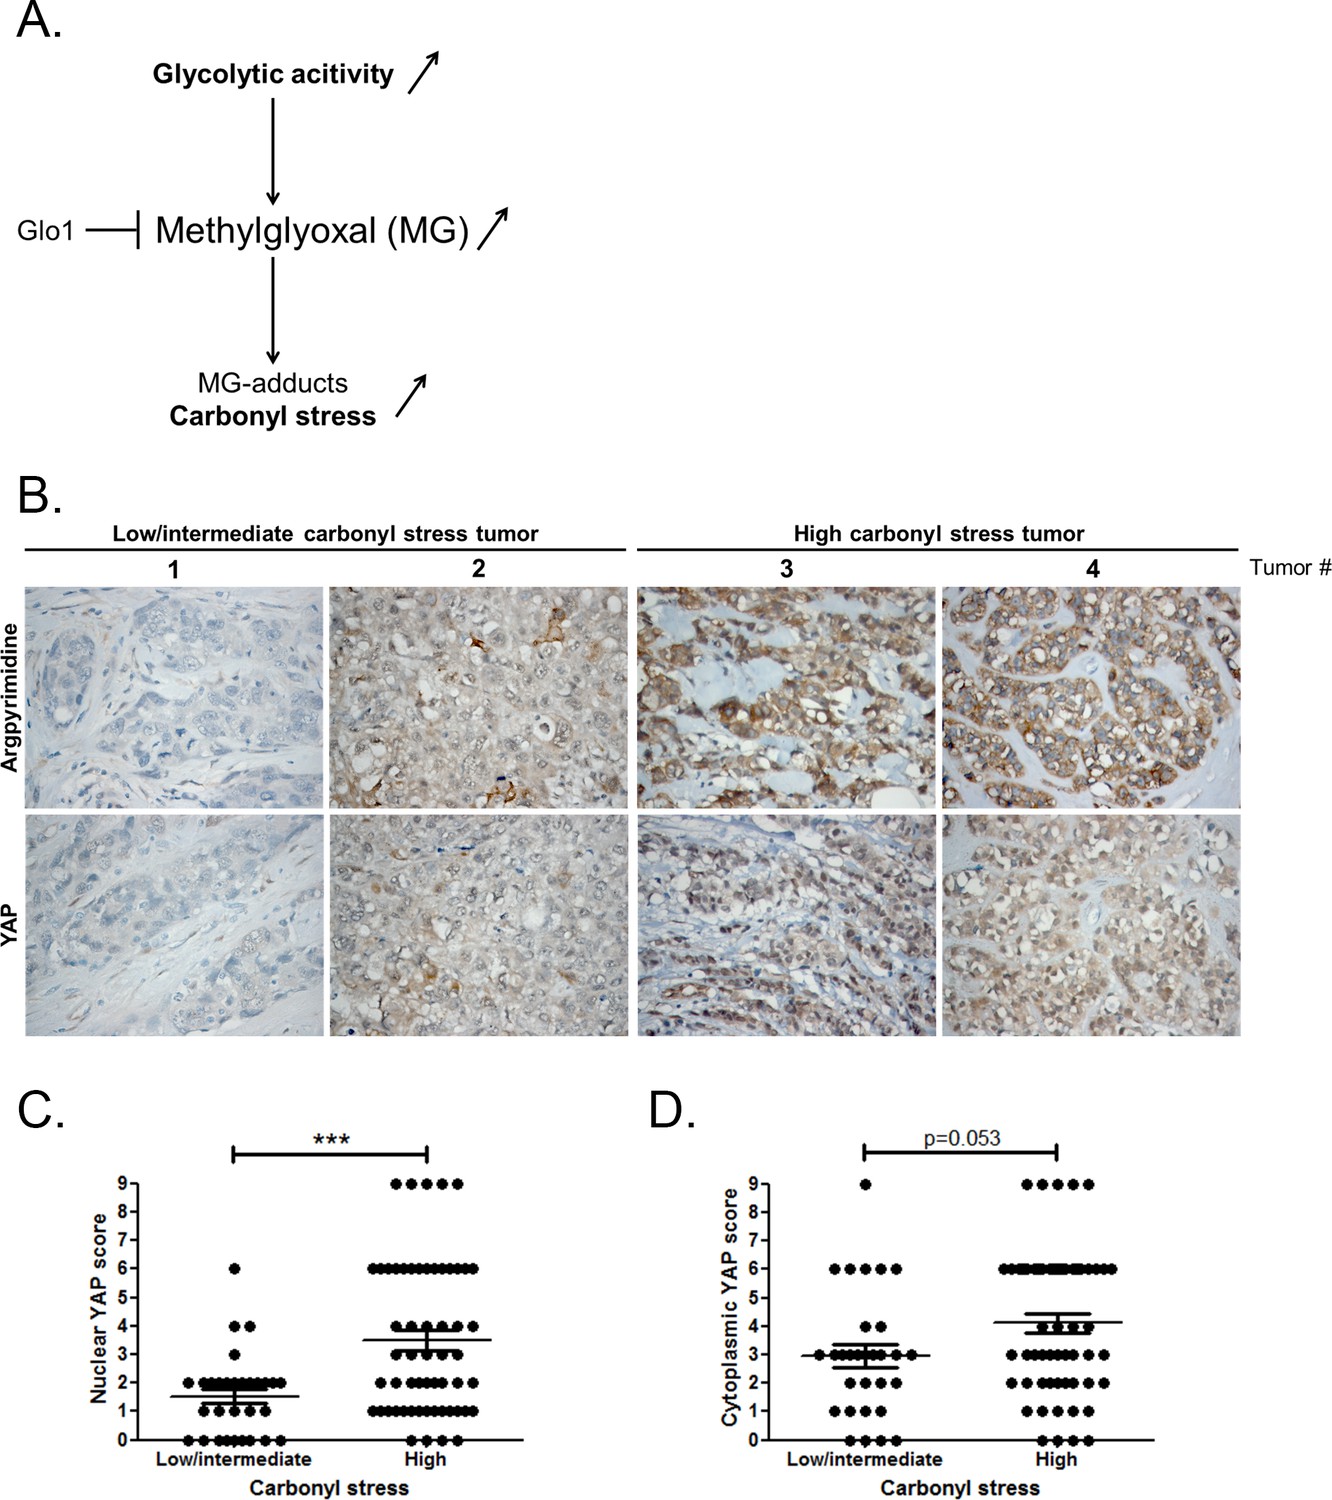
High carbonyl stress and nuclear YAP are positively associated in human breast cancer.
(A) In cancer cells, a high glycolytic metabolism and/or a decrease of the MG-detoxifying activity of Glyoxalase 1 (Glo1) lead to high MG level thus establishing a carbonyl stress. (B) YAP IHC staining in representative low/intermediate and high carbonyl stress human breast tumors as assessed by their argpyrimidine level. (C) Quantification of nuclear and (D) cytoplasmic YAP IHC staining in a series of human breast cancer (n = 87). Each dot represents one case and bars represent mean ± SEM. Data were analyzed using Mann Whitney U and Wilcoxon Rank Sum tests and *** represents p<0.001.
Figure 2 with 3 supplements
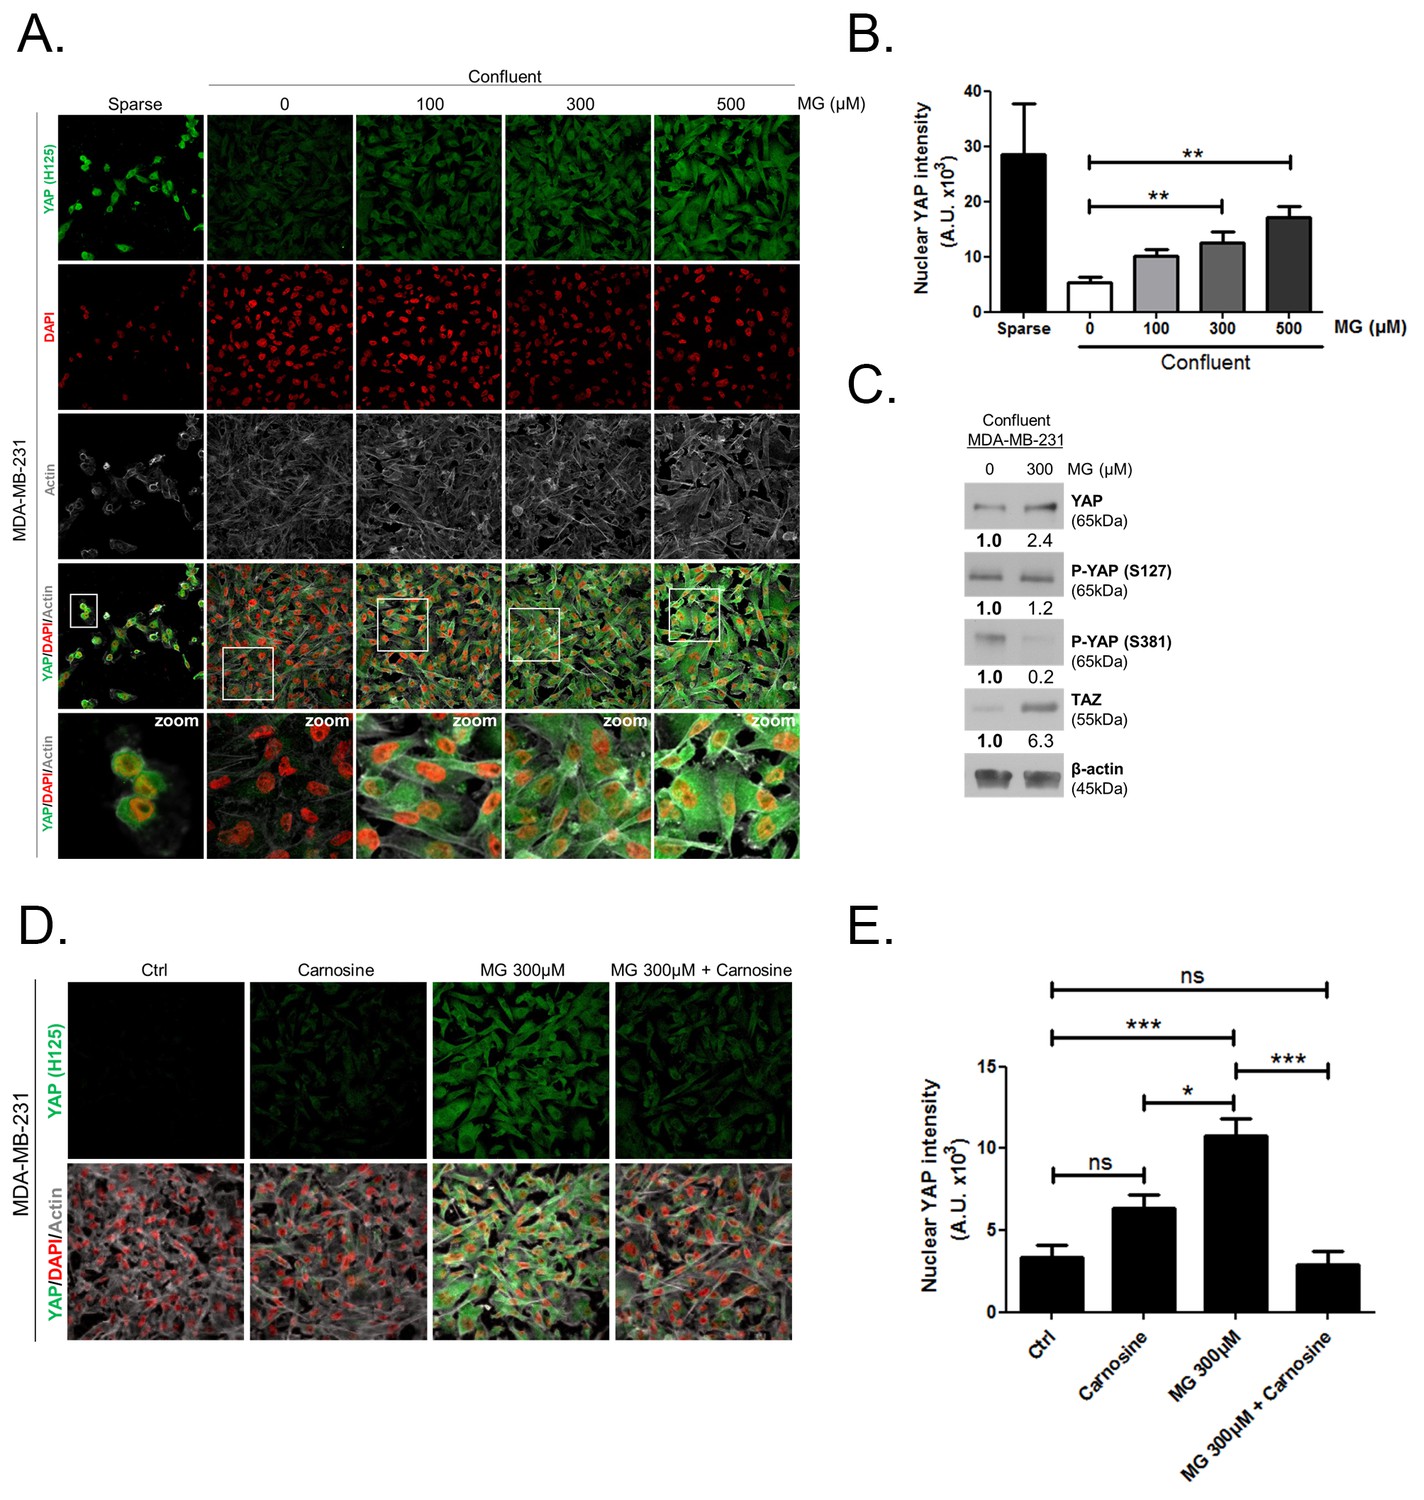
Methylglyoxal induces YAP persistence in confluent breast cancer cells.
(A) Immunofluorescence (IF) staining shows that YAP (Santa Cruz antibody, H125) is mainly localized in the nucleus at low cellular density (Sparse) and is weakly detectable at high cellular density (Confluent) in MDA-MB-231 cells. In contrast, cells treated with increasing doses of MG until they reach confluence showed significant YAP cellular accumulation. Zoomed pictures are shown where indicated. Magnification 630x. Data are representative of three independent experiments. (B) Quantification of panel A experiment reports the intensity of YAP staining that colocalized with DAPI staining as described in 'Materials and methods' section. Nuclear YAP IF staining intensity shows a significant dose-dependent increase in presence of MG. Data were analyzed using one-way ANOVA followed by Dunnett post-test and shown as the mean values ± SEM of three independent experiments. (C) YAP, P-YAP (S127 and S381) and TAZ expression in MDA-MB-231 cells treated with MG (300 µM) until they reached confluence using western blot. Immunoblot data were quantified by densitometric analysis and normalized for β-actin. Numbers represent fold increase relative to the condition shown with bold number. (D) MDA-MB-231 cells cultured until they reached high density and treated concomitantly with MG (300 µM) and carnosine (10 mM), a MG scavenger, impeded cellular accumulation of YAP. Magnification 630x. Data are representative of three independent experiments. (E) Quantification of panel D experiment. Data were analyzed using one-way ANOVA followed by Bonferroni post-test and are shown as the mean values ± SEM of three independent experiments. *p<0.05, **p<0.01, ***p<0.001 and ns = not significant.
Figure 2—figure supplement 1
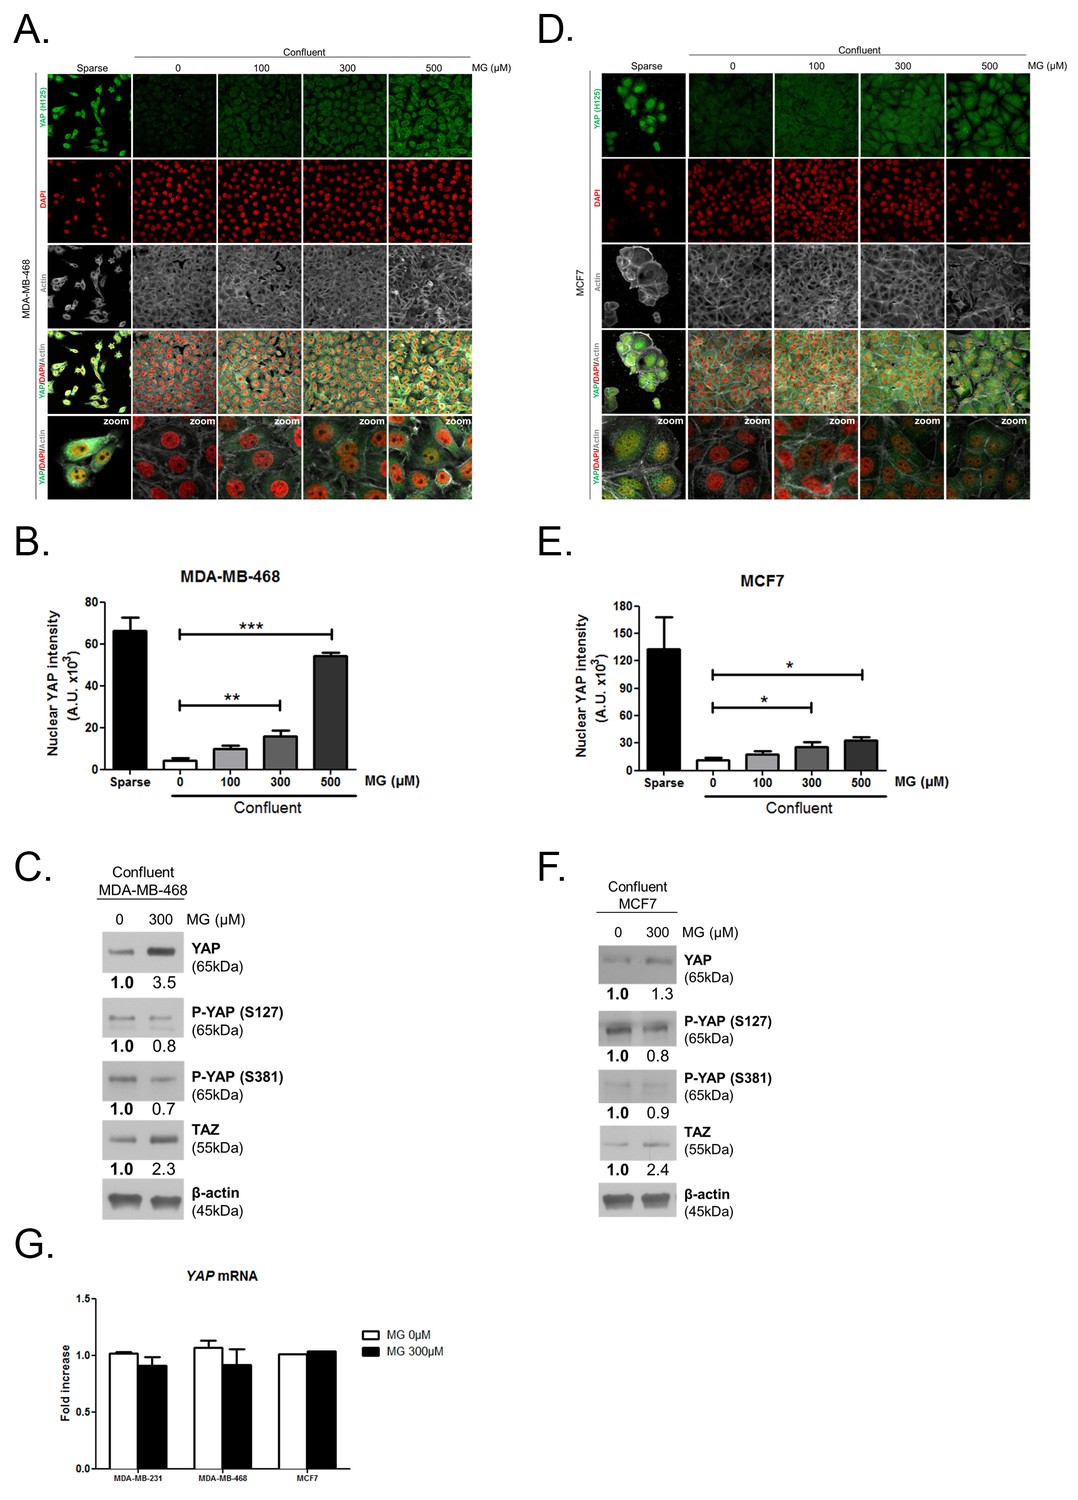
Methylglyoxal induces YAP accumulation in confluent breast cancer cells.
(A and D) Immunofluorescence staining shows that YAP (Santa Cruz antibody, H125) is mainly localized in the nucleus at low cellular density (Sparse) and is weakly detectable at high cellular density (Confluent) in MDA-MB-468 and MCF7 cells. In contrast, cells treated with increasing doses of MG until they reach confluence showed YAP cellular accumulation. Magnification 630x. Zoomed pictures are shown where indicated. Data are representative of three independent experiments. (B and E) Quantification of panel A and C experiments reports the intensity of YAP staining that colocalized with DAPI staining as described in 'Materials and methods' section. Nuclear YAP IF staining intensity shows a significant dose-dependent increase in presence of MG. Data were analyzed using one-way ANOVA followed by Dunnett post-test and shown as the mean values ± SEM of three independent experiments. (C and F) YAP, P-YAP (S127 and S381) and TAZ expression in MDA-MB-468 and MCF7 cells treated with MG (300 µM) until they reach confluence using western blot. Immunoblot data were quantified by densotimetric analysis and normalized for β-actin. Data are representative of three independent experiments. (G) qRT-PCR analysis of YAP gene in the indicated breast cancer cells treated with MG. Data were analyzed using unpaired student’s t test for each cell line and shown as the mean values ± SEM of three independent experiments. *p<0.05, **p<0.01 and ***p<0.001.
Figure 2—figure supplement 2
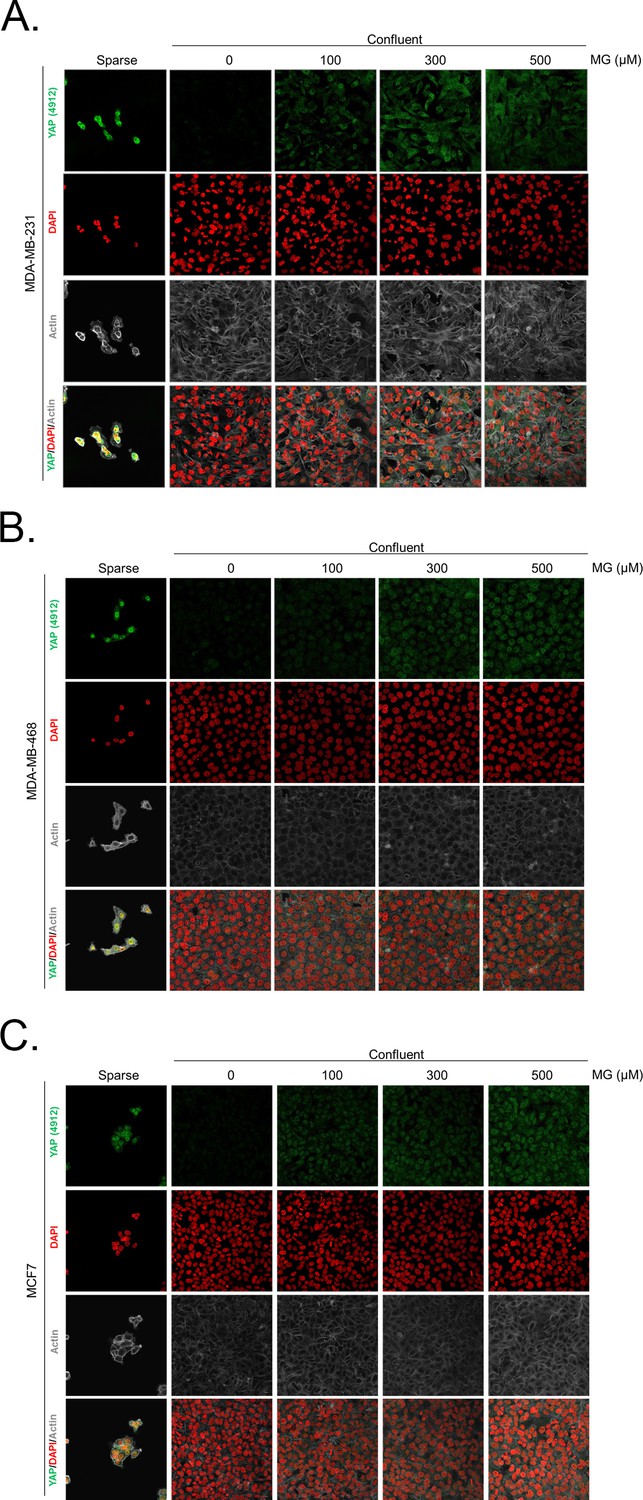
Methylglyoxal induces YAP accumulation in confluent breast cancer cells.
(A, B and C) Immunofluorescence (IF) staining shows that YAP (Cell Signaling antibody, 4912) is mainly localized in the nucleus at low cellular density (Sparse) and is weakly detectable at high cellular density (Confluent) in MDA-MB-231, MDA-MB-468 and MCF7 cells. In contrast, cells treated with increasing doses of MG until they reach confluence showed significant YAP cellular accumulation. Magnification 630x. Data are representative of three independent experiments.
Figure 2—figure supplement 3
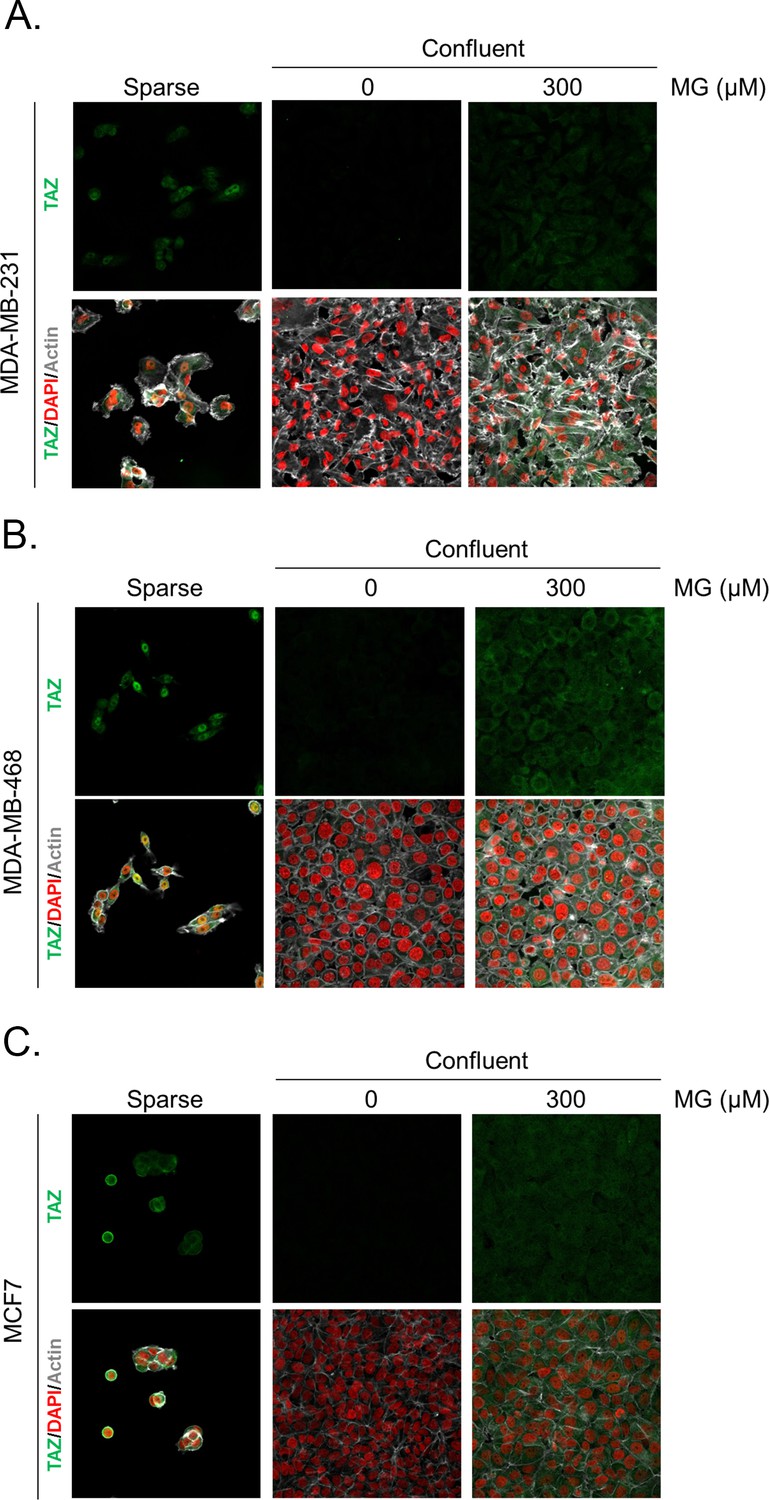
Methylglyoxal induces TAZ accumulation in confluent breast cancer cells.
(A, B, and C) Immunofluorescence (IF) staining shows that TAZ is mainly localized in the nucleus at low cellular density (Sparse) and is weakly detectable at high cellular density (Confluent) in MDA-MB-231, MDA-MB-468 and MCF7 cells. In contrast, cells treated with increasing doses of MG until they reached confluence showed significant TAZ cellular accumulation. Magnification 630x. Data are representative of two independent experiments.
Figure 3 with 4 supplements
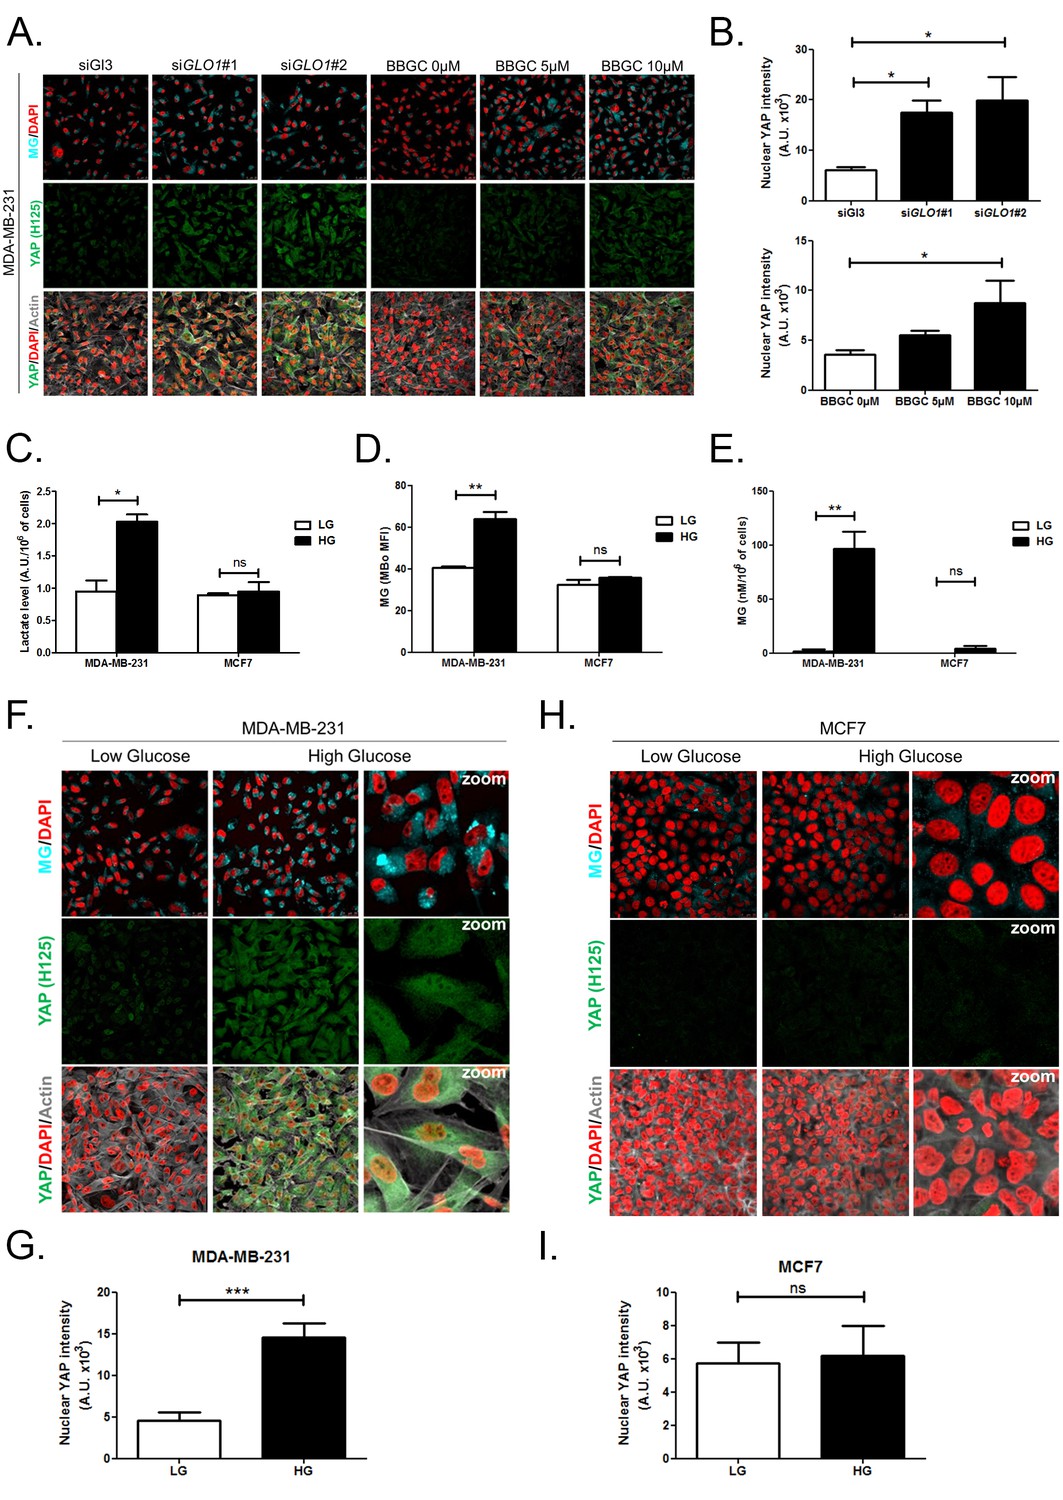
High endogenous MG induces YAP nuclear accumulation in breast cancer cells.
(A) Detection of MG was performed using MBo specific fluorescent probe, as described in Materials and Methods section, and showed MG cellular increase in MDA-MB-231 cells that were GLO1-depleted using siRNAs (siGLO1#1 and #2) or treated with BBGC Glo1 activity inhibitor. Upon GLO1 silencing/inhibition, MDA-MB-231 cells displayed more YAP (Santa Cruz antibody, H125) than control cells (siGl3 and BBGC 0 µM, respectively). Magnification 630x. Data are representative of three independent experiments. (B) Quantification of panel A experiment reports the intensity of YAP staining that colocalized with DAPI staining as described in Materials and Methods section for GLO1 silencing and BBGC conditions. Data were analyzed using one-way ANOVA followed by Dunnett post-test and shown as the mean values ± SEM of three independent experiments. (C) Lactate level measured using 1H-NMR increased in highly glycolytic MDA-MB-231 cells cultured in high glucose (HG) compared to low glucose (LG) while MCF7 low glycolytic cells did not. (D and E) MG quantification using both FACS MBo mean fluorescence intensity (MFI) and LC-MS/MS analysis on conditioned medium in the indicated conditions as described under 'Materials and methods' section. MDA-MB-231 cells significantly increased their MG production in HG when compared to MCF7. (F and H) MG detection and YAP immunofluorescence staining (Santa Cruz antibody, H125) in the indicated breast cancer cell line cultured in low- and high-glucose medium. Magnification 630x. Zoomed pictures are shown for high-glucose condition. Data are representative of three independent experiments. (G and I) Quantification of F and H panels, respectively. Data shown in C, D, E, G, and I. were analyzed using unpaired Student’s t test for each cell line independently and shown as the mean values ± SEM of three independent experiments. *p<0.05, **p<0.01, ***p<0.001 and ns = not significant.
Figure 3—figure supplement 1
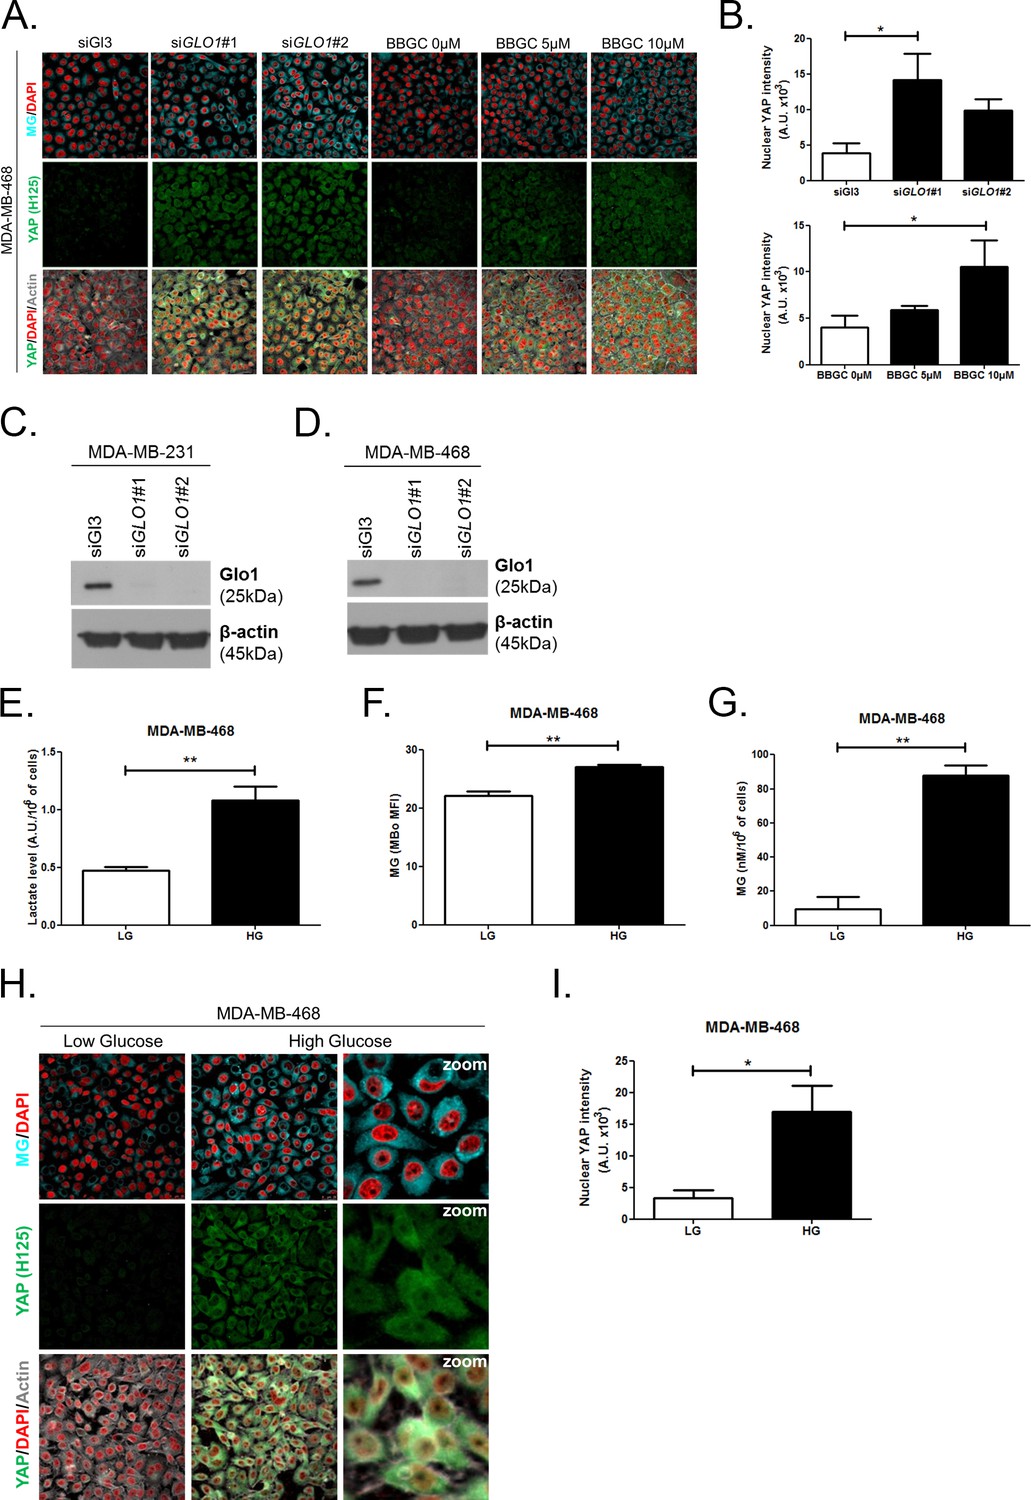
High endogenous MG induces YAP localization in breast cancer cells.
(A) Detection of MG was performed using MBo-specific fluorescent probe, as described in 'Materials and methods' section, and showed MG cellular increase in MDA-MB-468 cells that were GLO1-depleted using siRNAs (siGLO1#1 and #2) or treated with BBGC Glo1 activity inhibitor. Upon GLO1 silencing/inhibition, MDA-MB-468 cells displayed more YAP (Santa Cruz antibody, H125) than control cells (siGl3 and BBGC 0 µM, respectively). Magnification 630x. Data are representative of three independent experiments. (B) Quantification of panel A experiment reports the intensity of YAP staining that colocalized with DAPI staining as described in 'Materials and methods' section for GLO1 silencing and BBGC conditions. Data were analyzed using one-way ANOVA followed by Dunnett post-test and shown as the mean values ± SEM of three independent experiments. (C and D) Western blot validation of Glo1 silencing in MDA-MB-231 and MDA-MB-468 cells, respectively. Immunoblot data were normalized for β-actin and are representative of three independent experiments. (E) Lactate level measured using 1H-NMR increased in highly glycolytic MDA-MB-468 cells cultured in high glucose (HG) compared to low glucose (LG). (F and G) MG quantification using both FACS MBo mean fluorescence intensity (MFI) and LC-MS/MS analysis on conditioned medium in the indicated conditions as described under 'Materials and methods' section. MDA-MB-468 cells significantly increased their MG production when cultured in HG. Data in E, F, and G. were analyzed using unpaired student’s t test and shown as the mean values ± SEM of three independent experiments. (H) MG detection and YAP immunofluorescence staining (Santa Cruz antibody, H125) in MDA-MB-468 cells cultured in low- and high-glucose medium. Magnification 630x. Zoomed pictures are shown for high glucose condition. Data are representative of three independent experiments. (I) Quantification of panel H experiments. Data were analyzed using unpaired student’s t test with Welch’s correction and shown as the mean values ± SEM of three independent experiments. *p<0.05 and **p<0.01.
Figure 3—figure supplement 2
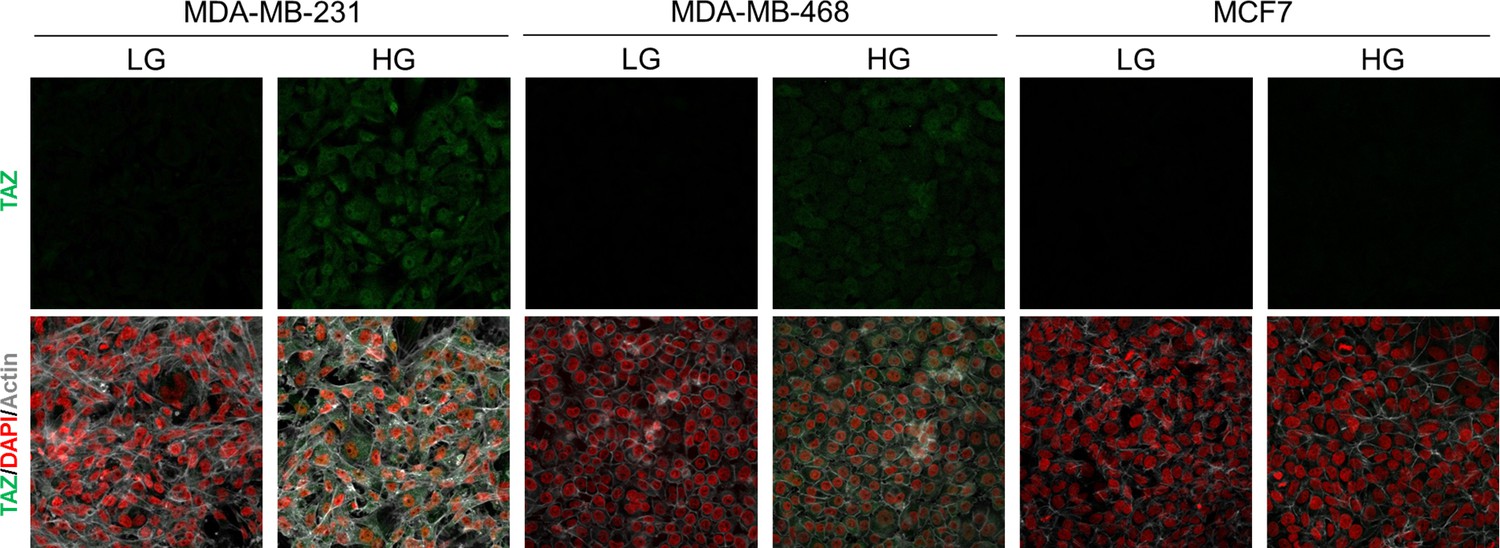
High endogenous MG induces TAZ localization in breast cancer cells.
TAZ immunofluorescence staining in the indicated breast cancer cell line cultured in low- and high-glucose medium. Magnification 630x. Data are representative of two independent experiments.
Figure 3—figure supplement 3
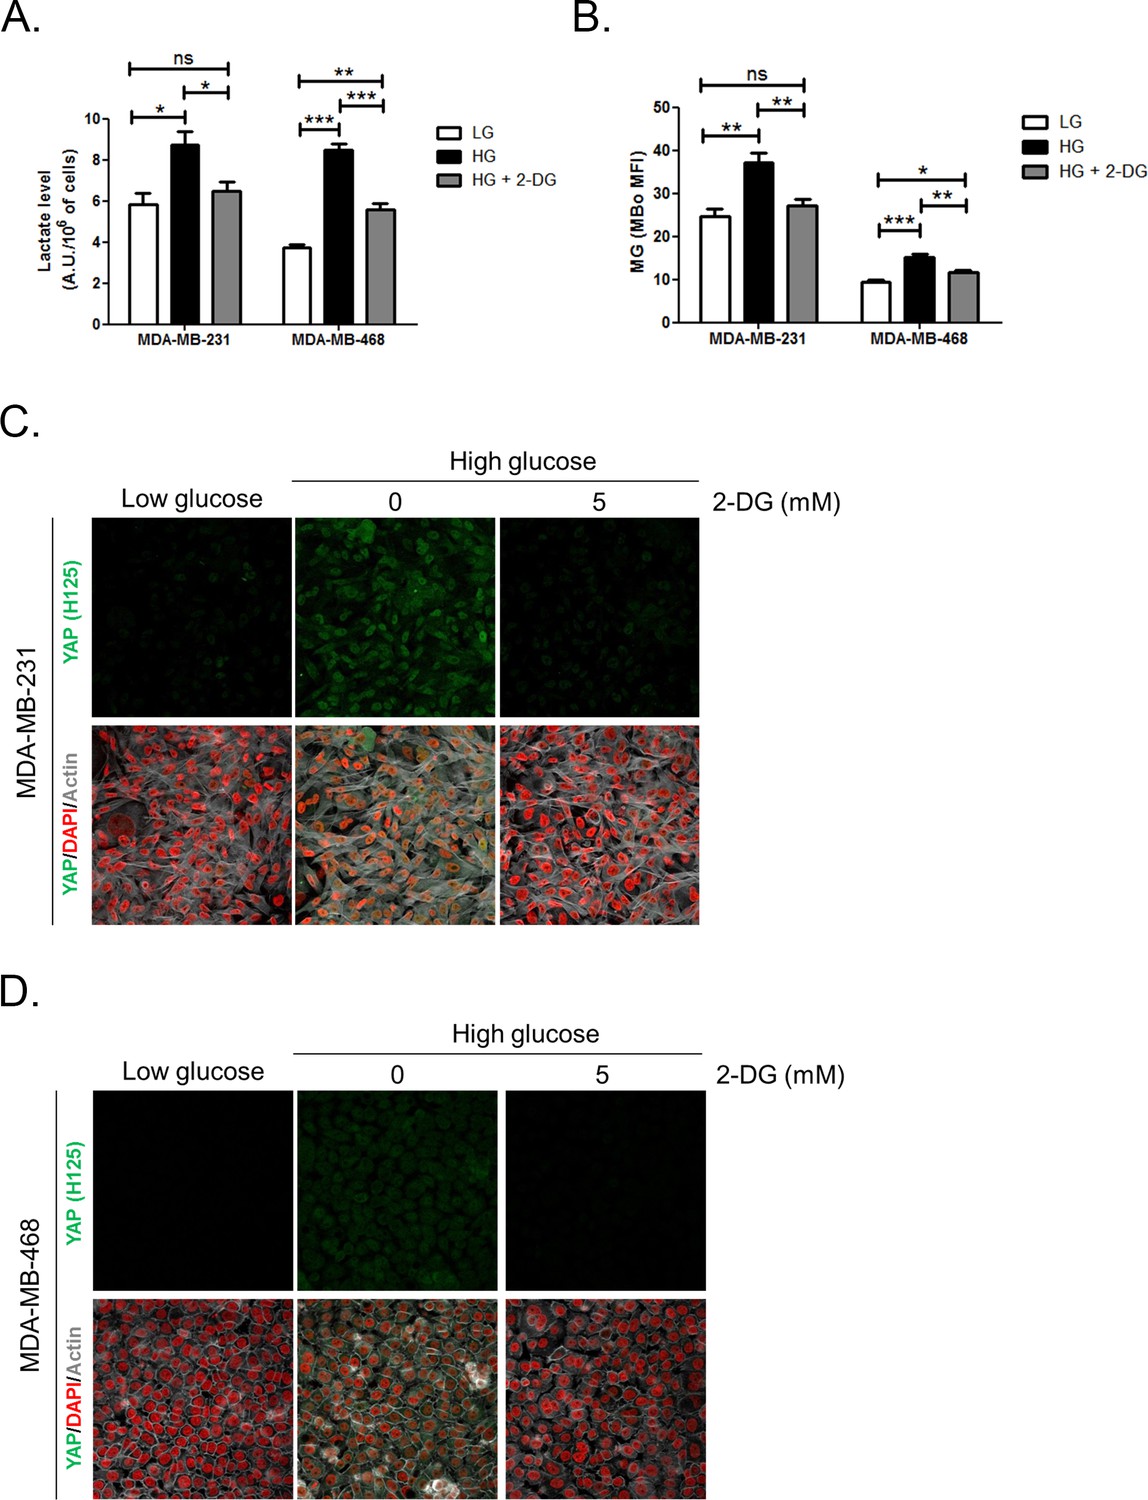
Inhibition of glycolysis by treatment with 2-Deoxyglucose (2-DG) reverses YAP accumulation in MDA-MB-231 and MDA-MB-468 cells cultured in high-glucose medium.
(A and B) 2-DG (5 mM, 48 hr) significantly decreased lactate level measured using 1H-NMR and MG production quantified using FACS MBo mean fluorescence intensity (MFI) in highly glycolytic MDA-MB-231 and MDA-MB-468 cells cultured in high glucose (HG). Low-glucose (LG) cultured cells were used as control. Data were analyzed using one-way ANOVA followed by Newman-Keuls post-test and shown as the mean values ± SEM of three independent experiments. *p<0.05, **p<0.01, ***p<0.001 and ns=not significant. (C and D) MDA-MB-231 and MDA-MB-468 cells cultured in high-glucose condition until they reached high density and treated with 2-DG 5 mM during the last 48 hr impeded cellular accumulation of YAP. Magnification 630x. Data are representative of two independent experiments.
Figure 3—figure supplement 4
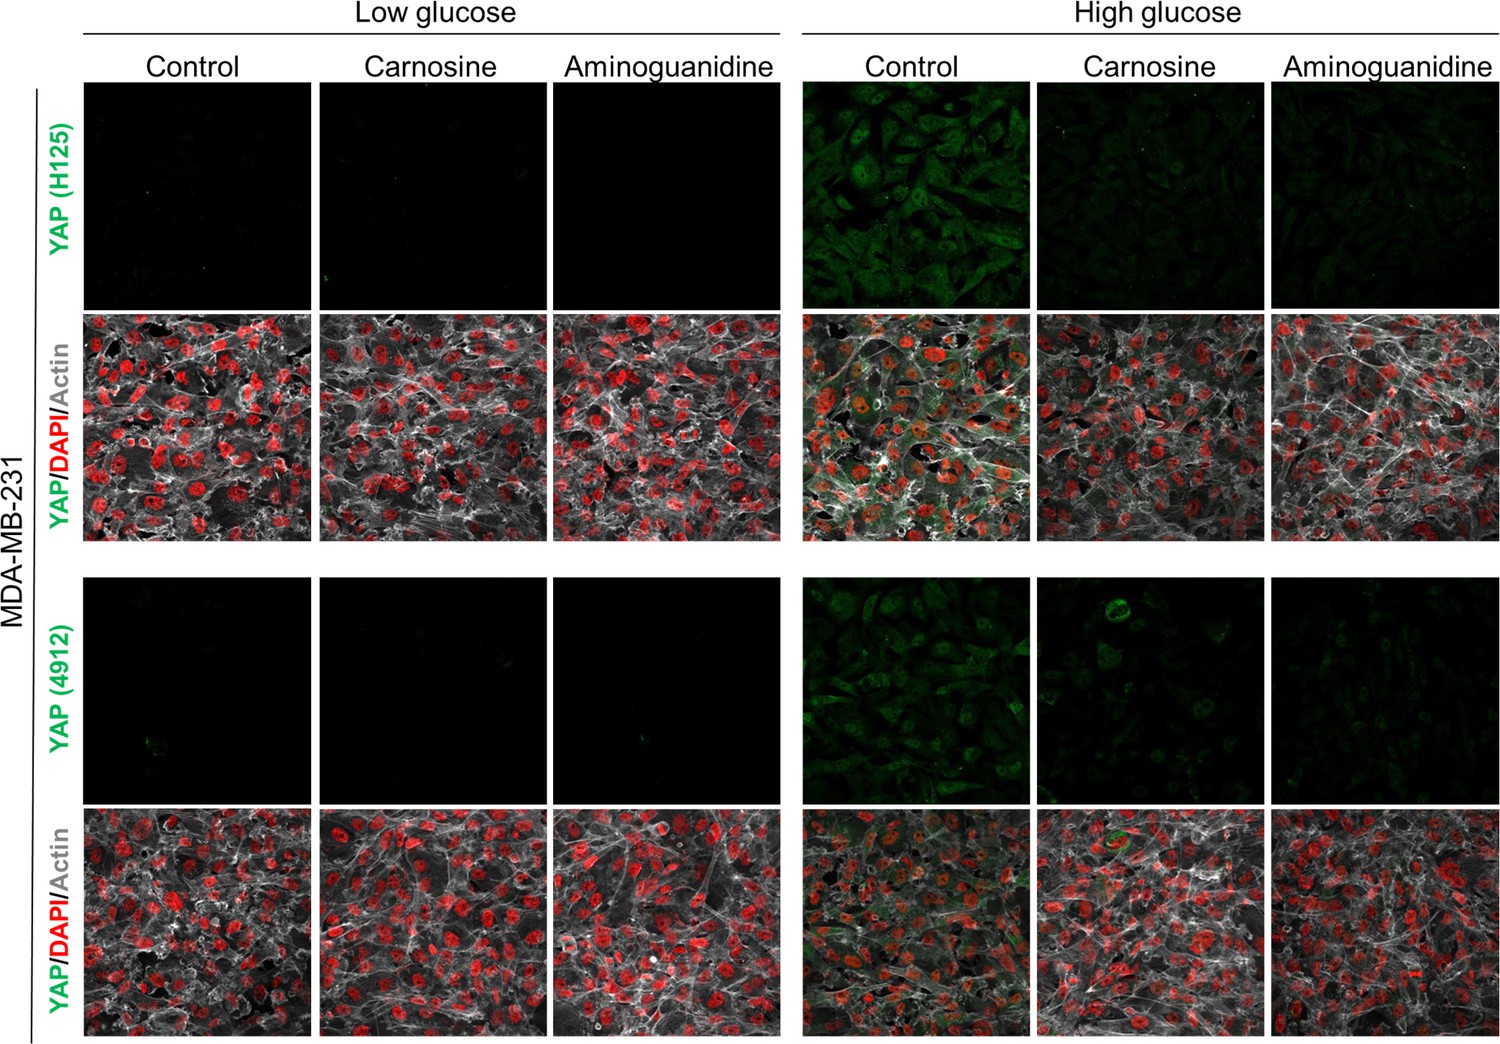
Carnosine and aminoguanidine MG scavengers reverse YAP accumulation in MDA-MB-231 cells cultured in high-glucose medium.
MDA-MB-231 cells cultured in high-glucose condition until they reached high density and treated with carnosine (10 mM) or aminoguanidine (10 mM) impeded cellular accumulation of YAP. Magnification 630x. Data are representative of two independent experiments.
Figure 4 with 1 supplement
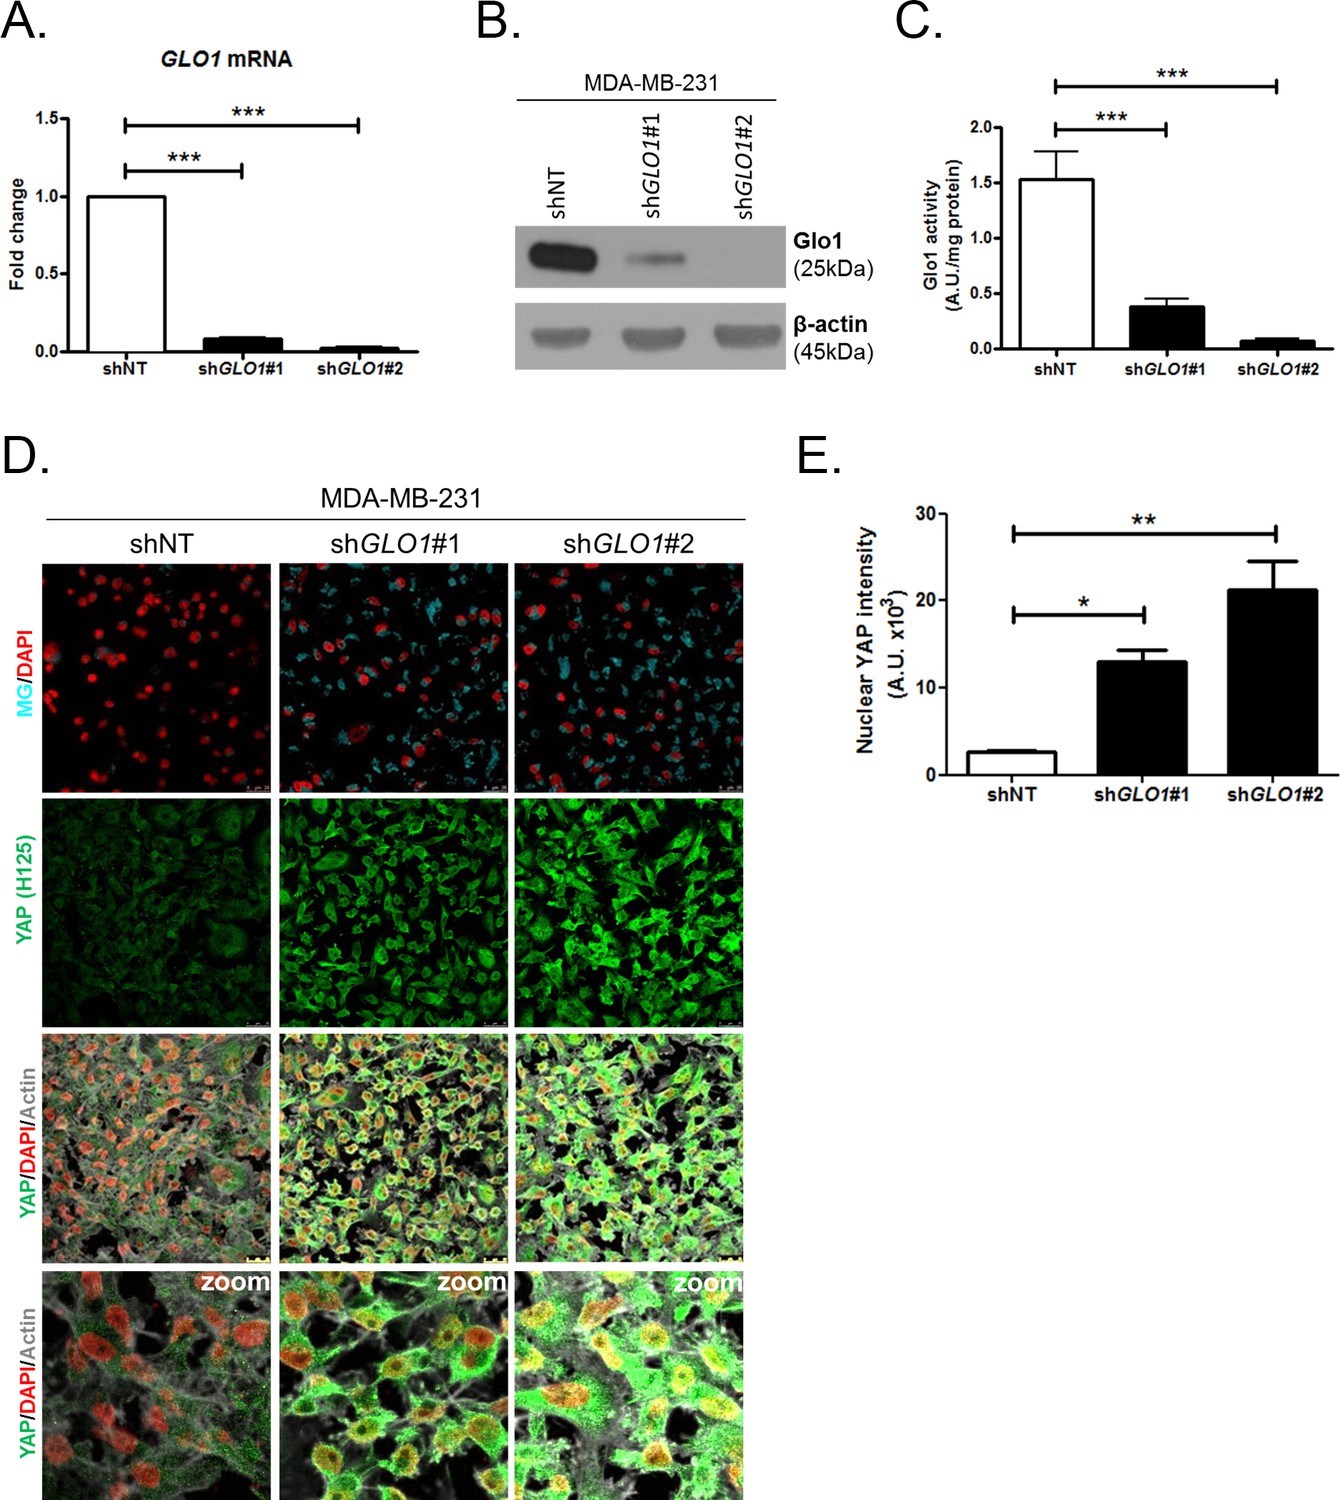
YAP cellular accumulation in shGLO1 MDA-MB-231 clones.
(A) GLO1 mRNA, (B) protein and (C) activity level in MDA-MB-231 shNT control and shGLO1#1 and #2. (D) YAP immunofluorescence (Santa Cruz antibody, H125) in MDA-MB-231 silenced for GLO1 (shGLO1#1 and #2) cultured from low to high density. Detection of MG was performed using MBo-specific fluorescent probe. Data are representative of three independent experiments. Magnification 630x. Zoomed pictures are shown when indicated. (E) Quantification of nuclear YAP corresponding to D experiment. All data were analyzed using one-way ANOVA followed by Dunnett post-test and shown as the mean values ± SEM of at least three independent experiments. *p<0.05, **p<0.01 and ***p<0.001.
Figure 4—figure supplement 1
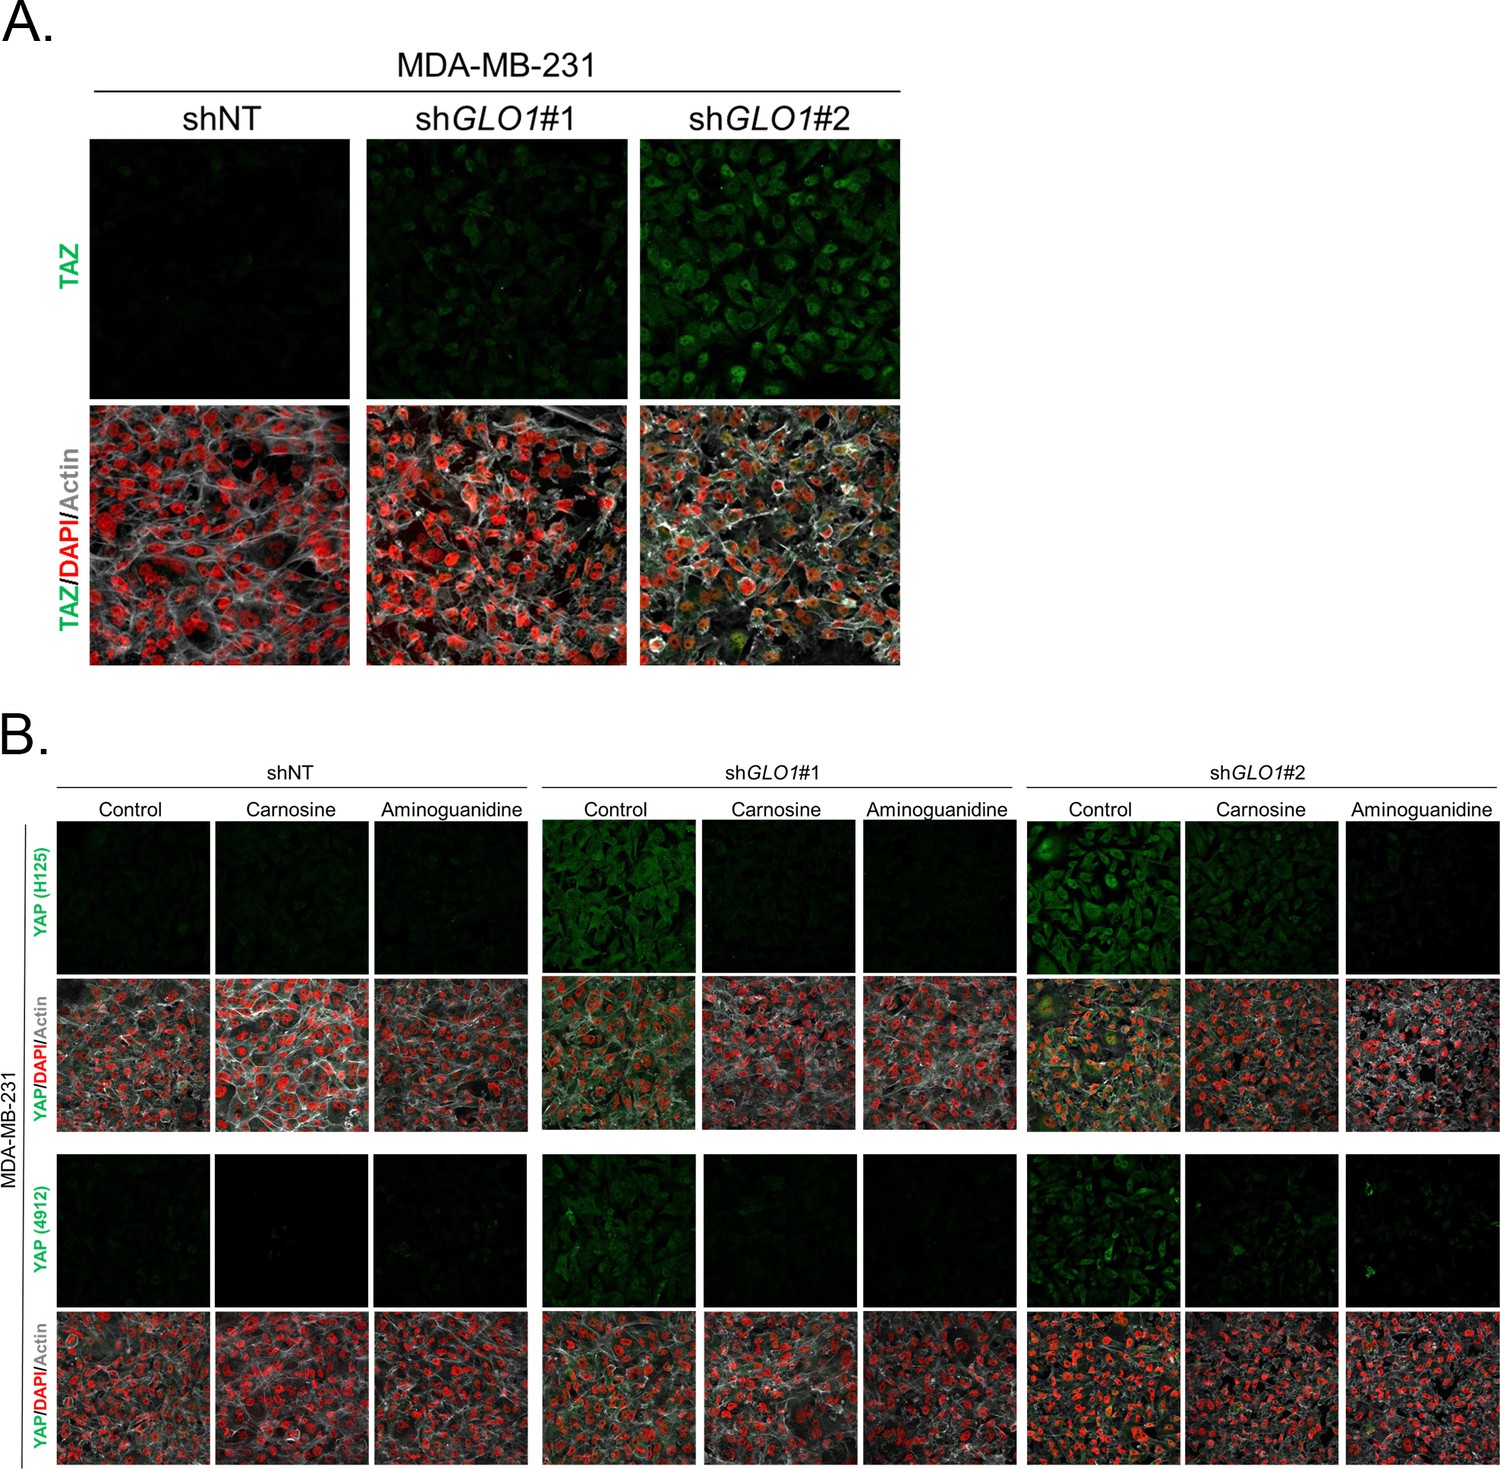
Carnosine and aminoguanidine MG scavengers reverse YAP accumulation in GLO1-depleted MDA-MB-231.
(A) TAZ immunofluorescence staining in GLO1 depleted MDA-MB-231 cells. Magnification 630x. Data are representative of two independent experiments. (B) MDA-MB-231 silenced for GLO1 (shGLO1#1 and #2) cells cultured until they reached high density and treated with carnosine (10 mM) or aminoguanidine (10 mM) impeded cellular accumulation of YAP. Magnification 630x. Data are representative of two independent experiments.
Figure 5 with 3 supplements
MG induces YAP co-transcriptional activity in breast cancer cells.
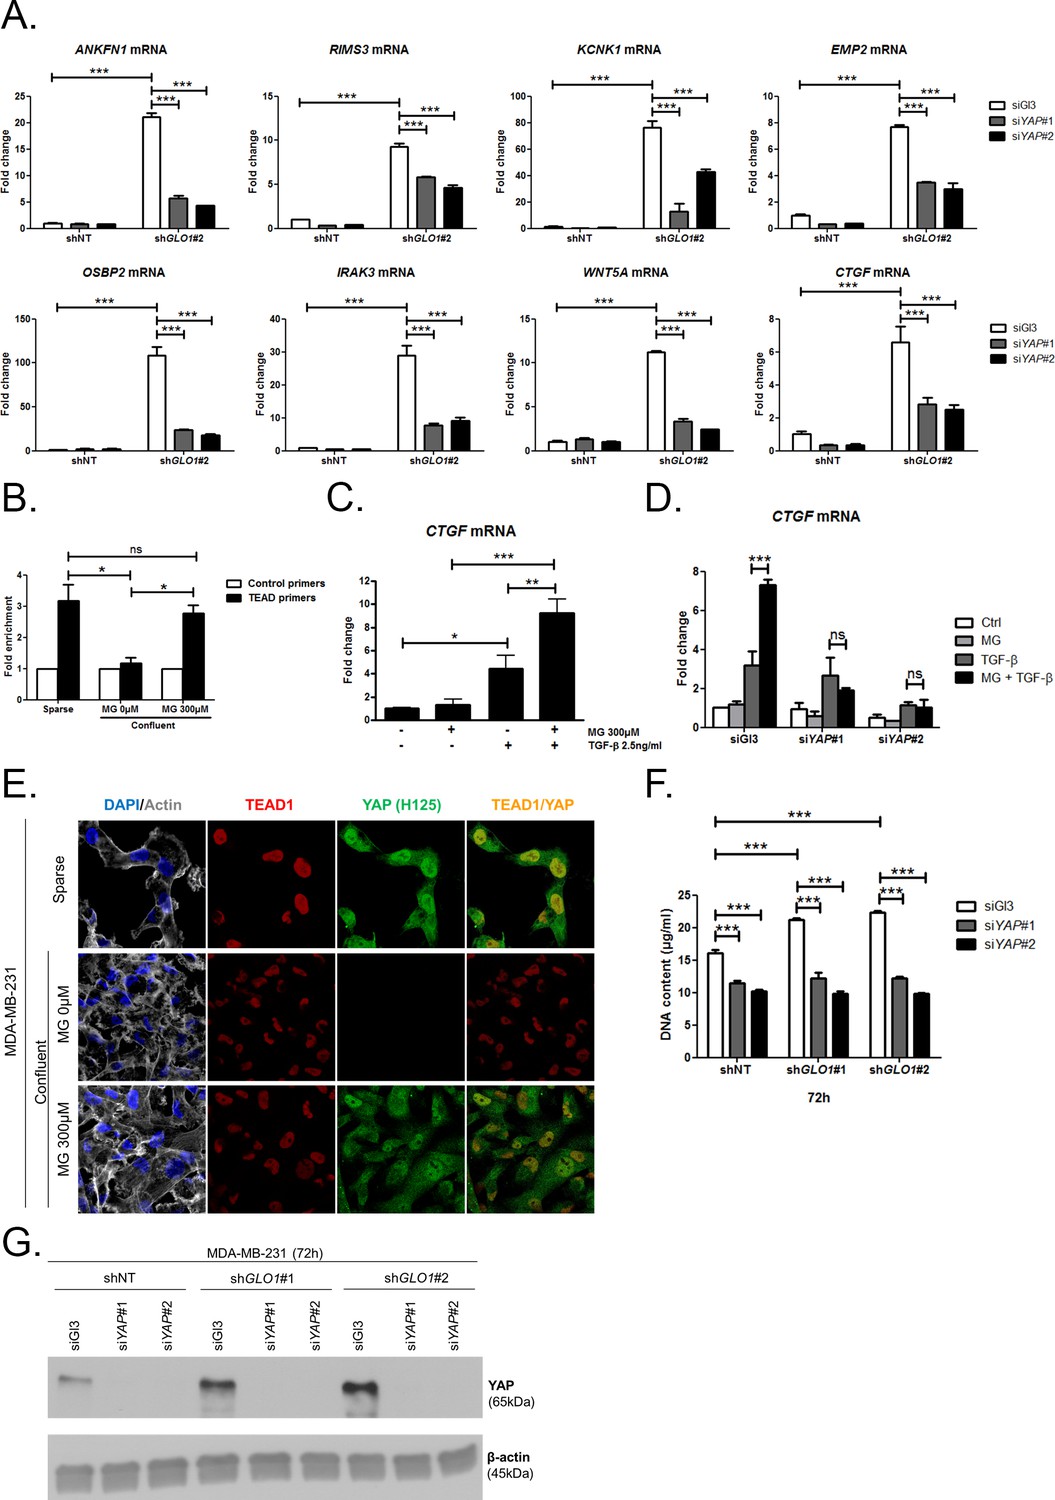
(A) Stable knockdown of GLO1 (shGLO1#2) in MDA-MB-231 results in upregulation of several YAP target genes (ANKFN1, RIMS3, KCNK1, EMP2, OSBP2, IRAK3, WTN5A and CTGF) at the mRNA level as assessed by qRT-PCR. Silencing of YAP using two independent siRNAs (siYAP#1 and #2, 48 hr post-transfection) significantly reversed YAP target genes induction in GLO1 depleted cells. Data were analyzed using two-way ANOVA followed by Bonferroni post-test and shown as the mean values ± SD of one representative experiment (n = 4). (B) Chromatin immunoprecipitation of YAP at the CTGF promoter in sparse and confluent MDA-MB-231 cells treated or not with MG. TEAD PCR primers, and not control primers, target TEAD binding site on CTGF promoter (see sequences under 'Materials and methods' section). The use of TEAD primers indicated that YAP was present at the CTGF promoter in sparse cells (positive control) and in confluent MG-treated cells when compared to untreated confluent cells. Data were analyzed using one-way ANOVA followed by Newman-Keuls post-test and shown as the mean values ± SEM of three independent experiments. (C) CTGF mRNA level assessed by qRT-PCR in MDA-MB-231 cells treated with MG 300 µM until confluence and then with TGFβ 2.5 ng/ml during 2 hr. Data were analyzed using two-way ANOVA followed by Bonferroni post-test and shown as the mean values ± SEM of five independent experiments. (D) MG-mediated CTGF induction in presence of TGFβ is not observed upon YAP silencing (siYAP#1 and #2) when compared to control (siGl3) cells. Data were analyzed using two-way ANOVA followed by Bonferroni post-test and shown as the mean values ± SEM of three independent experiments. (E) YAP (Santa Cruz antibody, H125) and TEAD1 IF co-localization in MDA-MB-231 cells cultured under low (Sparse) density used as positive control and in high-density cultured cells (Confluent) in presence of MG. Magnification 630x. Data are representative of three independent experiments. (F) DNA quantification assay showing an increased proliferation of GLO1-silenced MDA-MB-231 (shGLO1#1 and #2) compared to control (shNT) at 72 hr. Silencing of YAP (siYAP#1 and #2) reversed this effect. Data were analyzed using two-way ANOVA followed by Bonferroni post-test and shown as the mean values ± SEM of four independent experiments. (G) Validation of YAP silencing by Western blot in MDA-MB-231 shGLO1 cells after 72 hr related to panel F and Figure 5—figure supplement 2F. *p<0.05, **p<0.01, ***p<0.001 and ns = not significant.
Figure 5—figure supplement 1
Inverse correlation between GLO1 and YAP target genes expression.
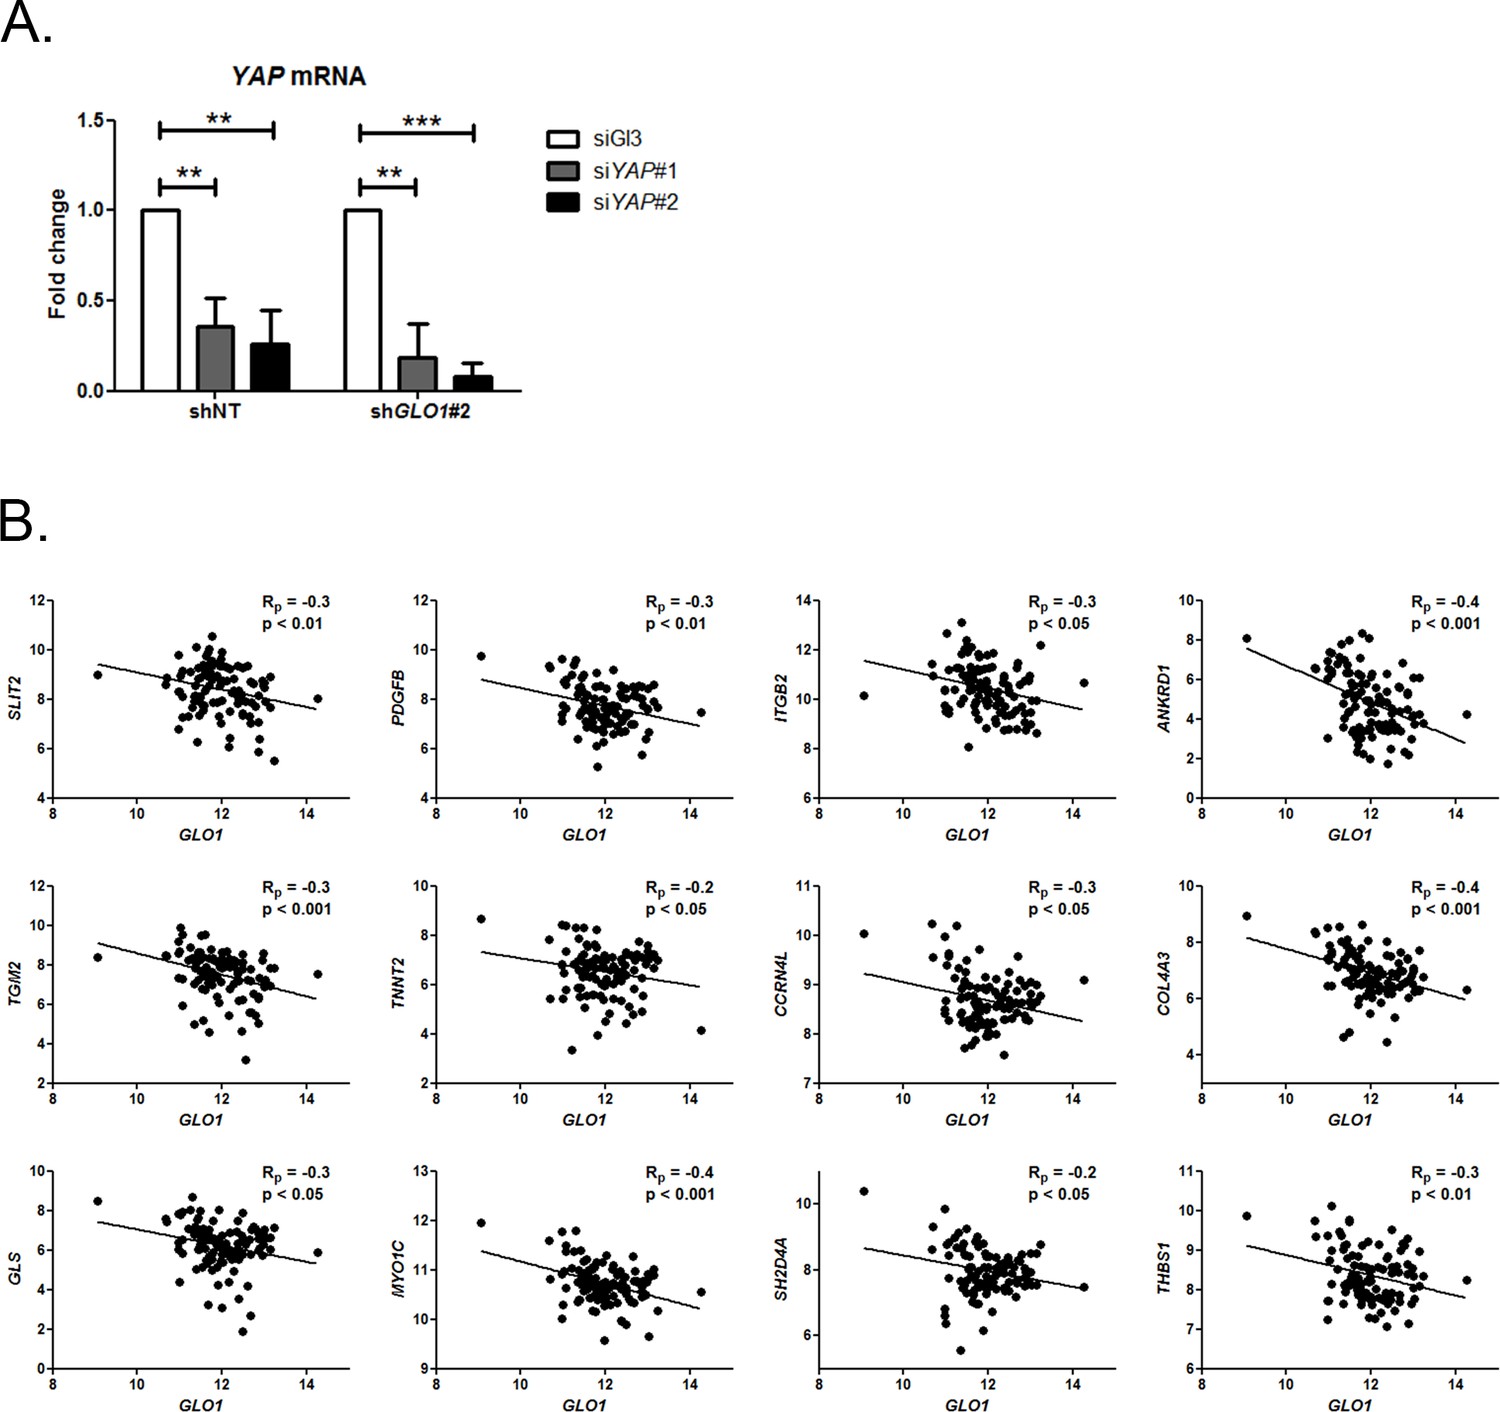
(A) Validation of YAP silencing (siYAP#1 and #2) in shGLO1 MDA-MB-231 cells 48 hr post-transfection by qRT-PCR. Data were analyzed using two-way ANOVA followed by Bonferroni post-test and shown as the mean values ± SD of one representative experiment (n = 4). ** p<0.01 and *** p<0.001 (B) Inverse correlation between the expression of GLO1 and 12 representative YAP target genes in breast cancer patients (n = 103). Rp: Pearson correlation coefficient.
Figure 5—figure supplement 2
MG induces YAP co-transcriptional activity in breast cancer cells.
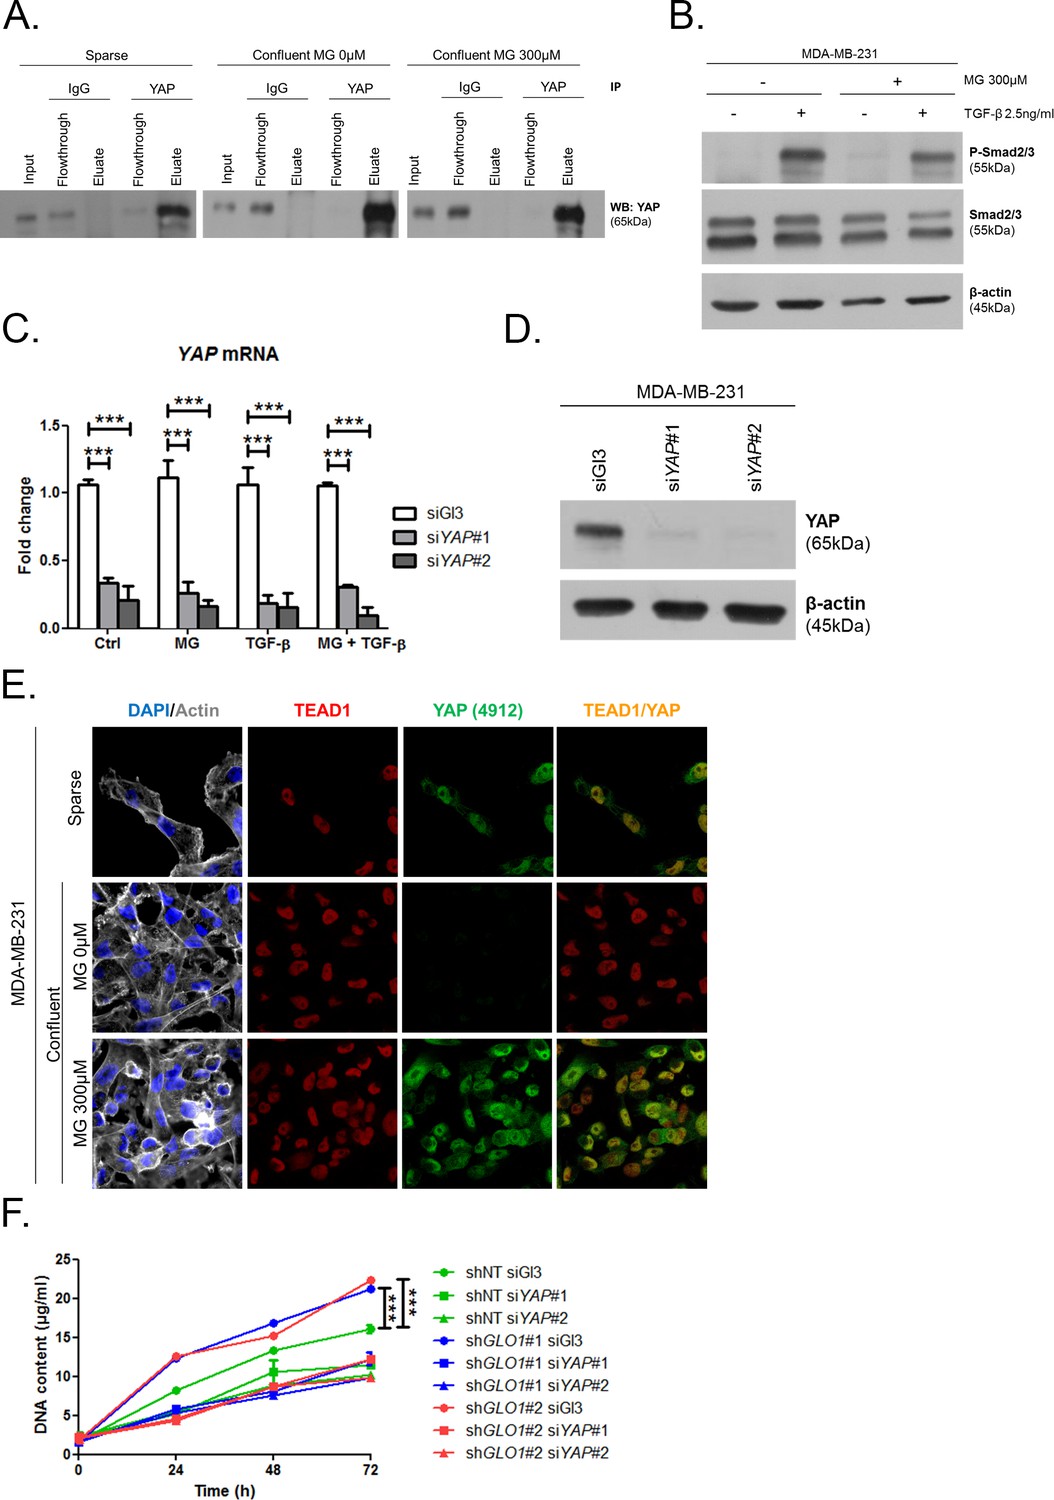
(A) Western blot detection of YAP in MDA-MB-231 cells under the indication conditions. Immunoblot is representative of three independent experiments. (B) Western blot of Phospho-Smad2/3 and Smad2/3 in MDA-MB-231 treated with MG until confluence and then with TGF-β during 2 hr. β-actin is used for normalization. (C and D) YAP mRNA and protein level assessed by qRT-PCR and Western blot, respectively, in MDA-MB-231 cells silenced for YAP (siYAP#1 and #2) and treated in the same conditions as in Figure 5D. Data were analyzed using two-way ANOVA followed by Bonferroni post-test and shown as the mean values ± SEM of three independent experiments. (E) YAP (Cell Signaling, 4912) and TEAD1 IF co-localization in MDA-MB-231 cells cultured under low (Sparse) density used as positive control and in high-density cultured cells (Confluent) in presence of MG. Magnification 630x. Data are representative of two independent experiments. (F) Proliferation assay on GLO1-depleted MDA-MB-231 (shGLO1#1 and #2) silenced or not for YAP (siYAP#1 and #2) at different time points. Data (72 hr) were analyzed using two-way ANOVA followed by Bonferroni post-test and shown as the mean values ± SEM of three independent experiments. All immunoblots are representative of three independent experiments. ***p<0.001.
Figure 5—figure supplement 3
MG increases YAP-mediated migratory potential in breast cancer cells.
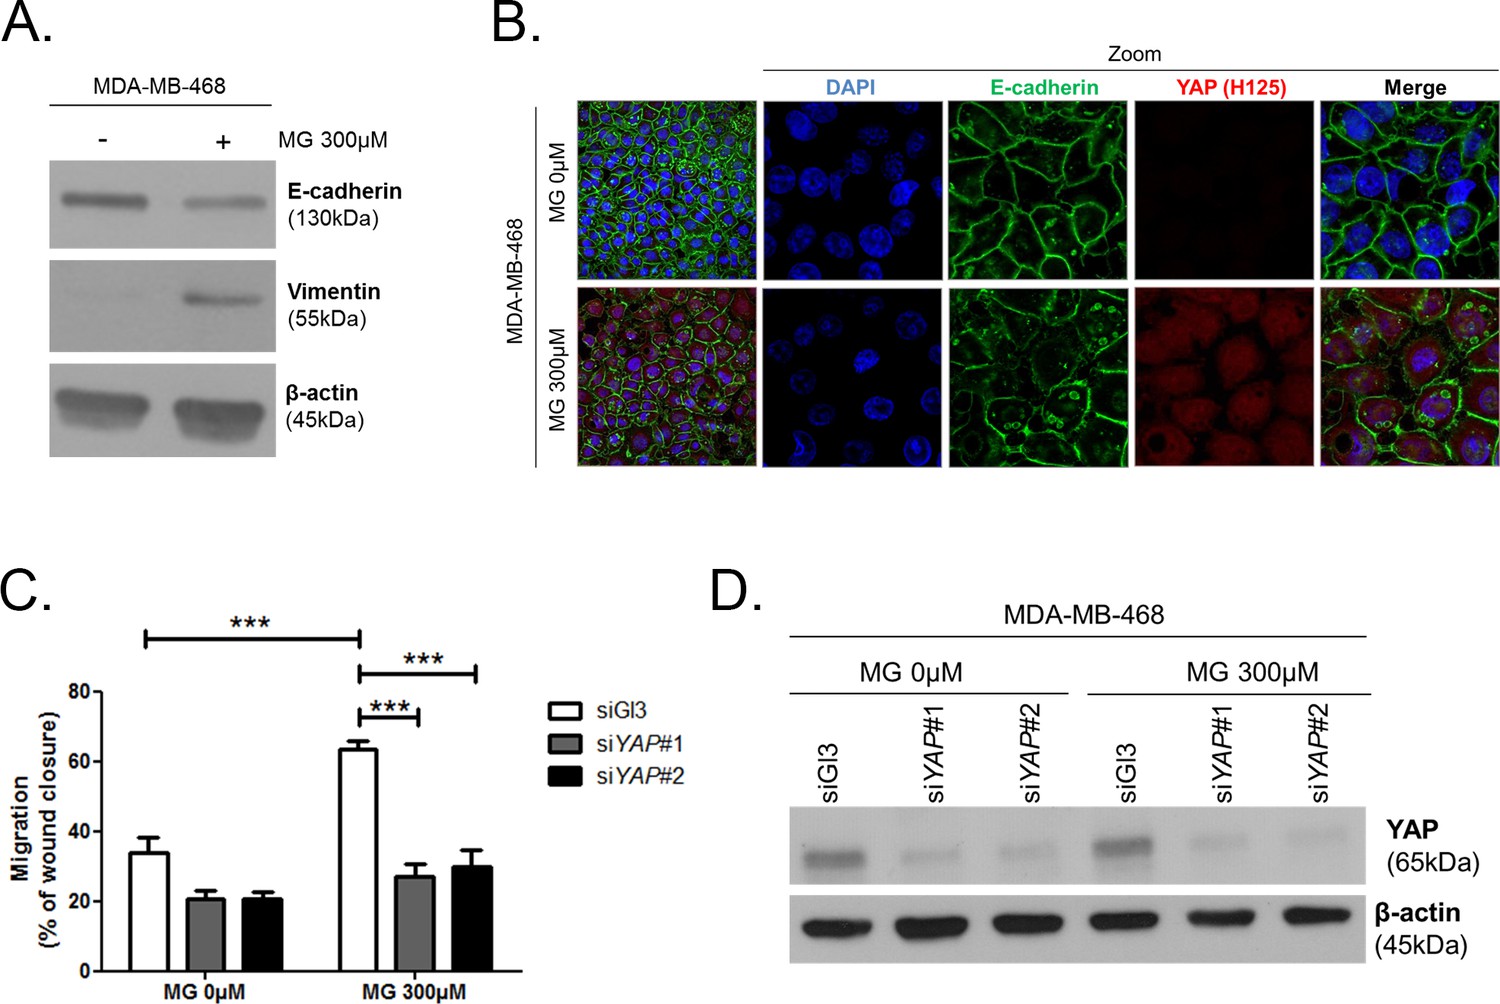
(A) E-cadherin and vimentin EMT markers are down-regulated and up-regulated, respectively, upon MG treatment in MDA-MB-468 breast cancer cells as shown by western blot. β-actin is used for normalization. (B) High-density MDA-MB-468 cells treated with MG demonstrated reduced and disrupted E-cadherin junctions using immunofluorescence. Magnification 630x. Zoomed pictures are shown where indicated. Data are representative of three independent experiments. (C) MDA-MB-468 cells treated with MG until confluence showed a higher migratory capacity compared to control cells as assessed by wound healing assay (16 hr) and not in YAP-silenced conditions. Data were analyzed using two-way ANOVA followed by Bonferroni post-test and shown as the mean values ± SEM of five independent experiments. (D) Validation of YAP silencing in MDA-MB-468 in the same conditions than panel C. ***p<0.001.
Figure 6 with 1 supplement
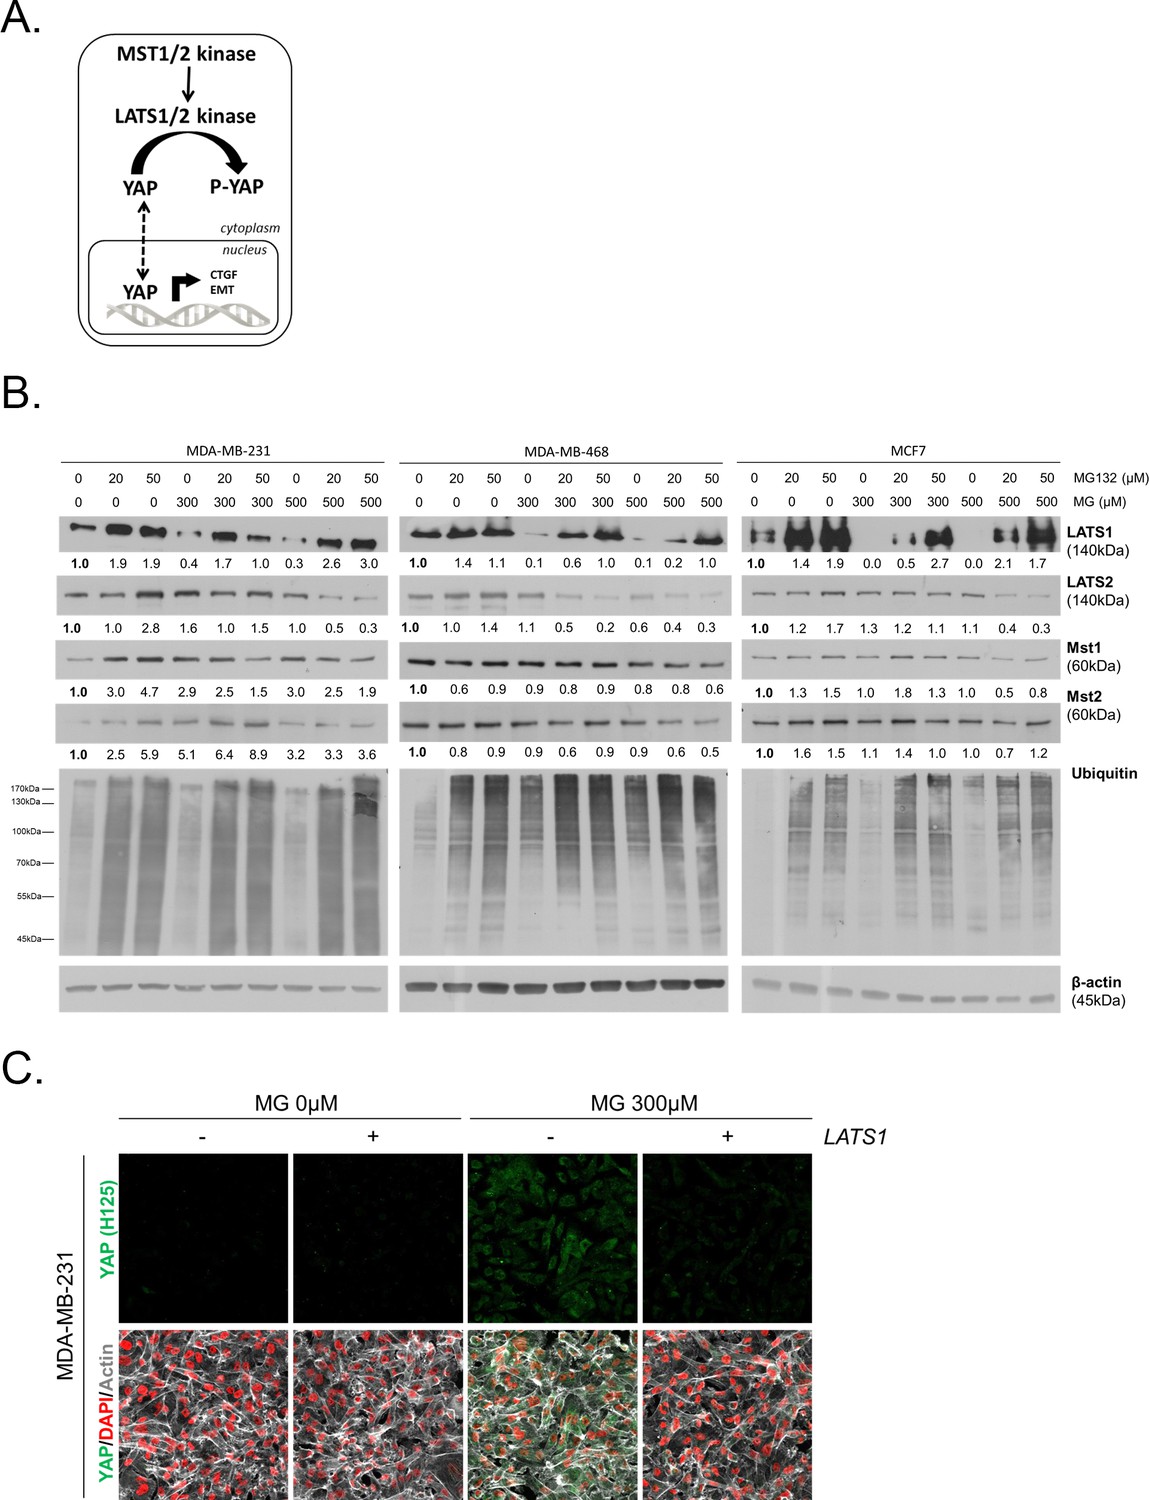
MG induces LATS1 kinase decrease in breast cancer cells.
(A) Schematic representation of the Hippo pathway focused on MST1/2 and LATS1/2 kinases control of nuclear-cytoplasmic shuttling of YAP co-transcription factor. (B) LATS1, LATS2, MST1 and MST2 expression in MDA-MB-231, MDA-MB468 and MCF7 cells treated with MG (300 and 500 µM) in presence of increasing concentrations of MG132 proteasome inhibitor during 6 hr using Western blot. Ubiquitin immunoblot were performed to validate proteasome inhibition by MG132. Immunoblot data were quantified by densitometric analysis and normalized for β-actin. Numbers represent fold increase relative to the condition shown with bold number. (C) YAP immunofluorescence (Santa Cruz antibody, H125) in MDA-MB-231 cells transiently transfected with LATS1 expression vector (+) or empty vector used as control (-) and then treated with MG (300 µM) until confluence. All data are representative of three independent experiments.
Figure 6—figure supplement 1
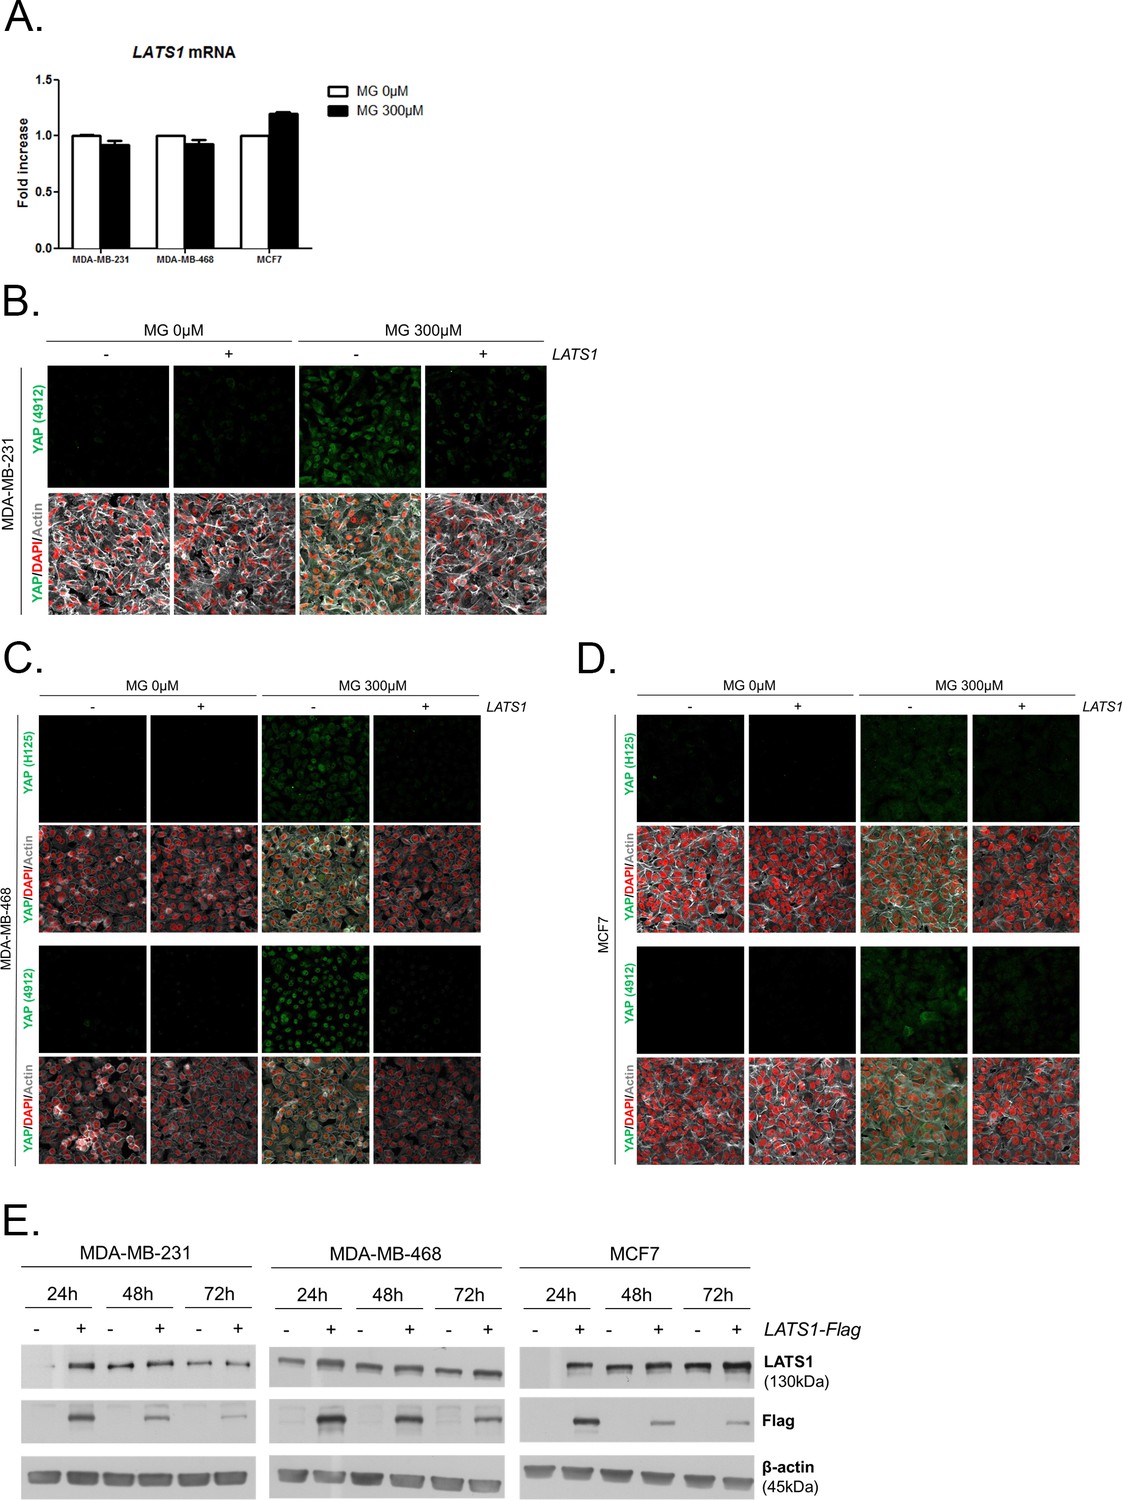
MG leads to YAP cellular accumulation through LATS1 expression decrease.
(A) MG treatment from low to high density did not affect LATS1 mRNA levels as assessed by qRT-PCR in the indicated cell lines. Data were analyzed using unpaired student’s t test and shown as the mean values ± SEM of three independent experiments. (B) YAP immunofluorescence (Cell Signaling antibody, 4912) in MDA-MB-231 cells transiently transfected with LATS1 (+) or empty vector (-) and then treated with MG (300 µM) until confluence. Magnification 630x. (C and D) YAP immunofluorescence detection (Santa Cruz antibody, H125 and Cell Signaling antibody, 4912) in MDA-MB-468 and MCF7 cells, respectively, transiently transfected with LATS1 (+) or empty vector (-) and then treated with MG (300 µM) until confluence. Magnification 630x. (E) Validation of LATS1 overexpression in breast cancer cells by western blot using LATS1 and Flag antibodies. β-actin is used for normalization. All data are representative of three independent experiments.
Figure 7 with 1 supplement
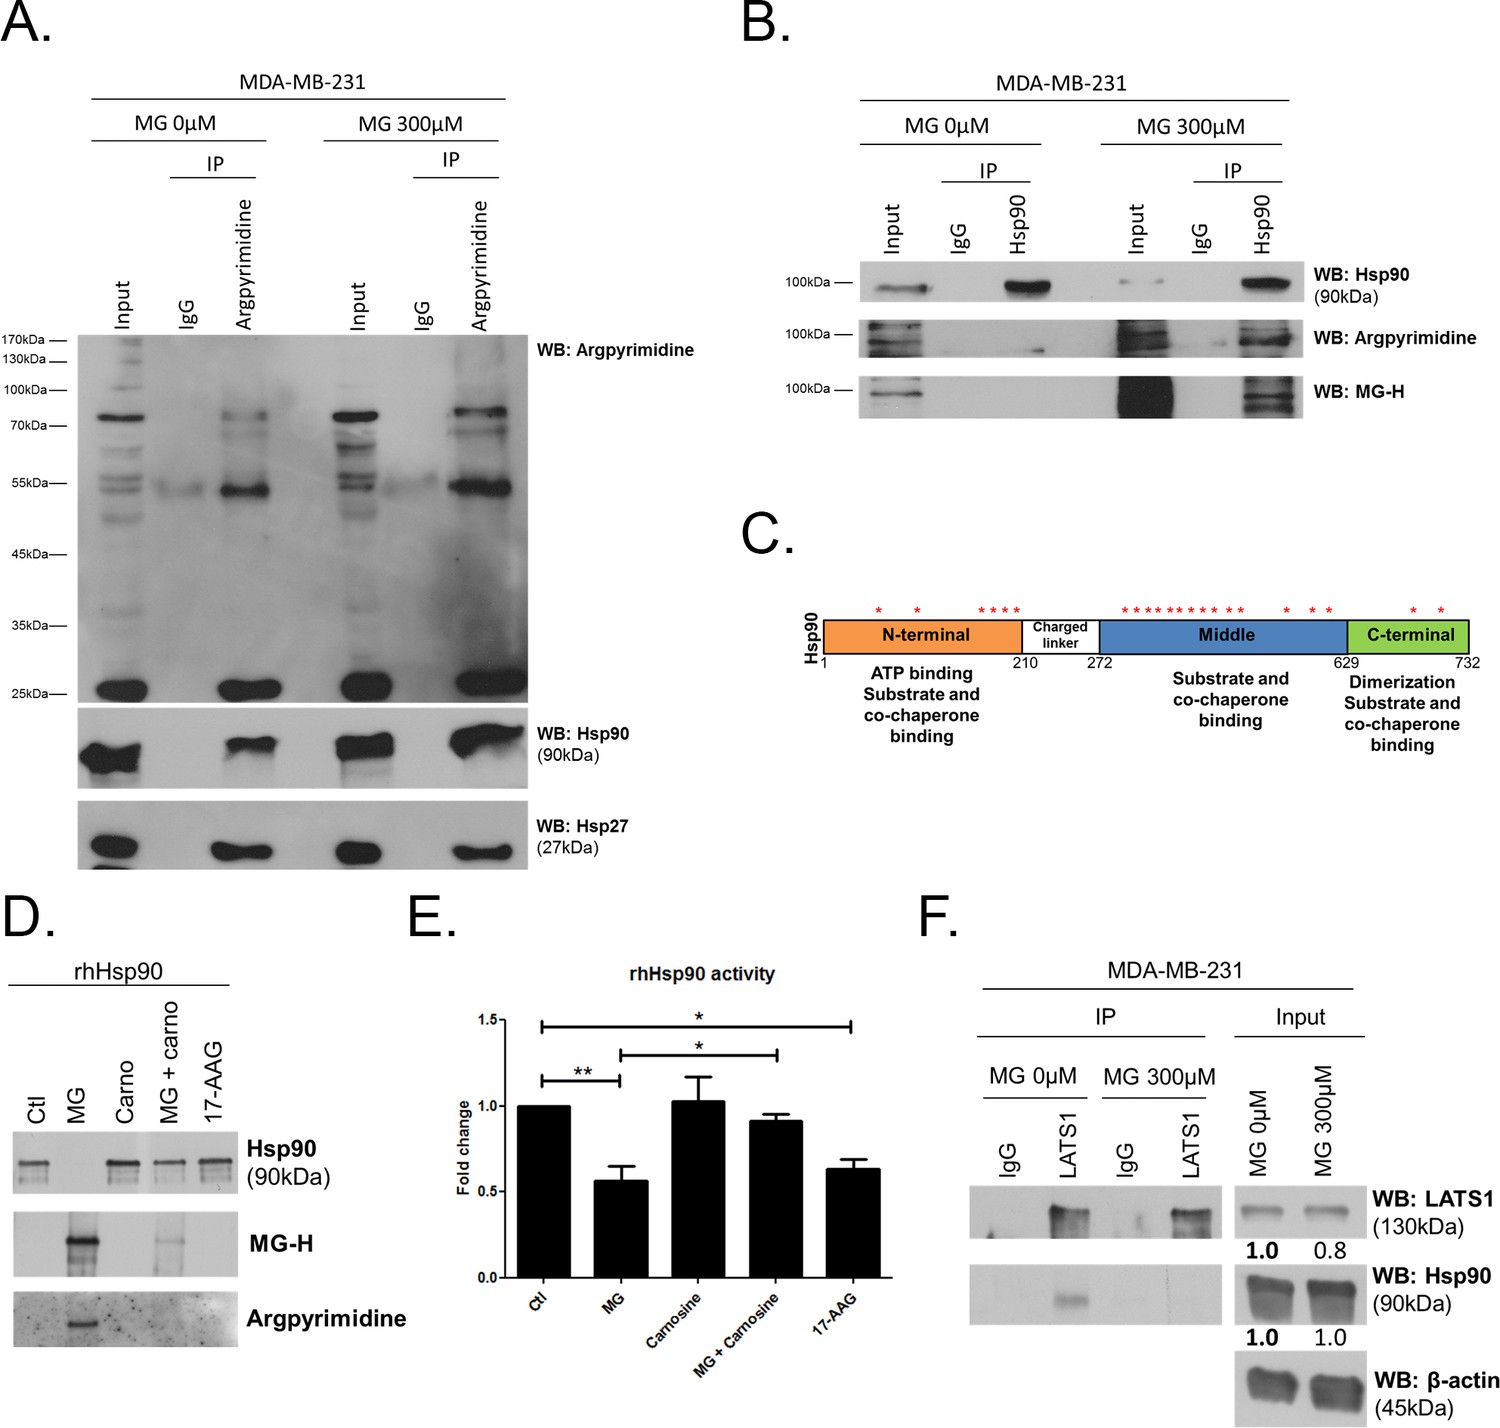
MG induces Hsp90 post-translational glycation in breast cancer cells.
(A) Immunoprecipitation of MG adducts on MG-treated MDA-MB-231 cells (300 µM, 6 hr) using a specific anti-argpyrimidine monoclonal antibody. Mouse immunoglobulins (IgG) were used as control. Total cell lysates (Input) and immunoprecipitates (IP) were immunoblotted for argpyrimidine, Hsp90 and Hsp27. (B) Under the same conditions as in A, MDA-MB-231 cell lysates were immunoprecipitated using anti-Hsp90. Inputs and IPs were immunoblotted using Hsp90 antibody and two specific antibodies directed against MG-adducts (argpyrimidine and hydroimidazolone MG-H). (C) Schematic representation of Hsp90 protein domains where hot spots (*) of endogenously and/or exogenously MG-modified residues are indicated. See also detailed amino acid sequence in Figure 7—figure supplement 1B. (D) Western blot analysis using the indicated antibodies on recombinant human Hsp90 (rhHsp90) incubated in presence of MG ± carnosine (10 mM) or 17-AAG Hsp90 inhibitor (1 µM) during 24 hr. (E) Hsp90 ATPase activity was decreased after incubation with MG or 17-AAG. This effect is efficiently blocked in presence of carnosine MG scavenger. Data were analyzed using two-way ANOVA followed by Bonferroni post-test and shown as the mean values ± SEM of five independent experiments. *p<0.05 and **p<0.01. (F) Co-immunoprecipitation of LATS1 and Hsp90 from MDA-MB-231 cells treated with MG 300 µM during 24 hr reveals a decreased interaction between the two proteins. Immunoblot data were quantified by densitometric analysis and normalized for β-actin. Numbers represent fold increase relative to the condition shown with bold number. All data are representative of three independent experiments.
-
Figure 7—source data 1
MG modifications on human recombinant Hsp90.
Peptides identified by mass spectrometry of MG-Hsp90 enzymatic digests. Modification sites are bolded and underlined. CEL: Carboxyethyllysine.
- https://doi.org/10.7554/eLife.19375.021
-
Figure 7—source data 2
MG modifications on endogenous Hsp90.
Peptides identified by mass spectrometry of argpyrimidine immunoprecipitate from MDA-MB-231 treated with MG (300 µM) during 6 hr. Modification sites are bolded and underlined.-
- https://doi.org/10.7554/eLife.19375.022
Figure 7—figure supplement 1
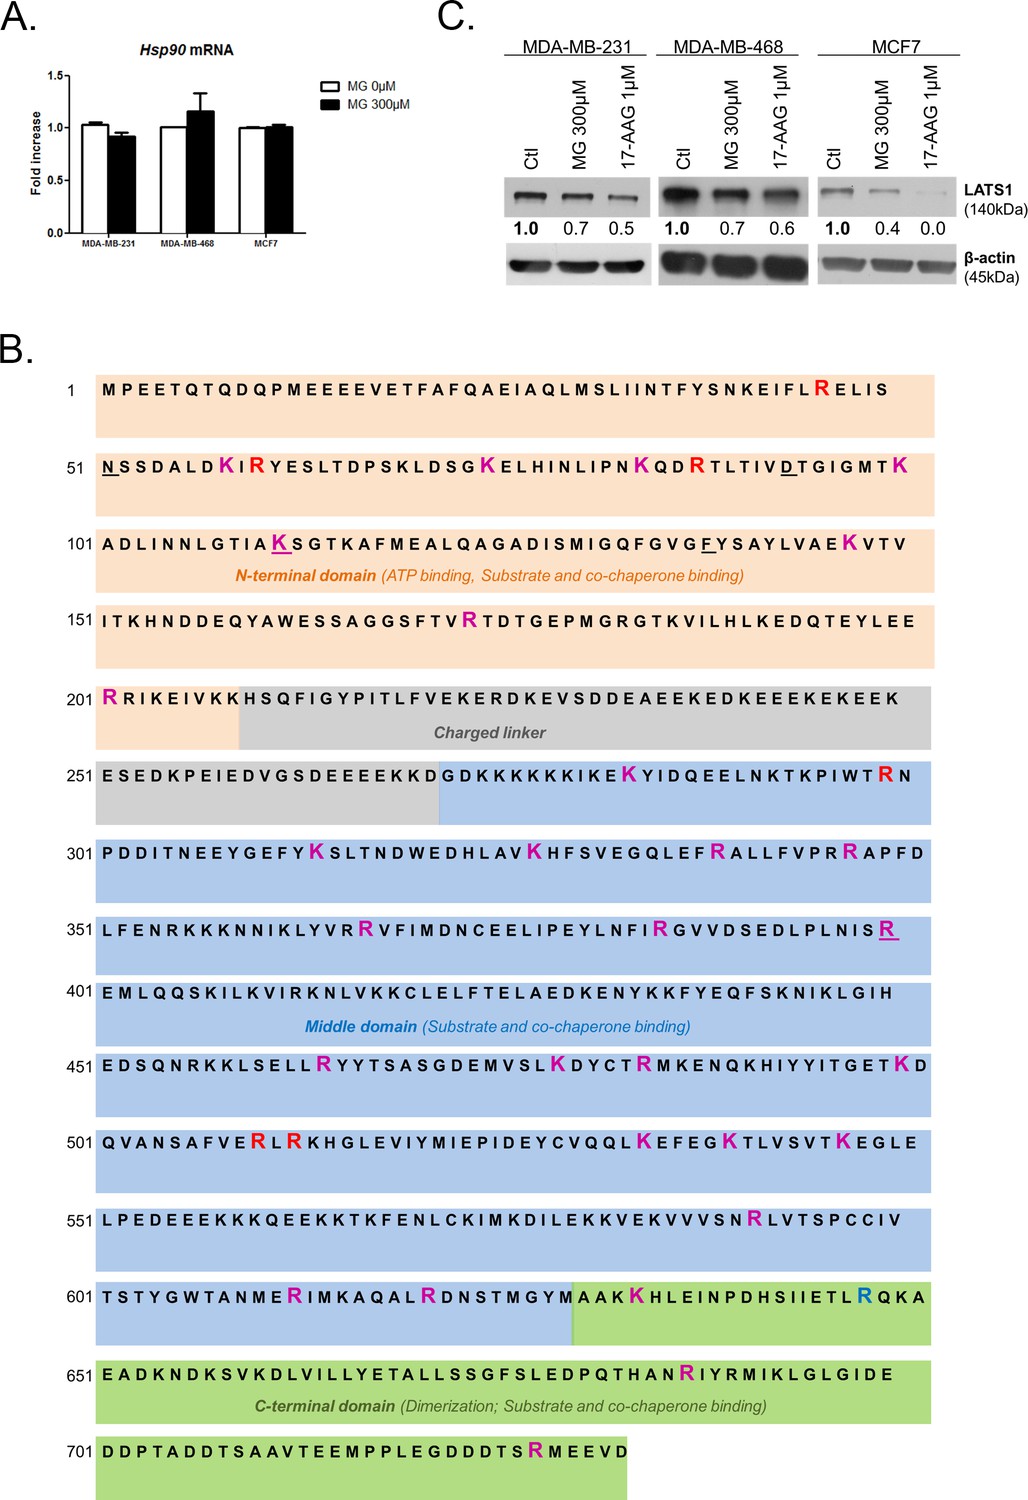
MG induces Hsp90 post-translational glycation.
(A) MG treatment from low to high density did not affect HSP90 mRNA levels as assessed by qRT-PCR in the indicated cell lines. Data were analyzed using unpaired student’s t test and shown as the mean values ± SEM of three independent experiments. (B) MG-modifications represented on Hsp90α amino acid sequence. Underlined amino acids represent ATP binding site. Magenta and blue amino acids represent MG-modifications observed on recombinant and endogenous Hsp90, respectively. Red amino acids represent MG-modifications found in both conditions. (C) LATS1 expression is decreased in breast cancer cells treated with MG (300 µM) or 17-AAG (1 µM) during 24 hr. Immunoblot data were quantified by densitometric analysis and normalized for β-actin. Numbers represent fold increase relative to the condition shown with bold number. Western blot are representative of three independent experiments.
Figure 8 with 1 supplement
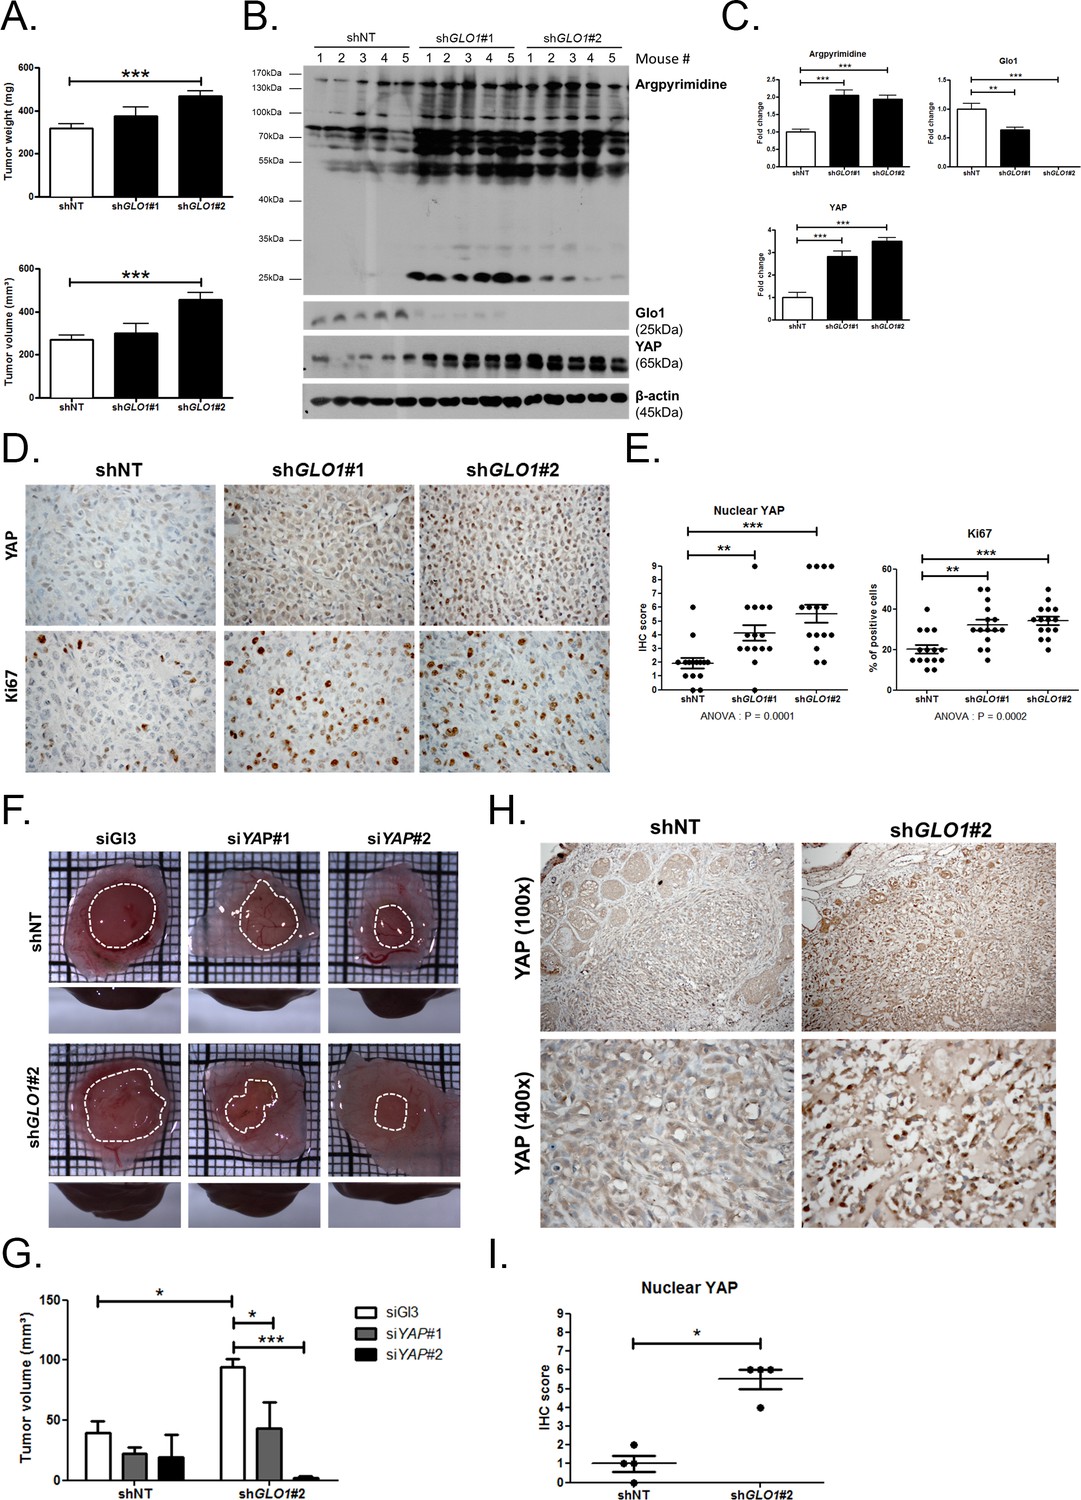
GLO1-depleted breast cancer cells show an increased tumorigenic potential in vivo.
(A) MDA-MB-231 shGLO1#1 and #2 and control shNT cells were injected subcutaneously in NOD-SCID mice (15 mice/group). After 4 weeks, primary tumors were surgically removed and weighed. Tumor weight (mg) and volume (mm³) were analyzed using one-way ANOVA followed by Dunnett post-test and shown as the mean values ± SEM. (B) Western blot detection of argpyrimidine, Glo1 and YAP in five representative experimental primary tumors. β-actin is used for normalization. (C) Quantification of the western blot shown in panel B. Data were analyzed using one-way ANOVA followed by Dunnett post-test and shown as the mean values ± SEM. (D) Representative YAP and Ki67 IHC staining in experimental primary tumors. (E) Quantification of IHC shown in panel D. Each dot represents one case and bars represent mean ± SEM. Data were analyzed using one-way ANOVA Kruskal-Wallis test followed by Dunn post-test (YAP) and one-way ANOVA followed by Dunnett post-test (Ki67). (F) GLO1-depleted MDA-MB-231 (shGLO1#2) and control shNT cells were transfected with YAP siRNAs (siYAP#1 and 2) and grown on the chicken chorioallantoic membrane (CAM). After 7 days, tumors were collected and measured. Top and profile views of representative experimental CAM tumors are shown. (G) Tumor volumes (4 tumors/condition) were analyzed using two-way ANOVA followed by Bonferroni post-test and shown as the mean values ± SEM. (H) Representative YAP immunostaining on GLO1-depleted CAM experimental tumors. (I) Quantification of nuclear YAP IHC shown in panel F. Each dot represents one case and bars represent mean ± SEM. Data were analyzed using Mann Whitney t test. *p<0.05, **p<0.01 and ***p<0.001.
Figure 8—figure supplement 1
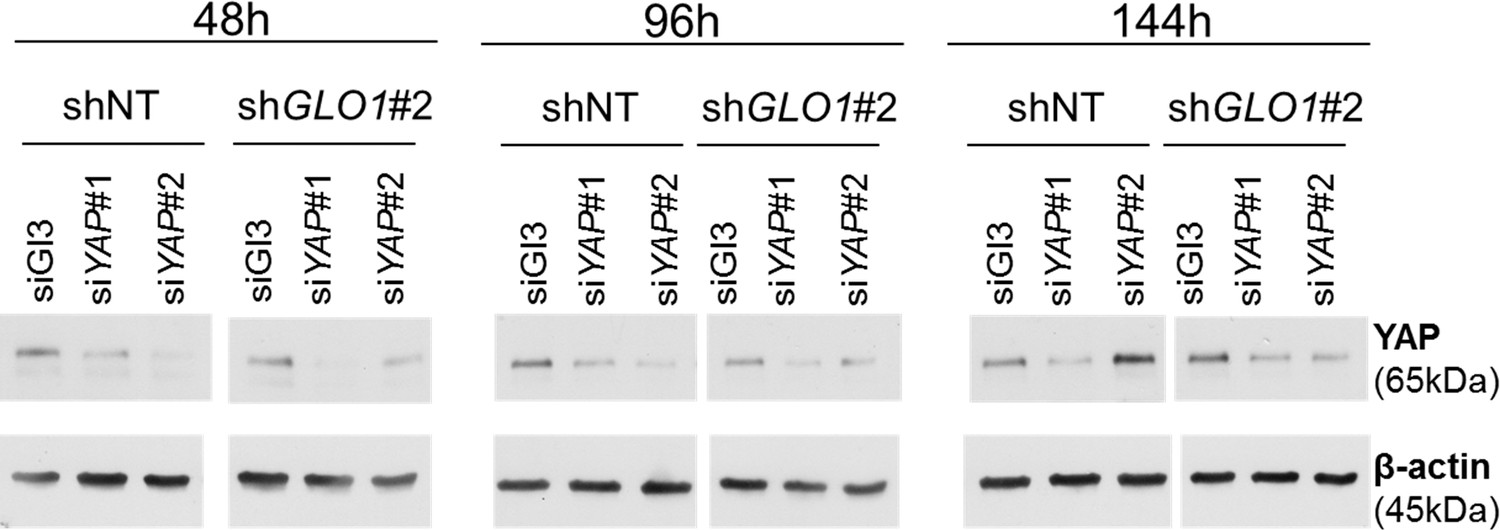
GLO1-depleted breast cancer cells show an increased tumorigenic potential in vivo.
Validation of YAP silencing in GLO1-depleted MDA-MB-231 cells at different time points during tumor development on chicken chorioallantoic membrane described in Figure 8F–I.
Figure 9
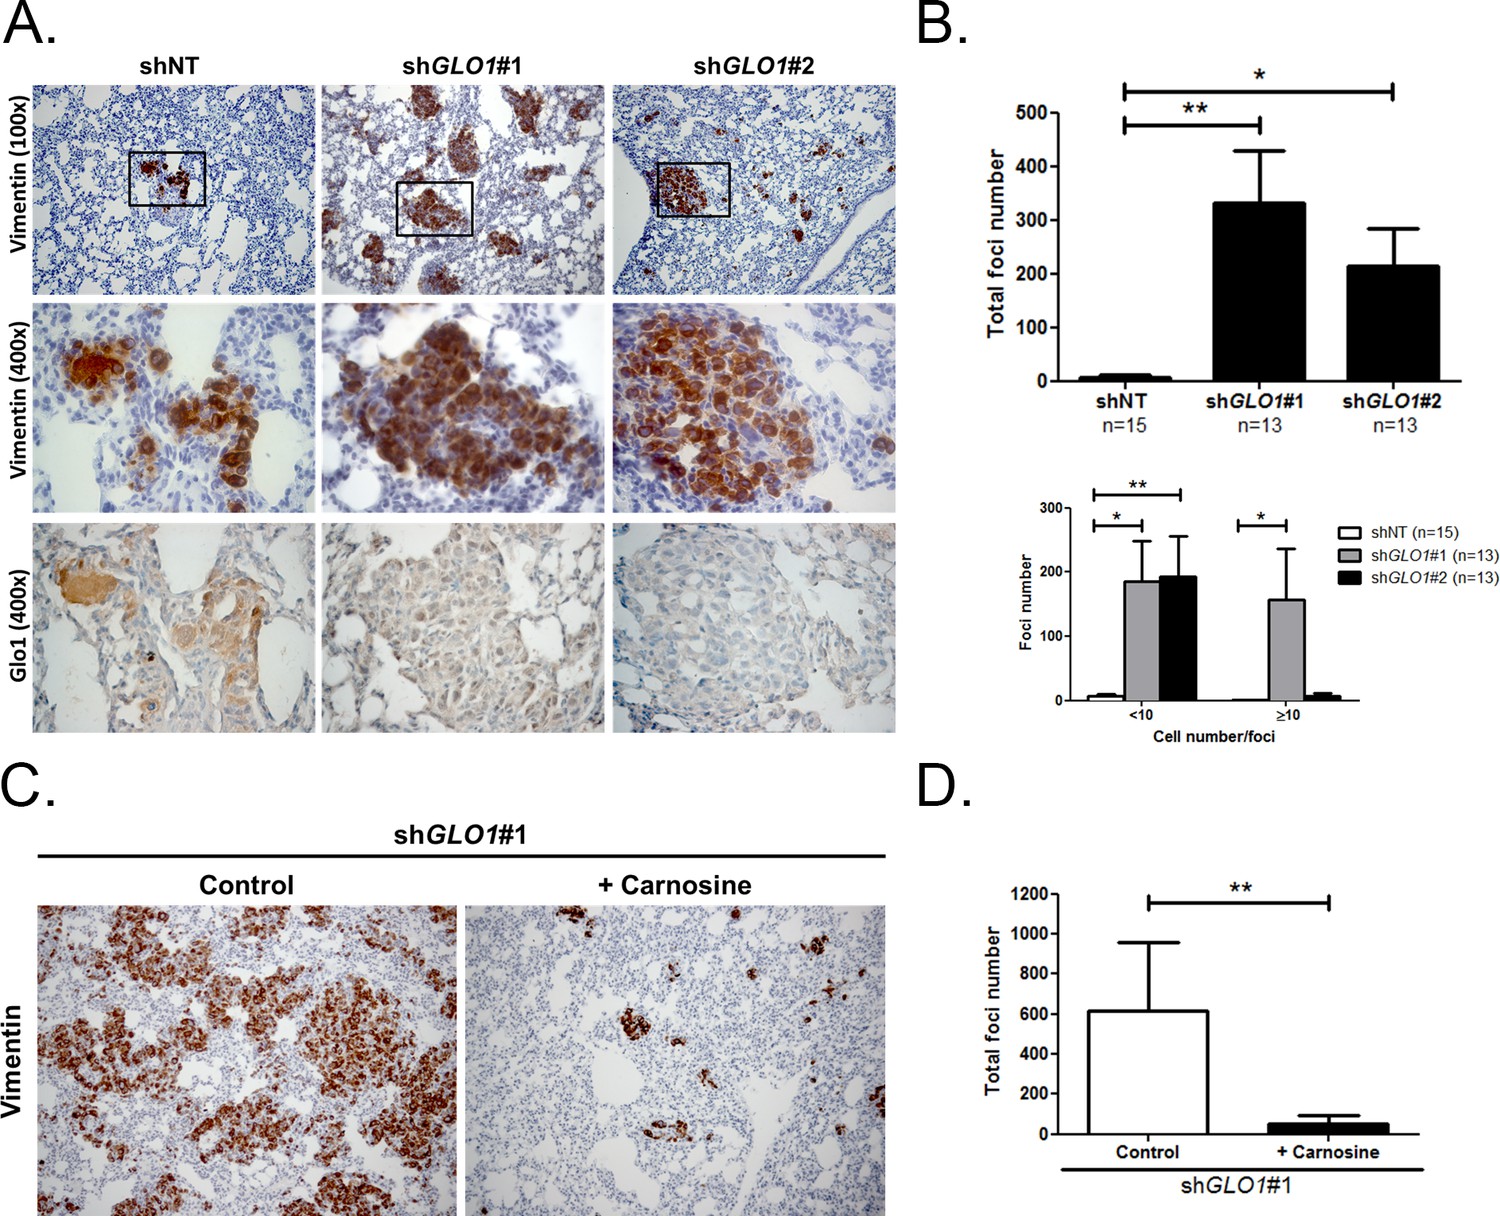
GLO1-depleted breast cancer cells show an increased metastatic potential in a mouse xenograft model.
(A) MDA-MB-231 shGLO1#1 and #2 and control shNT cells were injected subcutaneously in NOD-SCID mice. After 4 weeks, primary tumors were surgically removed. Six weeks after tumor removal, mice were sacrificed and lungs were collected. We had to ethically sacrifice two mice in both shGLO1#1 and #2 groups before the end of the experiment. Representative human vimentin IHC highlights lung metastatic tumor lesions. Adjacent serial sections were used to perform Glo1 IHC staining. (B) Quantification of number and size of vimentin positive foci on whole lung sections. Data were analyzed using two-way ANOVA followed by Newman Keuls or Bonferroni post-test and shown as the mean values ± SEM. The number of mice per group is indicated on the graph. (C) MDA-MB-231 shGLO1#1 cells were injected subcutaneously in NOD-SCID mice (5 mice/group). After 4 weeks, primary tumors were surgically removed and mice were treated with carnosine (10 mM) in drinking water. Six weeks after tumor removal, mice were sacrificed and lungs were collected. Human vimentin IHC staining of whole lung sections highlights metastatic tumor lesions. Magnification 100x. (D) Quantification of vimentin-positive foci on whole lung sections. Data were analyzed using unpaired student’s t test and shown as the mean values ± SEM. *p<0.05 and **p<0.01.
Author response image 1

Intracellular (A) and extracellular (B) MG concentrations in MDA-MB-231 cells.
MG adducts western blotting detection using anti-argpyrimidine antibody in MDA-MB-231 cells cultured in high and low glucose and upon exogenous MG treatment (C) and in Glo1-silenced cells (D).
Additional files
-
Supplementary file 1
Antibodies and dilutions used for Western Blot experiments.
- https://doi.org/10.7554/eLife.19375.027
-
Supplementary file 2
siRNA sequences.
- https://doi.org/10.7554/eLife.19375.028
-
Supplementary file 3
Primer sequences and probes used for quantitative reverse transcription-PCR (qRT-PCR).
- https://doi.org/10.7554/eLife.19375.029
Download links
A two-part list of links to download the article, or parts of the article, in various formats.
Downloads (link to download the article as PDF)
Open citations (links to open the citations from this article in various online reference manager services)
Cite this article (links to download the citations from this article in formats compatible with various reference manager tools)
Methylglyoxal, a glycolysis side-product, induces Hsp90 glycation and YAP-mediated tumor growth and metastasis
eLife 5:e19375.
https://doi.org/10.7554/eLife.19375


