Modeling susceptibility to drug-induced long QT with a panel of subject-specific induced pluripotent stem cells
- Icahn School of Medicine at Mount Sinai, United States
- Sorbonne Universités, UPMC Univ Paris 06, AP-HP, INSERM, CIC-1421, Institute of Cardiometabolism and Nutrition, France
- Cellectis Stem Cells, France
Figures
Figure 1 with 1 supplement
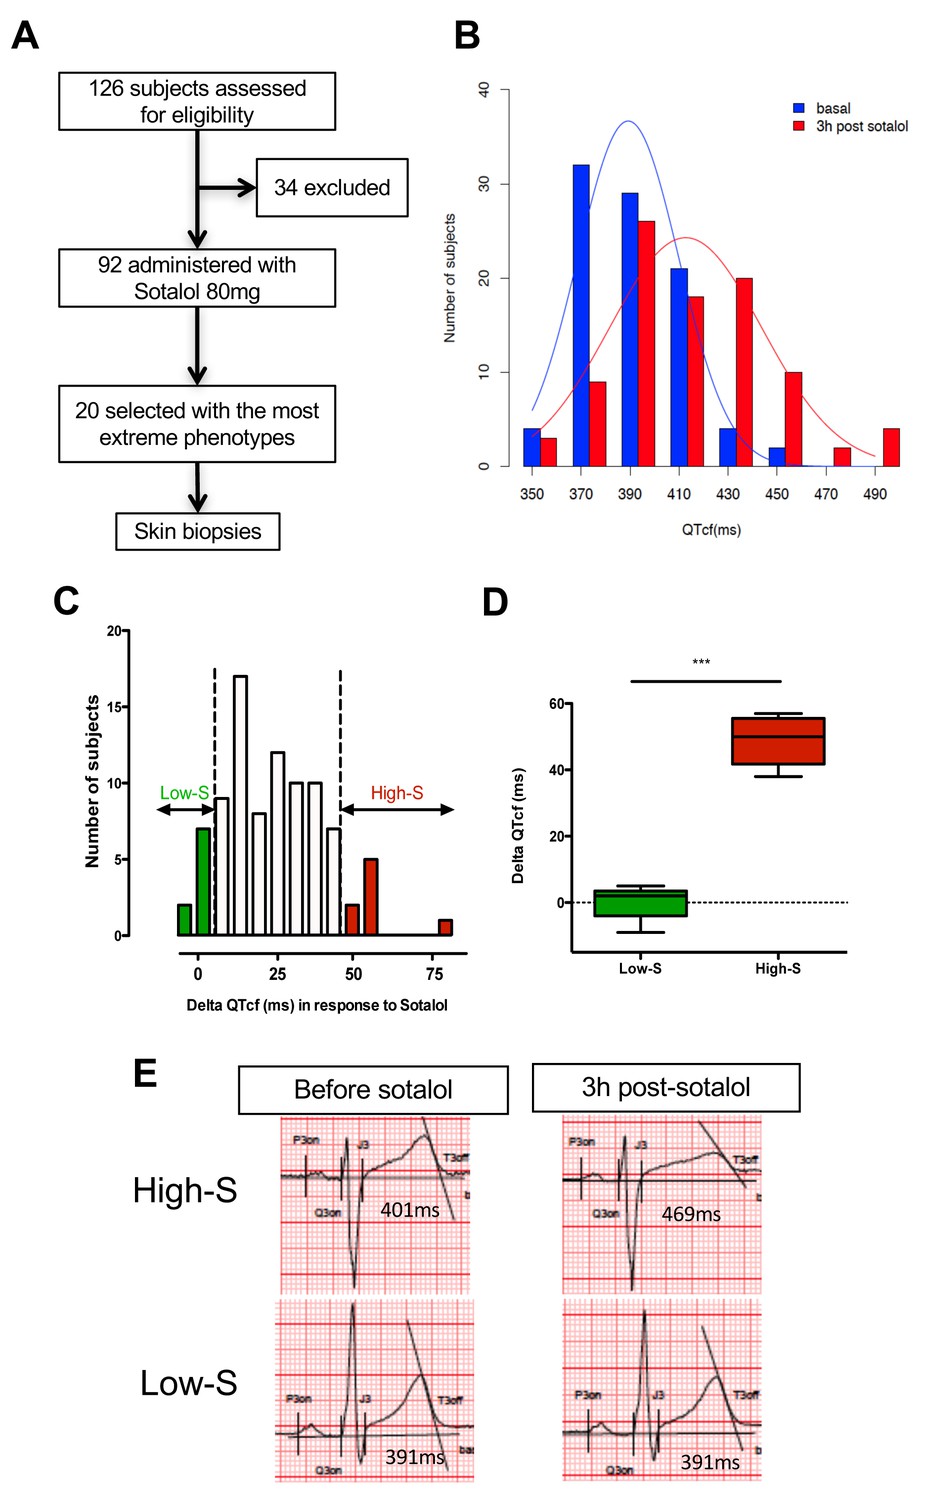
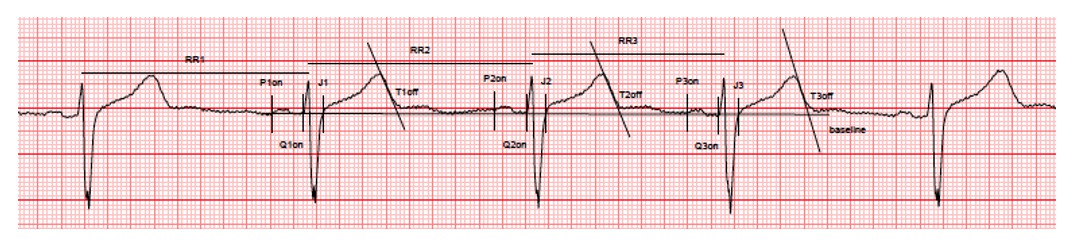
QTcf changes following Sotalol administration in healthy volunteers.
(A) Flow chart of the clinical study. (B) Distribution of QTcf duration before (blue) and 3 hr after sotalol intake (red). (C) Distribution of delta change in QTcf showing the wide inter-individual variability in response to the same pharmacological stimulation. Subjects with the most extreme responses were selected as low sensitive (low-S) or high- sensitive (high-S) as indicated in green and red respectively. (D) Average delta change in QTcf in the two groups of selected subjects. ***p<0.001. (E) Typical ECG recordings before and after sotalol intake in a high-S subject (upper panels) and in a low-S subject (lower panels). There is one figure supplement.
Figure 1—figure supplement 1
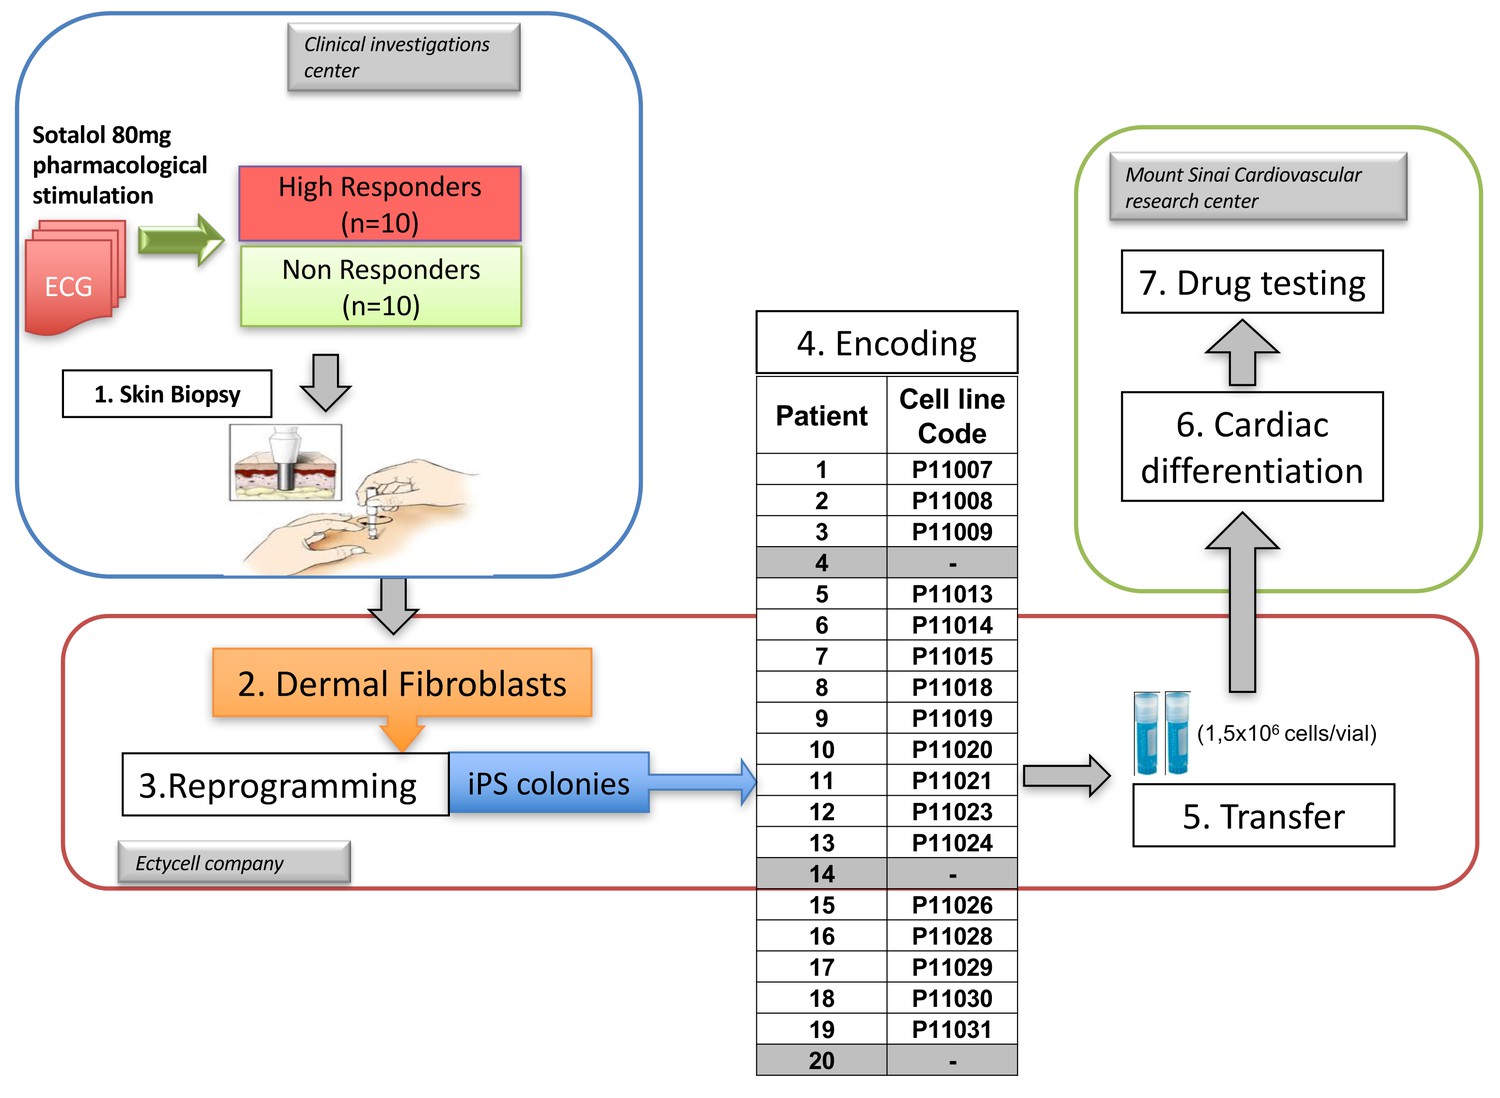
Overview of the clinical and experimental study and role of each partner.
This translational study started with a prospective clinical study performed in a clinical investigation center near Paris, France. The objective was to identify healthy subjects with extreme responses to Sotalol 80 mg. Skin punch biopsies were performed in a total of twenty subjects, 10 with low-sensitivity and 10 with high-sensitivity to Sotalol. The fresh skin biopsies were then transferred at the Ectycell company (Romainville, France) in close vicinity of the clinical investigation center. The objective was to culture and bank human dermal fibroblasts and to derive and characterize hiPSC. iPSC clones were then anonymized before any further cardiac experiments were performed. This procedure was agreed by all partners to avoid potential biases in interpreting the recording at the cellular level. iPSCs clones were successfully generated for 17 subjects using retroviral infection and were investigated in this study. For the remaining three subjects (Patients 4, 14 and 20), iPSCs clones were secondarily generated using episomal plasmids and were thus not investigated. The 17 iPSCs clones were then transferred to the Cardiovascular Research Center at Icahn School of Medicine, New York, USA. The objective was to differentiate iPSCs into cardiac myocytes and to perform MEA recordings and drug testing. All required authorizations were obtained.
Figure 2 with 3 supplements
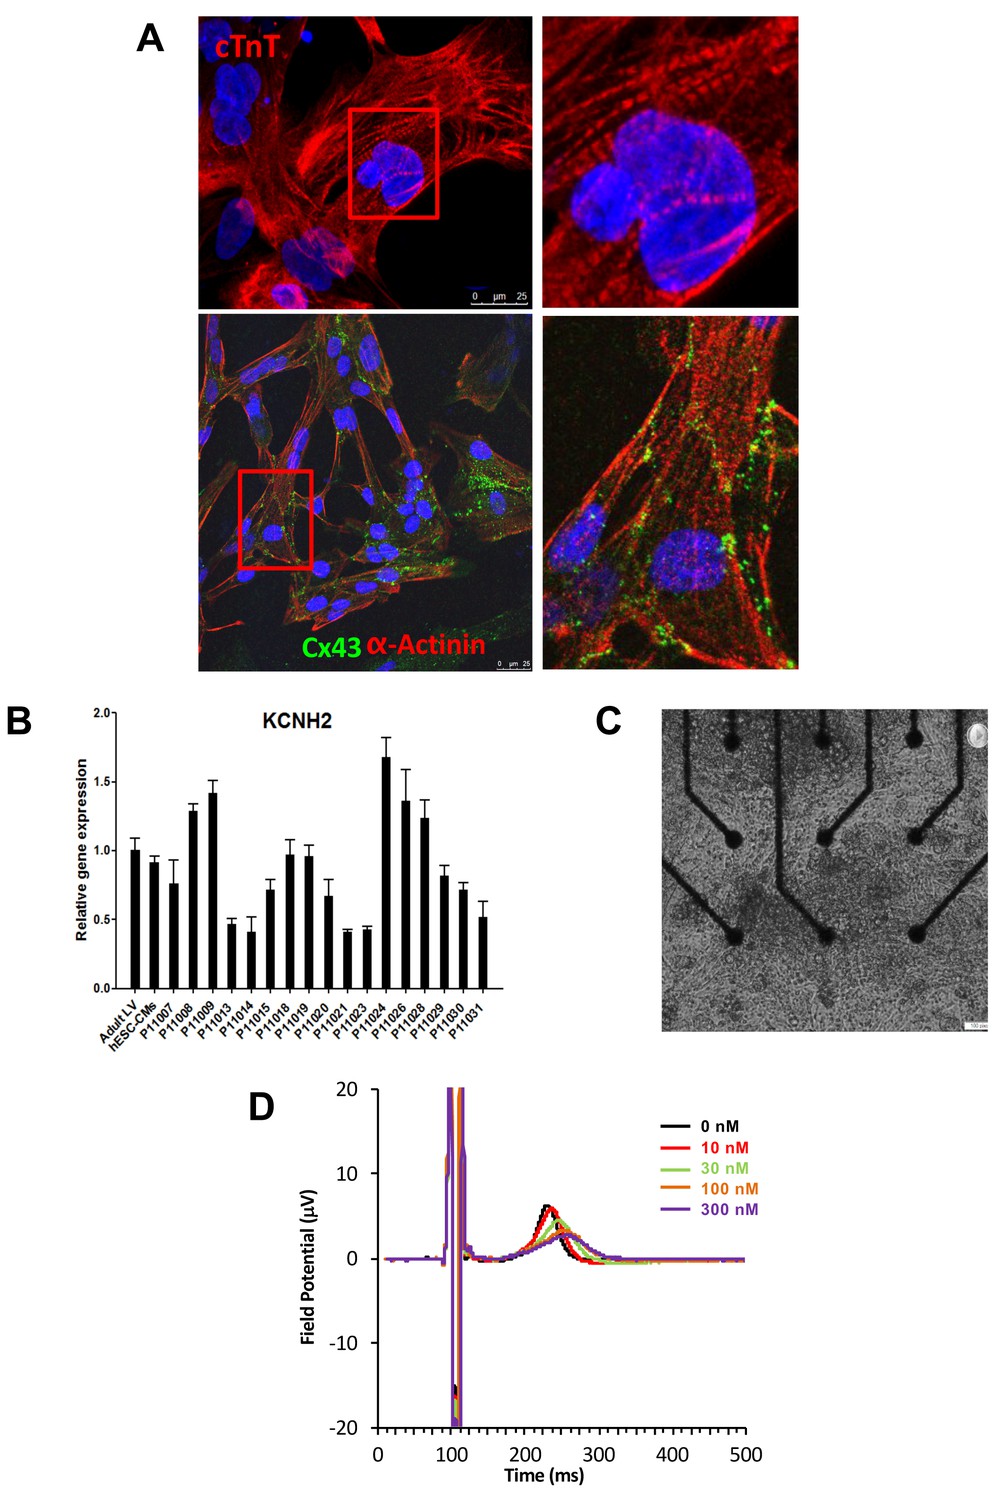
Expression of sarcomeric proteins and ion channels in human iPSC-CMs.
(A) Confocal microscopy imaging of Troponin T (top), alpha-actinin and connexin 43 (bottom) in single generated iPSC-CMs (from line P11015). Nuclei are stained with DAPI (Blue). (B) Gene expression of cardiac ion channel KCNH2 (encoding hERG) by quantitative PCR; Adult LV tissue is used as a positive control and the level of expression in human ESC-derived cardiomyocytes as a comparator. (C) Example of monolayer of iPSC-CMs seeded and attached on a 6-well MEA chip, each well containing nine microelectrodes (black). See also Video 1. (D) Representative field potential duration (FPD) recorded before and after application of the hERG blocker E4031 (from line P11007). There are five figure supplements.
-
Figure 2—source data 1
iPSCs characterization.
Representative immunostaining for a panel of pluripotent stem cell markers, including Nanog, OCT4, SSEA4 and TRA1-60. Results are reported for each cell line. Typical staining in hESC is reported as a positive control. Scale bar 50 μM.
- https://doi.org/10.7554/eLife.19406.008
-
Figure 2—source data 2
Expression of main human cardiac ion channels.
Quantitative PCR results for the expression of 10 major cardiac ion channels including SCN5A, CACNA1, KCNQ1, KCNE1, KCNJ2, KCNJ11, KChIP2, HCN1, HCN2, HCN4. KCND3 was not detected. Adult LV tissue is used as a positive control and the level of expression in human embryonic stem cells-derived cardiomyocytes as a comparator.
- https://doi.org/10.7554/eLife.19406.009
Figure 2—figure supplement 1
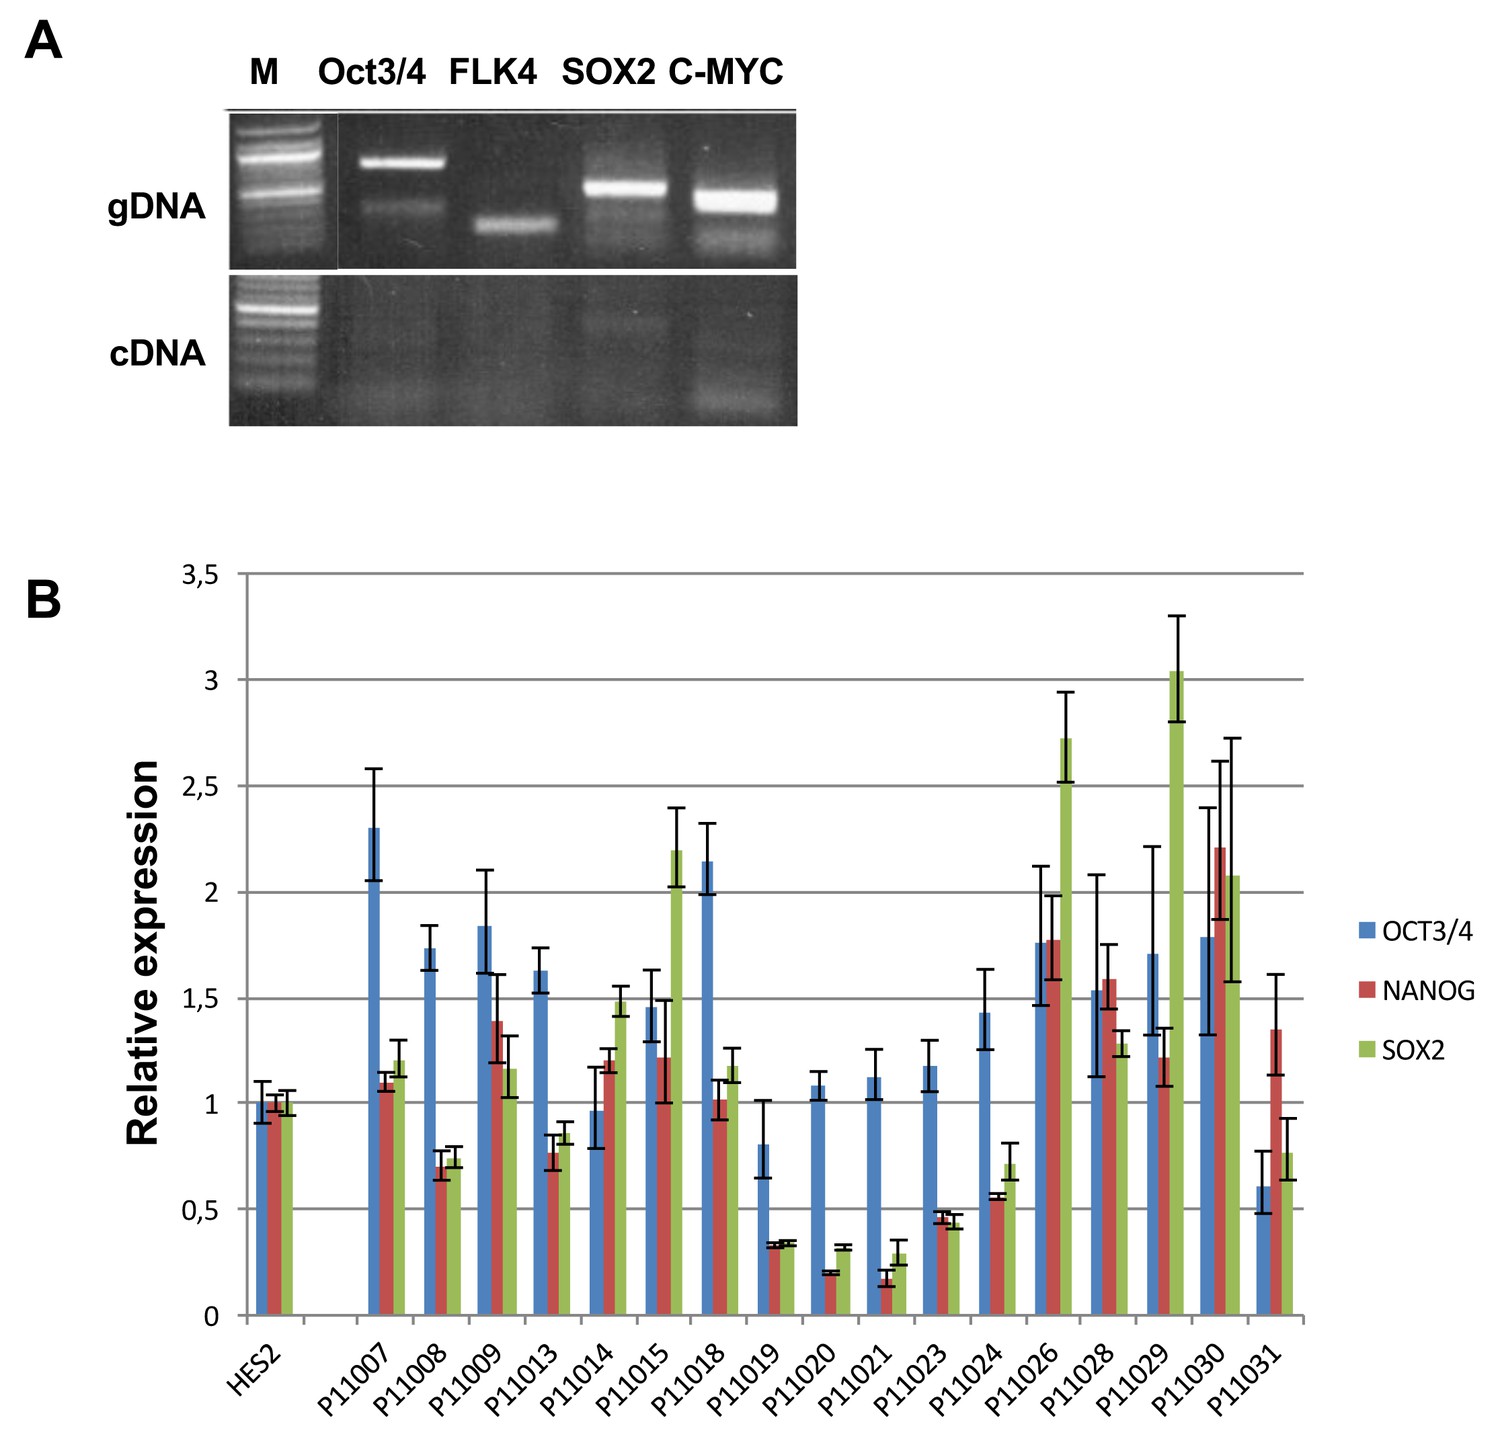
Expression of exogenous and endogenous pluripotency genes.
Representative gel showing silencing of the four exogenous reprogramming transgenes (OCT3/4; KLF4; SOX2 ; c-MYC) and quantitative PCR results for endogenous pluripotent stem cell genes (OCT3/4; NANOG; SOX2) in the generated hiPSCs.
Figure 2—figure supplement 2
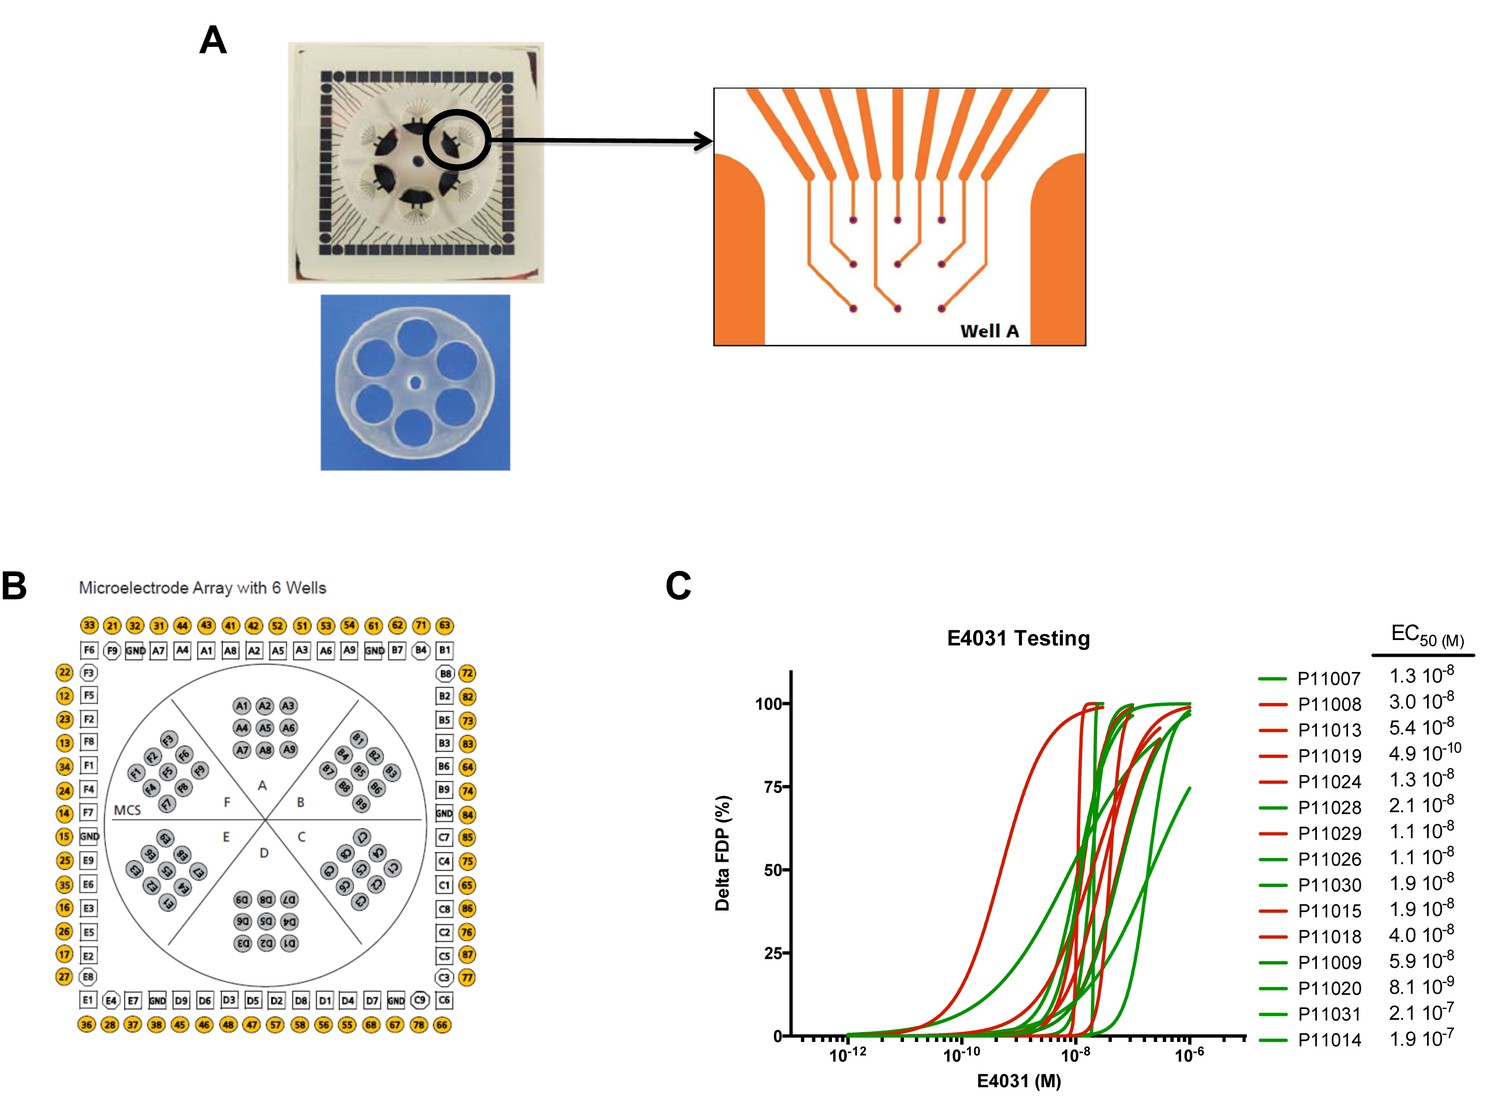
MEA arrays.
(A) Picture of a 6-well MEA array as used in the study. Each well contains nine micro-electrodes and a limited volume capacity allowing easier contact between cells and micro-electrodes after re-seeding and rapid response to drugs after application in a limited volume of medium. (B) Typical micro-electrodes map of the six well array. (C) Dose-curve responses to the hERG blocker E4031. Increasing concentrations of E4031 were applied as described in Materials and methods section. Individual data were plotted and a hill equation was fitted allowing estimates of EC50 for each cell lines. Results were obtained in 15 cell lines as two cell lines display no changes in FPD in response to E4031, suggesting expression of a non-functional hERG in these iPSC-CMs. For graphical purposes, cell lines from the low-S group are shown in green and from the high-S group in red.
Figure 2—figure supplement 3
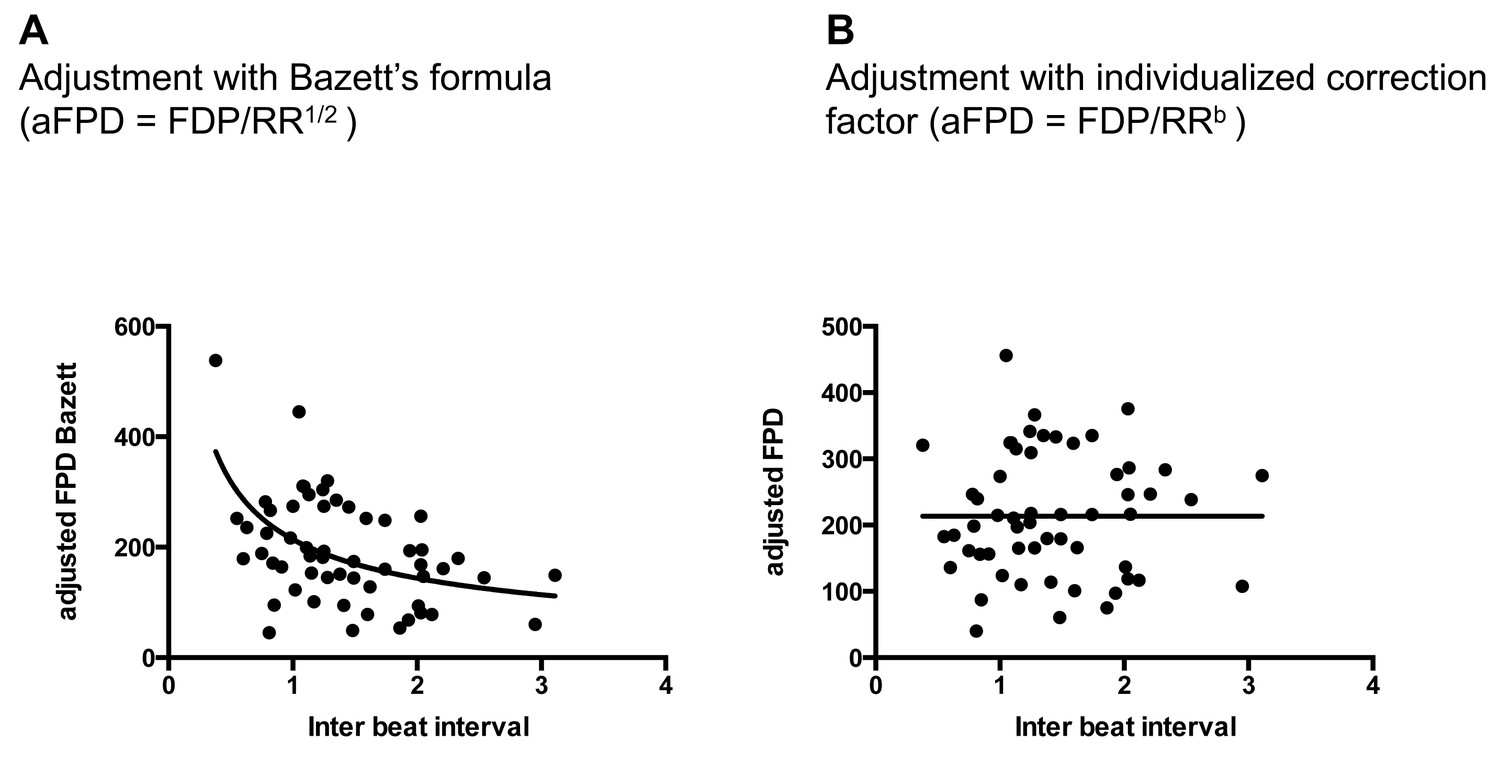
Quality of FPD adjustment.
(A) Plot of adjusted FPD using the Bazett’s formula against the individual inter-beat interval. This plot shows the miss-correction achieved using the Bazett’s formula with a significant dependence of FPD to beating rate even after adjustment. (B) Plot of adjusted FPD against the individual inter-beat interval after re-estimation of the correction factor to the data set. The plot shows perfect correction with linear regression indicating the lack of influence of the beating rate on the adjusted FPD.
Figure 3
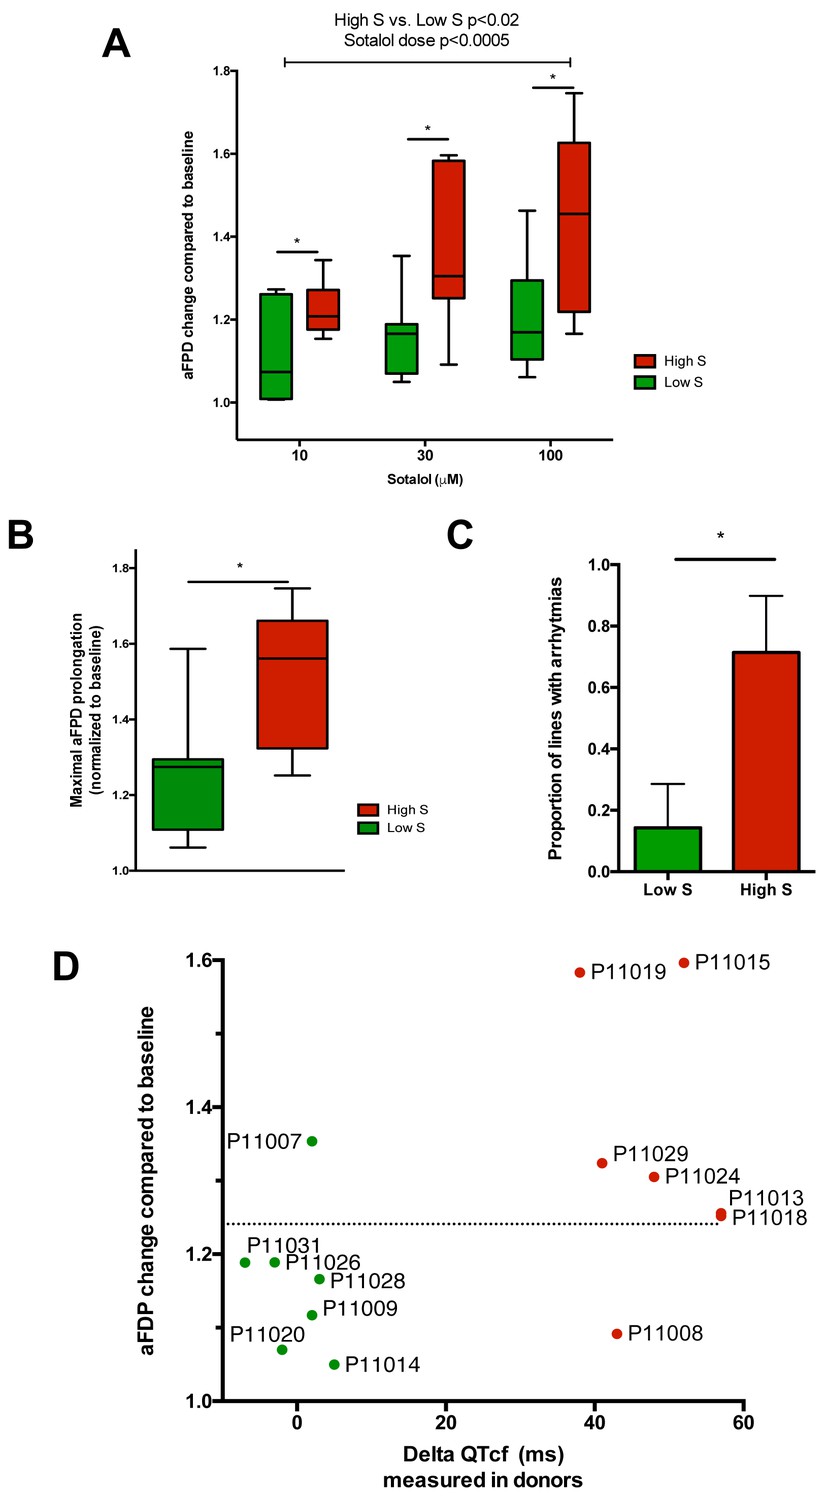
Differences in iPSC-CMs responses to Sotalol stimulation according to clinical sensitivity to Sotalol.
(A) Adjusted FPD (aFPD) measured in iPSC-CMs derived from subjects with low-sensitivity (green) vs. high-sensitivity (red) in response to increasing concentrations of sotalol. aFPD are normalized to baseline values to account for inter-lines variability in aFPD values. Two-way analysis of variance demonstrates a significant influence of sotalol concentrations (p<0.0005) and of the sensitivity group (p<0.02). *p<0.05 for post-hoc comparison between groups; high-S vs. low-S. N = 2–5 recordings per cell lines per concentrations. (B) Maximal change in aFPD observed during sotalol stimulation. (C) Proportion of observed arrhythmias after sotalol application. (D) Data plot graph showing the correlation between aFPD observed in iPSC-CMs and the DeltaQTcf observed in donors. The aFPD data are reported for sotalol 30 μM concentration. Data points are clustered in two distinct groups. Except for two lines (one line in each group), a threshold a 25% in aFPD change (dashed line) correctly discriminates cells from both groups.
Figure 4

Patch-clamp analysis of action potential (AP) in representative iPSC-CMs.
(A) Representative AP tracings of the iPSC-CMs generated from the low-S (P11009) and high-S (P11029) lines in control and sotalol-treated conditions. (B) bar chart summarizing the APD90 in control and sotalol-treated conditions for the hiPSC-CMs generated from both low-S (P11009) and high-S (P11029) hiPSC cell lines (n = 5 for each condition). *p<0.05; **p<0.01, ANOVA, followed by Tukey's, sotalol-treated versus respective control without sotalol application.
Figure 5 with 1 supplement
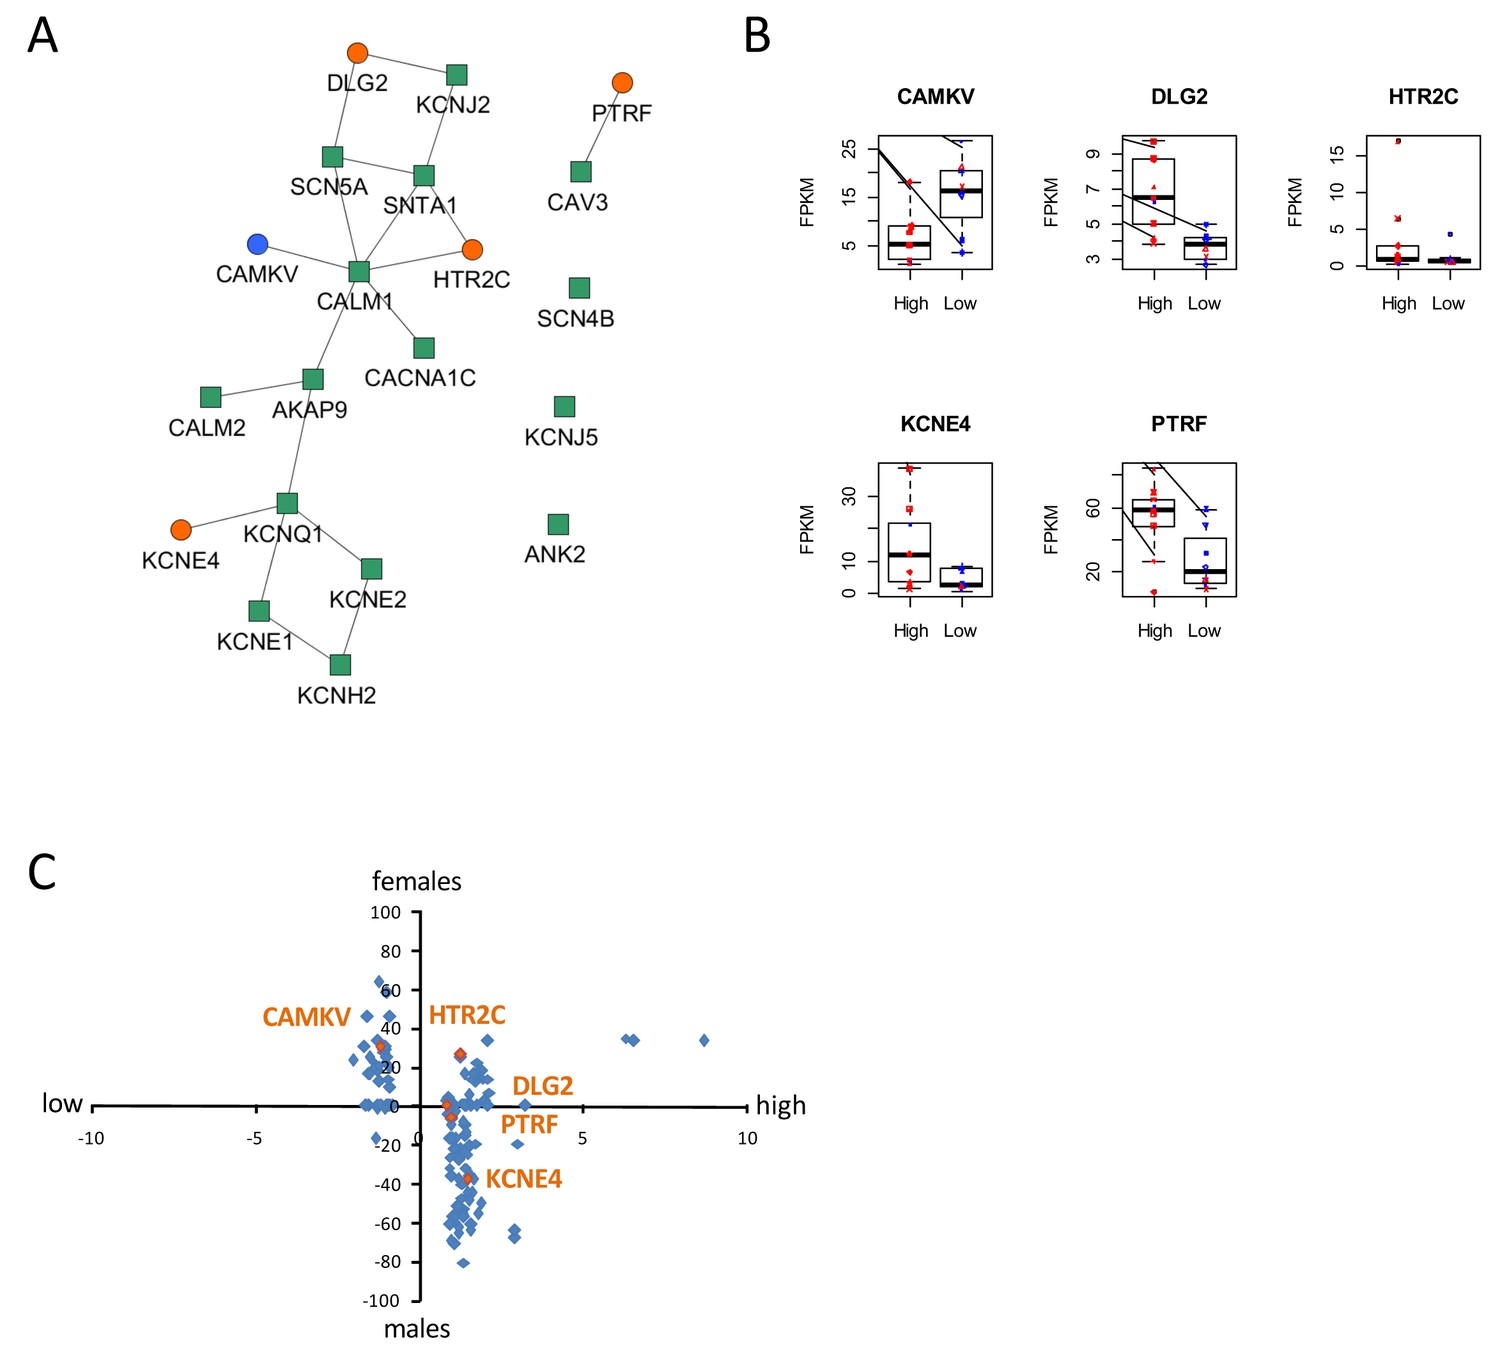
Identification of dysregulated genes as direct neighbors of QT-associated network in high-S iPSC-CMs.
(A) Known LQTS genes were used as seed nodes (green squares) in the human interactome and five differentially expressed direct neighbors were identified (circles) (path length 1). Up-regulated genes are colored orange, down-regulated genes are in blue. (B) Relative expression of identified genes in each group. Males are represented in blue and females in red. Individual samples are represented by the same symbols in all diagrams. (C) Comparison of the log2-fold changes between the high-S and the low-S groups with the normalized counts of how often a gene (blue or orange dots) was found to be up- or down-regulated between the male and female groups. As there are more females in the high-S group and more males in the low-S groups, report of genes in the lower left or upper right quadrants indicate a gender-specific effect while the lower right and upper left quadrants argue for the lack of gender-specific effect. Except for HTR2C, dysregulation of all other candidate genes was suspected to occur independently of gender. There is one figure supplement.
Figure 5—figure supplement 1
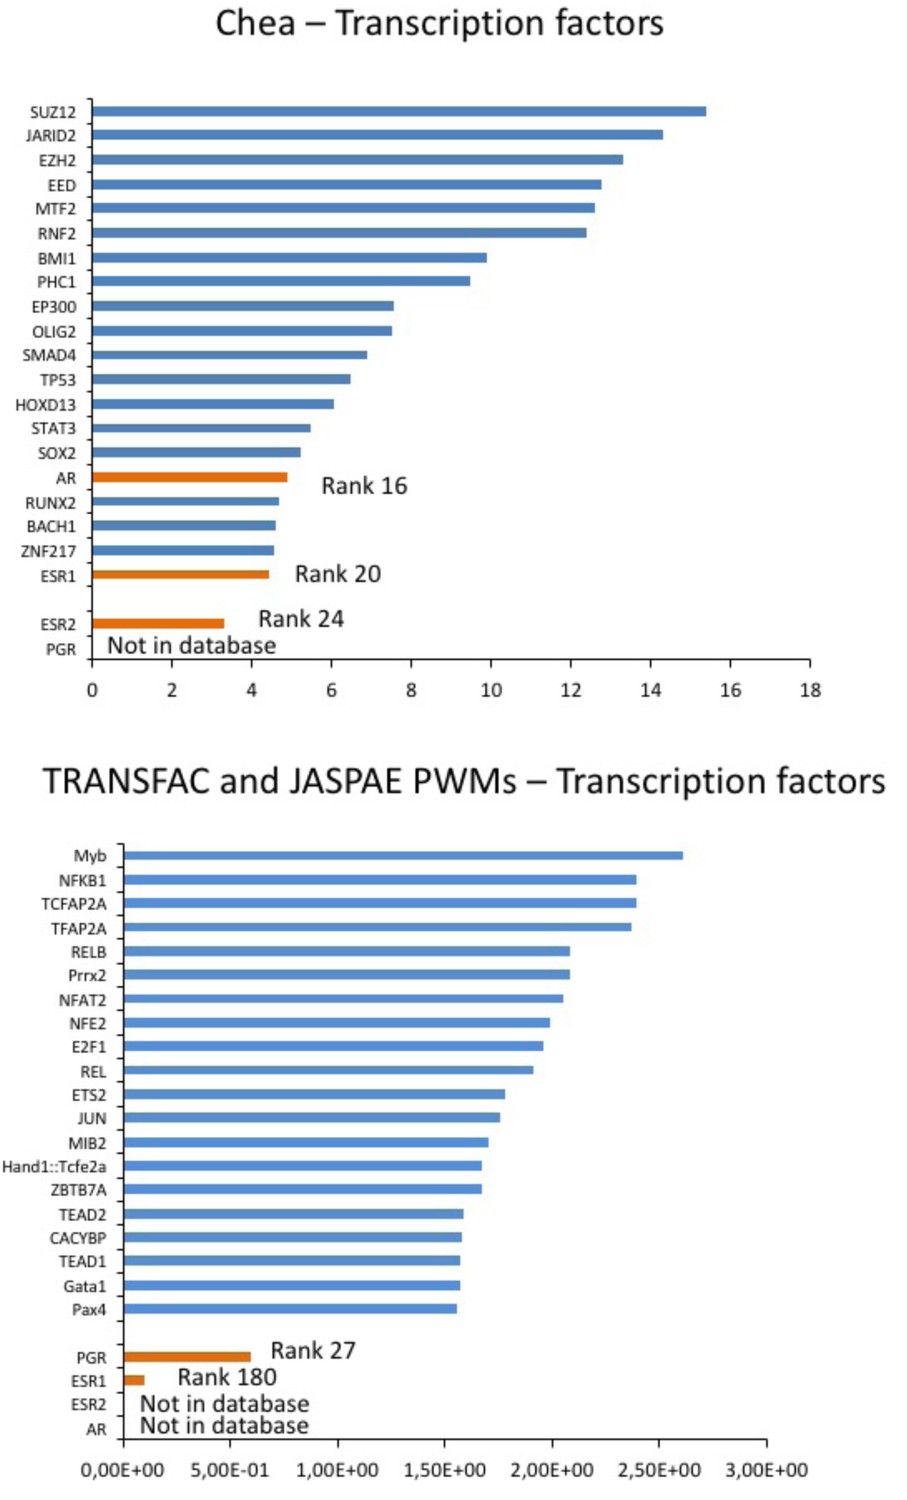
Prediction of sex hormones-related transcription factors.
Predicted regulatory transcription factors of the identified DEGs (DLG2, KCNE4, CAMKV, PTRF, HTR2C) based on two transcription factor target databases (Chea background and Transfac) and ranked by significance. The sex-hormone related transcription factors (in orange) were ranked 16 (AR), 20 (ESR1) and 24 (ESR2) or 27 (PGR) and 180 (ESR1) while the top 10 candidates were independent of sex hormones influence (in blue).
Author response image 1
Videos
Video 1
Spontaneous beating activity of monolayer iPSC-CMs seeded onto one well of a 6-well MEA chamber.
https://doi.org/10.7554/eLife.19406.014Tables
Table 1
Related to Figure 1. Demographic, clinical and electrocardiographic baseline characteristics of subjects with low- vs. high- sensitivity to Sotalol.
Low-sensitivity, n = 10 | High- sensitivity, n = 10 | p-value | |
|---|---|---|---|
Age | 29.9 ± 5.9 | 28.3 ± 5.9 | 0.53 |
Gender, Male (%) | 8 (80.0%) | 1 (10%) | 0.006 |
Body Mass Index (kg/m²) | 23.6 ± 0.9 | 22.9 ± 2.7 | 0.40 |
SBP (mmHg) | 116.0 ± 8.6 | 113.7 ± 8.3 | 0.50 |
DBP (mmHg) | 72.2 ± 4.8 | 68.0 ± 4.2 | 0.07 |
Resting heart Rate (bpm) | 59.6 ± 5.9 | 63.2 ± 8.4 | 0.37 |
PR interval (ms) | 166.7 ± 24.7 | 143.5 ± 18.1 | 0.09 |
QRS (ms) | 88.3 ± 5.9 | 85.6 ± 7.7 | 0.08 |
QTcf (ms) | 384.7 ± 26.4 | 402.6 ± 20.8 | 0.13 |
Table 2
Related to Figure 2. Fibroblasts and iPS quality control parameters.
ID | Mycoplasma* | HIV*, HBV*, HCV*, HTLV1 and 2* | Phosphatase alkaline staining | Karyotyping |
|---|---|---|---|---|
P11007~5924~iPSpolyRoksmA | Negative | Negative | Positive | 46,XY |
P11008~5444~iPSpolyRoksmB | Negative | Negative | Positive | 46, XX |
P11009~6426~iPSpolyRoksmC | Negative | Negative | Positive | 46, XY |
P11013~5744~iPSpolyRoksmD | Negative | Negative | Positive | 46, XX |
P11014-5864-iPSpolyRoksmC | Negative | Negative | Positive | 46, XX |
P11015~6345~iPSpolyRoksmE | Negative | Negative | Positive | 46, XX |
P11018~5644~iPSpolyRoksmB | Negative | Negative | Positive | 46, XX |
P11019-6444-iPSpolyRoksmB | Negative | Negative | Positive | 46, XY |
P11020 ~ 7125 ~ iPSpolyRoksmD | Negative | Negative | Positive | 46, XY |
P11021 ~ 6544 ~ iPSpolyRoksmC | Negative | Negative | Positive | 46, XX |
P11023~5525~iPSpolyRoksmA | Negative | Negative | Positive | 46, XX |
P11024~5844~iPSpolyRoksmA | Negative | Negative | Positive | 46, XX |
P11026~6504~iPSpolyRoksmD | Negative | Negative | Positive | 46, XY |
P11028~6904~iPSpolyRoksmJ | Negative | Negative | Positive | 46, XY |
P11029-6284-iPSpolyRoksmB | Negative | Negative | Positive | 46, XX |
P11030~5684~iPSpolyRoksmA | Negative | Negative | Positive | 46, XX, t(1;16)† |
P11031~5204~iPSpolyRoksmC | Negative | Negative | Positive | 46, XY |
-
*Tested in originating fibroblast cell lines.
-
†As found in originating fibroblasts.
Table 3
Related to Figure 2. Single nucleotide polymorphisms in ANK2, SCN5A, KCNQ1, CACNA1C, CALM1, KCNE2, KCNH2 and KCNJ5 as being significantly imbalanced (p<0.05) between low-S vs. high-S groups. Anticipated minor allelic frequency (MAF) was defined using the HapMap-CEU European data. The MAF in cells from the high-S vs. low-S groups was determined once the study was unblinded. Fisher’s exact test was used to compare observed MAFs in high-S vs. low-S groups.
Gene | Rs number | Anticipated MAF | Observed MAF Low-S | Observed MAF High-S | p value |
|---|---|---|---|---|---|
ANK2 | rs17045935 | 6.8% | 0% | 22.2% | 0.03 |
rs62314901 | 40% | 56.25% | 27.8% | 0.037 | |
rs17676256 | 10.2% | 12.5% | 38.9% | 0.03 | |
rs967099 | 38.1% | 25% | 44.4% | 0.027 | |
rs4834321 | 46.9% | 37.5% | 55.6% | 0.02 | |
rs35308370 | 48.3% | 25% | 66.7% | 0.025 | |
rs931838 | 42.5% | 31.25% | 66.7% | 0.048 | |
SCN5A | rs7375123 | 19.2% | 43.75% | 11.2% | 0.007 |
rs12491987 | 7.6% | 0% | 22.2% | 0.03 | |
rs9871385 | 34.1% | 6.25% | 33.3% | 0.02 | |
rs9818148 | 19.2% | 56.25% | 16.7% | 0.049 | |
KCNQ1 | rs4255520 | 15.5% | 18.75% | 0% | 0.043 |
rs151288 | 32.7% | 0% | 22.2% | 0.031 | |
rs718579 rs11022996 | 39.8% 41.2% | 12.5% | 27.8% | 0.034 | |
rs151212 | 40.8% | 50% | 33.3% | 0.05 | |
CACNA1C | rs3794299 | 12.4% | 18.75% | 0% | 0.043 |
rs4765661 rs2238018 | 15.8% 17.3% | 31.25% | 5.6% | 0.027 | |
CALM1 | rs3814843 | 1.8% | 0% | 22.2% | 0.031 |
rs2300502 | 7.5% | 6.25% | 33.3% | 0.023 | |
KCNE2 | rs28409368 | 30.8% | 18.75% | 38.9% | 0.0239 |
KCNH2 | rs2072411 | 37.5% | 18.75% | 44.4% | 0.027 |
rs3778873 | 15.8% | 6.2% | 44.4% | 0.02 | |
KCNJ5 | rs7924416 | 24.6% | 0% | 27.8% | 0.013 |
Table 4
Related to Figure 4. AP parameters of low-S and high-S iPSC-derived cardiomyocytes at baseline control condition. AP data are mean ± SE. APD50/APD90, AP duration measured at 50% or 90% repolarization; MDP, maximum diastolic potential. None of the baseline AP parameters was significantly different between the two cell lines.
Low-S (11009) (n=7) | High-S (11029) (n=5) | |
|---|---|---|
Firing Frequency (mV) | 1.26 ± 0.29 | 1.03 ± 0.28 |
Amplitude (mV) | 88.3 ± 3.6 | 85.1 ± 4.7 |
Upstroke velocity (mV/ms) | 11.7 ± 1.0 | 14.0 ± 2.0 |
Decay velocity (mV/ms) | −7.2 ± 1.4 | −11.1 ± 3.5 |
APD50 (ms) | 306.4 ± 57.9 | 299.4 ± 22.0 |
APD90 (ms) | 341.8 ± 58.6 | 338.4 ± 21.4 |
MDP (mV) | −69.4 ± 3.2 | −68.0 ± 1.3 |
Table 5
Related to Figure 5. Generation of new groups associating one high-S and one low-S line of the same gender (six groups for males and 16 groups for females) in order to neutralize gender-specific effects on gene expression. These groups were then used to determine DEGs between the high-S and low-S groups independent of gender.
Male groups | Female groups |
|---|---|
P11019 (high) + P11028 (low) | P11008 (high) + P11030 (low) |
P11019 (high) + P11026 (low) | P11015 (high) + P11030 (low) |
P11019 (high) + P11020 (low) | P11013 (high) + P11030 (low) |
P11019 (high) + P11009 (low) | P11029 (high) + P11030 (low) |
P11019 (high) + P11031 (low) | P11018 (high) + P11030 (low) |
P11019 (high) + P11007 (low) | P11024 (high) + P11030 (low) |
P11023 (high) + P11030 (low) | |
P11021 (high) + P11030 (low) | |
P11008 (high) + P11014 (low) | |
P11015 (high) + P11014 (low) | |
P11013 (high) + P11014 (low) | |
P11029 (high) + P11014 (low) | |
P11018 (high) + P11014 (low) | |
P11024 (high) + P11014 (low) | |
P11023 (high) + P11014 (low) | |
P11021 (high) + P11014 (low) |
Download links
A two-part list of links to download the article, or parts of the article, in various formats.
Downloads (link to download the article as PDF)
Open citations (links to open the citations from this article in various online reference manager services)
Cite this article (links to download the citations from this article in formats compatible with various reference manager tools)
Modeling susceptibility to drug-induced long QT with a panel of subject-specific induced pluripotent stem cells
eLife 6:e19406.
https://doi.org/10.7554/eLife.19406


