Origin and evolution of transporter substrate specificity within the NPF family
- University of Copenhagen, Denmark
- Centro de Bioinformática y Simulación Molecular (CBSM), Universidad de Talca, Chile
- Instituto de Innovación Basada en Ciencia, Universidad de Talca, Chile
Figures
Figure 1 with 1 supplement
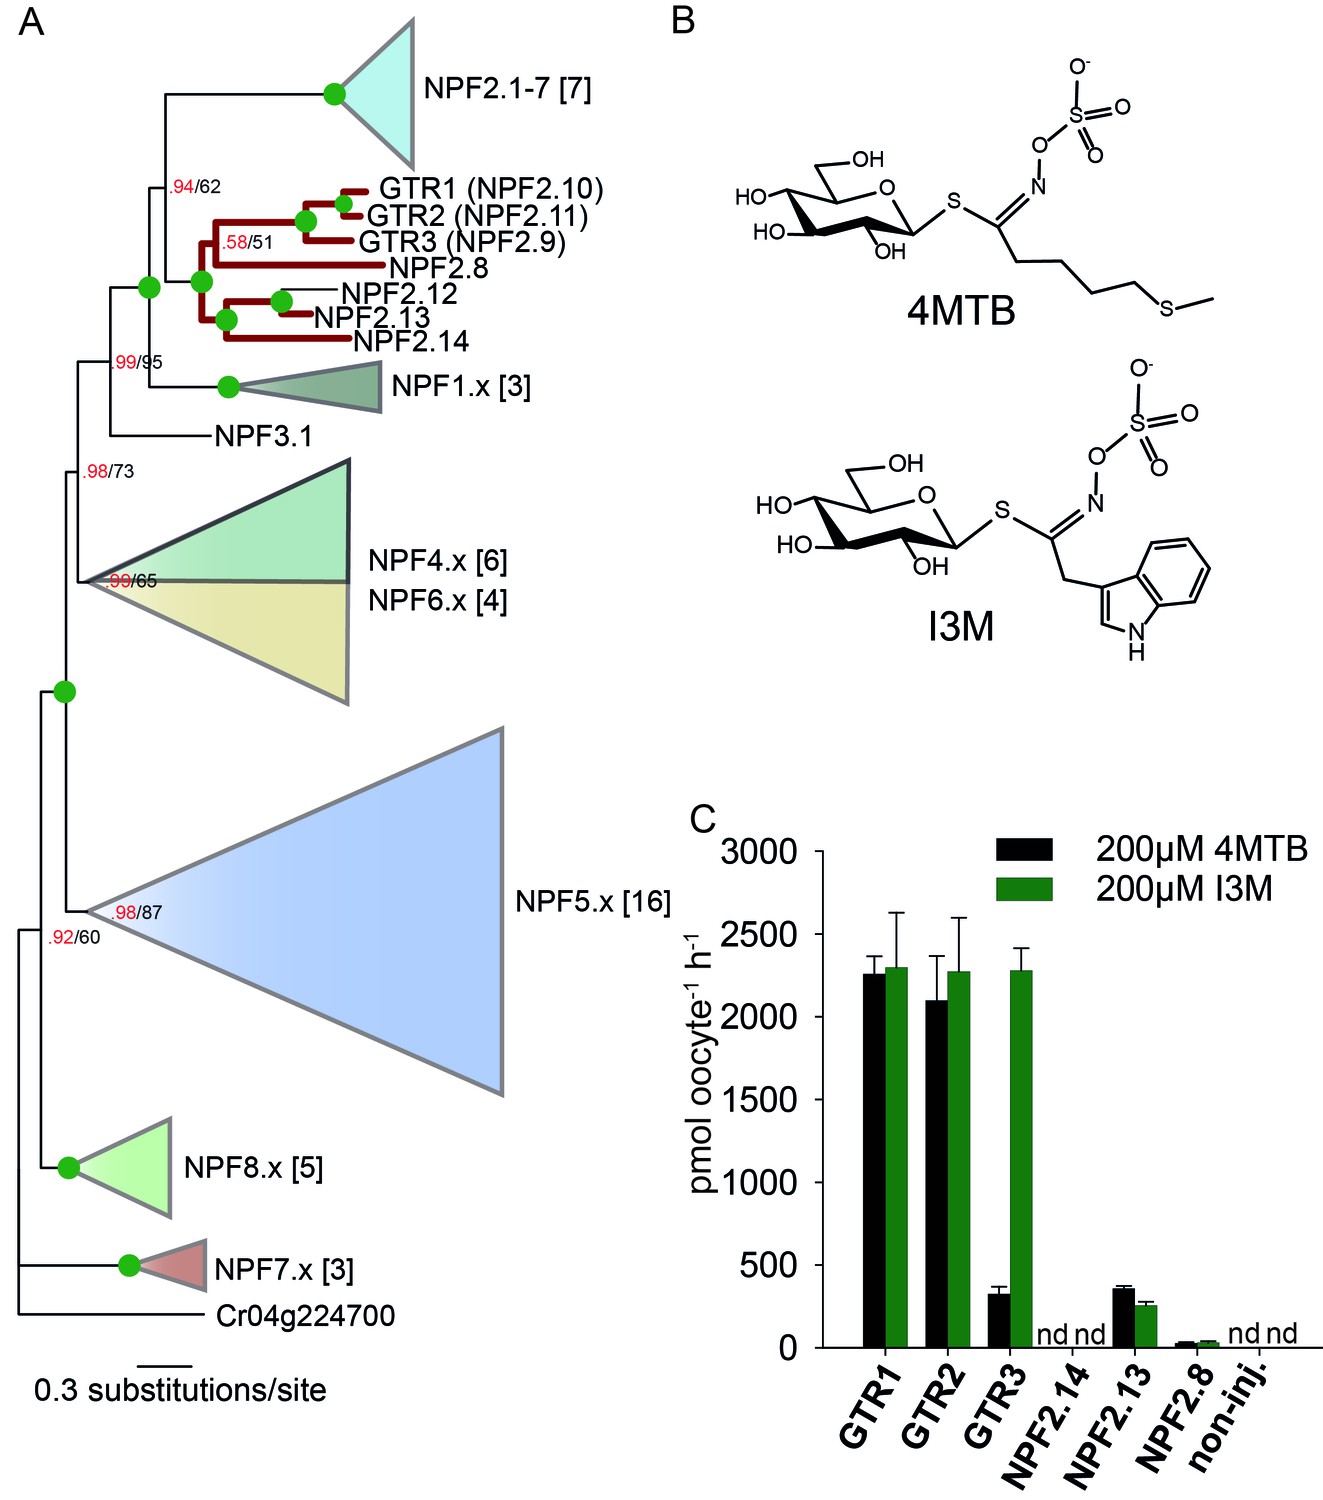
Identification of the indole-specific glucosinolate transporter GTR3 in the NPF family.
(A) Bayesian inference (MrBayes) tree (s.d.< 0.01) of the A. thaliana NPF family with reduced phylogenies of NPF1.x, NPF3.x, NPF4.x, NPF5.x, NPF6.x, NPF7.x, NPF8.x and NPF2.1–7 clades (x denotes the subfamily number) as previously annotated (Léran et al., 2014). Numbers in brackets indicate the number of genes in reduced phylogeny. Green circles at nodes represent a posterior probability of 1 (maximum is 1). Values at nodes separated by a backslash represent MrBayes values below 1 in red, followed by RAxML generated bootstrap values in black (only reported when Mrbayes value is below 1). GTR1, GTR2, GTR3 and 3 other homologs tested in B) are highlighted with red branches. For non-reduced phylogeny, see Figure 1—figure supplement 1. (B) The chemical structure of 4-methylthiobutyl glucosinolate (4MTB) and indol-3-ylmethyl glucosinolate (I3M). (C) GTR1, GTR2, GTR3, NPF2.14, NPF2.13 and NPF2.8 were expressed individually in 15 X. laevis oocytes and transport activity was measured in the presence of 0.2 mM 4MTB (black bars) or 0.2 mM I3M (green bars). 4MTB or I3M accumulated within oocytes were quantified by LC-MS analyses in 3 × 5 oocytes for each gene. Error bars represent ± s.d. n = 3, experiment repeated two times; nd=none detected.
Figure 1—figure supplement 1
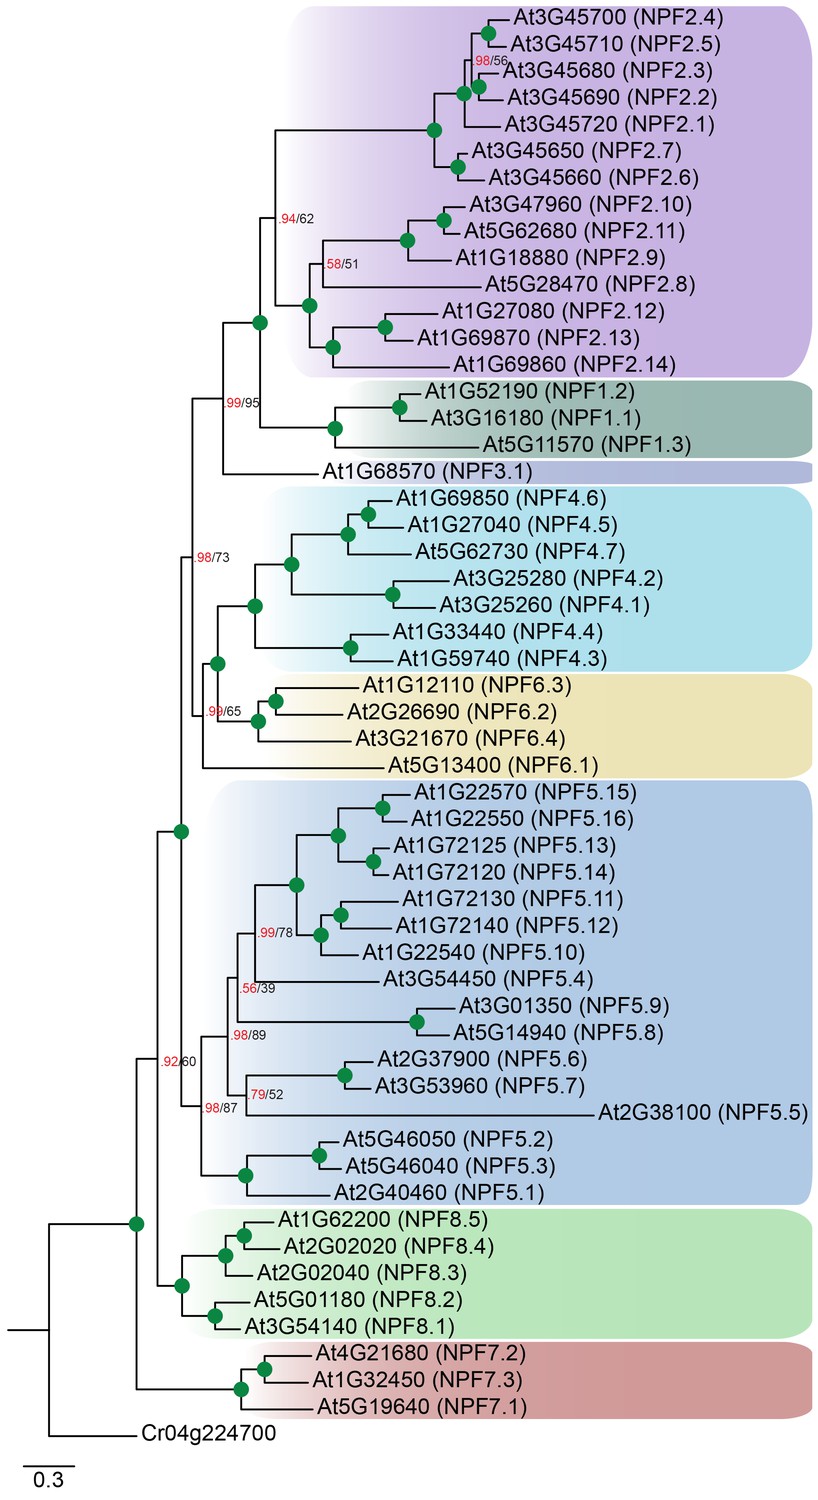
Non-reduced AtNPF tree.
Bayesian inference (MrBayes) tree (s.d.< 0.01) of the A. thaliana NPF family with NPF names in parentheses as previously annotated (Léran et al., 2014). Green circles at nodes represent a posterior probability of 1 (maximum is 1). Values at nodes separated by a backslash represent MrBayes values below 1 in red, followed by RAxML generated bootstrap values in black (only reported when Mrbayes value is below 1). Scale bar indicates number of substitutions per site.
Figure 2 with 2 supplements
Biochemical characterization of the indole-specific glucosinolate transporter GTR3.
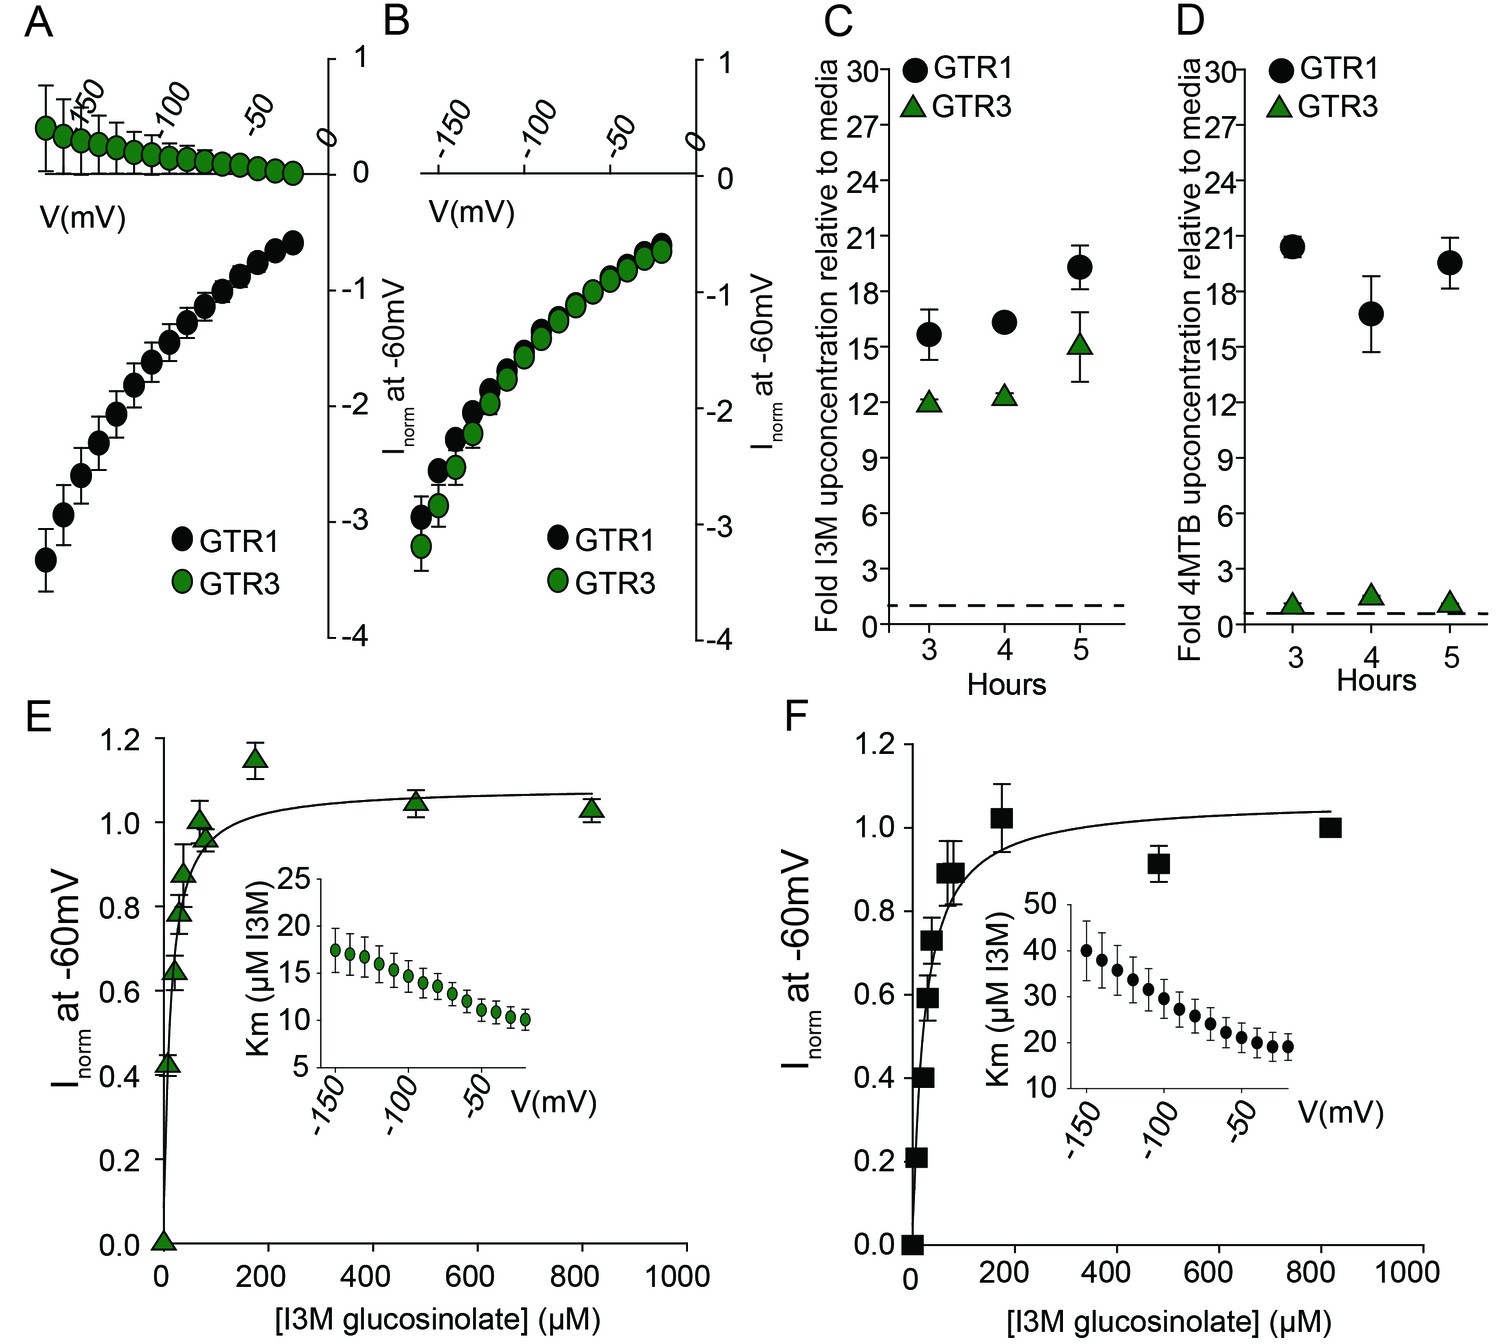
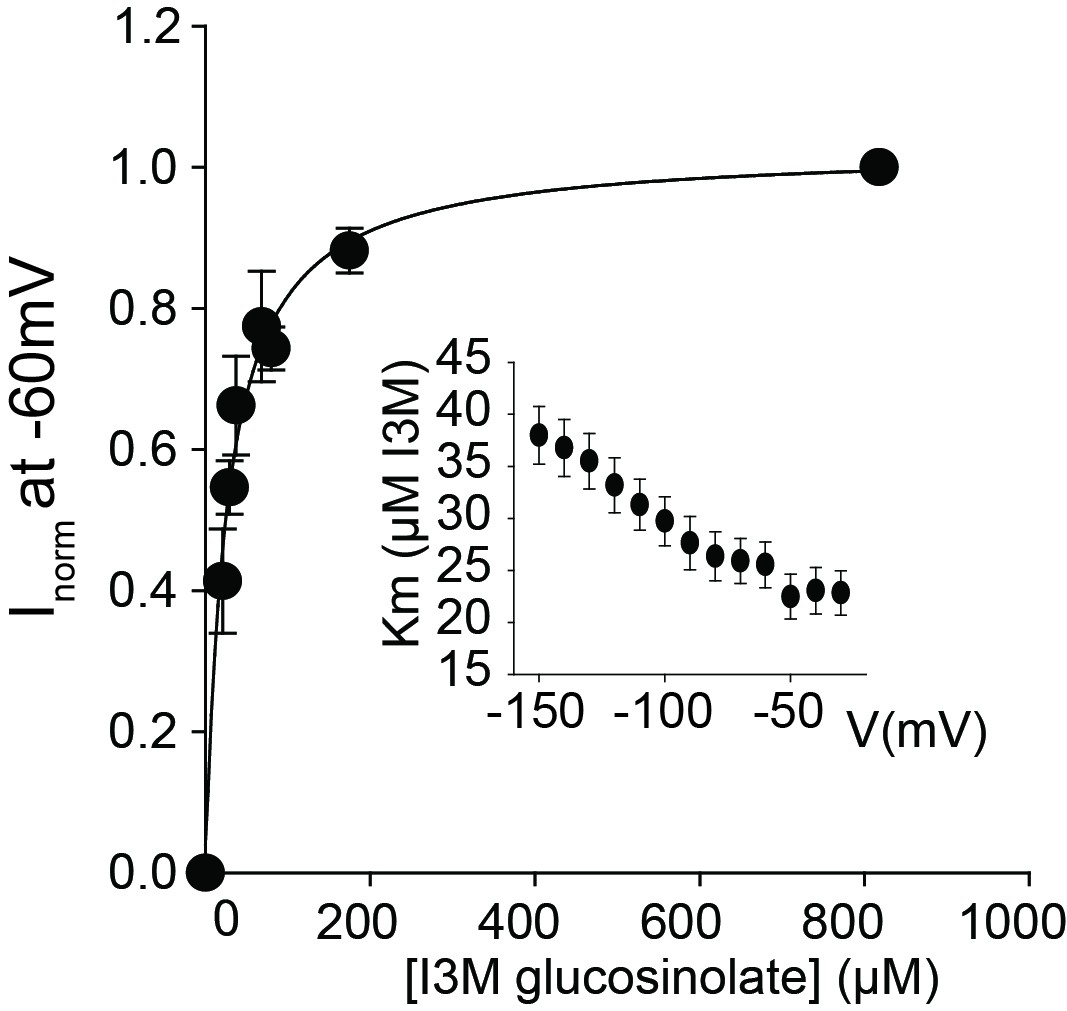
(A–B) Normalized IV (Current-Voltage) curve of 4MTB (A)- and I3M (B)-induced currents for GTR1 (black circles)- and GTR3 (green circles)-expressing oocytes exposed to 100 µM substrate at pH5. Both GTR1 and GTR3 currents were normalized to GTR1 currents elicited at saturating 4MTB concentrations and at a membrane potential of −60 mV (Error bars represent ± s.e., n = 6, experiment repeated two times). (C–D) Time-dependent accumulation of I3M (C) and 4MTB (D), respectively, relative to assay media concentration in GTR1- and GTR3-expressing oocytes. Accumulated 4MTB or I3M were quantified by LC-MS in 3 × 5 oocytes for each gene after 3, 4 and 5 hr of incubation in a standard pH5 Kulori buffer containing 0.2 mM I3M or 0.2 mM 4MTB (error bars represent ± s.d. n = 3). Dotted line represents media concentration. (E–F) Normalized I3M-induced currents for GTR3 (E) or GTR1 (F) measured at a membrane potential of −60 mV and pH 5 plotted against increasing I3M concentrations. The saturation curve was fitted with a Michaelis-Menten equation represented by a solid line. Each oocyte dataset was normalized to currents elicited at 0.8 mM I3M concentration at −60 mV. The insert shows the apparent Km as a function of membrane potential. Error bars represent ± s.e. of mean, n = 6, experiment repeated two times.
Figure 2—figure supplement 1
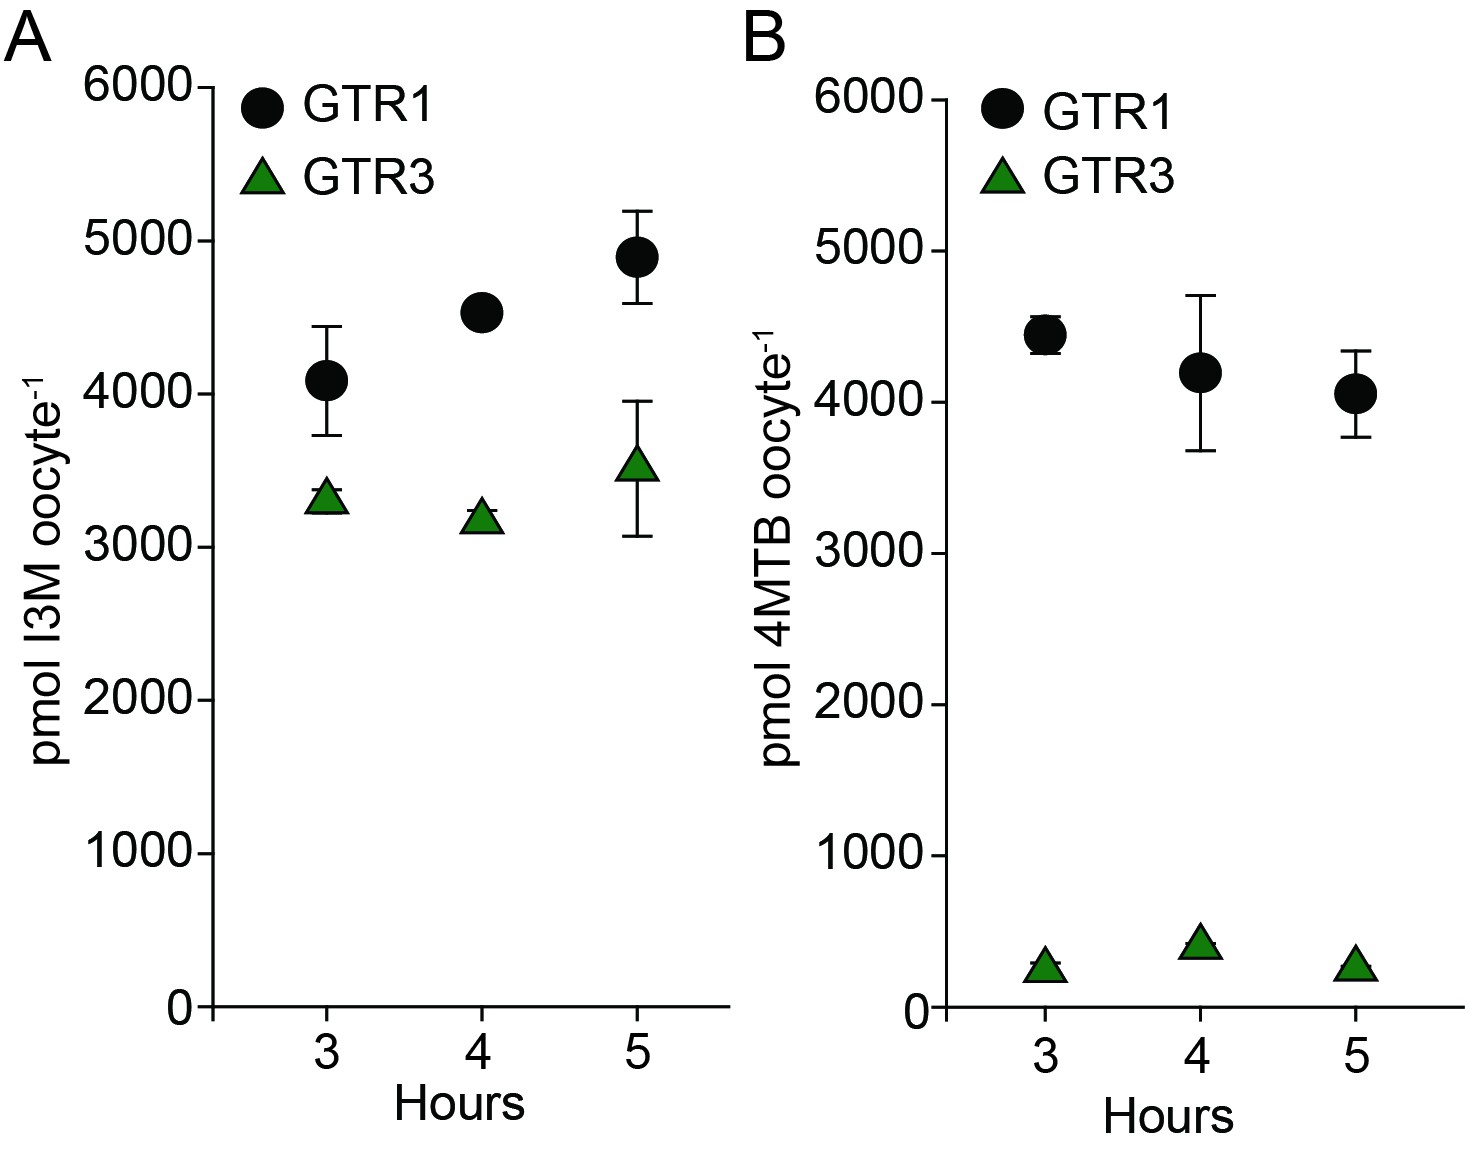
Uptake of 4MTB and I3M by GTR1 and GTR3 expressed in X. laevis oocytes.
(A–B) Time-dependent I3M (A) and 4MTB (B) uptake by GTR1- and GTR3-expressing oocytes. This data was shown in Figure 2 as up-concentration relative to assay media concentration. Here substrate amounts are shown in pmol per oocyte. Accumulated 4MTB or I3M was quantified by LC-MS in 3 × 5 oocytes for each gene after 3, 4 and 5 hr of incubation in a standard pH5 kulori buffer containing 0.2M I3M or 0.2 µM 4MTB. Error bars represent ± s.d. of mean for data, n = 3.
Figure 2—figure supplement 2
GTR2 indole glucosinolate Km measurement.
Normalized I3M-induced currents of GTR2-expressing oocytes measured at a membrane potential of −60 mV and pH 5 were plotted against increasing I3M concentrations. The saturation curve was fitted with a Michaelis-Menten equation – represented by a solid line. Insert shows apparent Km as a function of clamped membrane potential. Each oocyte dataset was normalized to I3M-induced currents elicited at 0.8 mM I3M concentration at −60 mV. The insert shows the apparent Km as a function of membrane potential. Error bars represent ± s.e. of mean for data obtained from six different oocytes per experiment, experiment repeated two times.
Figure 3

Substrate competition assays of GTRs in X. laevis oocytes.
(A–D) Competition for uptake of I3M and 4MTB into oocytes expressing GTR1 or GTR3. (A) Quantification of 4MTB uptake when oocytes were exposed to high 4MTB concentration (2 mM) alone or in combination with low concentration of I3M (0.2 mM). (B) Quantification of I3M uptake when low I3M concentration (0.2 mM) was competed with high concentration of 4MTB (2 mM). (C) Quantification of I3M when oocytes were exposed to high I3M concentration (2 mM) alone or in combination with low concentration of 4MTB (0.2 mM). (D) Quantification of 4MTB uptake when oocytes were exposed to low I3M concentration (0.2 mM) alone or in combination with high concentration of 4MTB (2 mM). Accumulated 4MTB (A and D) or I3M (B and C) was quantified by LC-MS in 3 × 5 oocytes for each gene. Two tailed T-test, **p<0.001 vs non-competed, *p<0.05 vs non-competed. NS= not significantly different (Error bars represent ± s.d. of mean for data obtained from three times five different oocytes per experiment). (E–G) Quantification of nitrate and glucosinolate competition assays. (E) Quantification of I3M uptake in GTR3-expressing oocytes when saturating I3M concentration (0.1 mM) is competed with high concentration of NO3- (10 mM) or saturating concentration of 4MTB (0.1 mM). (F) Quantification of 4MTB uptake in GTR3-expressing oocytes when saturating 4MTB concentration (0.1 mM) is competed with high concentration of NO3- (10 mM). (G) Quantification of NO3- uptake in GTR3-expressing oocytes when high concentration of NO3- (10 mM) is competed by 0.1 mM 4MTB or saturating concentration of I3M (0.1 mM). Accumulated I3M (E) or 4MTB (F) was quantified by LC-MS in 3 × 5 oocytes for each gene. Accumulated NO3- (G) was quantified by ICP-MS in three oocytes for each gene. Error bars represent ± s.d. of mean, n = 3. Groups in subfigures are determined by one-way ANOVA followed by Holm-Sidak post-hoc analysis (p<0.05).
Figure 4 with 3 supplements
In planta characterization of the indole-specific glucosinolate transporter GTR3.
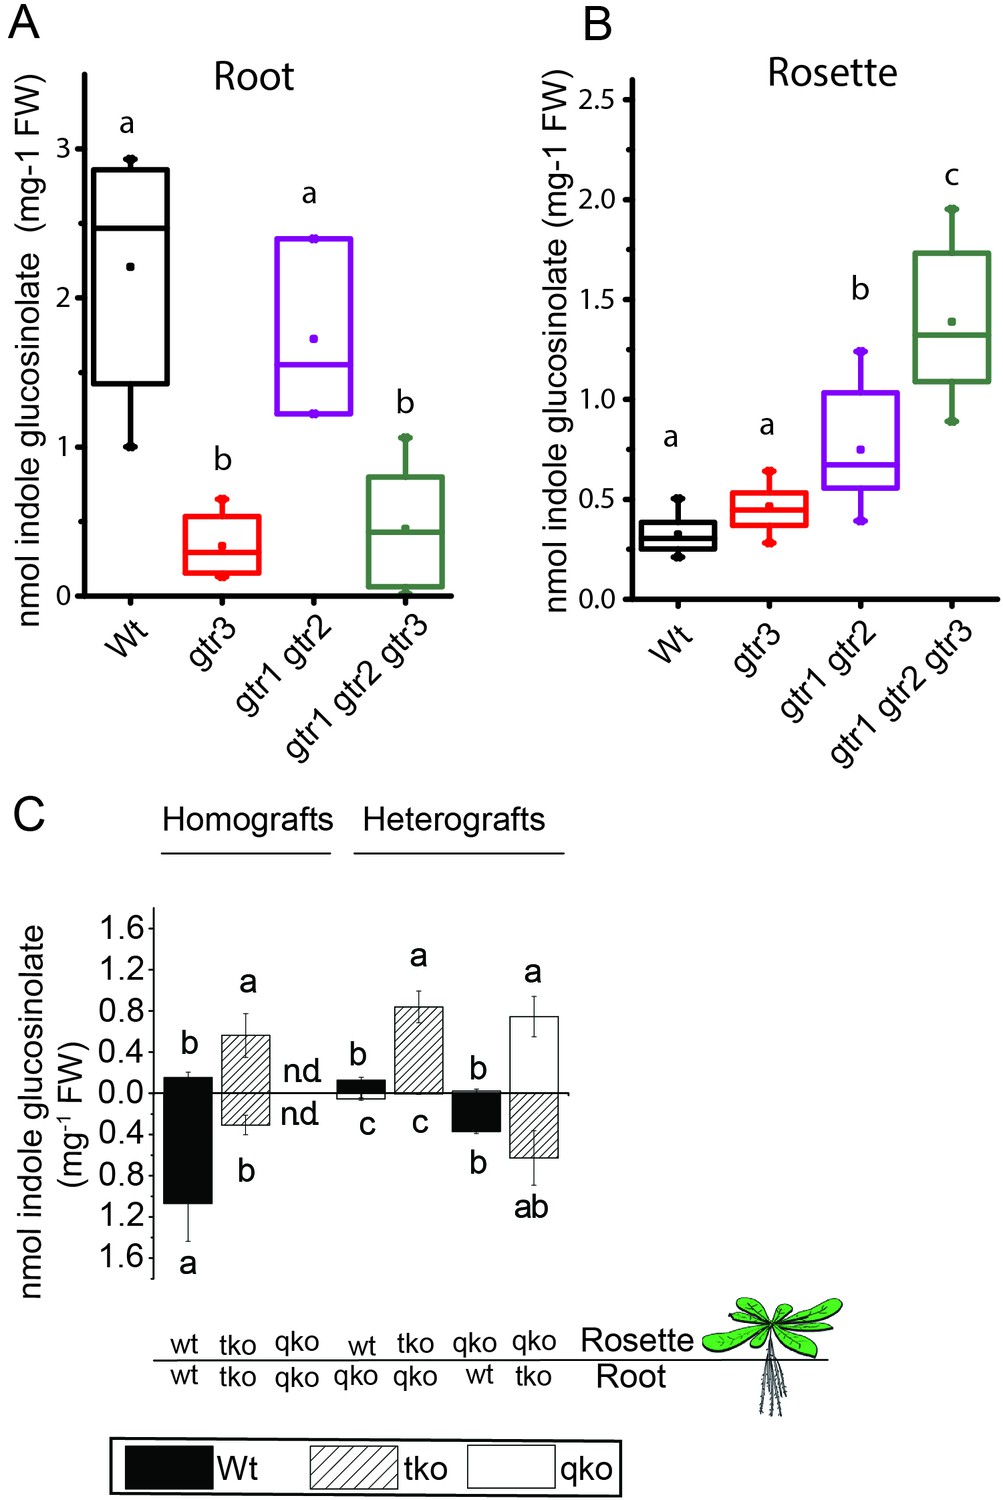
(A–B) Indole glucosinolate content in (A) root and (B) rosette of non-grafted hydroponically grown wildtype, gtr3, gtr1 gtr2 dko and gtr1 gtr2 gtr3 tko plants. The box is determined by the 25th and 75th percentiles. The whiskers are determined by the 5th and 95th percentiles. Median and mean are shown as line and square. Groups in subfigures are determined by one-way ANOVA followed by Tukey HSD Calculator multiple comparison post-hoc analysis (p<0.05). Data presented is one of two individual experiments, each containing 8–12 repeats (n) (see Figure 4—source data 1–2 for individual glucosinolate data points and individual n; error bars and parentheses are s.d. (C) Indole glucosinolate concentrations of micro-grafted 3-week-old plate-grown Arabidopsis wildtype (Col-0) and mutants. Rosettes and roots from wild type (wt), the glucosinolate biosynthesis null mutant myb28 myb29 cyp79b2 cyp79b3 (qko) and the gtr1 gtr2 gtr3 mutant (tko) were reciprocally grafted using 4-day-old seedlings. Glucosinolate content in the rosette and roots was quantified by LC-MS in 3-week-old plants. Data presented is one of two individual experiments, each containing 8–16 repeats (n) (see Figure 4—source data 3–4 for individual glucosinolate data points and individual n; error bars and parentheses are s.d. Groups in subfigures are determined by one-way ANOVA (p<0.05). n.d. none detected.
-
Figure 4—source data 1
Glucosinolate content in rosettes of hydroponically grown wildtype, gtr3, gtr1 gtr2 dko and gtr1 gtr2 gtr3 tko plants.
Glucosinolate content in rosettes of three-week-old hydroponically grown plants determined by LC-MS. Data presented is one of two individual experiments. Data are given as means and standard deviation (SD) for individual glucosinolates (nmoles/mg FW), total short-chained aliphatic glucosinolates (SC), total long-chained aliphatic glucosinolates (LC), total aliphatic glucosinolates (AG) and total indole glucosinolates (IG). Differences were tested by ANOVA followed by Post-hoc Tukey HSD Calculator multiple comparison (3mtp, 3-methylthiobutylglucosinolate; 3msp, 3-methylsulfinylpropylglucosinolate; 4mtb, 4-methylthiobutylglucosinolate; 4msb, 4-methylsulfinylbutylglucosinolate;5msp,5-methylsulfinylpentylglucosinolate;7mth,7-(methylthio)heptylglucosinolate,7msh,7-ethylsulfinylheptylglucosinolate;8mso, 8-methylsulfinyloctylglucosinolate; I3M, indol-3-ylmethylglucosinolate; 4MOI3M, 4-methoxy-indol-3-ylmethylglucosinolate; NMOI3M, n,-methoxyindol-3-ylmethylglucosinolate).
- https://doi.org/10.7554/eLife.19466.010
-
Figure 4—source data 2
Glucosinolate content in roots of hydroponically grown wildtype, gtr3, gtr1 gtr2 dko and gtr1 gtr2 gtr3 tko plants.
Glucosinolate content in roots of three-week-old hydroponically grown plants determined by LC-MS. Data presented is one of two individual experiments. Data are given as means and standard deviation (SD) for individual glucosinolates (nmoles/mg FW), total short-chained aliphatic glucosinolates (SC), total long-chained aliphatic glucosinolates (LC), total aliphatic glucosinolates (AG) and total indole glucosinolates (IG). Differences were tested by ANOVA followed by Post-hoc Tukey HSD Calculator multiple comparison (3mtp, 3-methylthiobutylglucosinolate; 3msp, 3-methylsulfinylpropylglucosinolate; 4mtb, 4-methylthiobutylglucosinolate; 4msb, 4-methylsulfinylbutylglucosinolate;5msp,5-methylsulfinylpentylglucosinolate;7mth,7-(methylthio)heptylglucosinolate,7msh,7-ethylsulfinylheptylglucosinolate;8mso, 8-methylsulfinyloctylglucosinolate; I3M, indol-3-ylmethylglucosinolate; 4MOI3M, 4-methoxy-indol-3-ylmethylglucosinolate; NMOI3M, n,-methoxyindol-3-ylmethylglucosinolate).
- https://doi.org/10.7554/eLife.19466.011
-
Figure 4—source data 3
Glucosinolate content in rosettes of micro-grafted plants.
Glucosinolate content in rosettes of three-week-old micro-grafted plants determined by LC-MS. Data presented is one of two individual experiments. Data are given as means and standard deviation (SD) for individual glucosinolates (nmoles/mg FW), total short-chained aliphatic glucosinolates (SC), total long-chained aliphatic glucosinolates (LC), total aliphatic glucosinolates (AG) and total indole glucosinolates (IG). Differences were tested by ANOVA followed by Post-hoc Tukey HSD Calculator multiple comparison (3mtp, 3-methylthiobutylglucosinolate; 3msp, 3-methylsulfinylpropylglucosinolate; 4mtb, 4-methylthiobutylglucosinolate; 4msb, 4-methylsulfinylbutylglucosinolate;5msp,5-methylsulfinylpentylglucosinolate;7mth,7-(methylthio)heptylglucosinolate,7msh,7-ethylsulfinylheptylglucosinolate;8mso, 8-methylsulfinyloctylglucosinolate; I3M, indol-3-ylmethylglucosinolate; 4MOI3M, 4-methoxy-indol-3-ylmethylglucosinolate; NMOI3M, n,-methoxyindol-3-ylmethylglucosinolate).
- https://doi.org/10.7554/eLife.19466.012
-
Figure 4—source data 4
Glucosinolate content in roots of micro-grafted plants.
Glucosinolate content in roots of three-week-old micro-grafted plants determined by LC-MS. Data presented is one of two individual experiments. Data are given as means and standard deviation (SD) for individual glucosinolates (nmoles/mg FW). total short-chained aliphatic glucosinolates (SC). Total long-chained aliphatic glucosinolates (LC). total aliphatic glucosinolates (AG) and total indole glucosinolates (IG). Differences were tested by ANOVA followed by Post-hoc Tukey HSD Calculator multiple comparison (3mtp. 3-methylthiobutylglucosinolate; 3msp. 3-methylsulfinylpropylglucosinolate; 4mtb. 4-methylthiobutylglucosinolate; 4msb. 4-methylsulfinylbutylglucosinolate;5msp.5-methylsulfinylpentylglucosinolate;7mth.7-(methylthio)heptylglucosinolate.7msh.7-ethylsulfinylheptylglucosinolate;8mso. 8-methylsulfinyloctylglucosinolate; I3M. indol-3-ylmethylglucosinolate; 4MOI3M. 4-methoxy-indol-3-ylmethylglucosinolate; NMOI3M. n.-methoxyindol-3-ylmethylglucosinolate).
- https://doi.org/10.7554/eLife.19466.013
Figure 4—figure supplement 1
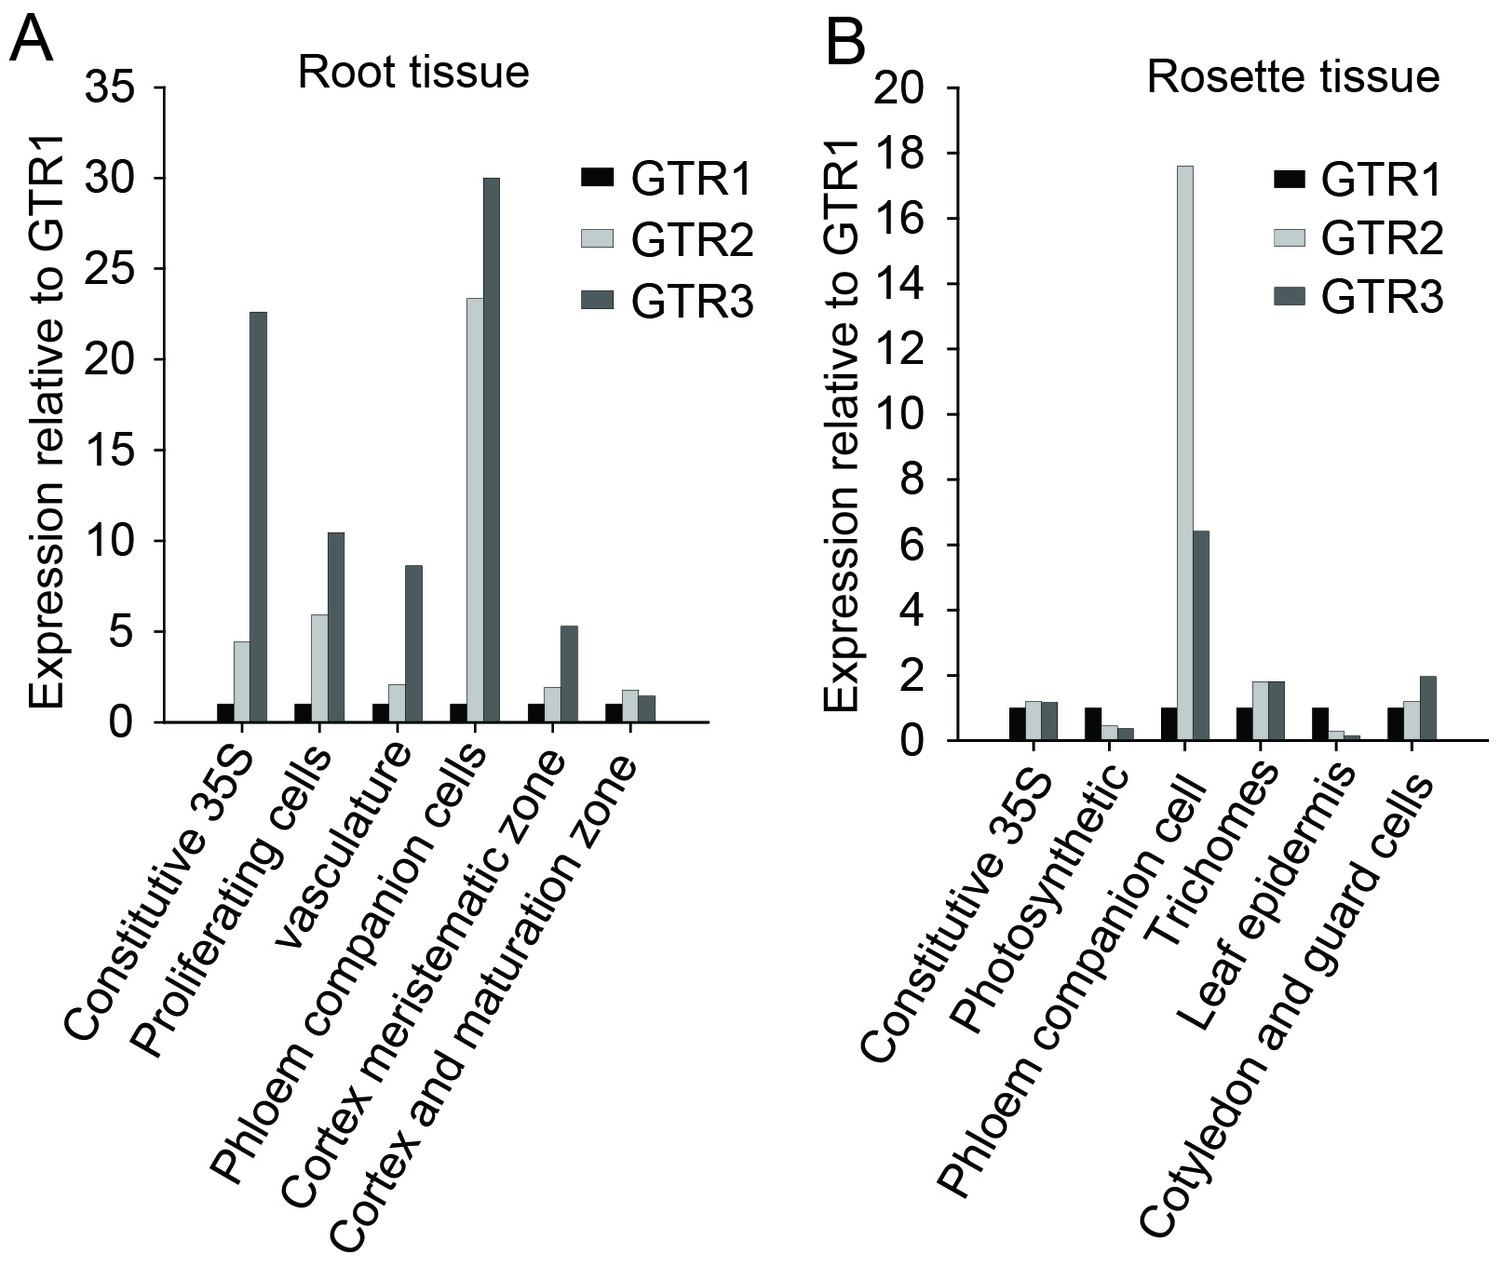
In silico expression analysis of the indole-specific glucosinolate transporter GTR3 and the broad-specificity GTR1 and GTR2 transporters.
(A–B) Cell type-specific expression of GTR2 and GTR3 relative to GTR1 expression in (A) shoot and (B) root tissue of 7-day-old Arabidopsis seedlings. Data was retrieved from microarray studies of RNA bound to ribosomes that were immunoprecipitated by use of epitope-tagged ribosomal protein from seedlings (Mustroph et al., 2009). Cell type-specific expression of GTR1, GTR2 and GTR3 was inferred based on co-expression with the genes whose promoters were used for driving the ribosomal affinity tag (Mustroph et al., 2009).
Figure 4—figure supplement 2
In planta characterization of the indole-specific glucosinolate transporter GTR3 – aliphatic glucosinolate data.
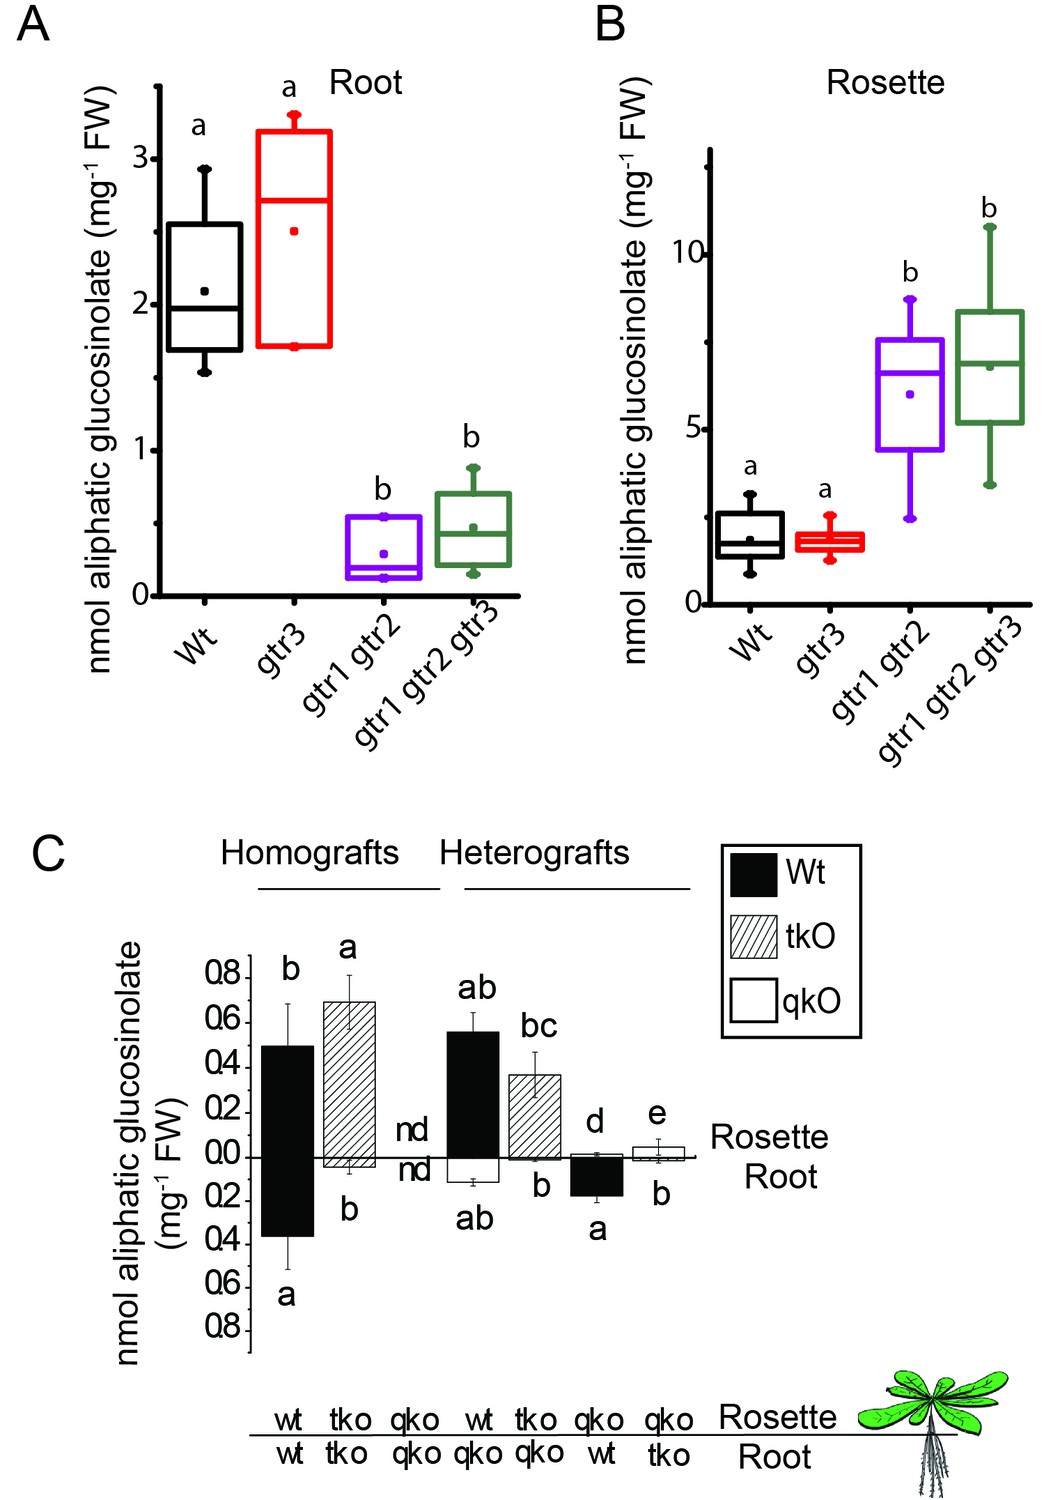
Aliphatic glucosinolate concentration of roots (A) and rosettes (B) of 3-week-old hydroponically grown A. thaliana wildtype (Col-0), gtr3, gtr1 gtr2 and gtr1 gtr2 gtr3 plants. For individual glucosinolate data see Figure 4—source data 1–2. The box is determined by the 25th and 75th percentiles. The whiskers are determined by the 5th and 95th percentiles. Median and mean are shown as line and square. Groups in subfigures are determined by one-way ANOVA followed by Tukey HSD Calculator multiple comparison post-hoc analysis (p<0.05). Data presented is one of two individual experiments, each containing 8–12 repeats (n) (see Figure 4—source data 1–2 for individual glucosinolate data points and individual n; error bars and parentheses are s.d. Post-hoc Tukey HSD Calculator multiple comparison (p<0.05). n.d. none detected. (C) Aliphatic glucosinolate concentration of rosettes and roots of 3-week-old hydroponically grown reciprocally micro-grafted wild type (wt), myb28 myb29 cyp79b2 cyp79b3 glucosinolate biosynthesis null mutant (qko) and gtr1 gtr2 gtr3 (tko). Rosettes and roots from wild type wt, qko and tko plants were reciprocally grafted using 4-day-old seedlings. The grafts are shown as the genotype of rosette and roots, respectively. Aliphatic glucosinolate content in the rosette and roots was quantified by LC-MS in 3-week-old plants. Data presented is one of two individual experiments, each containing 8–16 repeats (n) (see Figure 4—source data 3–4 for individual glucosinolate data points and individual n; error bars and parentheses are s.d. Groups in subfigures are determined by one-way ANOVA followed by Tukey HSD Calculator multiple comparison post-hoc analysis (p<0.05). nd none detected.
Figure 4—figure supplement 3
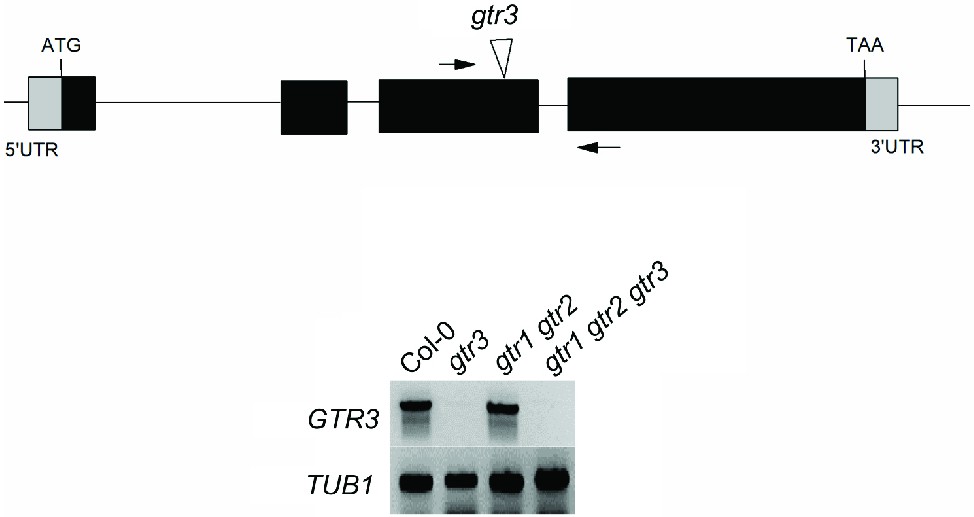
Validation of gtr3 T-DNA insertion mutants.
Genomic location of T-DNA insertion in gtr3. Arrows indicate location of RT-PCR primers. RT-PCR analysis on RNA isolated from wild type Col-0, gtr3, gtr1 gtr2, gtr1gtr2 gtr3 using GTR3-specific primers. TUB1 (AT1G75780)-specific primers were used as internal control. See Supplementary Materials and methods for primer sequences.
Figure 5 with 3 supplements
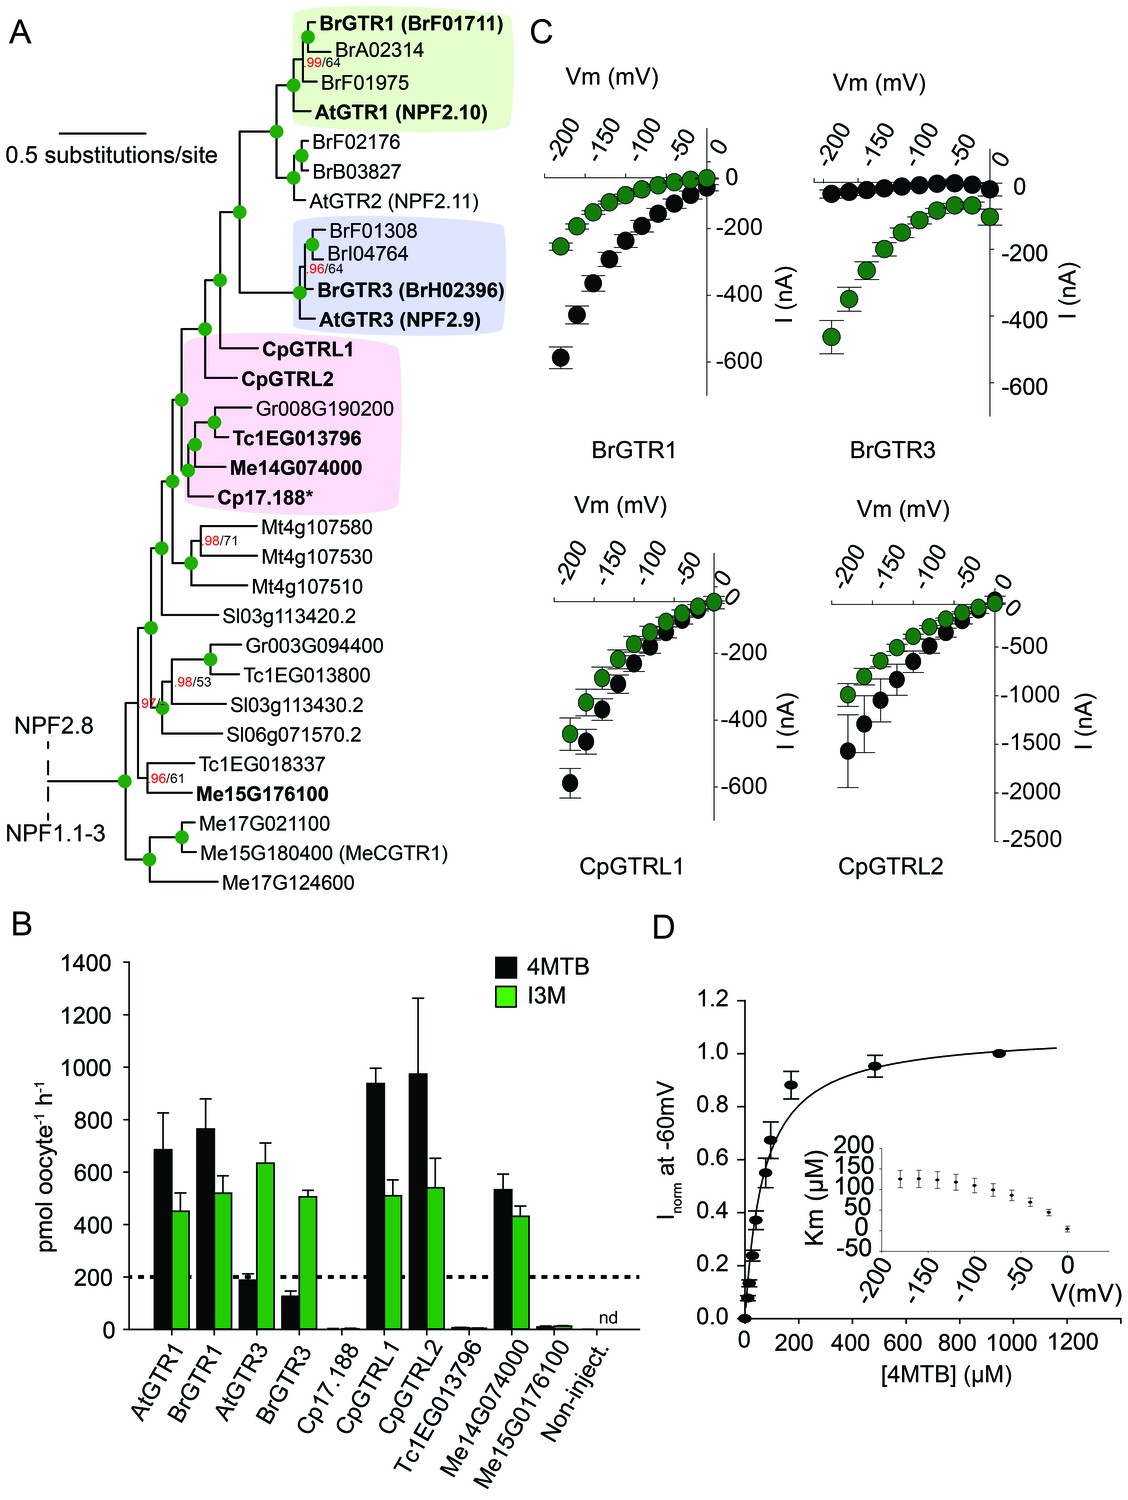
Phylogenetic relationship and transport specificity of GTR homologs from selected species.
(A) Selected part of Bayesian inference (MrBayes) tree (s.d. < 0.01) of GTR homologs from selected species (Full phylogenetic tree of NPFs from selected species is found as Figure 5—figure supplement 1). Green circles at nodes represent a posterior probability of 1 (maximum is 1). Values at nodes separated by a backslash represent MrBayes values below 1 in red, followed by RAxML generated bootstrap values in black (only reported when Mrbayes value is below 1). Asterix indicates that Cp17.188 lacks the highly conserved EXXE[R/K] motif involved in proton-coupling (Jørgensen et al., 2015). Subclades with green, purple and pink background denote the GTR1 subclade, GTR3 subclade and GTR-like subclade (genes that cluster with GTR homologs from C.papaya), respectively. Genes in bold were tested for glucosinolate transport in B). (B) Uptake of 4MTB and I3M by X. laevis oocytes expressing selected GTR homologs (bold) from A. thaliana, B. rapa, C. papaya, T. cacao and M. esculenta from the colored subclades and Me15G176100, which clusters outside the GTR-like subclade). Genes were expressed individually in X. laevis oocytes and transport activity was measured in the presence of 0.2 mM 4MTB (black bars) or 0.2 mM I3M (green bars) at external pH 5. Dotted line represents substrate concentration in external media. Accumulated 4MTB or I3M was quantified by LC-MS in 5 × 1 oocytes for each gene (Error bars represent ± s.d. of mean, n = 5, experiment repeated two times). (C) 4MTB (black circles)- and I3M (green circles)-induced currents in oocytes expressing GTR homologs that showed glucosinolate uptake in B). Expressing oocytes were exposed to 0.2 mM 4MTB or I3M and induced currents were measured at membrane potentials clamped between 0 mV and −180 mV in 20 mV increments at pH 5 (Error bars represent ± s.d. of mean, n = 4, experiment repeated two times). (D) Normalized 4MTB-induced currents of CpGTRL2 (Cp17.190) measured at a membrane potential of −60 mV at pH 5 plotted against increasing 4MTB concentrations. The saturation curve was fitted with a Michaelis-Menten equation represented by a solid line (Error bars represent ± s.d. of mean for data obtained from four different oocytes per experiment). Each oocyte dataset was normalized to currents elicited at 1 mM 4MTB concentration at −60 mV. The insert shows the apparent Km as a function of membrane potential.
Figure 5—figure supplement 1

Phylogenetic relationships of NPF transporters from selected species.
Bayesian inference (MrBayes) tree (s.d.< 0.01) of NPF transporters from selected species. Green circles at nodes represent a posterior probability of 1 (maximum is 1). Values at nodes separated by a backslash represent MrBayes values below 1 in red, followed by RAxML generated bootstrap values in black (only reported when Mrbayes value is below 1). Scale bar indicates number of substitutions per site.
Figure 5—figure supplement 2
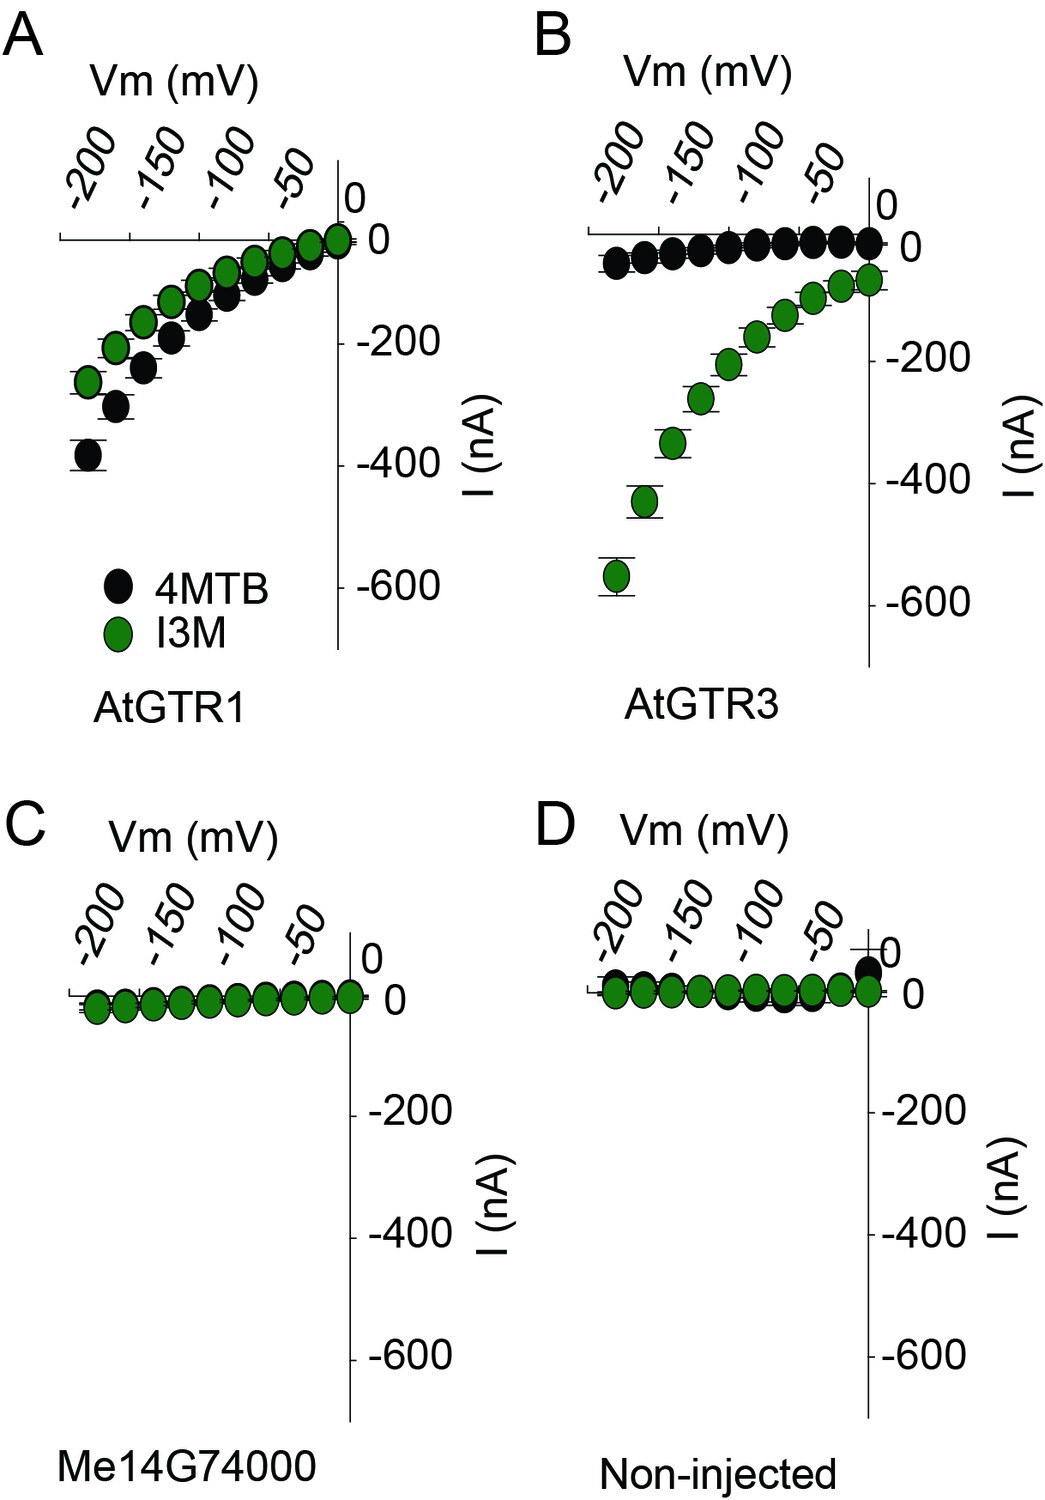
TEVC electrophysiology measurements of AtGTR1, AtGTR3 and Me15G74000.
(A–D) 4MTB (black circles)- and I3M (green circles)-induced currents in oocytes expressing GTR homologs that showed glucosinolate uptake in Figure 5B. Expressing and non-expressing oocytes were exposed to 0.2 mM 4MTB or I3M and induced currents were measured at membrane potentials between 0 mV and −180 mV in 20 mV increments at pH5 (Error bars represent ± s.d. of mean for data obtained from four different oocytes per experiment, experiment repeated two times).
Figure 5—figure supplement 3
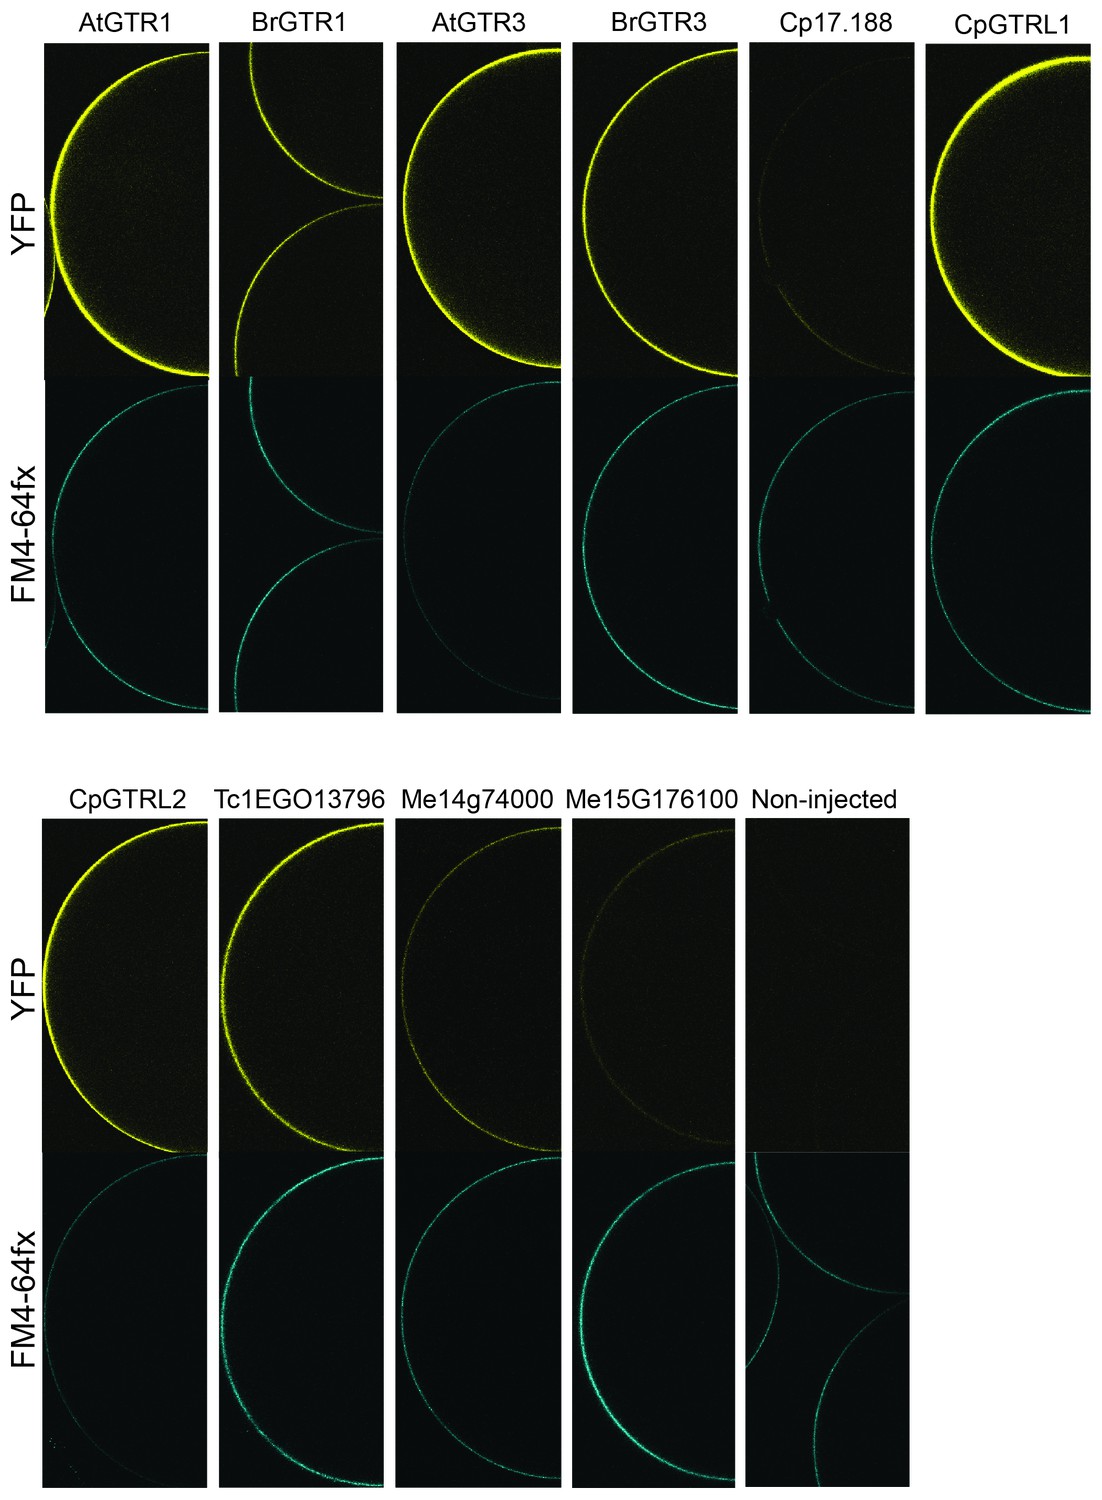
Expression analysis of YFP-tagged (C-terminal) GTRs and GTR homologs from B. rapa, C. papaya, T. cacao and cassava in X. laevis oocytes.
YFP fluorescence in yellow (top) and the plasmamembrane-staining dye FM4-64fx in blue (bottom). Shown are representative images of at least three oocytes.
Figure 6 with 3 supplements
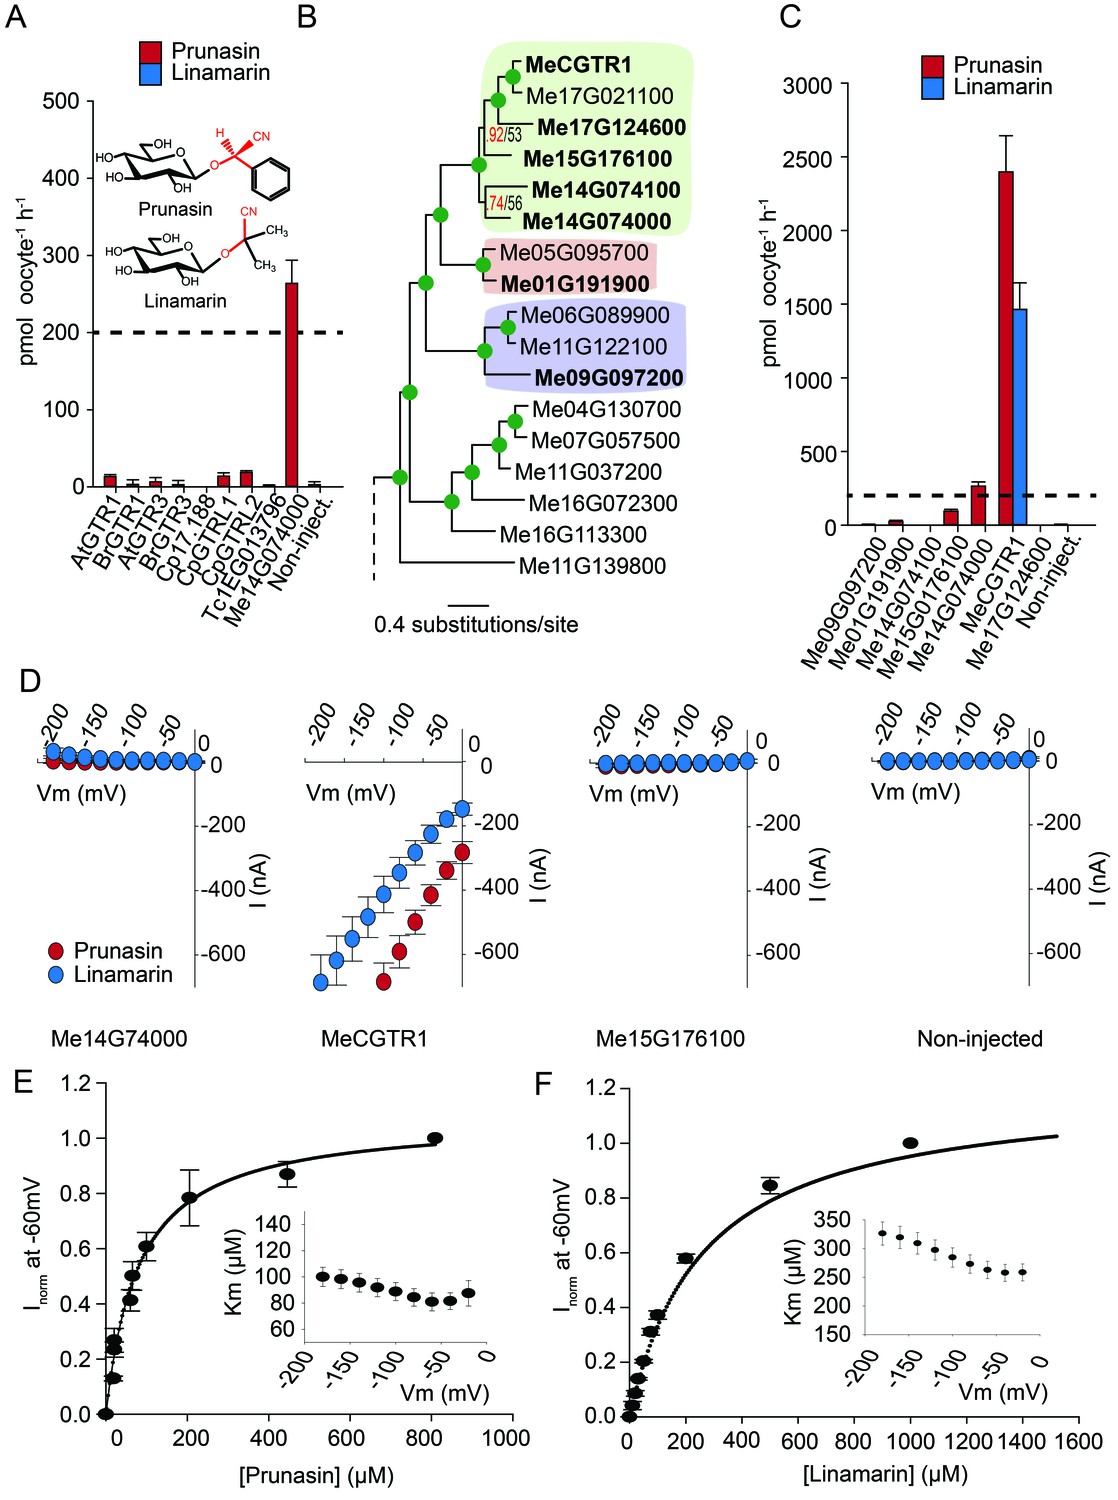
Biochemical characterization of cyanogenic glucoside NPF transporters.
(A) Uptake of prunasin and linamarin in X. laevis oocytes expressing GTR homologs from A. thaliana, B. rapa, C. papaya, T. cacao and M.esculenta. Genes were expressed individually in X. laevis oocytes and transport activity was measured in the presence of 0.2 mM prunasin (red bars) or linamarin (blue bars). Accumulated prunasin or linamarin were quantified by LC-MS in 5 × 1 oocytes for each gene (Error bars represent ±s.d. of mean for data obtained from five different oocytes per experiment, experiment repeated two times). Dotted line represents media substrate concentration. None of the genes accumulated linamarin to detectable levels. (B) Bayesian inference tree (MrBayes tree) showing selected part of M. esculenta NPF phylogenetic tree (closest homologs of Me14G074000). Green circles at nodes represent a posterior probability of 1 (maximum is 1). Values at nodes separated by a backslash represent MrBayes values below 1 in red, followed by RAxML generated bootstrap values in black (only reported when Mrbayes value is below 1). Scale bar indicates number of substitutions per site. Subclades coloured green, pink and purple mark genes that cluster with GTRs, NPF2.12/13 and NPF2.8, respectively, in Figure 5—figure supplement 1. Full phylogenetic tree of M.esculenta NPFs is found as Figure 6—figure supplement 2. Genes in bold were assayed for prunasin, linamarin, 4MTB and I3M uptake. (C) Accumulation of prunasin and linamarin in X.laevis oocytes expressing closest homologs of Me14G074000 from M. esculenta. Genes were expressed individually in X. laevis oocytes and transport activity was measured in the presence of 0.2 mM prunasin (red bars) or 0.2 mM linamarin (blue bars). Accumulated prunasin or linamarin was quantified by LC-MS in 5 × 1 oocytes for each gene (Error bars represent ± s.d. of mean for data obtained from five different oocytes per experiment, experiment repeated two times). Only MeCGTR1 accumulated linamarin to detectable levels. Dotted line represents substrate concentration in external media. (D) Prunasin (red circles)- and linamarin (blue circles)-induced currents in oocytes expressing Me14G74000, MeCGTR1, Me15G176100 and non-expressing oocytes, respectively. Expressing and non-expressing oocytes were exposed to 0.2 mM prunasin or 0.2 mM linamarin and induced currents were measured at membrane potentials between 0 mV and −180 mV in 20 mV increments at pH5. (E–F) Normalized prunasin (E) or linamarin (F) induced currents elicited in MeCGTR1-expressing oocytes measured at a membrane potential of −60 mV and pH 5 plotted against increasing prunasin (E) or linamarin (F) concentrations. The saturation curve was fitted with a Michaelis-Menten equation represented by a solid line (error bars are s.d.; n = 4). Each oocyte dataset was normalized to currents elicited at 0.8 mM prunasin (E) or 1 mM linamarin (F) concentration at −60 mV. The insert shows the apparent Km as a function of membrane potential (error bars are s.d.; n = 3–4 oocytes).
Figure 6—figure supplement 1
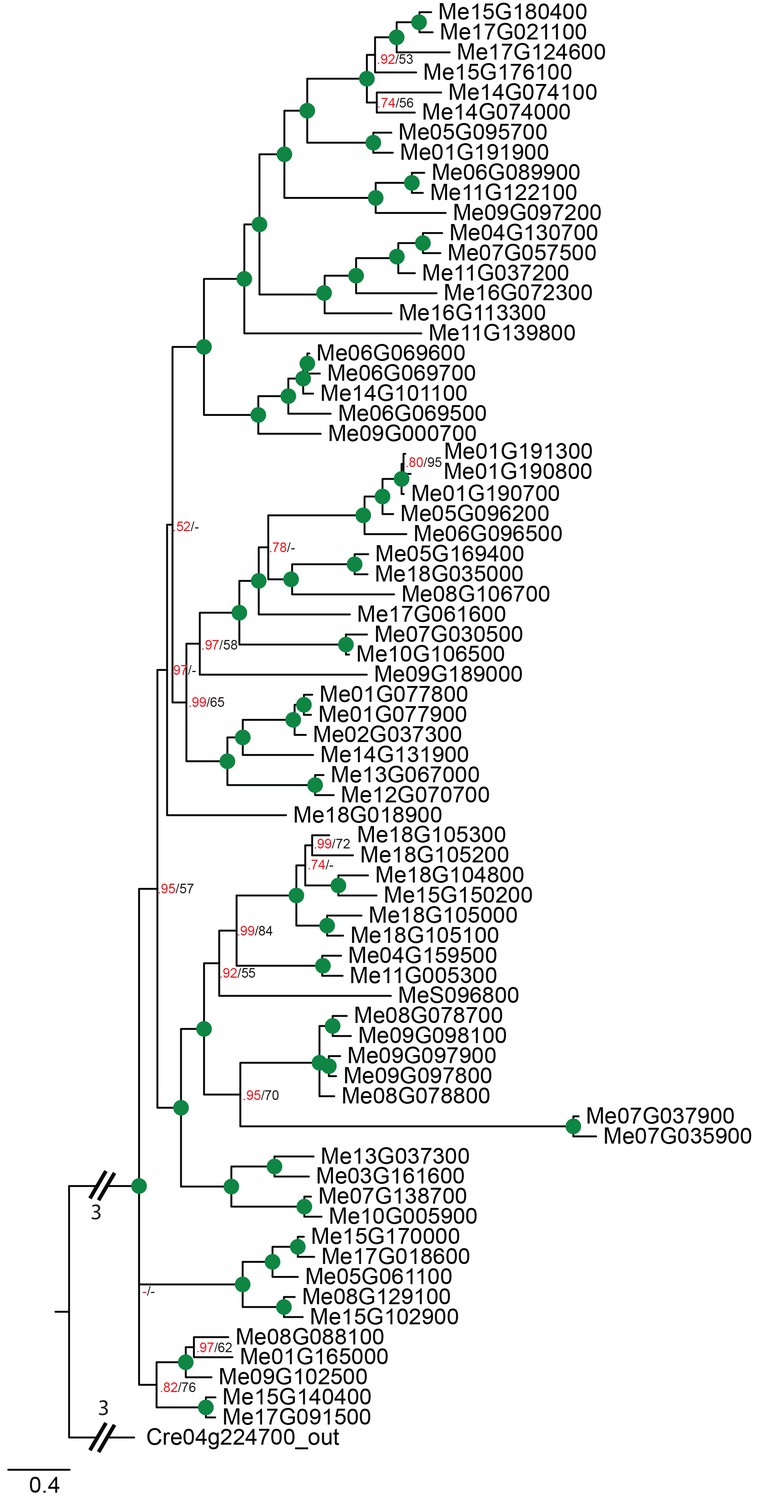
Phylogenetic relationships of cassava NPF transporters.
Bayesian inference (MrBayes) tree (s.d.<0.01) of NPF transporters from Manihot esculenta (cassava). Green circles at nodes represent a posterior probability of 1 (maximum is 1). Values at nodes separated by a backslash represent MrBayes values below 1 in red, followed by RAxML generated bootstrap values in black (only reported when Mrbayes value is below 1). Scale bar indicates number of substitutions per site.
Figure 6—figure supplement 2

Accumulation of 4MTB and I3M in X. laevis oocytes expressing close M. esculenta homologs of Me14G074000.
Genes were expressed individually in X. laevis oocytes and transport activity was measured in the presence of 0.2 mM 4MTB (black bars) or 0.2 mM I3M (green bars). Accumulated 4MTB or I3M was quantified by LC-MS in 5 × 1 oocytes for each gene (Error bars represent ± s.d. of mean for data obtained from five different oocytes per experiment, experiment repeated two times). Dotted line represents media substrate concentration.
Figure 6—figure supplement 3

Expression analysis of YFP-tagged (C-terminal) GTR homologs from cassava in X. laevis oocytes.
YFP fluorescence in yellow (top) and the plasmamembrane-staining dye FM4-64fx in blue (bottom). Shown are representative images of at least three oocytes.
Figure 7
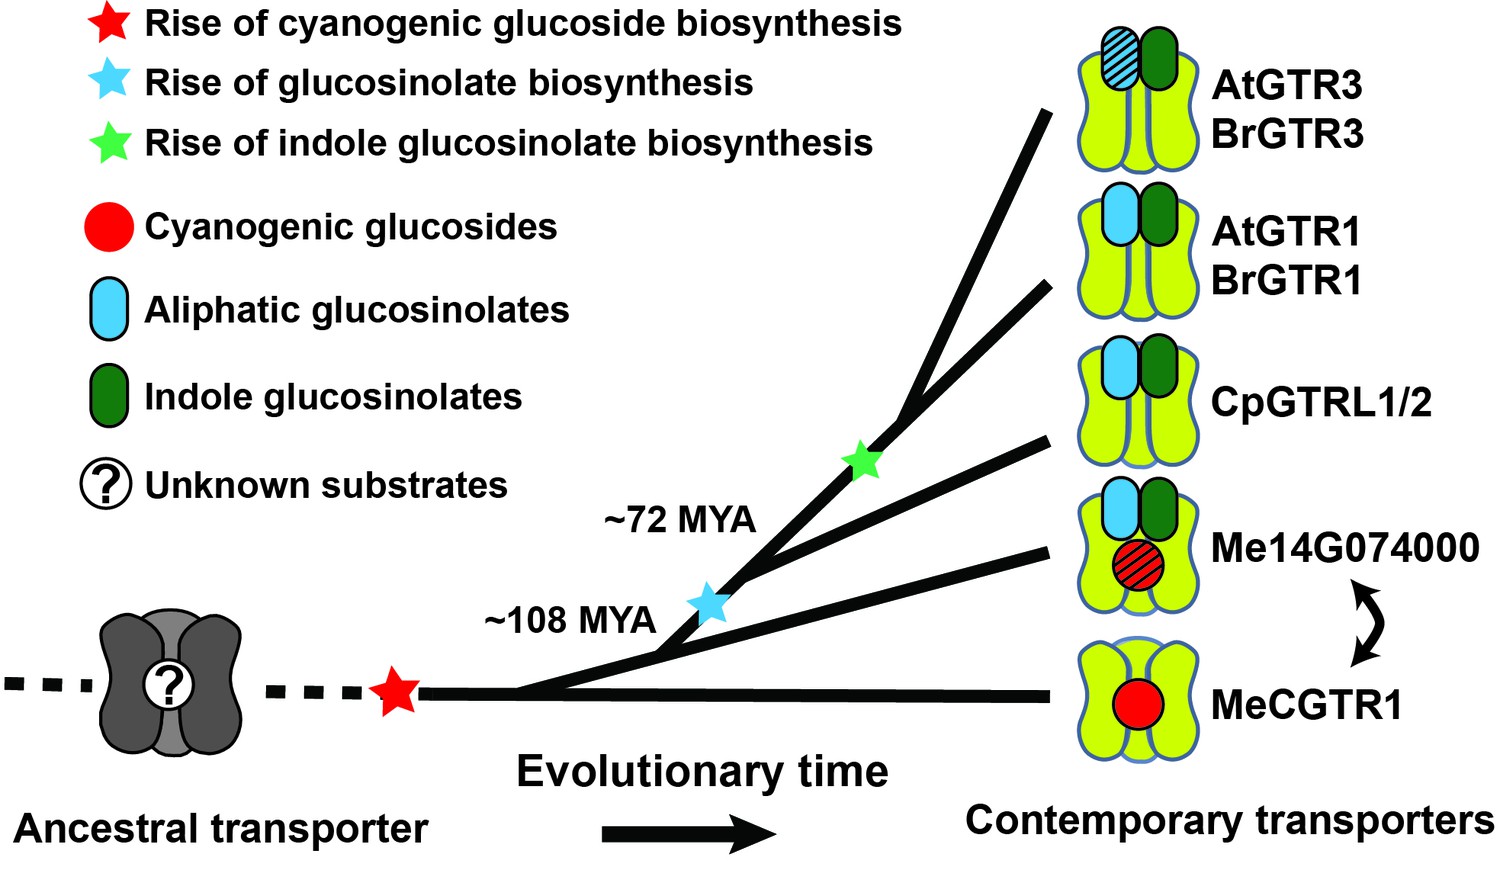
Model of the evolution of the glucosinolate NPF transporter specificity.
We propose that diversification of an ancestral high-affinity cyanogenic glucoside transporter (exemplified by MeCGTR1) lead to a dual-specificity transporter capable of transporting both cyanogenic glucosides and glucosinolates (exemplified by Me14G074000). With the emergence of glucosinolate biosynthesis, high-affinity, broad-specific glucosinolate transporters evolved (exemplified by CpGTRL1/2 and At/BrGTR1), which then further specialized to preferentially transport indole glucosinolates when indole biosynthesis emerged. Bidirectional arrow indicates an alternative model where high-affinity cyanogenic glucoside transporters emerged from the dual-specificity transporter (exemplified by Me14g074000). A. thaliana and C. papaya or M. esculenta diversified 108 MYA (median, 26 studies) or 72.1 MYA (median, 8 studies), respectively (Hedges et al., 2006). Branch points represent likely duplication events that led to new transporter substrate specificities. Striped pattern indicates a transporter that is unable to over-accumulate substrate compared to external media.
Figure 8 with 1 supplement

Putative substrate binding site of GTR1, GTR3, Me14g74000 and MeCGTR1.
Homology modeling of GTR1, GTR3, Me14g74000 and MecGTR1 was carried out using NPF6.3 as template (see Materials and methods for details). Residues P1–13 are shown and color-coded according to legend. In blue mesh is the 3V determined central cavity (Voss and Gerstein, 2010). The inserts show P4, P5 and P6 (see text for discussion).
Figure 8—figure supplement 1

Alignment of glucosinolate and cyanogenic glucoside transporters with NPF6.3 and selected POT transporters.
Amino acid alignment of AtGTR1, AtGTR2, AtGTR3, CpGTRL1, CpGTRL2, Me14g74000 and MeCGTR1 with NPF6.3, PepTSo, PepTSt, PepT1 (human) and PepTGk using MUSCLE (Edgar, 2004) and visualized with JalView (Waterhouse et al., 2009). Residues involved in nitrate and peptide binding are highlighted by a star and numbered P1-P15 (Doki et al., 2013; Solcan et al., 2012; Parker and Newstead, 2014; Sun et al., 2014; Newstead, 2011; Lyons et al., 2014). Helixes are indicated above the alignment and based on NPF6.3 annotation.
Figure 9
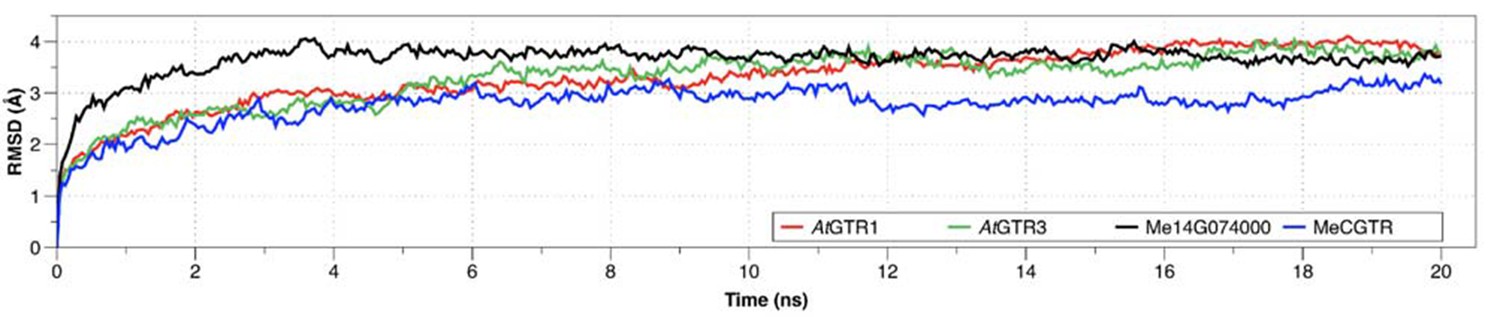
Root-mean square deviations (RMSD) of the position for all backbone atoms of the models 579 from their initial configuration as a function of simulation time.
https://doi.org/10.7554/eLife.19466.029Tables
Table 1
Key peptide and nitrate substrate interacting amino acid residues from selected studies (Doki et al., 2013; Solcan et al., 2012; Parker and Newstead, 2014; Sun et al., 2014; Aduri et al., 2015; Newstead, 2011; Lyons et al., 2014; Jørgensen et al., 2015). Corresponding residues in AtGTR1, AtGTR2, AtGTR3, CpGTRL1, CpGTRL2, Me14g74000 and MeCGTR1 were identified based on the alignment shown in Figure 8—figure supplement 1.
| Position | Function | AtGTR1 | AtGTR2 | AtGTR3 | CpGTRL1 | CpGTRL2 | Me14g74000 | MeCGTR1 | NPF6.3 | PepT1 | PepTSt | PepTGK | PepTS0 | ||
|---|---|---|---|---|---|---|---|---|---|---|---|---|---|---|---|
| P1 | EXXE[R/K] (Doki et al., 2013; Aduri et al., 2015; Jørgensen et al., 2015) | E75 | E57 | E33 | E30 | E49 | E54 | E38 | E41 | E23 | E22 | E32 | E21 | ||
| P2 | EXXE[R/K] (Doki et al., 2013) | E78 | E60 | E36 | E33 | E42 | E57 | E41 | E44 | E26 | E25 | E35 | E24 | ||
| P3 | EXXE[R/K] (Doki et al., 2013) | K79 | K61 | K37 | K34 | K43 | K58 | K42 | R45 | R27 | R26 | R36 | R25 | ||
| P4 | Peptide specificity (Solcan et al., 2012) | I82 | I64 | I40 | I37 | I46 | A61 | T45 | T48 | Y30 | Y29 | Y39 | F28 | ||
| P5 | Peptide specificity (Doki et al., 2013) | I83 | I65 | V41 | I38 | I47 | I62 | V46 | L49 | Y31 | Y30 | Y40 | Y29 | ||
| P6 | Peptide specificity (Doki et al., 2013) | L86 | L68 | S44 | L41 | L50 | L65 | S49 | G52 | R34 | R33 | R43 | R32 | ||
| P7 | Peptide binding (Doki et al., 2013) | N116 | N98 | N74 | N71 | N80 | N95 | N79 | F82 | Y64 | Y68 | Y78 | Y68 | ||
| P8 | Exxer-interactor (Doki et al., 2013) | R196 | R180 | R156 | R152 | R162 | R176 | R161 | K164 | K140 | K126 | K136 | K127 | ||
| P9 | Peptide binding (Doki et al., 2013) | T230 | T214 | T190 | T186 | T196 | T210 | T195 | N198 | N171 | N156 | N166 | N158 | ||
| P10 | Peptidebinding /protonation (Parker and Newstead, 2014; Sun et al., 2014) | I385 | I369 | Y343 | I341 | V351 | I365 | L350 | H356 | F297 | E299 | Q309 | F315 | ||
| P11 | Peptide specificity (Doki et al., 2013) | T386 | T370 | I344 | I342 | I352 | V366 | I351 | A357 | D298 | E300 | E310(Q) | D316 | ||
| P12 | Peptide binding (Doki et al., 2013) | L419 | L403 | L377 | L375 | L385 | V399 | T384 | Y388 | N329 | N328 | N342 | N344 | ||
| P13 | Proton translocation (Doki et al., 2013) | E513 | E497 | D471 | E469 | E479 | E493 | E478 | E476 | E595 | E400 | E413 | E419 |
Download links
A two-part list of links to download the article, or parts of the article, in various formats.
Downloads (link to download the article as PDF)
Open citations (links to open the citations from this article in various online reference manager services)
Cite this article (links to download the citations from this article in formats compatible with various reference manager tools)
Origin and evolution of transporter substrate specificity within the NPF family
eLife 6:e19466.
https://doi.org/10.7554/eLife.19466


