Smad4 restricts differentiation to promote expansion of satellite cell derived progenitors during skeletal muscle regeneration
- University of Rochester Medical Center, United States
Figures
Figure 1
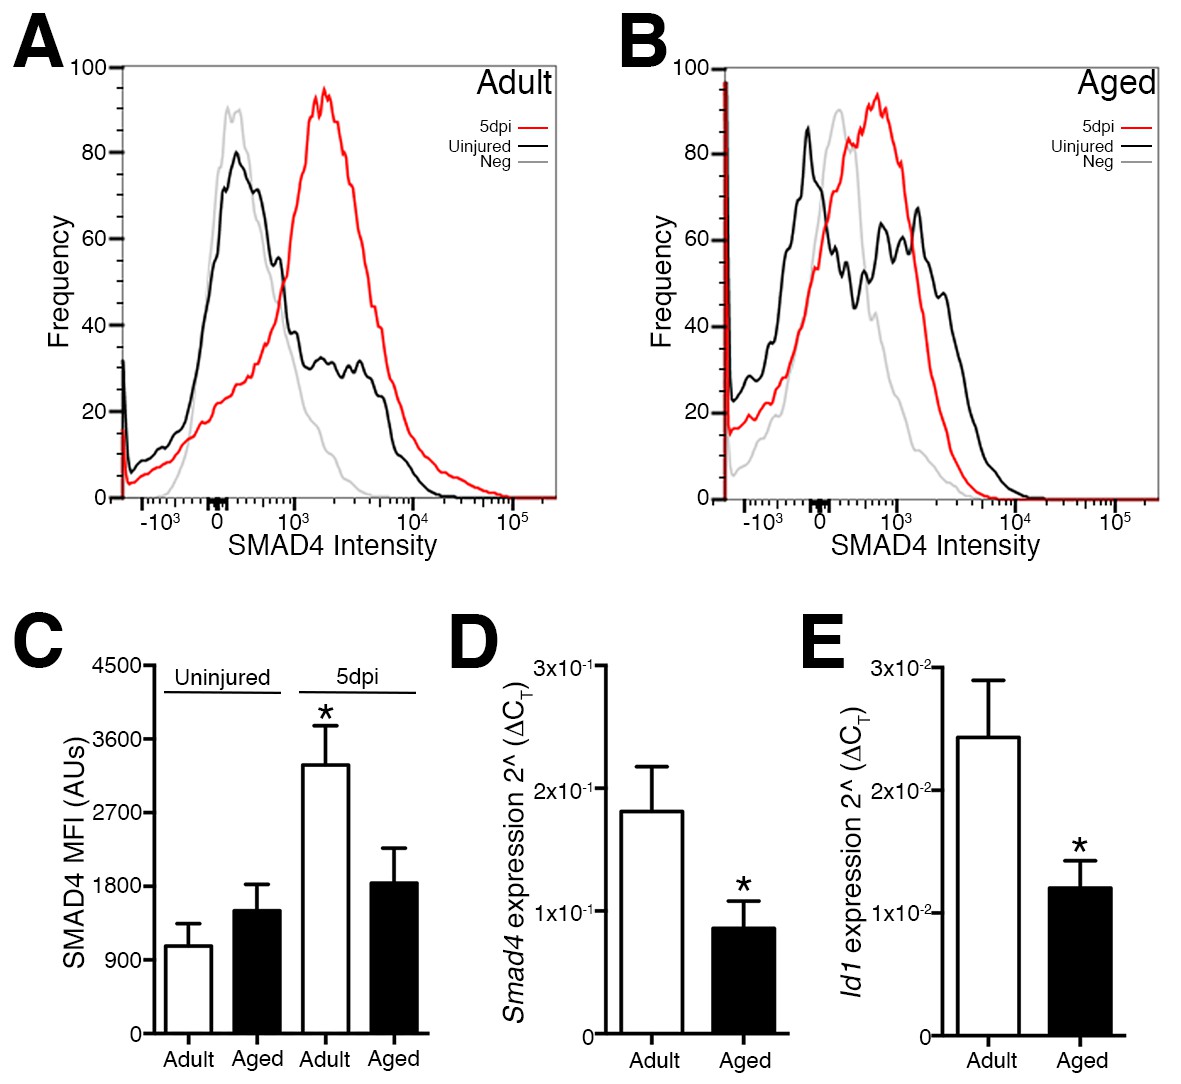
Loss of Smad4 expression in aged satellite cells and myogenic progenitors during muscle regeneration.
Representative profiles of SMAD4 protein levels by flow cytometric analysis in SCs and MPs isolated from C57BL6 (A) adult and (B) aged uninjured and 5-day post injured (5dpi) (TA) muscles. (C) Quantification of SMAD4 protein levels in adult and aged SCs and MPs from uninjured and 5dpi TA muscles. (D) Quantification of Smad4 expression in FACs-sorted SCs and MPs isolated from 5dpi adult and aged TA muscles. (E) Quantification of SMAD target Id1 expression in FACs-sorted SCs and MPs isolated from 5dpi adult and aged TA muscles. N = 4 mice, for (C) *p<0.05 ANOVA and Fisher’s test, (D) and (E) *p<0.05 t-test.
Figure 2 with 1 supplement
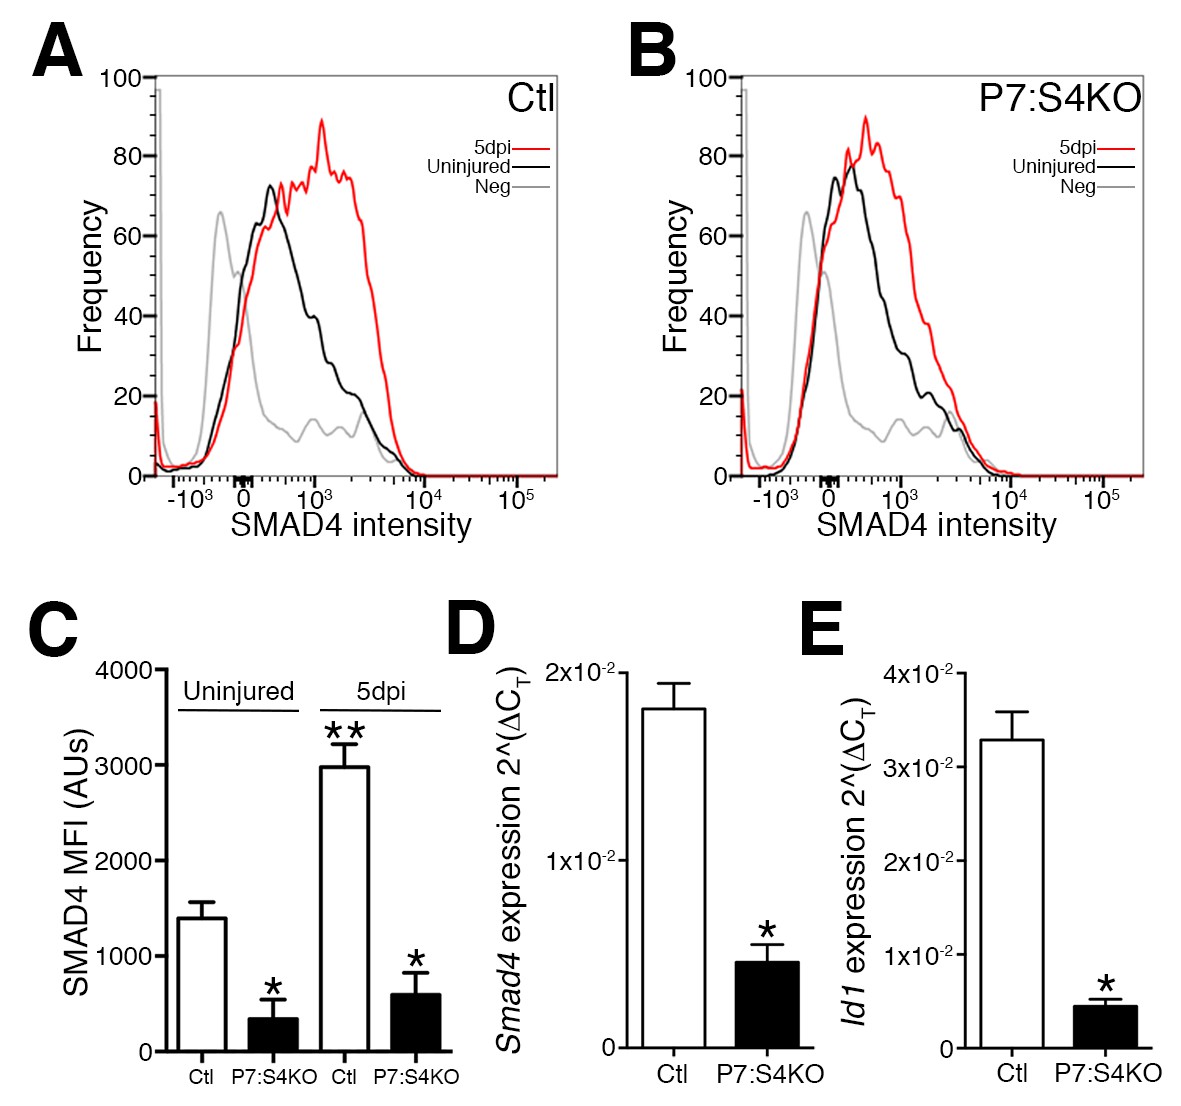
Disruption of Smad4 expression in P7:S4KO satellite cells and myogenic progenitors during muscle regeneration.
Representative profiles of SMAD4 protein levels by flow cytometric analysis in SCs and MPs isolated from adult (A) Ctl and (B) P7:S4KO uninjured and 5dpi TA muscles. (C) Quantification of SMAD4 protein levels by flow cytometry of Ctl and P7:S4KO SCs and MPs from uninjured and 5dpi TA muscles. (D) Quantification of Smad4 expression in FACs-sorted SCs and MPs isolated from 5dpi Ctl and P7:S4KO TA muscles. (E) Quantification of SMAD target Id1 mRNA levels in FACs-sorted SCs and MPs isolated from 5dpi Ctl and P7:S4KO TA muscles. N = 4 mice, for (C) *p<0.05 to Ctl, **p<0.05 Adult Ctl ANOVA and Fisher’s test, for (D) and (E) *p<0.05 t-test.
Figure 2—figure supplement 1
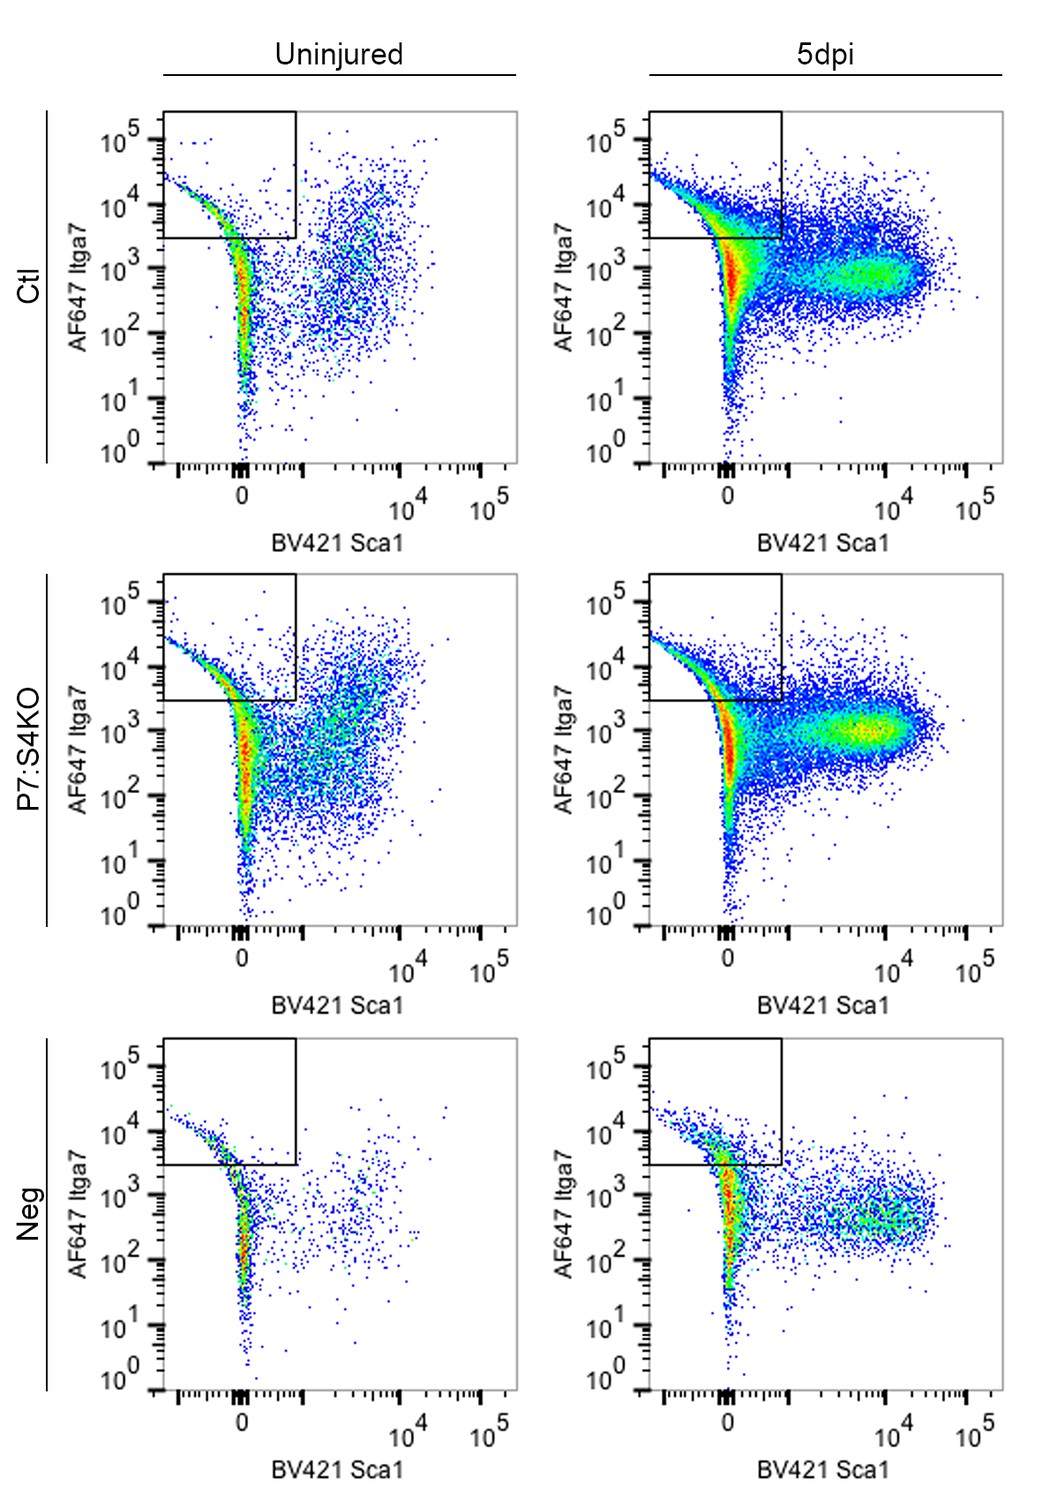
Gating of control and P7:S4KO SCs for intracellular protein analysis.
Representative flow cytometry plots of Ctl and P7:S4KO SCs used to examine SMAD4 protein levels in Figure 2.
Figure 3 with 1 supplement

Enhanced terminal myogenic commitment in P7:S4KO satellite cells and myogenic progenitors.
(A) Representative images of Pax7 (red), Myogenin (green), and DAPI (blue) immunofluorescence in FACs-sorted adult Ctl or P7:S4KO 96 hr SC cultures (plated at 4000 cells/well) treated with vehicle, TGFβ1, or BMP4. (B) Quantification of Pax7 immunofluorescence in Ctl and P7:S4KO FACs-sorted SC cultures. (C) Quantification of Myogenin immunofluorescence in Ctl and P7:S4KO FACs sorted SC cultures. (D) Representative images of Pax7 (red), skeletal muscle myosin (green), and DAPI (blue) immunofluorescence in adult FACs-sorted Ctl or P7:S4KO myotube cultures (plated at 10000 cells/well). (E) Quantification of fusion index; myonuclei/myosin+ cell. N = 3 cultures, For (B) and (C) *p<0.05 significant to Ctl, **p<0.05 significant to vehicle Ctl, ANOVA Fishers test, for (E) *p<0.05 t-test, scale = 50 μm.
Figure 3—figure supplement 1
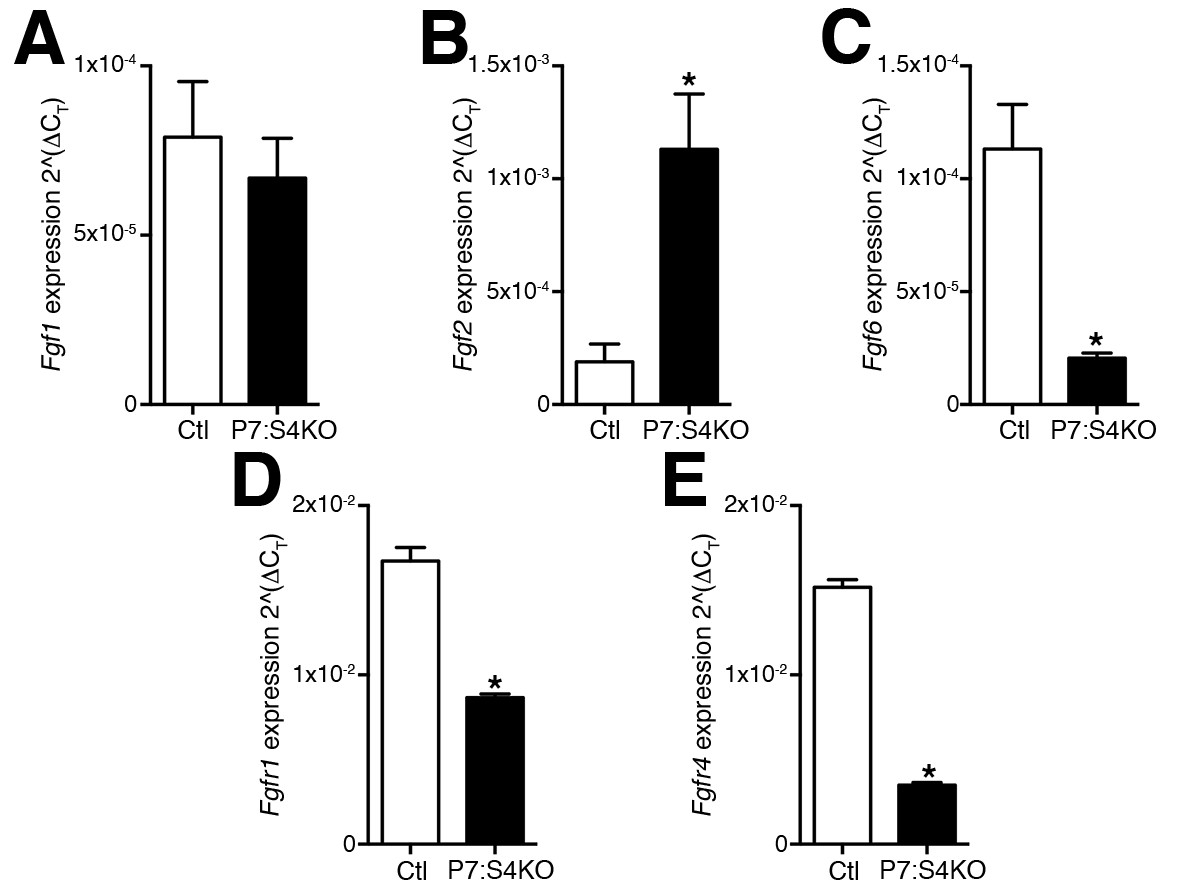
Modulations in FGFR and FGF expression following SC-specific Smad4 loss in adult mice.
Quantification of (A) Fgf1, (B) Fgf2, (C) Fgf6, (D) Fgfr1, and (E) Fgfr4 expression in FACs-purified adult SCs and MPs cultured for five days. N = 3 mice, *p<0.05 t-test.
Figure 4
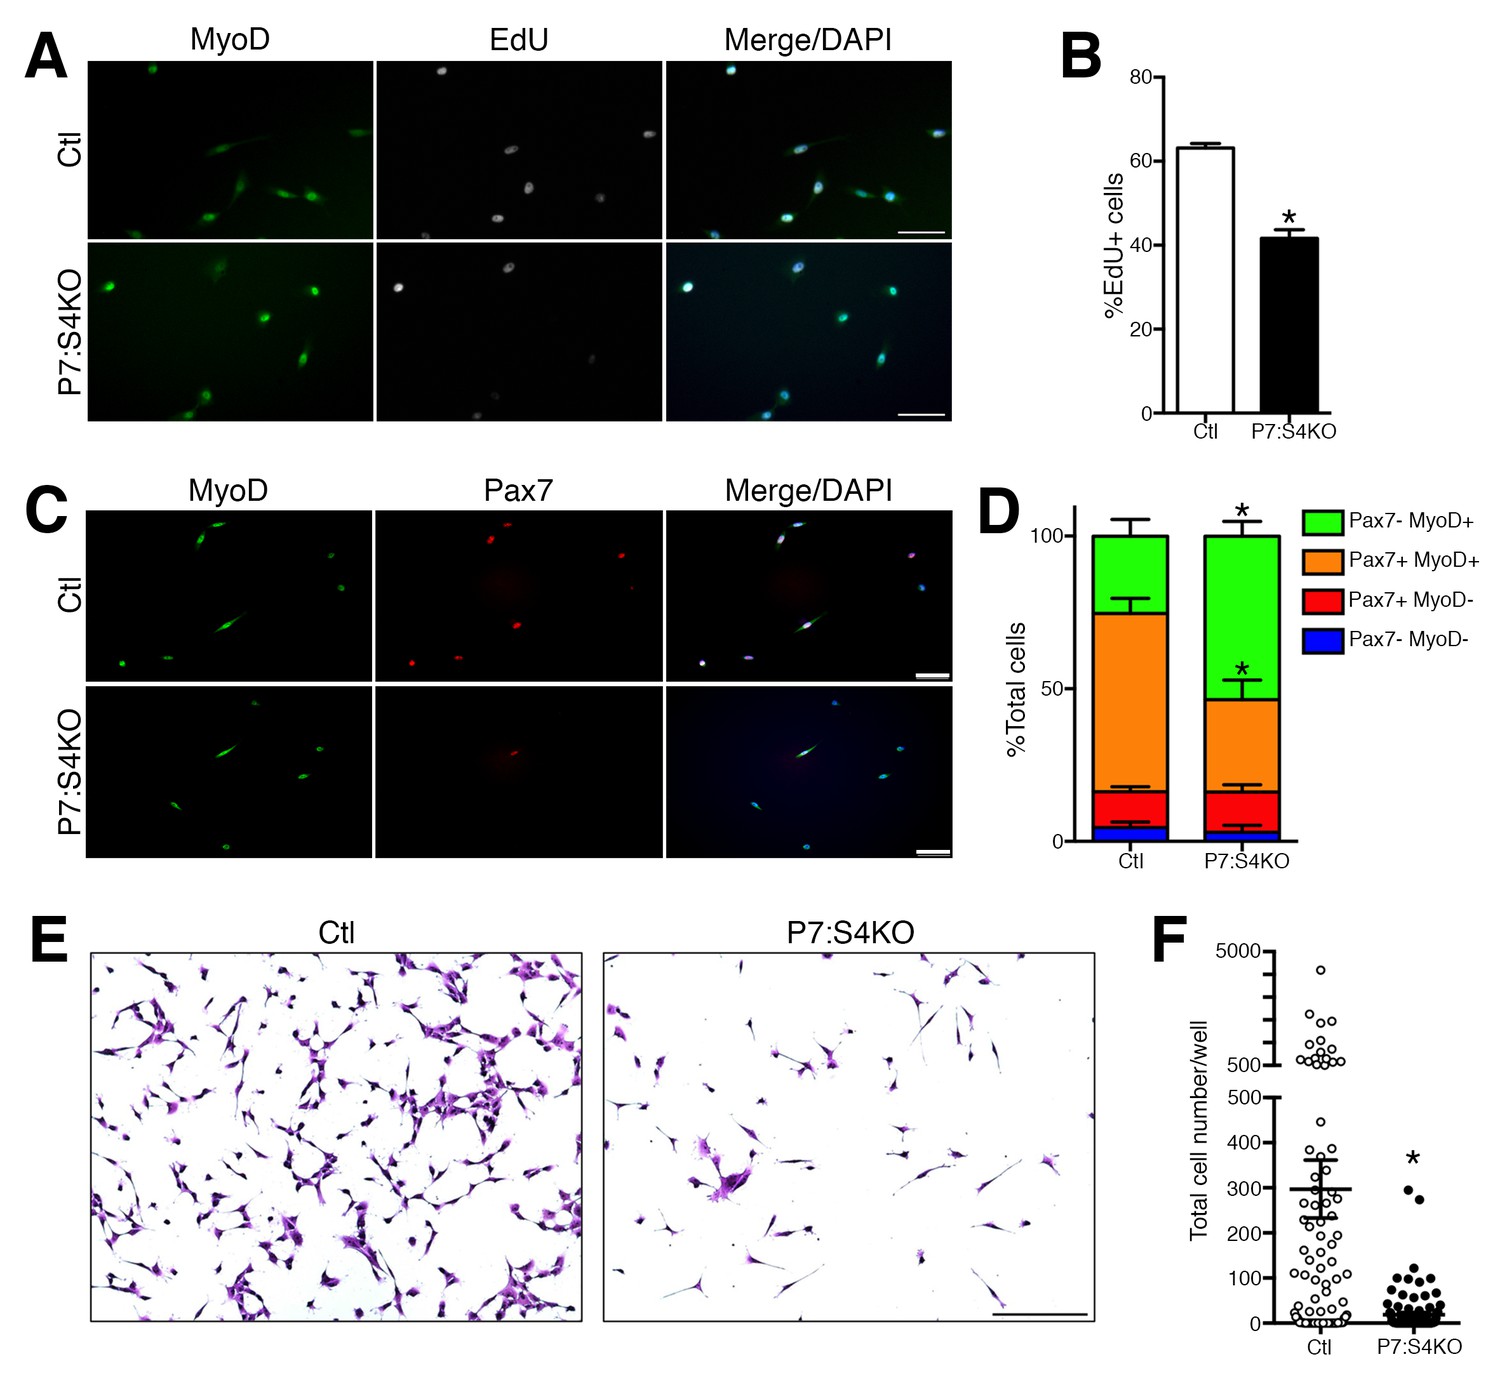
Reduced proliferation in P7:S4KO satellite cells and myogenic progenitors.
(A) Representative images of MyoD (green), EdU (grey), and DAPI (blue) immunofluorescence of FACs-sorted adult Ctl or P7:S4KO 72 hr SC cultures pulsed with EdU for the last 4 hr. (B) Quantification of the proportion of cells that are EdU+. N = 3 cultures, *p<0.05 t-test,scale = 50 μm. (C) Representative images of MyoD (green), Pax7 (red), and DAPI (blue) immunofluorescence of FACs-sorted adult Ctl or P7:S4KO 72 hr SC cultures, scale = 50 μm. (D) Quantification of the proportion of cells that are Pax7+ and/or MyoD+. N = 3 cultures, *p<0.05 t-test. (E) Representative images of Crystal Violet-stained 7-day cultures of FACs-sorted adult Ctl or P7:S4KO myogenic cells plated at clonal density (10 cells/well), scale = 200 μm. (F) Quantification of cell growth. N = 96 cultures, *p<0.05 t-test.
Figure 5 with 2 supplements

Smad4 disruption induces loss of proliferating and total satellite cell number during muscle regeneration.
(A) Representative images of Pax7 (red), BrdU (green), DAPI (blue) and Laminin (grey) immunofluorescence in adult 5dpi Ctl and P7:S4KO TA muscle sections. (B) Quantification of the proportion of BrdU+ Pax7+ cells in adult 5dpi Ctl and P7:S4KO TA muscle sections. (C) Quantification of Pax7+ cells in adult 5dpi Ctl and P7:S4KO TA muscle sections. N = 4 mice, *p<0.05 t-test, scale = 50 μm. Pax7+ cells (white arrows) and Pax7+BrdU+ (yellow arrows).
Figure 5—figure supplement 1

Smad4 disruption does not induce Cdkn1a, Cdkn1b, or Cdkn2a expression in SCs and MPs sorted from adult regenerating TA muscle.
Quantification of (A) Cdkn1a (p21) (B) Cdkn1b (p27), and (C) Cdkn2a (p16) expression in SCs and MPs FACs-sorted from adult 5dpi Ctl and P7:S4KO TA muscles. N = 3 mice, *p<0.05 t-test.
Figure 5—figure supplement 2
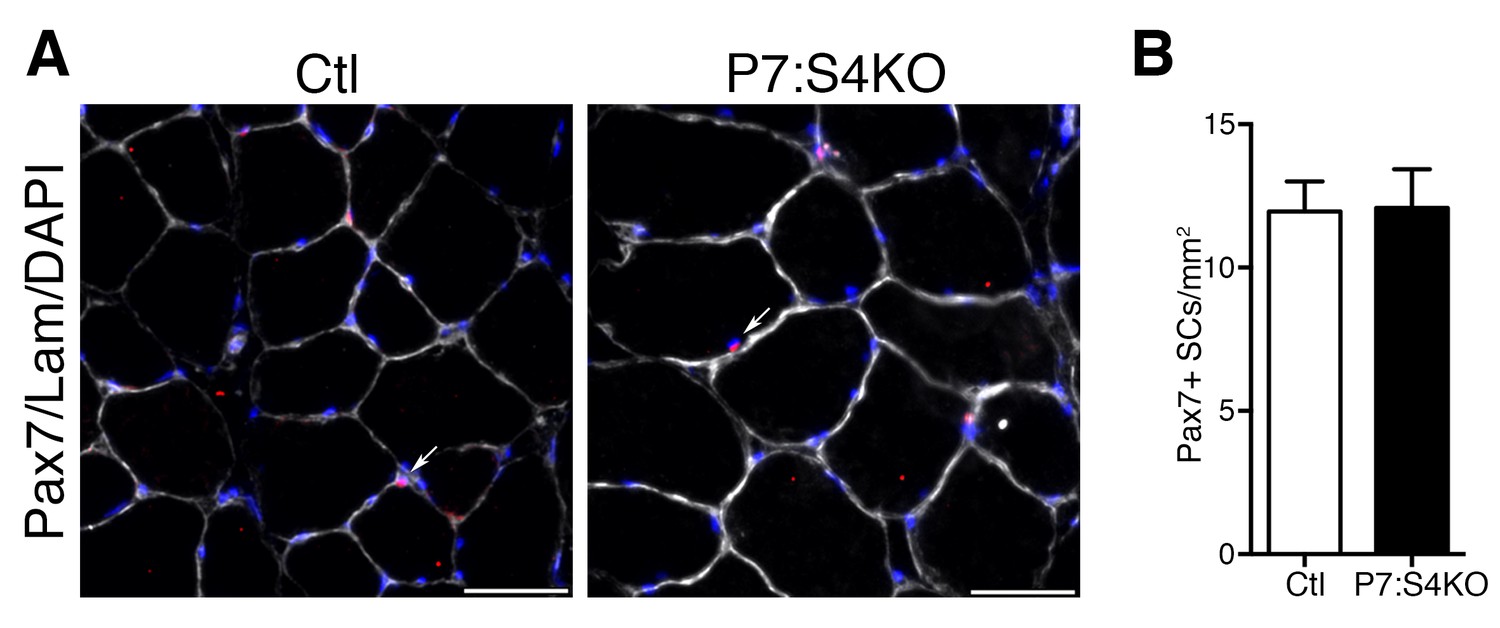
Smad4 disruption does not induce loss of Pax7+ SCs in uninjured TA muscles.
(A) Representative images of Pax7 (red), DAPI (blue) and Laminin (grey) immunofluorescence of adult uninjured Ctl and P7:S4KO TA muscle sections. (B) Quantification of Pax7+ cells in adult uninjured Ctl and P7:S4KO TA muscle sections. N = 4 mice, scale = 50 μm. Pax7+ cells (white arrows).
Figure 6
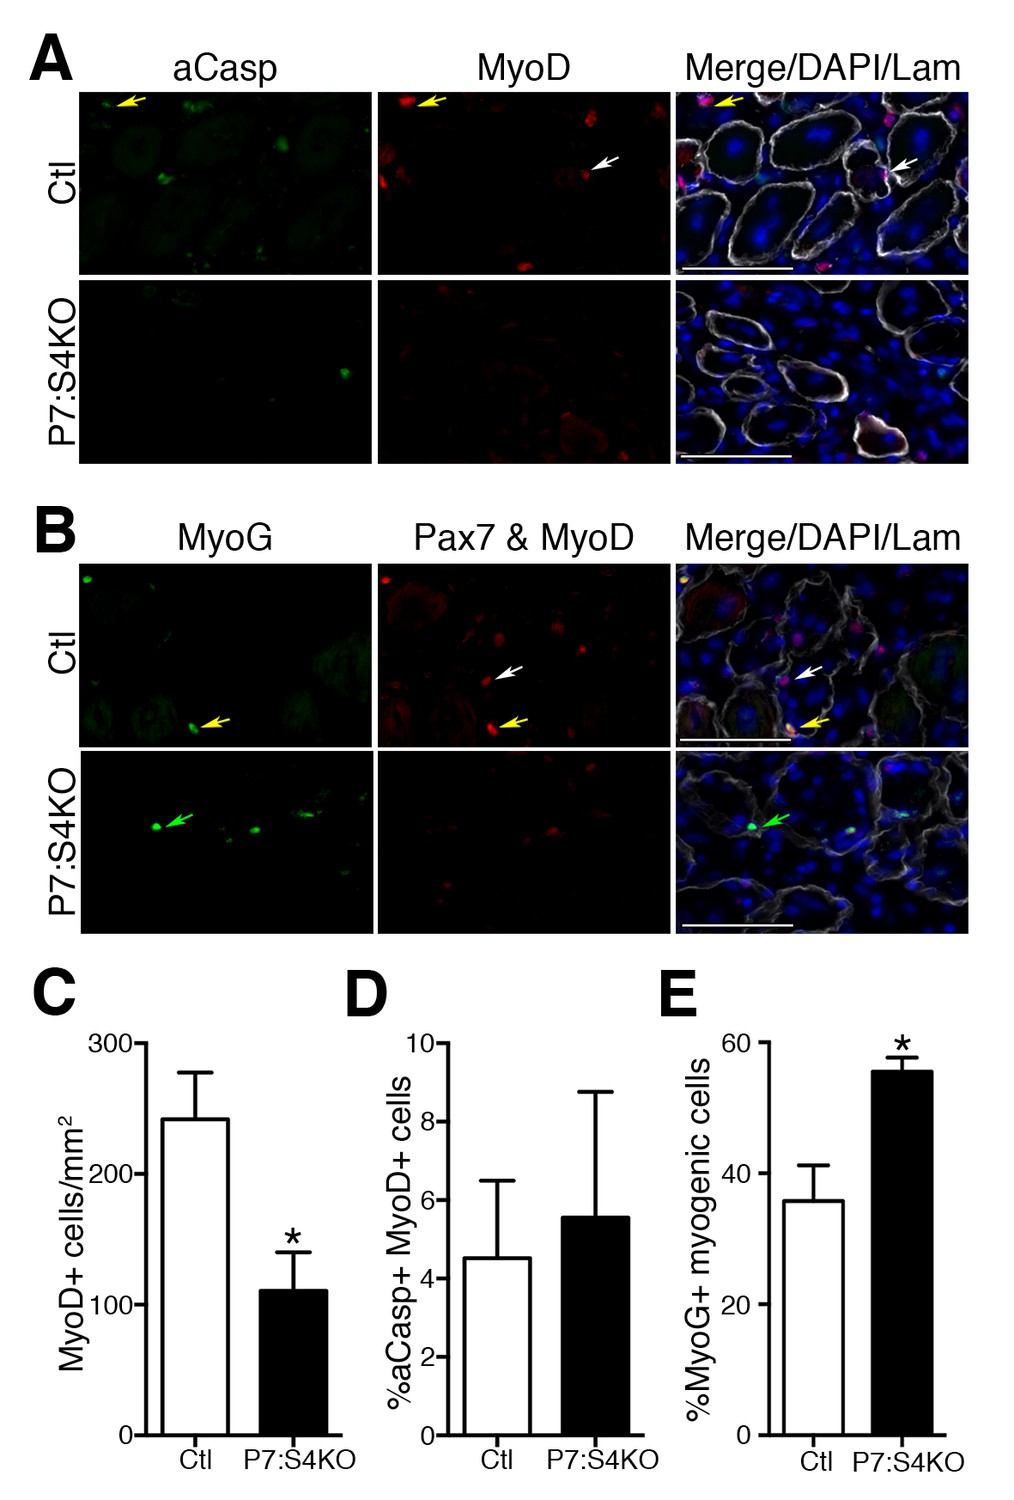
Smad4 disruption enhances terminal myogenic commitment during muscle regeneration.
(A) Representative images of active Caspase 3 (aCasp, green), MyoD (red), DAPI (blue), and Laminin (grey) immunofluorescence of adult 5dpi Ctl and P7:S4KO TA muscle sections. MyoD+ cells (white arrows) and MyoD+aCasp+ (yellow arrows). (B) Representative images of Myogenin (MyoG, green), Pax7 and MyoD (red), DAPI (blue) and Laminin (grey) immunofluorescence of adult 5dpi Ctl and P7:S4KO TA muscle sections. (C) Quantification of MyoD+ cells in 5dpi Ctl and P7:S4KO TA muscle sections. (D) Quantification of the proportion of aCasp+ MyoD+ cells in 5dpi Ctl and P7:S4KO TA muscle sections. (E) Quantification of the proportion of MyoG+ Pax7 and MyoD+ cells in 5dpi Ctl and P7:S4KO TA muscles. Pax7 and MyoD+ cells (white arrows) and Pax7 and MyoD+ MyoG+ (yellow arrows) MyoG+ (green arrows). N = 4 mice, *p<0.05 t-test, scale = 50 μm.
Figure 7 with 1 supplement
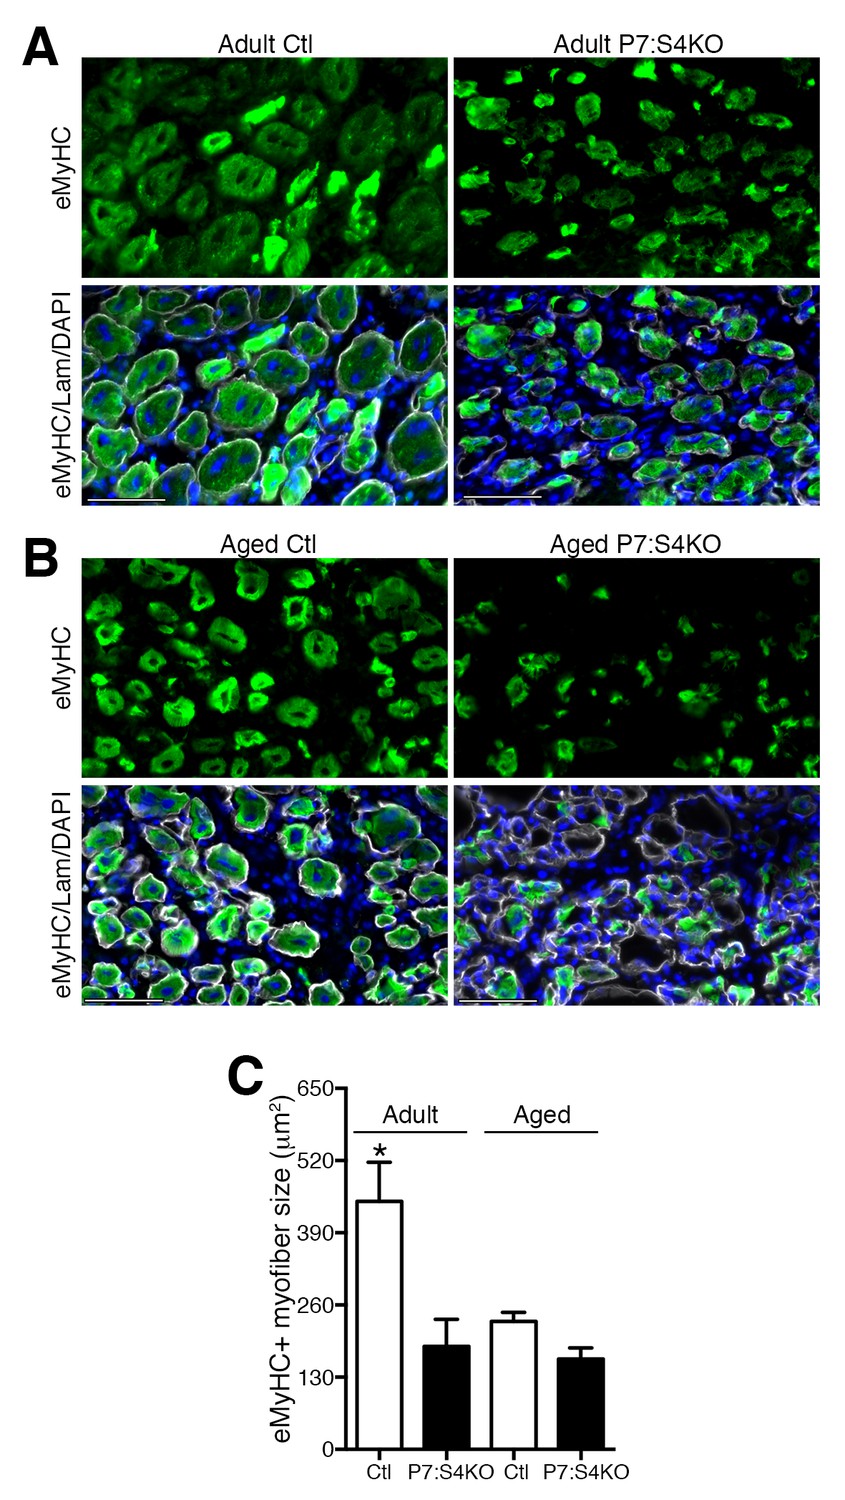
Smad4 disruption in satellite cells impairs skeletal muscle regeneration.
Representative images of embryonic Myosin Heavy Chain (eMyHC, green), DAPI (blue) and Laminin (grey) immunofluorescence of 5dpi Ctl and P7:S4KO (A) adult and (B) aged TA muscle sections. (C) Quantification of average eMyHC+ regenerated myofiber size in 5dpi adult and aged Ctl and P7:S4KO TA muscles. N = 4 mice, 250–300 myofibers. *p<0.05 ANOVA Fishers test, scale = 50 μm.
Figure 7—figure supplement 1
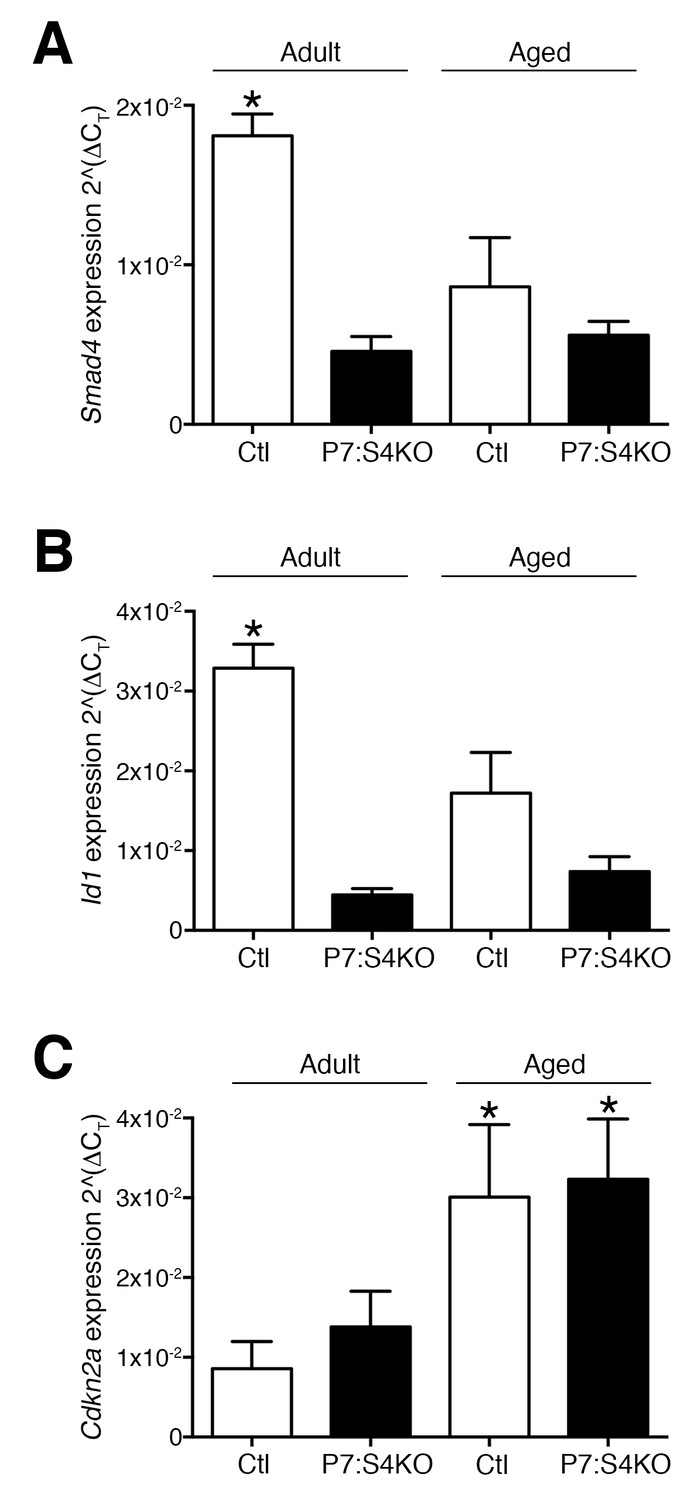
Smad4 disruption reduces Smad4 and the SMAD target Id1 expression in adult and aged SCs and MPs sorted from regenerating TA muscle.
Quantification of (A) Smad4, (B) Id1 and (C) Cdkn2a (p16) mRNA levels in SCs and MPs FACs-sorted from 5dpi adult and aged Ctl and P7:S4KO TA muscle sections. N = 3 mice, *p<0.05 ANOVA Fishers test.
Figure 8

Smad4 disruption in satellite cells leads to persistent deficits in skeletal muscle regeneration.
Representative images of H and E-stained uninjured and 14dpi, and Sirius Red-stained 14dpi (A) adult and (B) aged TA muscle sections. Quantification and frequency distribution of (C) uninjured and (D) 14dpi myofiber size in adult and aged Ctl and P7:S4KO TA muscles. N = 4 mice, 700–900 myofibers. For (C) *p<0.05 to Adult, for (D) *p<0.05 to Ctl, **p<0.05 to Adult Ctl, ANOVA Fisher’s test, scale = 100 μm.
Download links
A two-part list of links to download the article, or parts of the article, in various formats.
Downloads (link to download the article as PDF)
Open citations (links to open the citations from this article in various online reference manager services)
Cite this article (links to download the citations from this article in formats compatible with various reference manager tools)
Smad4 restricts differentiation to promote expansion of satellite cell derived progenitors during skeletal muscle regeneration
eLife 5:e19484.
https://doi.org/10.7554/eLife.19484


