Evolution of herbivore-induced early defense signaling was shaped by genome-wide duplications in Nicotiana
- Max Planck Institute for Chemical Ecology, Germany
- Brigham Young University, United States
Figures
Figure 1 with 2 supplements
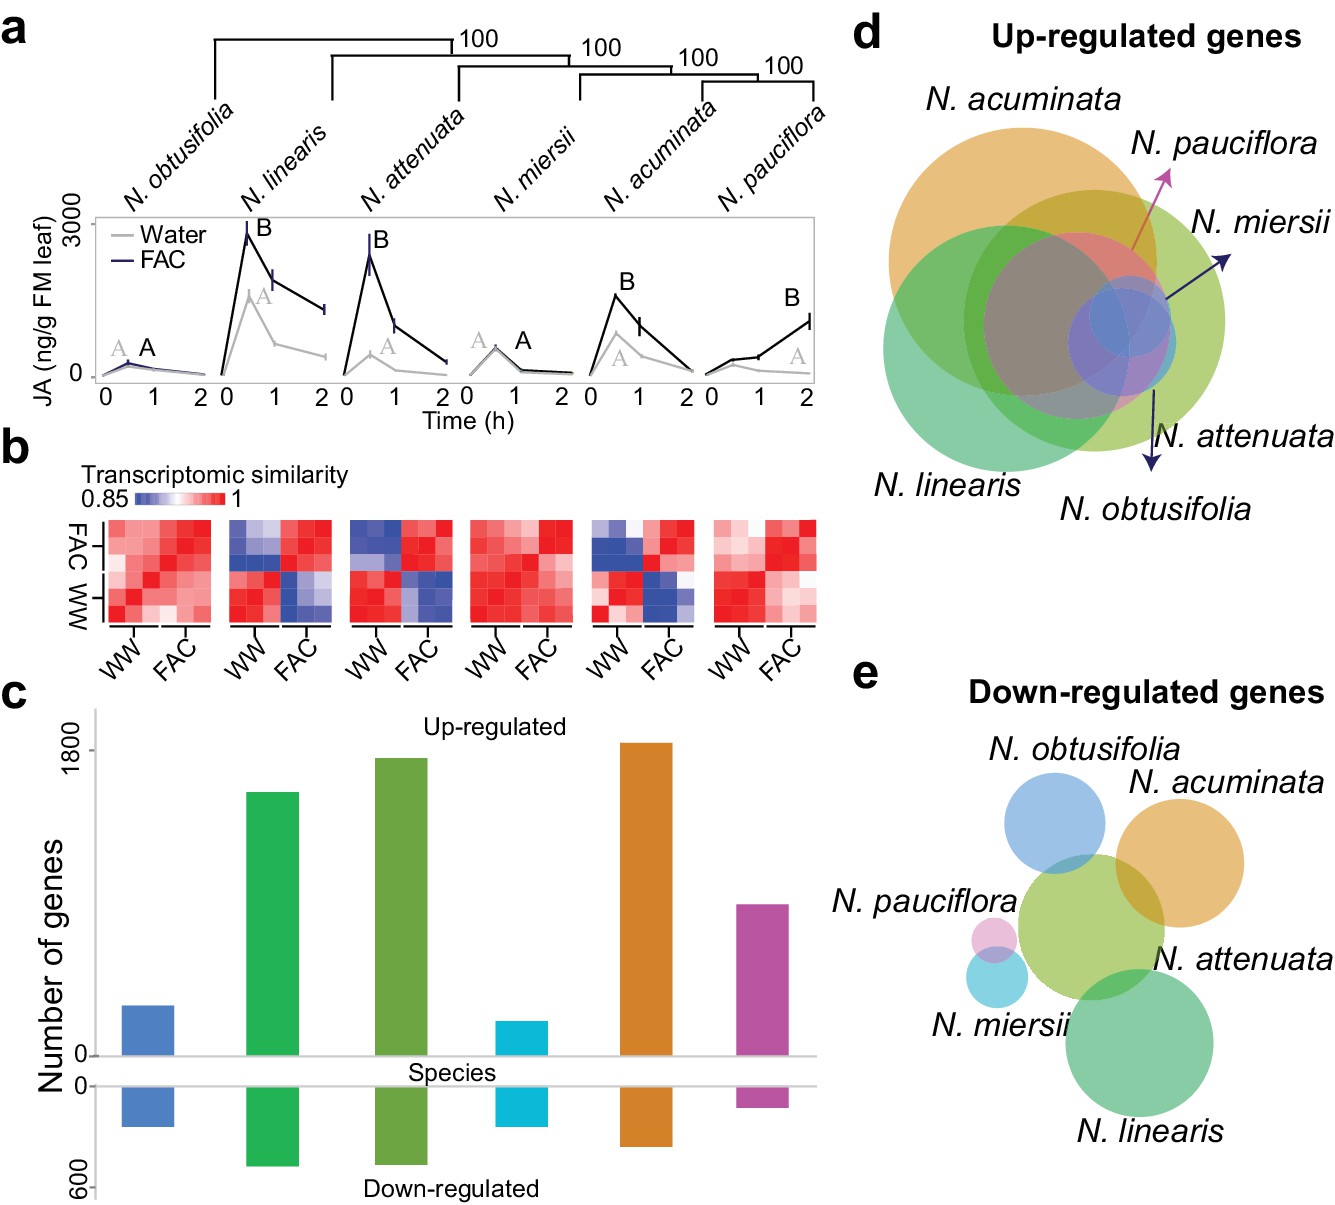
FAC elicits divergent transcriptome responses among closely related Nicotiana species.
(a) FAC-induced JA responses among six Nicotiana species. Phylogenetic tree was constructed based on orthologous genes and numbers on each branch indicates bootstrap values. X-axis indicates time after elicitation and Y-axis denotes JA concentrations. FM= fresh mass. Gray and black colored lines refer to control (wounding and water) and FAC-induced samples, respectively. Different letters indicate significance between two treatments (Student’s-t test, p<0.05). (b) transcriptomic similarity between control and FAC-induced samples (30 min after elicitation) in the six species (order is same as panel a). The color gradients indicate the Pearson correlation coefficients among samples. (c) number of differentially up- and down-regulated genes after FAC elicitation in the six species (order is same as panel a). Y-axis depicts the number of genes. Each colored bar indicates a different species. Blue: N. obtusifolia, light green: N. linearis, dark green: N. attenuata, light blue: N. miersii, orange: N. acuminata, pink: N. pauciflora. d and e, Venn diagrams of up- (d) and down- (e) regulated genes in each of the six Nicotiana species. Circle size indicates the relative number of up/down regulated genes in each species. Each filled circle indicates a different species, with color code as in panel c.
Figure 1—figure supplement 1
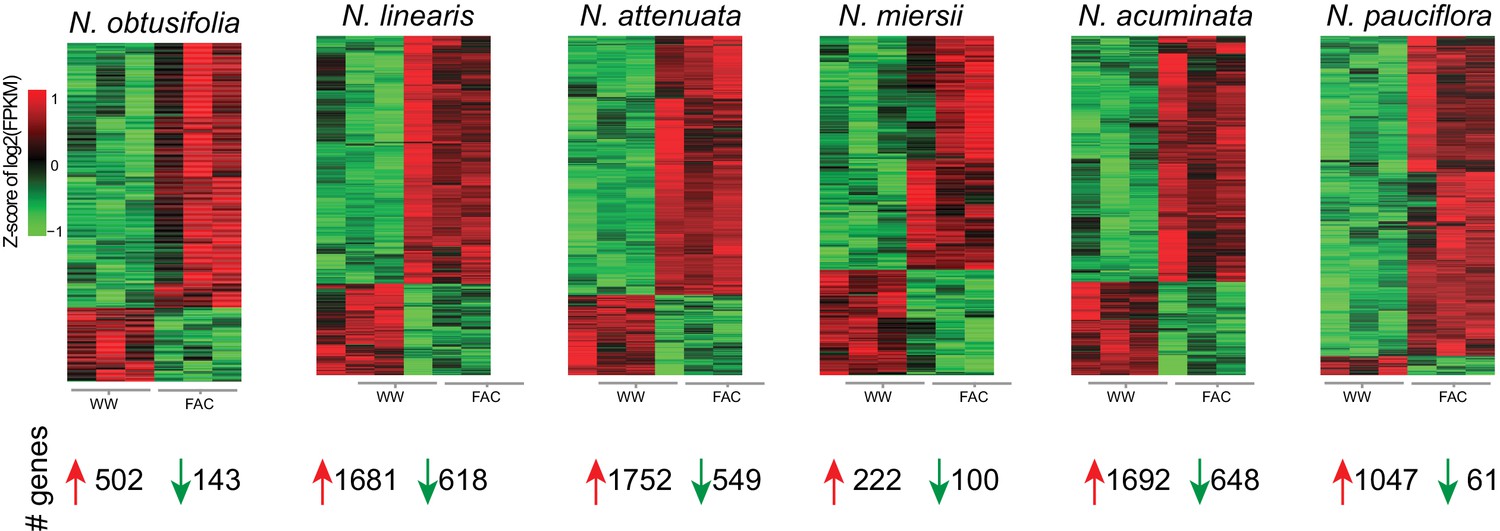
Z-score of FAC-induced gene expression changes in six species.
Each heatmap depicts z-scores of the up and down-regulated genes after FAC elicitation in the six species. Z-scores were calculated based on log2 transformed FPKM values. The total number of genes that were up- or down-regulated by FAC in each species is shown at the bottom.
Figure 1—figure supplement 2
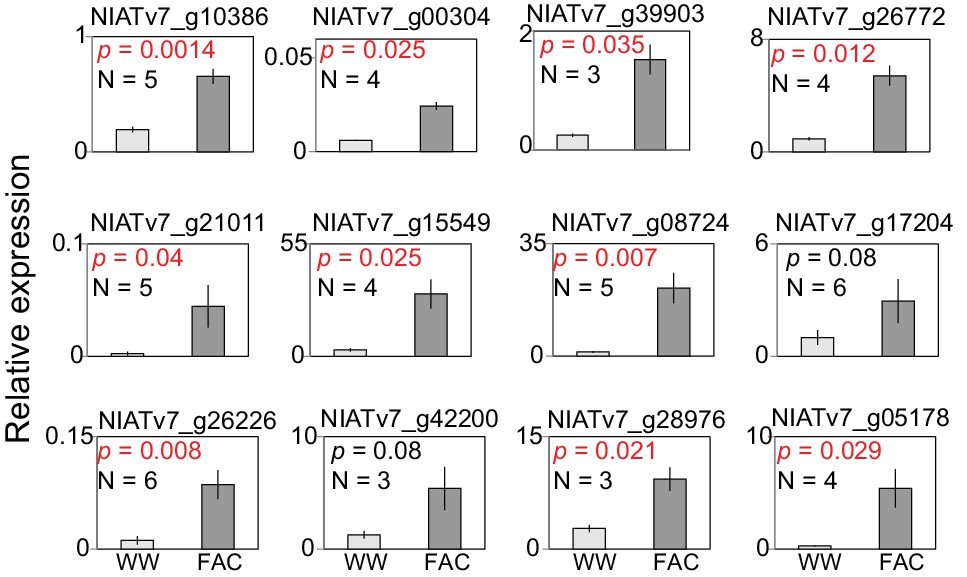
Validations of 12 selected FAC-induced genes in N. attenuata.
The N. attenuata leaf samples were harvested at 30 min after the treatments of wounding + water (WW) or wounding + FAC (FAC) for the quantification of transcript abundance of the selected 12 genes. P-values were calculated using the Students’ t-test. Data are presented as means ± SEM.
Figure 2 with 1 supplement
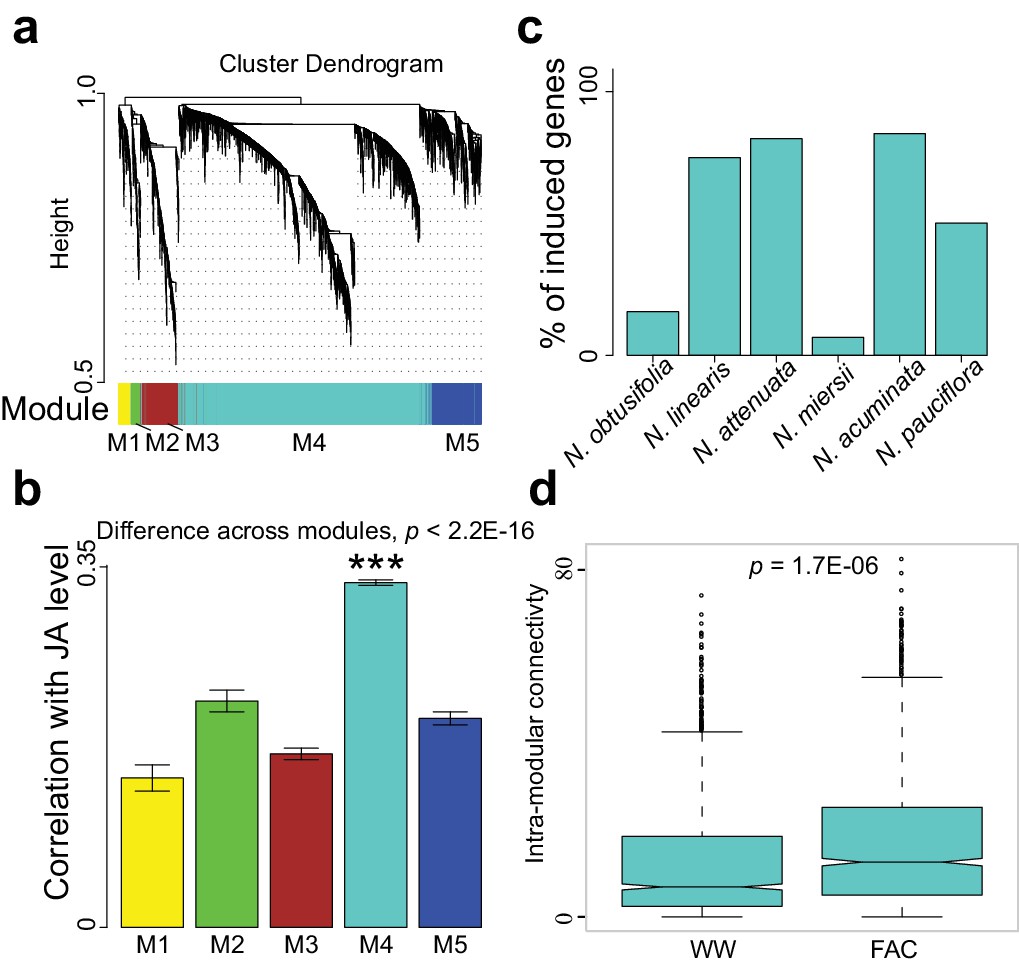
The M4 co-expression module is correlated with induced defense and is induced by FAC elicitation.
(a) the cluster dendrogram of five modules (M1-M5). Each color indicates a different co-expression module. Y-axis indicates the height of the clustering tree. Yellow: M1, green: M2, brown: M3, turquoise: M4, blue: M5. (b) the average correlation coefficient between each module and the maximum induced JA level within 2 hr. Y-axis indicates the value of average correlation coefficients. Each color represents one identified module. Mean and standard error are shown for each bar. The M4 module has a significantly higher correlation coefficient than the other modules (***, p<0.001, Wilcoxon–Mann–Whitney test). (c) percentage of genes in module M4 induced by FAC-elicitation across six species. (d) the intra-modular connectivity of the M4 module in control and FAC-induced samples. WW indicates control samples (wounding and water) and FAC indicates the FAC-elicited samples.
Figure 2—figure supplement 1
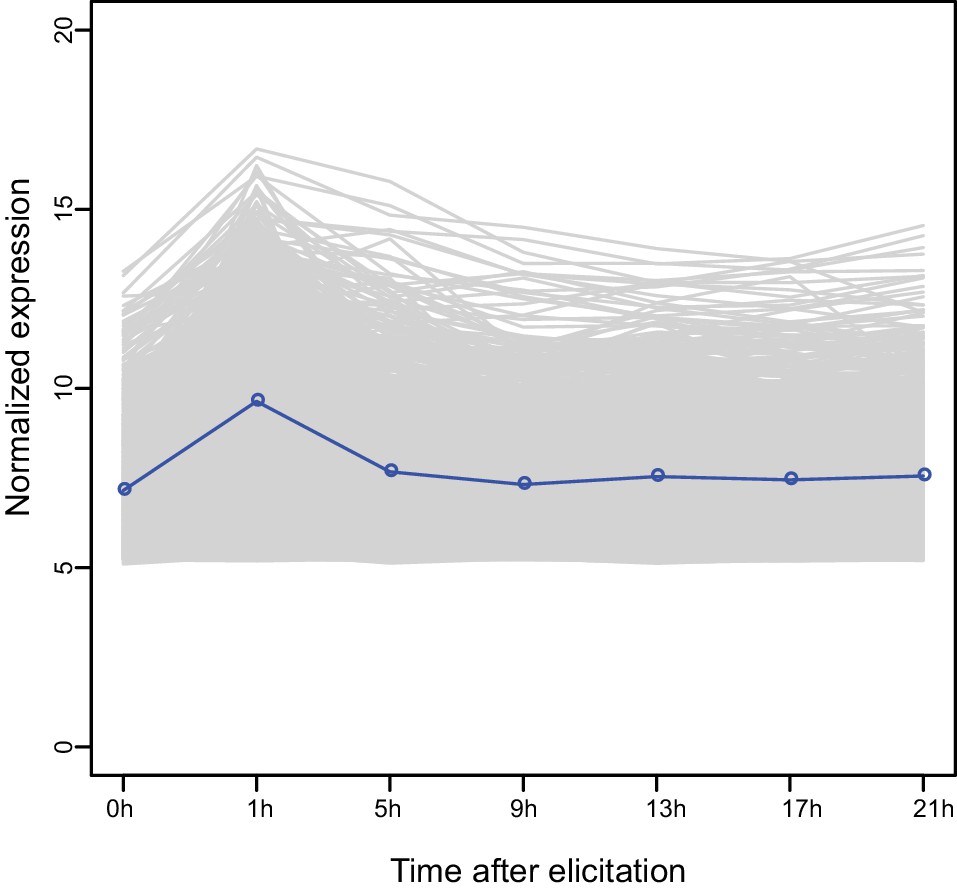
Expression kinetics of the M4 module genes based on previous microarray data.
Each line indicates the expression levels of a gene and the blue line indicates the average values of all genes.
Figure 3
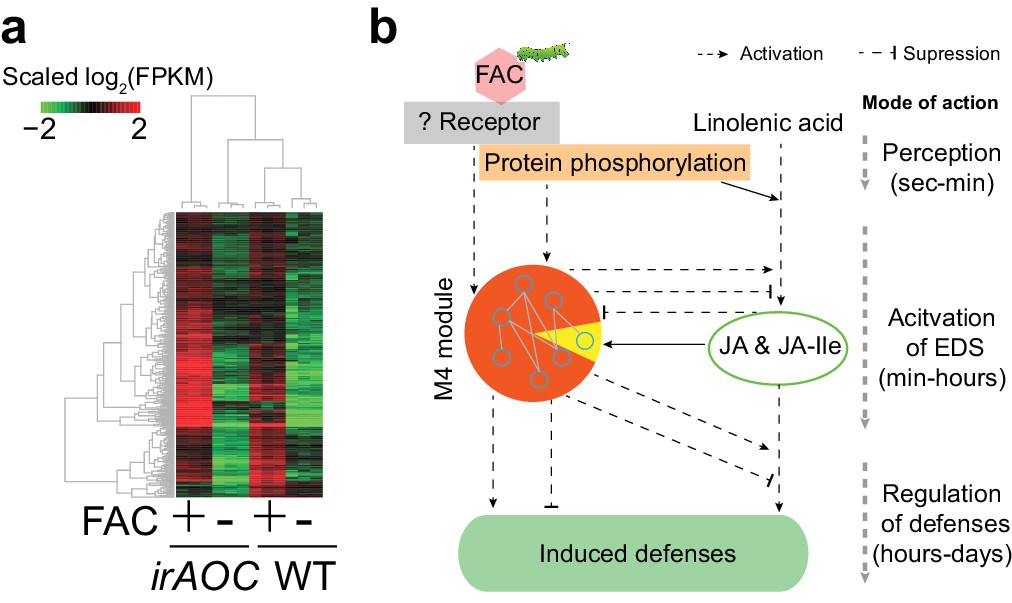
The majority of M4 module genes were induced by FAC in both WT and JA deficient plants.
(a) a heatmap representing the expression of M4 module genes in WT and JA deficient plants (irAOC). The color gradient represents the relative expression level. (b) a simplified induced defense signaling pathway, which indicates that accumulation of JA is not required for the induction of the majority of the M4 module (orange color in the pie chart). EDS: early defense signaling. Dashed and solid arrows indicate known and putative regulations, respectively.
Figure 4
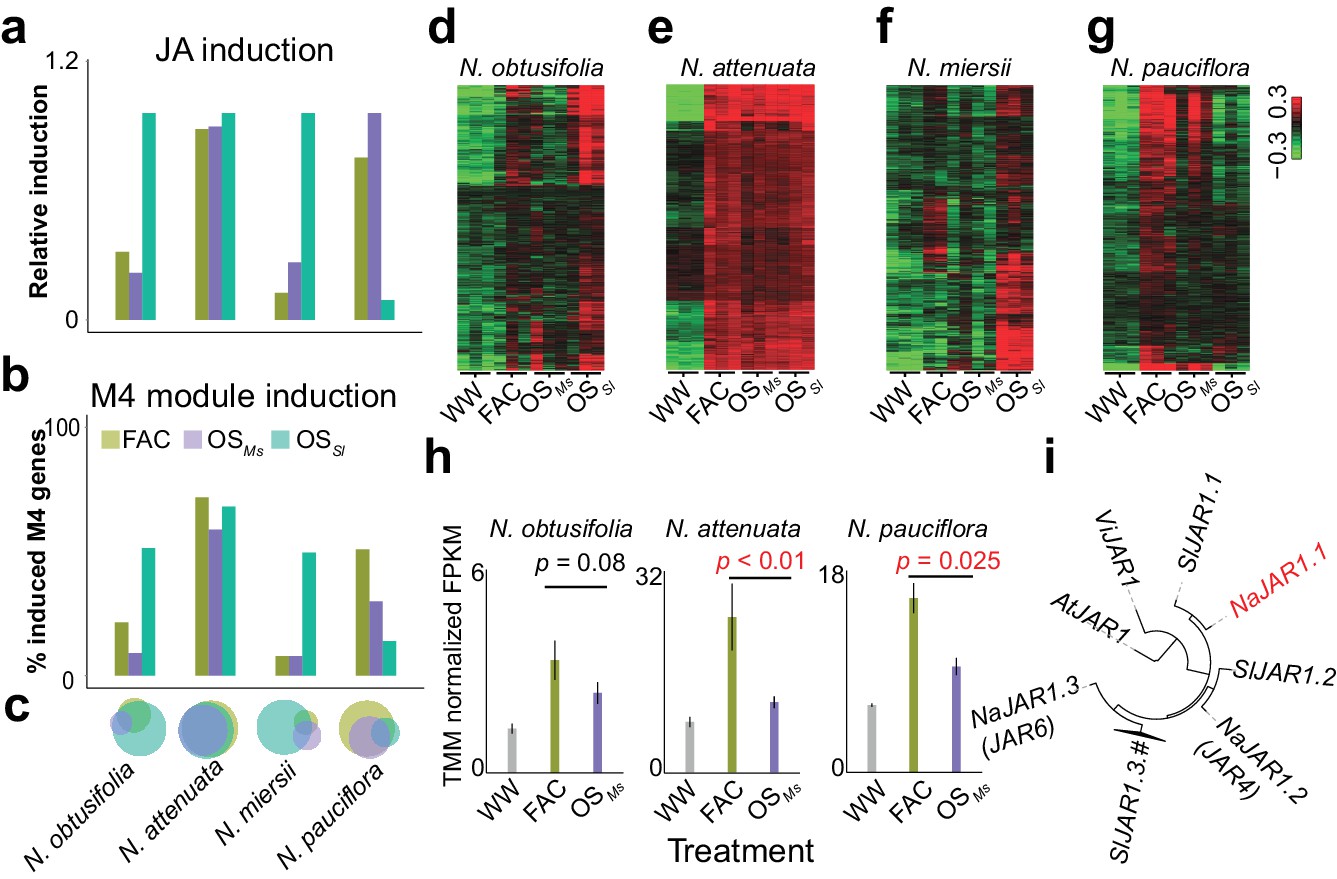
The induction of module M4 is associated with the specificity of different HAE-induced defense responses within species.
a and b, the relative JA induction (a) and proportion of genes in the M4 module (b) induced by different HAEs in four Nicotiana species. The JA induction was scaled between 0 and 1, to indicate the lowest and highest JA level induced by three different HAEs and control (WW). Each colored bar represents elicitations from different HAEs. Dark green: FAC, purple: M. sexta oral secretion (OSMs), light blue: S. littoralis oral secretion (OSSl). (c) Venn diagrams showing the overlap among upregulated genes induced by three different HAEs within each species. Each color represents one HAE with the same color code as in panels a and b. The sizes of the circles represent the total number of genes in each group. (d–g) heatmaps showing the expression of M4 gene module members in four species as induced by the three HAEs and control. The color gradient represents the relative expression value. (h) OSMs induced lower expression level of JAR1.1 than did FAC in three Nicotiana species. Each bar presents the average expression (TMM normalized FPKM) of JAR1.1 in each species. Each color indicates different treatments. Gray: control (wounding and water), dark green: FAC, purple: OSMs. (i) the phylogenetic tree showing the relationship among three paralogs of JAR1 in N. attenuata and orthologues of JAR1 in Arabidopsis thaliana (At), Vitis vinifera (Vi), and Solanum lycopersicum (Sl).
Figure 5 with 1 supplement
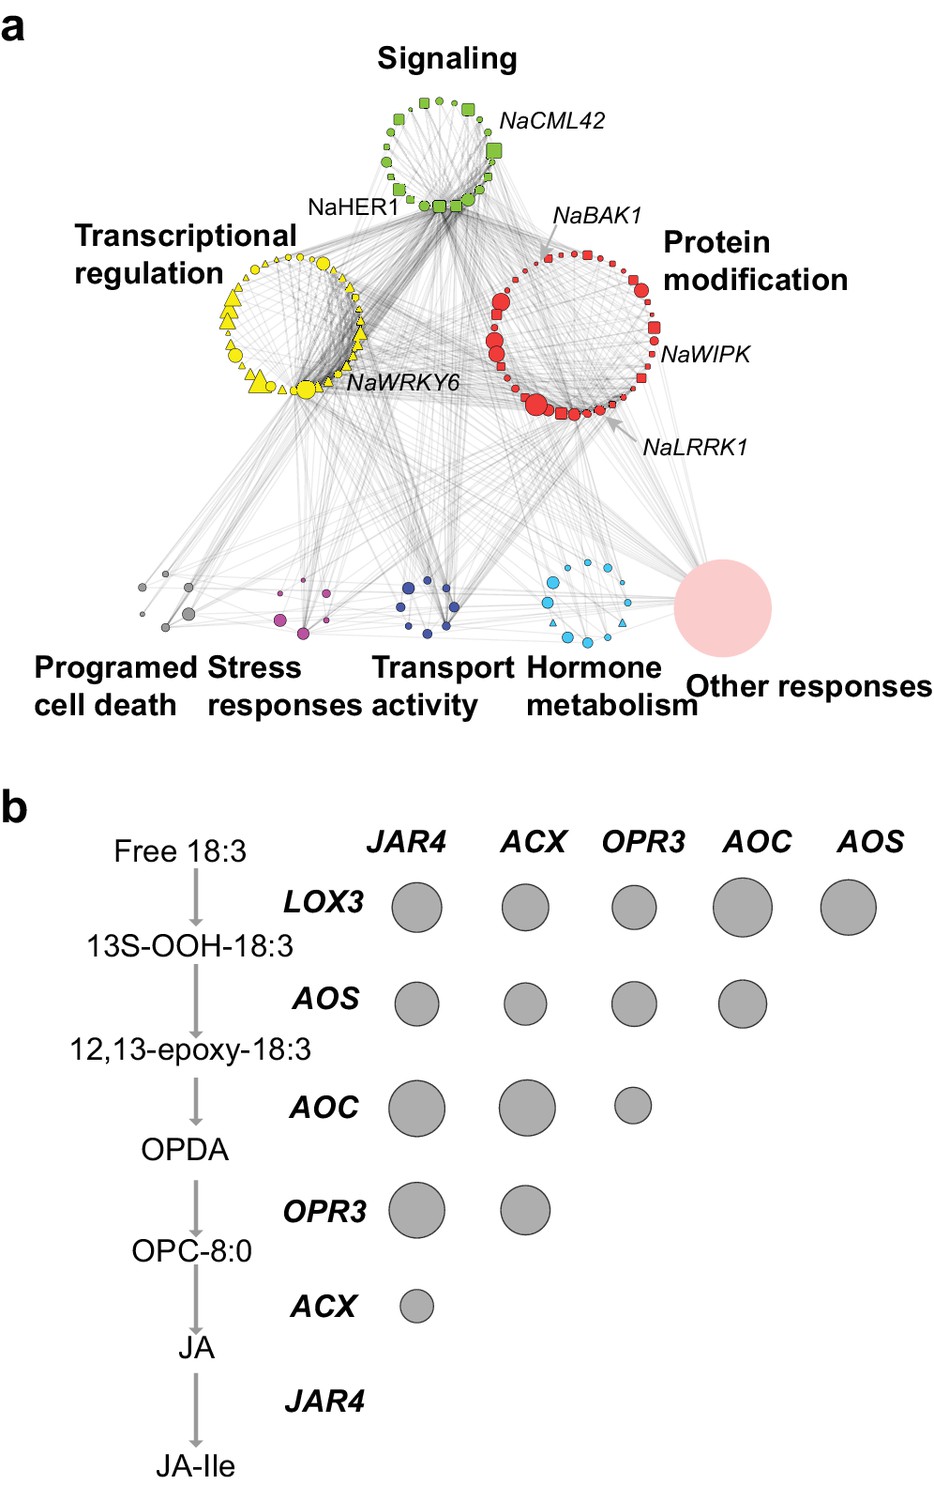
The co-expression network of module M4.
(a) the network view of the M4 module. Each node represents a gene in the M4 module, except the filled orange node, which represents a collapsed node from a cluster. The shape of the node represents the property of the gene. Transcription factor: triangle, round rectangle: protein kinases, ellipse: other genes. The size of each node indicates their log2 fold-change after FAC induction. The color of each node represents its Mapman functional annotation. Green: signaling, yellow: transcriptional regulation, red: post translational modification, gray: programmed cell death, purple: biotic and abiotic stress responses, dark blue: transport activity, light blue: hormone metabolism, orange: others. Edges represent the connections between two genes, estimated based on their co-expression coefficient. The genes that were shown to regulate HAE-induced anti-herbivore defenses are also shown in the network. (b) the correlation among genes involved in JA biosynthesis and metabolism. The left side shows biosynthesis and metabolism of JA, right side shows the correlation among each other. Each circle indicates the pairwise correlation coefficient between two genes. The size of the circle indicates the coefficient value. Only statistically significant correlations were shown (p<0.05, Pearson's product moment correlation test).
Figure 5—figure supplement 1
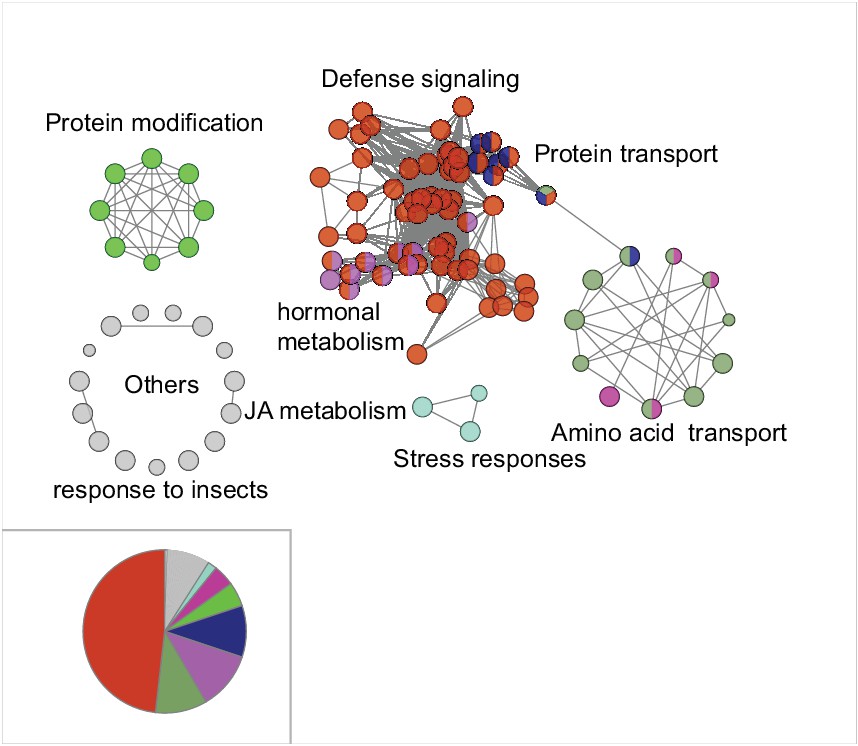
Gene ontology (GO) enrichment analysis of the M4 module genes.
Each node represents a GO term. The most frequent enriched term is defense signaling.
Figure 6 with 1 supplement
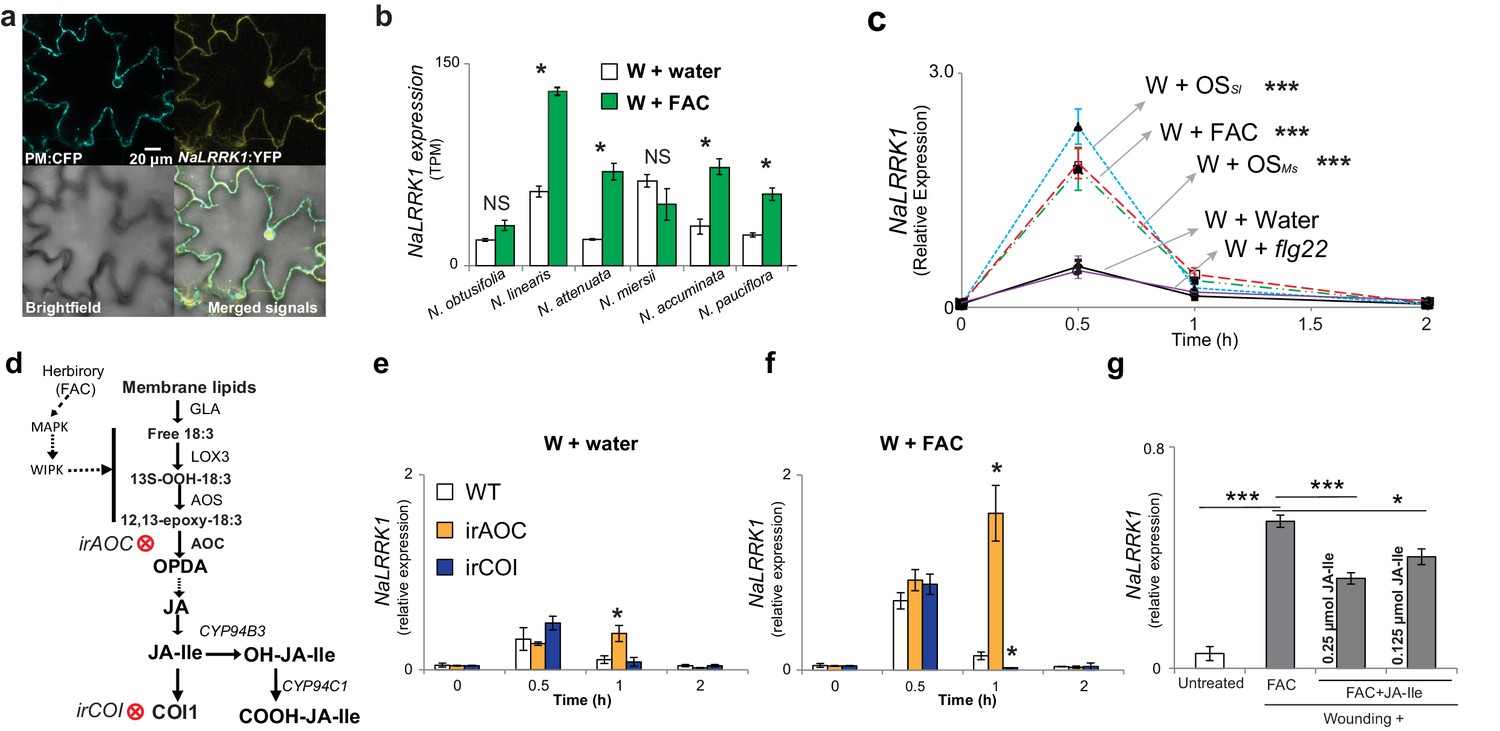
Jasmonate signaling suppresses the expression of NaLRRK1.
(a) Subcellular localization of NaLRRK1. Nicotiana attenuata leaves were transformed with PM:CFP and NaLRRK1:YFP. After incubation for 48 hr, the transformed leaves were observed under a confocal microscope. The photographs were taken in UV light, visible light (bright field) and in combination (merged signals). Scale bar, 20 μm. (b) the transcript accumulation of LRRK1 gene in the leaves of six Nicotiana species elicited by wounding + water (W + water) and wounding + FAC (W + FAC), estimated from RNA-seq data (n=3). Asterisk indicates FDR-adjusted p value <0.05 and fold change greater than 2. c, the kinetics of NaLRRK1 transcript accumulation in N. attenuata leaves at 0, 0.5, 1 and 2 hr after treatments with different elicitors. For each treatment, 20 μL water or elicitors: FAC, oral secretions from M. sexta (OSMs), S. littoralis (OSSl), or flg22 were applied to the wounded leaves. Triple asterisks indicate the significant difference (p<0.01, n=5, except flg22 treatment was with 3 replicates) between treatment and control (W + water). d, a simplified model of JA biosynthesis and metabolism. The two transformed lines, in which AOC and COI were silenced respectively, are indicated. e and f, the transcript accumulation of NaLRRK1 in the two transformed lines in comparison to WT after elicitation with water (e) or FAC (f). g, the FAC induced NaLRRK1 transcript accumulation in N. attenuata leaves was suppressed by JA-Ile. N. attenuata leaves were collected at 1 hr after the induction. JA-Ile was applied in two different concentrations. For panel e, f and g, four biological replicates were used. In panel b, c, e f and g, data are presented as means ± SEM. Asterisk indicates significant difference (*: p<0.05; ***: p<0.01, Student’s-t test) between treatments.
Figure 6—figure supplement 1
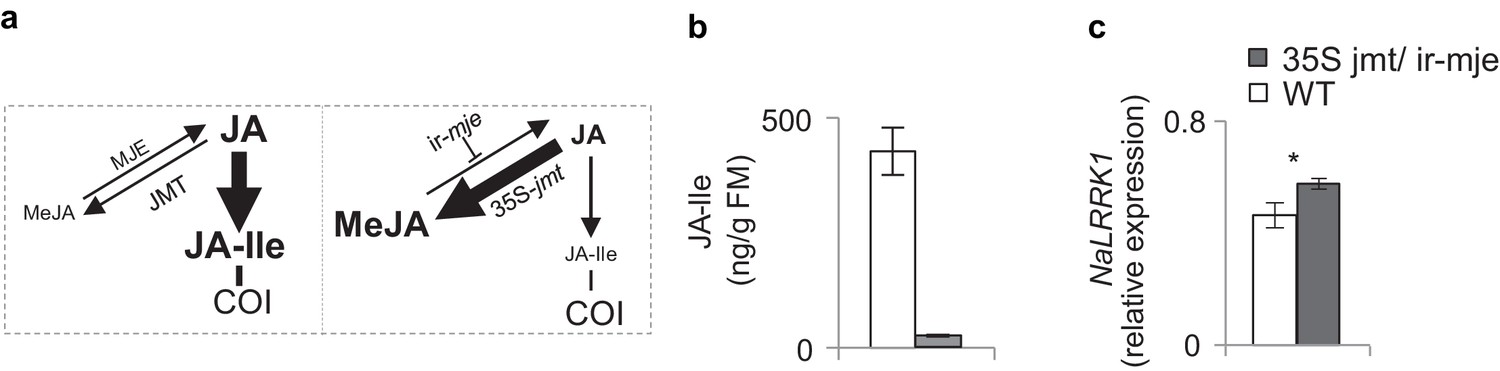
In N. attenuata, OSMs induced higher NaLRRK1 transcript levels in 35S-jmt/ir-mje plants than in WT plants.
(a) diagram shows the JA metabolic flux in WT (left) and 35S-jmt/ir-mje plants (right). (b) in comparison to WT plants, 35S-jmt/ir-mje plants have reduced level of OSMs-induced JA-Ile. (c) the transcript levels of NaLRRK1 are higher in 35S-jmt/ir-mje plants than in WT plants. In both panel b and c, filled and unfilled bars indicate 35S jmt/ir-mje and WT plants, respectively. Data are presented as means ± SEM. Rosette stage N. attenuata plants were wounded and 20 µL of OSMs was immediately applied to the wounds. Leaf samples were collected at 1 hr after elicitations. Asterisk indicates significant differences between WT and 35S-jmt/ir-mje plants (*, p<0.05, Student’s-t test).
Figure 7 with 2 supplements

Silencing NaLRRK1 increases FAC induced JA biosynthesis and metabolism and downstream defenses.
(a–f) the VIGS-NaLRRK1 plants have enhanced FAC-induced transcript accumulations of genes involved in JA biosynthesis and metabolism compared to EV plants (n=5). FAC elicitation significantly increased transcripts of: NaLOX3 (b), NaAOS (c), NaAOC (d) and NaCYP94B3-like1/2. Transcripts levels were measured at 1h after FAC-elicitation. Due to high sequence similarity between NaCYP94B3-like1 and NaCYP94B3-like2, qPCR primers we used were not able to distinguish these two copies. g-k, the VIGS-NaLRRK1 plants have enhanced JA biosynthesis and metabolism. FAC elicitation induces significantly higher levels of OPDA (f), OH-JA-Ile (j) and COOH-JA-Ile (k) in VIGS-EV plants than EV plants, but only marginally higher levels of JA (h) and JA-Ile (i) (n=7), l, the VIGS-NaLRRK1 plants accumulated higher transcript levels of the transcription factor NaMyb8 than did VIGS-EV plants. m-o, the VIGS-NaLRRK1 plants accumulated higher transcript levels for the defense genes NaTD2 (m) and NaTPI (n) and higher levels of TPI activity (o) than did VIGS-EV plants. (p) M. sexta gained significantly less mass when fed on VIGS-NaLRRK1 plants than on VIGS-EV plants (n=24). The wounding + FAC treated leaf samples were collected at 1 hr after the treatment for gene expression analysis and at 24 hr after the treatment for TPI activity analysis. In all panels, data are presented as means ± SEM. Asterisk indicates significant difference (*, p<0.05; **, <0.01, ***, p<0.001, Student’s-t test) between wounding + FAC treatment and control (wounding + water).
Figure 7—figure supplement 1
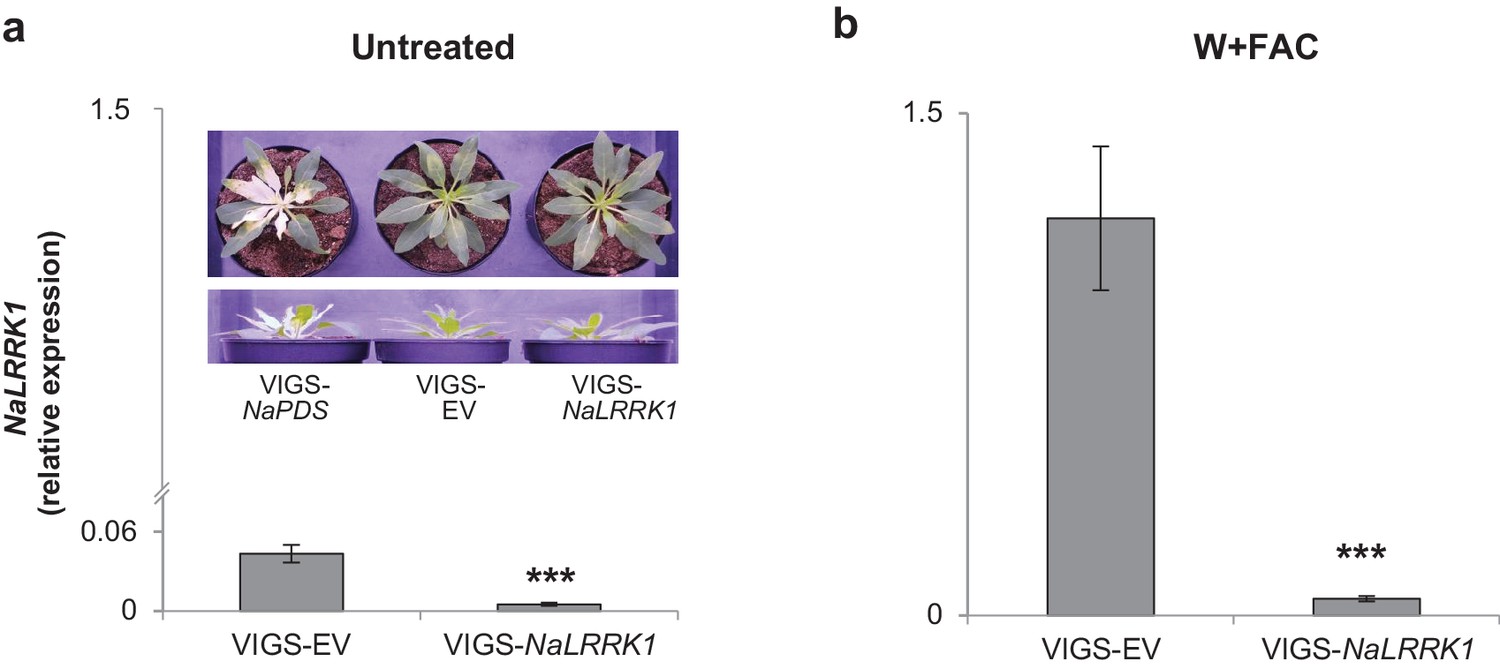
NaLRRK1 transcript abundance was successfully reduced in VIGS-NaLRRK1 plants in comparison to controls.
a and b NaLRRK1 transcript levels in leaves that were undamaged (a) and or treated with wounding + FAC (b) For treated leaves, samples were collected 0.5 hr after elicitation. For each treatment, 8 biological replicates were analyzed. No morphological differences between VIGS-EV and VIGS-NaLRRK1 plants at the rosette-stage of growth were observed. The VIGS-NaPDS was used as a positive control for the VIGS process. Asterisks indicate significant differences between VIGS-EV and VIGS-NaLRRK1 plants (***, p<0.001, Student’s-t test). Data are presented as means ± SEM.
Figure 7—figure supplement 2
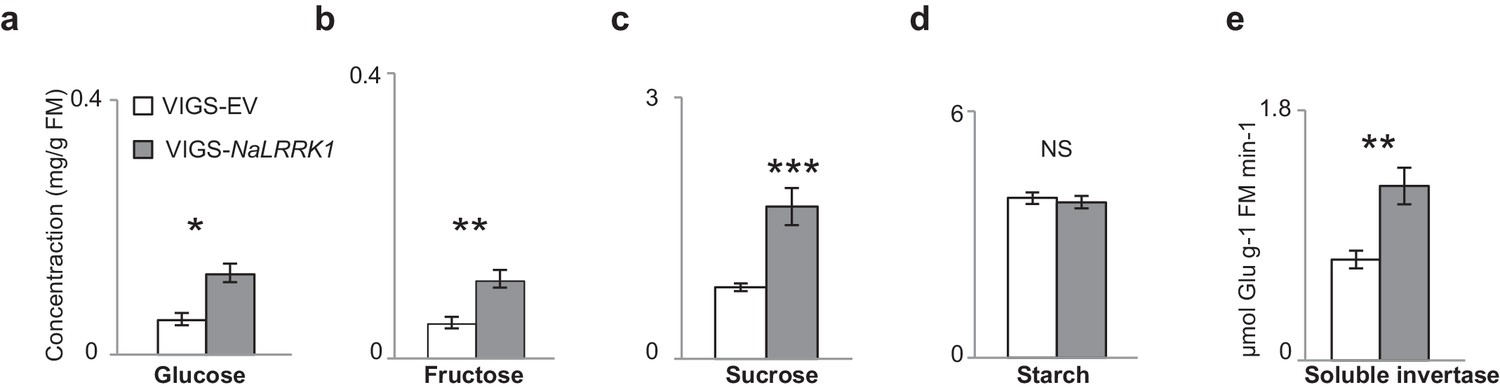
VIGS-NaLRRK1 plants accumulated higher levels of FAC induced soluble sugars and invertase activity in comparison to control.
(a–d) concentrations of different soluble sugars in VIGS-EV and VIGS-NaLRRK1 plants. (e) the activity of soluble invertase in VIGS-EV and VIGS-NaLRRK1 plants. Leaves were collected at 24 hr after wounding and FAC elicitations. Asterisks indicate significant differences between VIGS-EV and VIGS-NaLRRK1 plants (*, p<0.05; **, p<0.01; ***, p<0.001, Student’s-t test). Data are presented as means ± SEM.
Figure 8
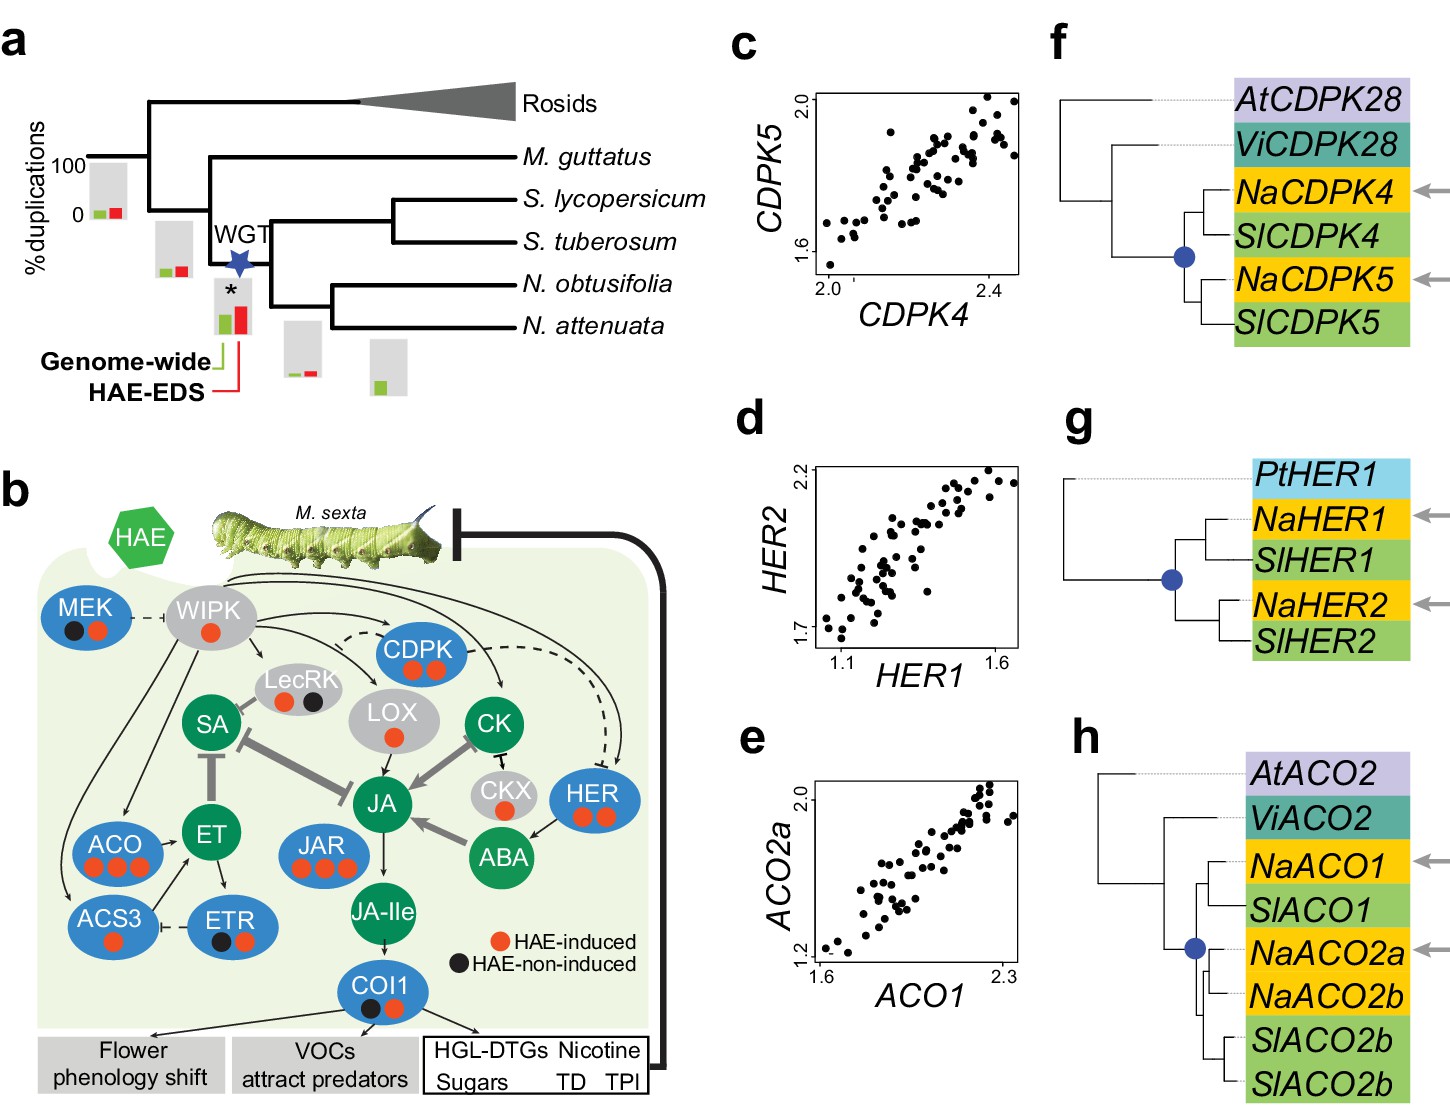
Solanaceae WGT contributed to the evolution of HAE-induced defense signaling in Nicotiana.
(a) the gene duplication history of Nicotiana attenuata genes after the divergence of eudicots and monocots. Phylogenetic tree constructed based on one-to-one orthologue genes. The bars under each branch depict the percentage of duplications that occurred at a given branch. The green bar indicates the genome-wide (all genes expressed in leaves) pattern; red bar indicates the duplication events found in module M4. (b) WGT contributed to the evolution of genes that are involved in HAE-induced EDS. All genes are shown as ellipses, and phytohormones as circles. The color of every ellipse shows the most recent duplication events for each gene: blue and gray indicate the Solanaceae WGT, and ancient (shared with Arabidopsis) duplications, respectively. The dots underneath each gene represent the number of homologues found in the N. attenuata genome, and the color indicates whether the homologue was induced by FAC in N. attenuata. Red: significantly induced (FDR adjusted p<0.05, fold change greater than 1.5), black: not induced. Dashed lines indicate the indirect functional interactions. TD: THREONINE DEAMINASE; HGL-DTGs: 17-hydroxygeranyllinalool diterpene glycosides; TPI: trypsin proteinase inhibitor. (c–e) the co-expression patterns between the two homologous genes that likely resulted from the Solanaceae WGT; The expression values of each gene were from control and FAC-induced samples from the six Nicotiana species. (f–h) phylogenetic trees showing the duplication history of NaCDPK4/5 (f), NaHER1/2 (g) and NaACO1/2 (h). The blue dot on the phylogenetic tree indicates the duplication events shared among Solanaceae species. The node colors indicate which species the homolog sequences belong to. At (lilac): Arabidopsis thaliana; Vi (turquoise): Vitis vinifera; Pt (light blue): Populus trichocarpa; Na (yellow): N. attenuata; Sl (green): Solanum lycopersicum.
Tables
Table 1
M4 module is highly preserved among four studied Nicotiana species. The number in each cell refers to the z-summary score calculated using 'modulePreservation' function from WGCNA package. Species in row and column indicate the reference and testing datasets, respectively. The score above 10 indicates the co-expression module is preserved, whereas the score bellow 2 indicate the module is not preserved. For all comparisons, p-values based on permutation tests are smaller than 2.2E-16.
| N. obtusifolia | N. attenuata | N. miersii | N. pauciflora | |
|---|---|---|---|---|
| N. obtusifolia | - | 20.5 | 18.2 | 21.0 |
| N. attenuata | 29.4 | - | 34.9 | 31.2 |
| N. miersii | 22.8 | 38.8 | - | 27.8 |
| N. pauciflora | 23.4 | 26.2 | 27.4 | - |
Table 2
Genes from multiple copy gene families and genes containing DTT-NIC1 TE insertions within 1kb upstream region are significantly enriched in the Nicotiana EDS network. The total number of genes used to test gene duplications and the DTT-NIC1 insertions analyses differed due to the additional filtering processes used in the former analysis. For the gene duplication analysis, we excluded all genes whose most recent duplication event was uncertain. WGT: whole genome triplication; NLD refers to Nicotiana lineage specific duplications; complete EDS refers to all of genes identified in the M4 module; conserved EDS refers to M4 genes that were significantly induced by FAC in all three species, N. attenuata, N. acuminata and N. linearis; genome-wide patterns were calculated based on all of genes that were expressed in Nicotiana leaves (normalized FPKM greater than 5 in at least three samples). Bold font color highlights the statistically significant values. Odd ratios were calculated by the following formula: Odd = (p1/[1 – p1])/(p2/[1 – p2]), where p1 is the percentage of genes that are part of the EDS network among testing group, e.g., genes from multiple gene families or genes retained from Solanaceae WGT, and p2 is the percentage of genes that are part of EDS network among all leaf expressed genes.
| # genes from multiple copy families | # genes retained from Solanaceae WGT | # genes retained NLD | Total number of genes after filtering | ||
|---|---|---|---|---|---|
| Genome wide | # genes | 9691 | 6181 | 1249 | 14,642 |
| Complete EDS | # genes | 906 | 587 | 87 | 1140 |
| Odd ratio | 1.97 | 1.45 | 0.86 | ||
| p value | < 2.2E-16 | 3.30E-10 | 0.17 | ||
| Conserved EDS | # genes | 561 | 355 | 65 | 692 |
| Odd ratio | 2.18 | 1.45 | 1.07 | ||
| p value | < 2.2E-16 | 1.71E-06 | 0.41 | ||
Appendix 1—table 1
Insertions of the MITEs family DTT-NIC1 is significantly enriched in 1kb upstream region of M4 module genes. p-values were calculated based on exact binomial test. Superfamilies are represented using different letters in the names: DTT for Tc1/Mariner, DTM for Mutator, DTA for hAT, DTH for PIF/Harbinger. Statistically significant one is highlighted in red.
| MITEs name | Number of insertions to regulatory region of M4 module genes | Odd ratio | p-value |
|---|---|---|---|
| DTA_NIC1 | 4 | 0.54 | 0.32 |
| DTA_NIC2 | 3 | 1.14 | 0.75 |
| DTA_NIC3 | 22 | 1.38 | 0.16 |
| DTA_NIC4 | 3 | 0.55 | 0.49 |
| DTA_NIC5 | 1 | 0.23 | 0.19 |
| DTA_NIC6 | 4 | 0.68 | 0.66 |
| DTA_NIC7 | 1 | 0.72 | 1.00 |
| DTA_NIC8 | 1 | 0.61 | 1.00 |
| DTA_NIC9 | 12 | 1.42 | 0.28 |
| DTH_NIC1 | 23 | 1.53 | 0.063 |
| DTH_NIC2 | 23 | 1.14 | 0.56 |
| DTH_NIC3 | 11 | 1.28 | 0.38 |
| DTT_NIC1 | 65 | 1.63 | 0.0049 |
Appendix 1—table 2
Seven DNA motifs are significantly enriched in the 1kb upstream region of M4 module genes. The presence of the motif in sequences and p-values were obtained using the HOMER package. Motif sequences were annotated by searching the plant cis-regulatory sequence database in PlantPan2 (http://plantpan2.itps.ncku.edu.tw/).
| Motif sequence | Annotation | Presence in M4 module genes (%) | Presence in background dataset (%) | p value |
|---|---|---|---|---|
| AGTCAACG | W-box1 | 60.5 | 38.5 | 1.0E-53 |
| TTGACCWT | W-box2 | 69.0 | 48.4 | 1.0E-47 |
| NNACGCGT | unknown | 19.7 | 10.0 | 1.0E-23 |
| TTCACACG | unknown | 18.7 | 11.6 | 1.0E-12 |
| GTCGGCTG | unknown | 39.5 | 29.7 | 1.0E-12 |
| CGAAGACT | unknown | 32.0 | 23.3 | 1.0E-11 |
| TTTCCACG | unknown | 34.3 | 25.9 | 1.0E-10 |
Additional files
-
Supplementary file 1
Six supplementary tables.
(A) Genes induced by FAC in all six Nicotiana species. Green and red colors indicate e3 ubiquitin-protein ligase and transcription factors, respectively. (B) Genes which showed lower expression in samples induced by M. sexta OS than by FAC in both N. attenuata and N. pauciflora. Numbers in each column indicate the TMM-normalized FPKM values. (C) Summary of RNA-seq reads from six closely related Nicotiana species. (D) Primers used for qPCR and VIGS in this study.
- https://doi.org/10.7554/eLife.19531.020
Download links
A two-part list of links to download the article, or parts of the article, in various formats.
Downloads (link to download the article as PDF)
Open citations (links to open the citations from this article in various online reference manager services)
Cite this article (links to download the citations from this article in formats compatible with various reference manager tools)
Evolution of herbivore-induced early defense signaling was shaped by genome-wide duplications in Nicotiana
eLife 5:e19531.
https://doi.org/10.7554/eLife.19531


