Global mapping of highly pathogenic avian influenza H5N1 and H5Nx clade 2.3.4.4 viruses with spatial cross-validation
- Université Libre de Bruxelles, Belgium
- Government of Haryana, India
- International Livestock Research Institute, Kenya
- Université de Namur, Belgium
- Swiss Institute of Bioinformatics, Switzerland
- University of Lausanne, Switzerland
- University of Oklahoma, United States
- Fudan University, China
- Food and Agriculture Organization of the United Nations, Italy
- FAO Regional Office for Asia and the Pacific, Thailand
- Food and Agriculture Organization of the United Nations, Vietnam
- Fonds National de la Recherche Scientifique, Belgium
Figures
Figure 1 with 1 supplement
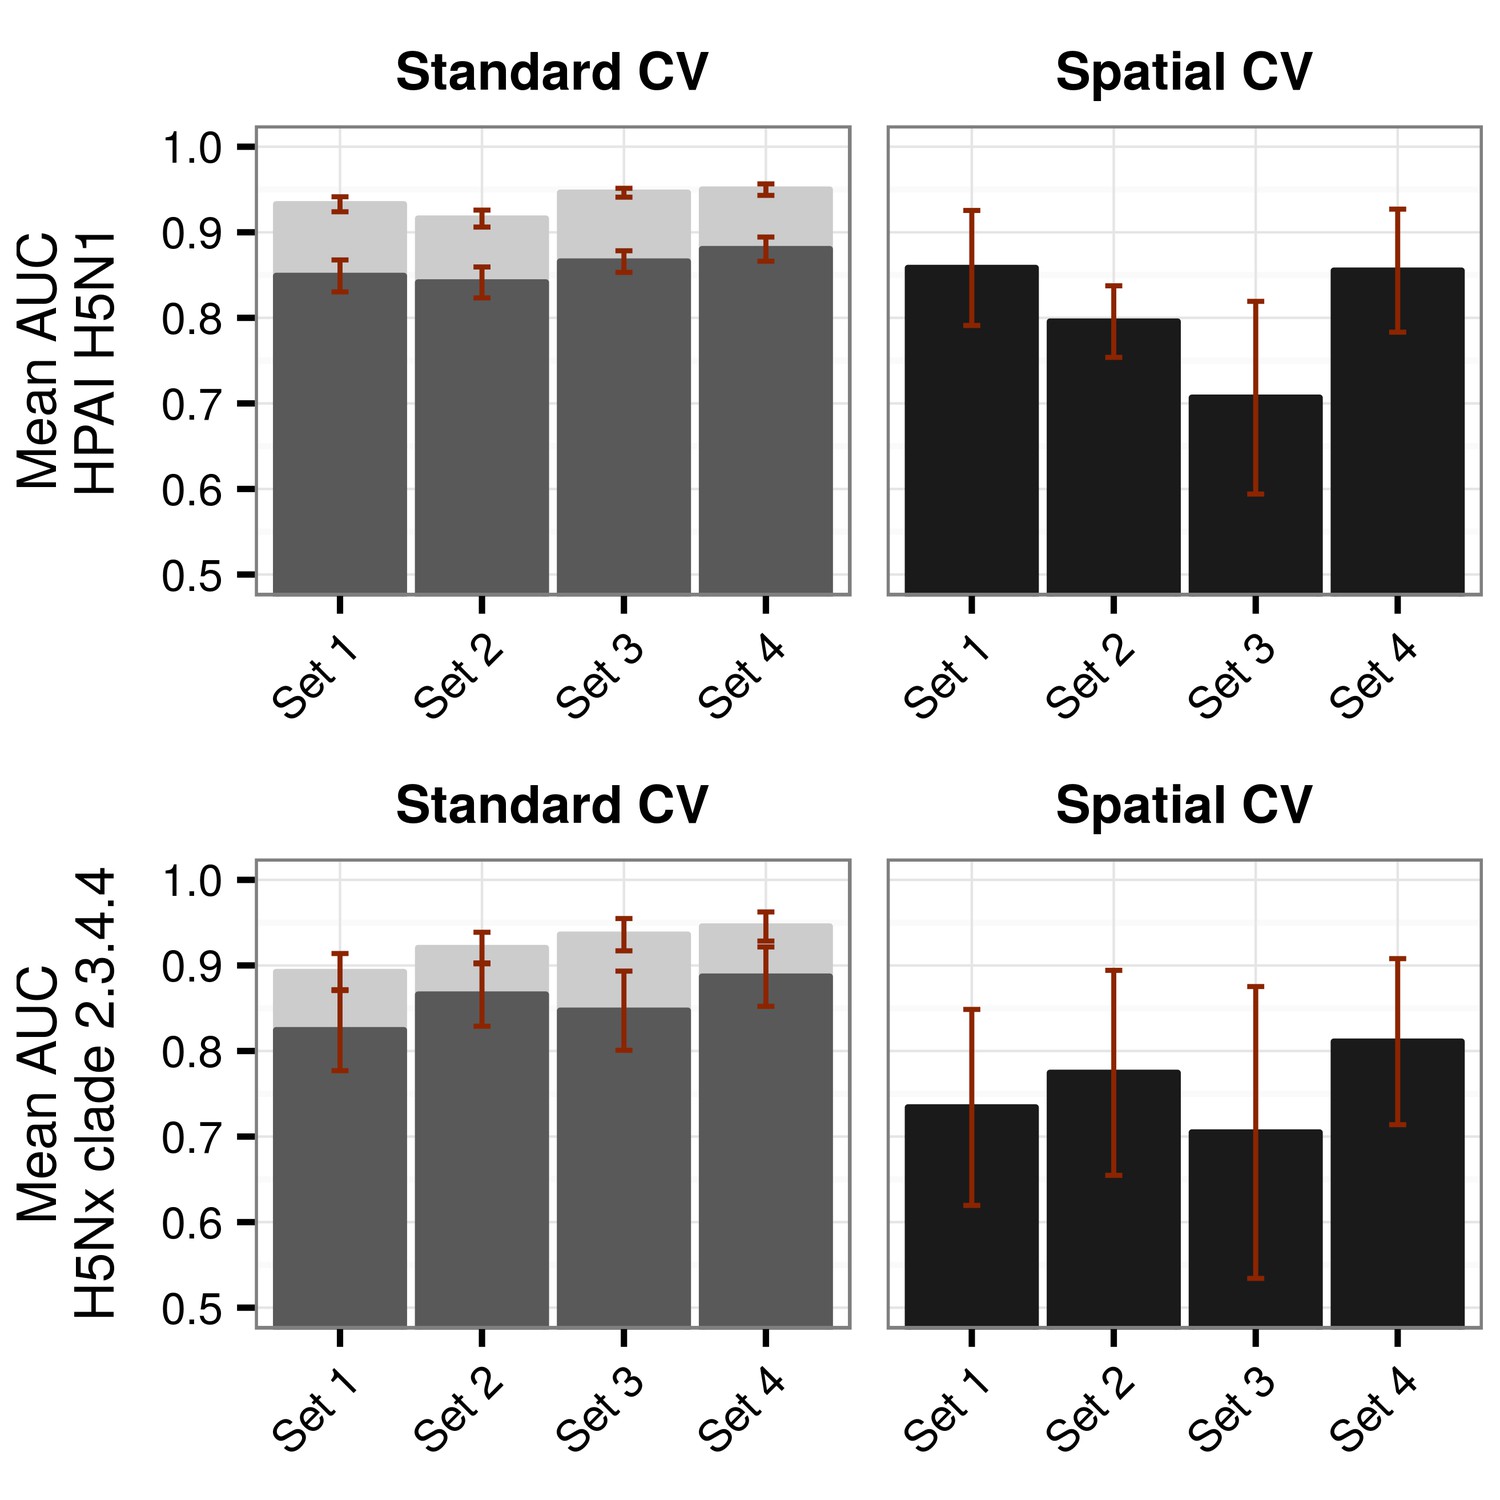
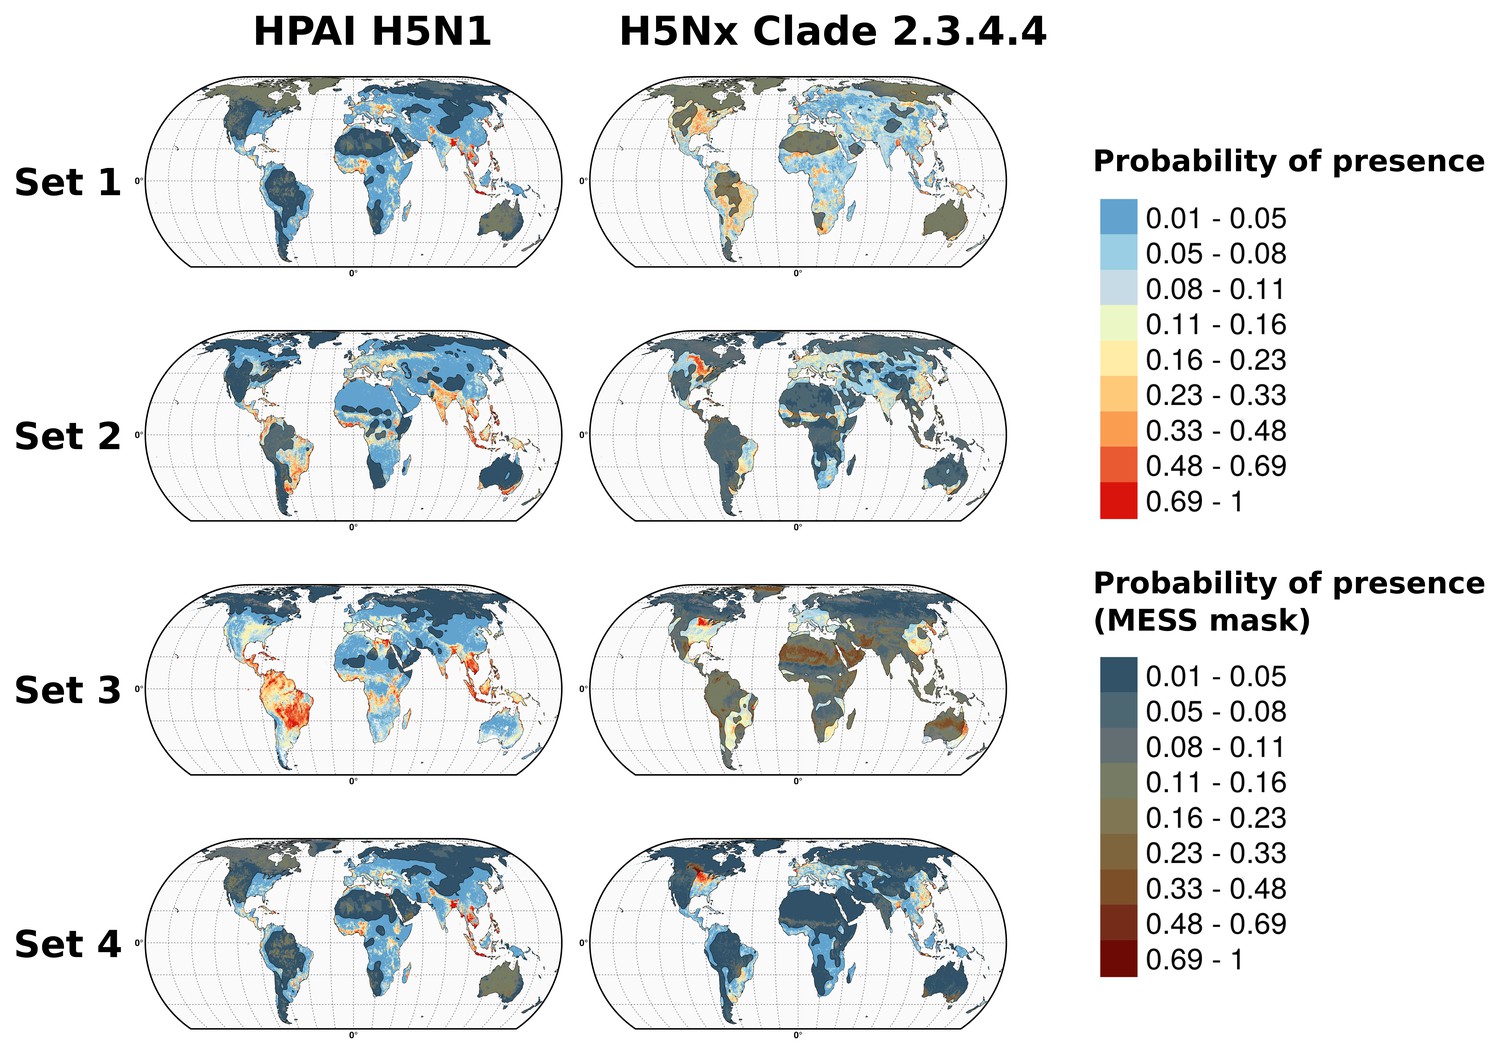
Representation of Area under Receiver Operating Curve (AUC) values for HPAI H5N1 and H5Nx models.
Representation of AUC values for HPAI H5N1 and New Clade H5Nx 2.3.4.4 model for all sets of predictor variables, assessed through standard cross validation (Standard CV), in light grey, and accounting for spatial sorting bias (SSB) in dark grey. On the right, the AUC values for spatial cross validation (Spatial CV) are represented in black. All these metrics represent mean AUC ± standard deviation. Additionally, the AUC values for Set 2.1 and Set 3.1 are represented in Figure 1—figure supplement 1.
Figure 1—figure supplement 1
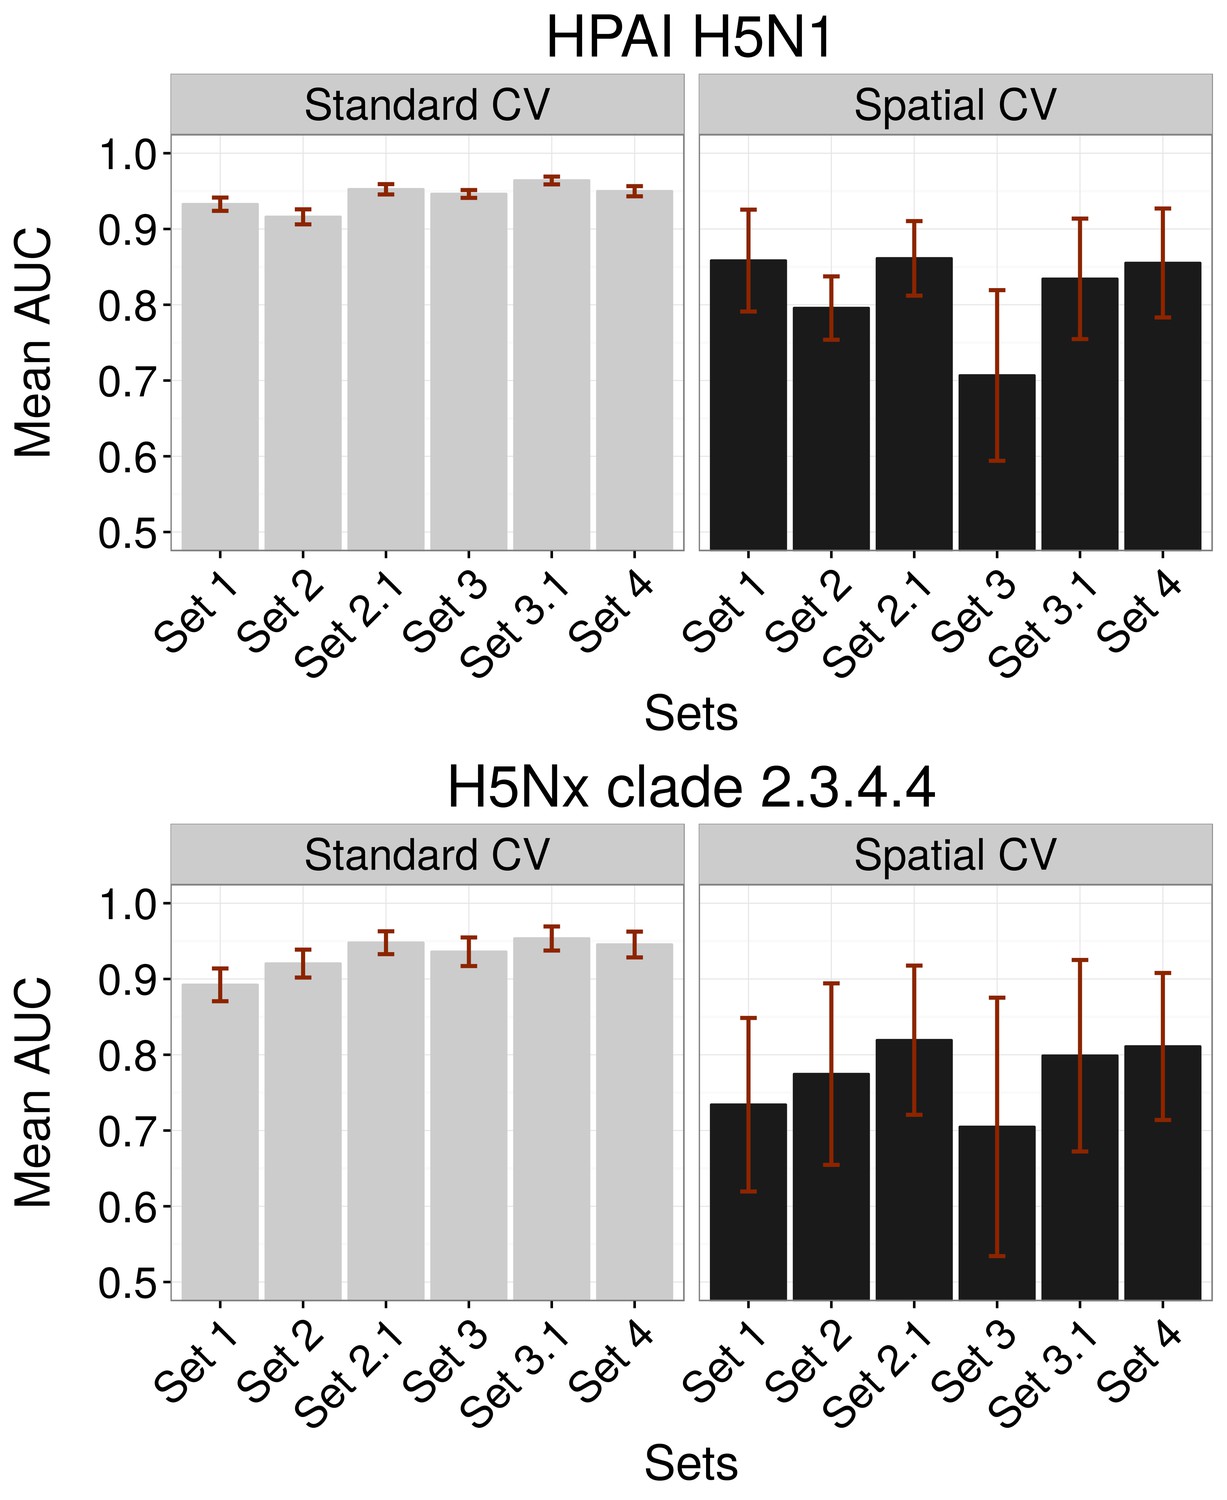
Comparison of AUC values of additional sets (Set 2.1 and Set 3.1) of predictor variables.
AUC values for HPAI H5N1 (top) and New Clade H5Nx 2.3.4.4 (below) models for Set 1 (host variables), Set 2 (land use and land cover variables), Set 3 (eco-climatic variables), Set 4 (selection of variables on the basis of prior epidemiological knowledge), Set 2.1 (Set 2 and Set 1) and Set 3.1 (Set 3 and Set 1) of predictor variables, assessed through standard cross validation (Standard CV, left) and spatial cross validation (Spatial CV, right). The predictor variable sets are detailed in Table 1.
Figure 2
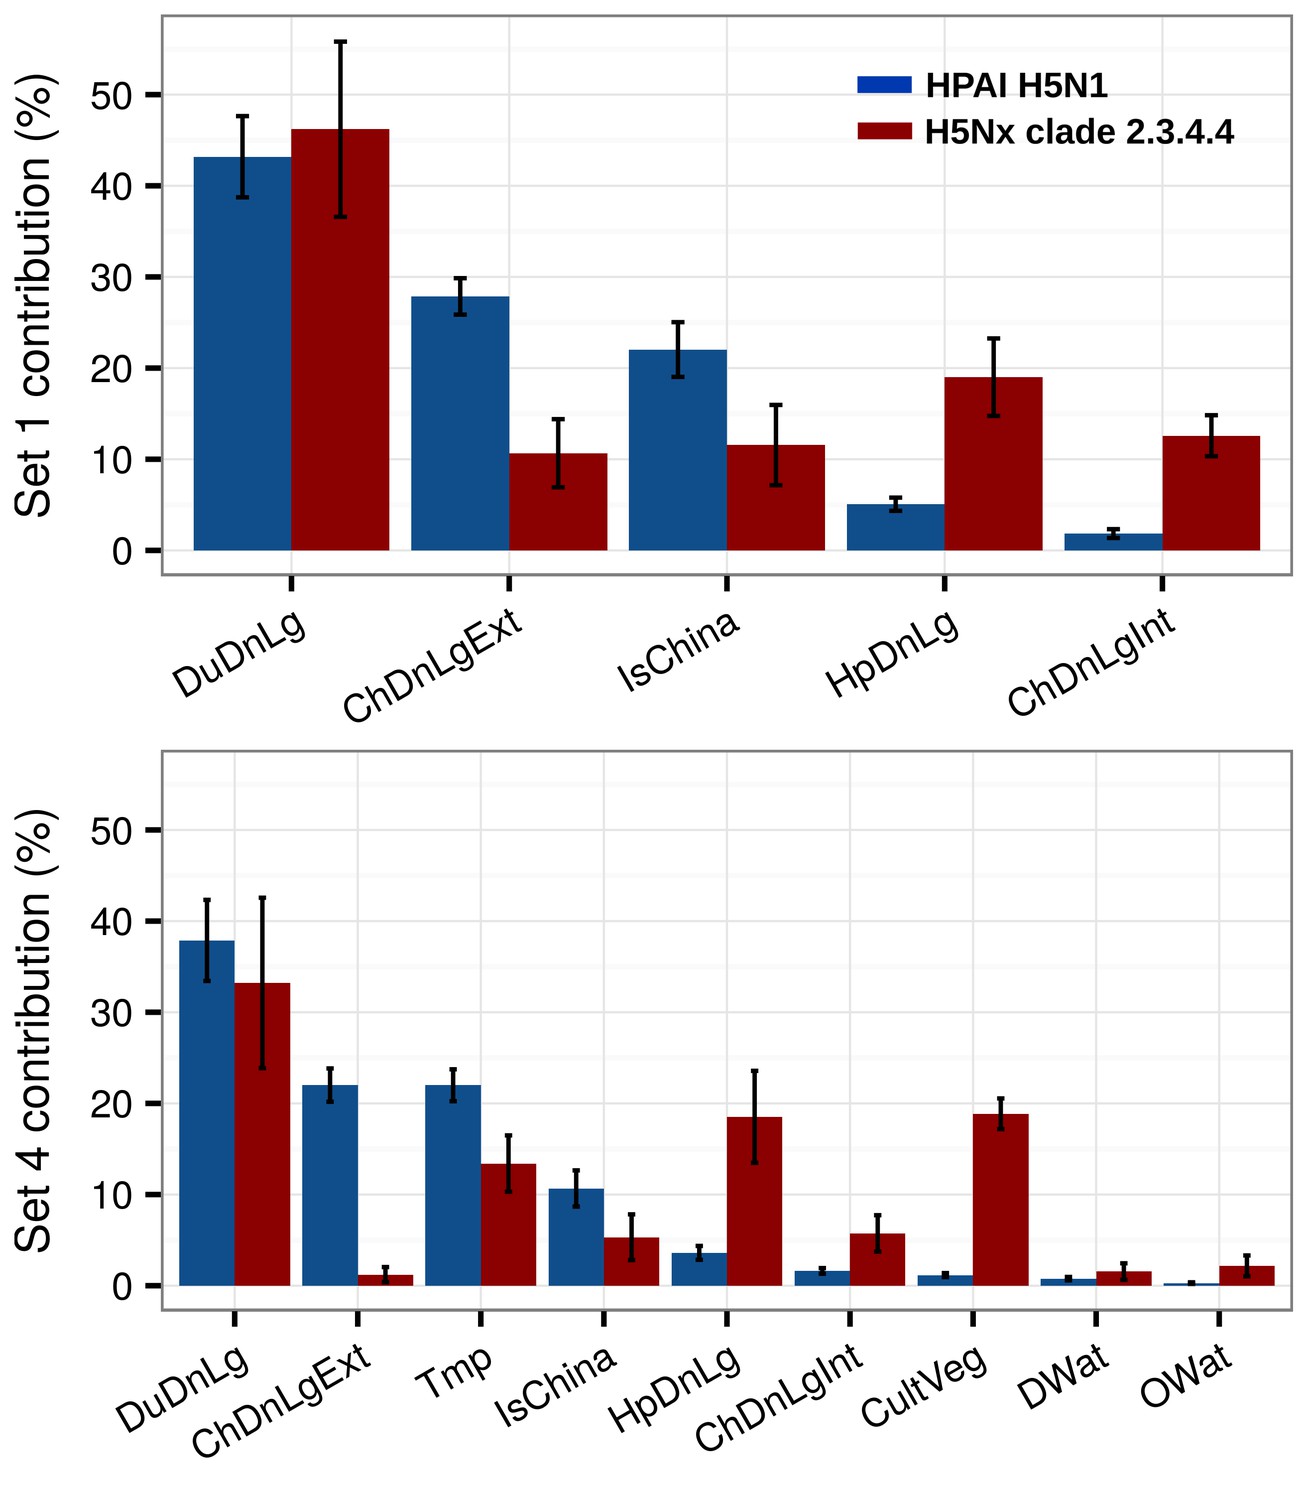
Summary of mean relative contributions for sets of predictor variables.
Summary of the mean relative contributions (%) ± standard deviation of different sets of predictor variables for boosted regression tree models for HPAI H5N1 (in blue) and H5Nx clade 2.3.4.4 (in red). The relative contribution is a measure of the relative importance of each predictor variable included in a BRT model to compute the model prediction. Set 1 predictor variables are represented on top, and Set 4 predictor variables are represented below.
Figure 3 with 2 supplements
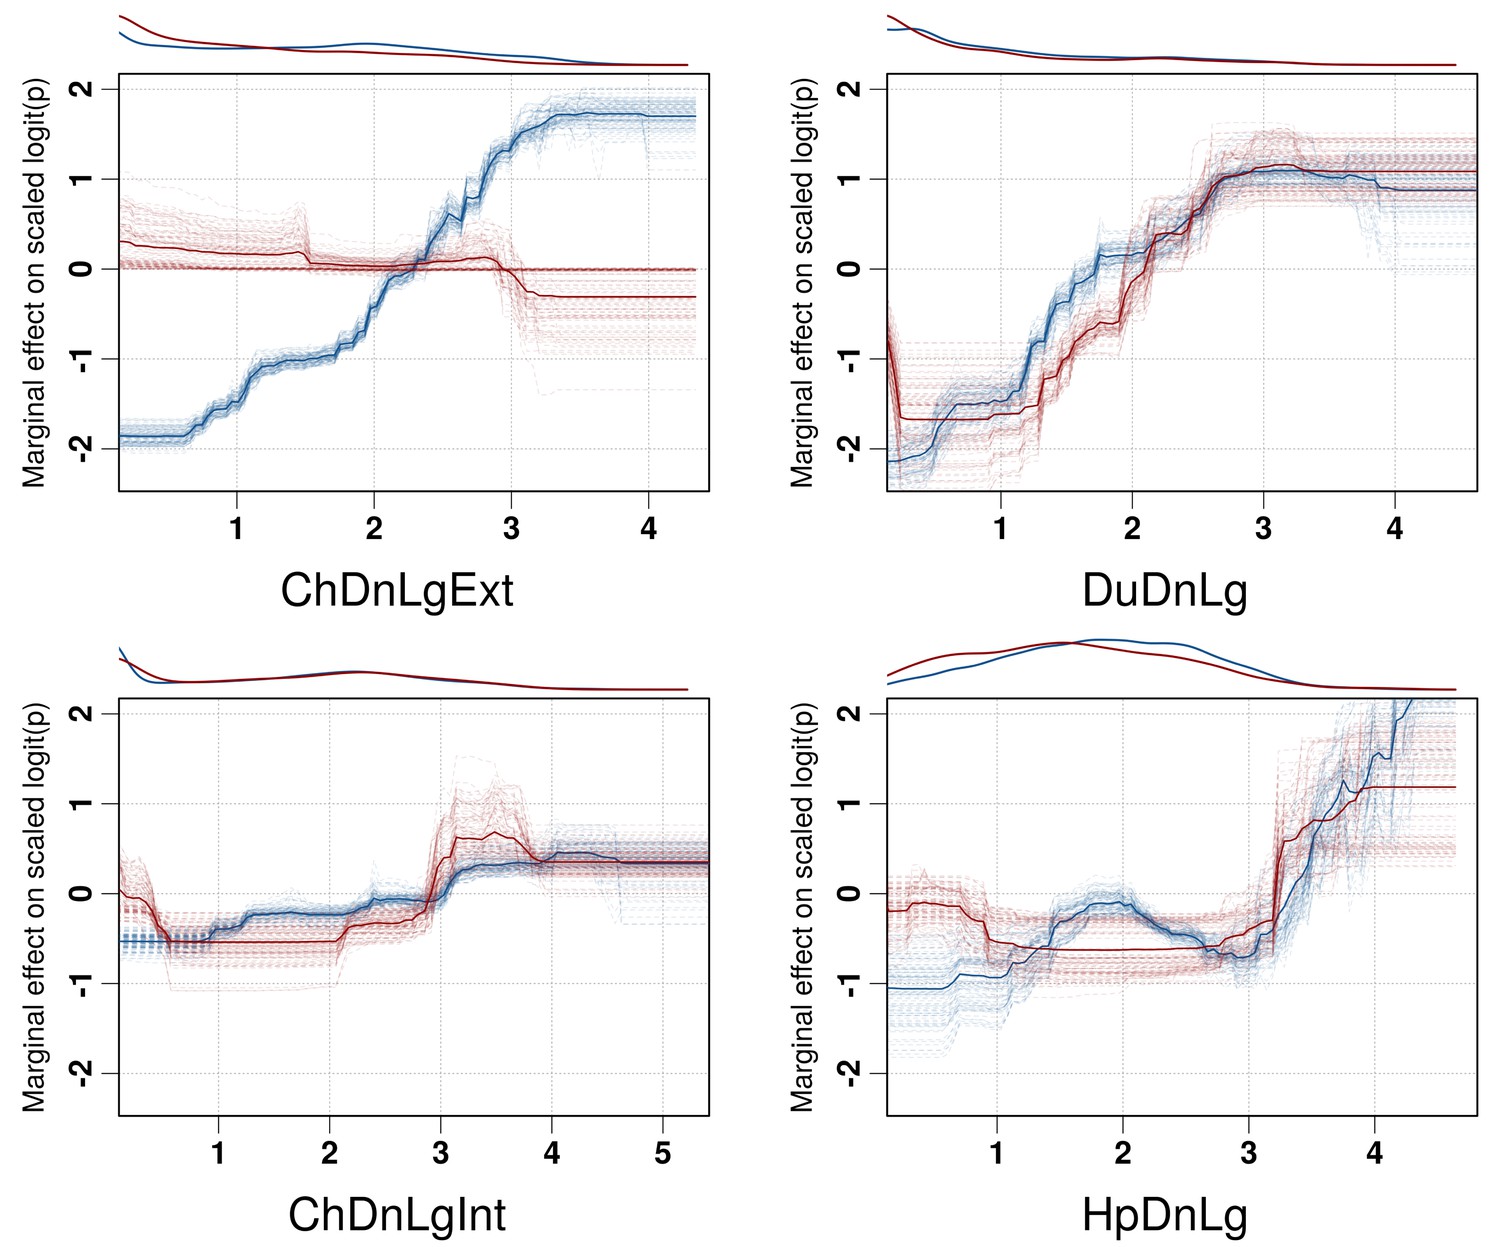
Boosted Regression Tree (BRT) profiles of selected predictor variables.
BRT profiles or partial dependence plots of selected predictor variables for the global HPAI H5N1 (in blue) and H5Nx clade 2.3.4.4 model (in red). The BRT profiles provide a graphical description of the marginal effect of a predictor variable on the response (the probability of virus presence). The solid line represents the mean profile, whilst transparent lines represent each bootstrap. On the top of each plot, the density function of the observed distribution of predictors is displayed for one bootstrap and for the two datasets (HPAI H5N1- in blue and H5Nx clade 2.3.4.4- in red). Four predictor variables were selected for this figure: human population density (HpDnLg), extensive chicken density (ChDnLgExt), intensive chicken density (ChDnLgInt) and duck density (DuDnLg). The BRT profiles of Set 2, Set 3 and Set 4 predictor variables are represented in Figure 3—figure supplement 1. The optimal number of trees at which holdout deviance is minimised in the BRT models for all sets of predictor variables is represented in Figure 3—figure supplement 2.
Figure 3—figure supplement 1
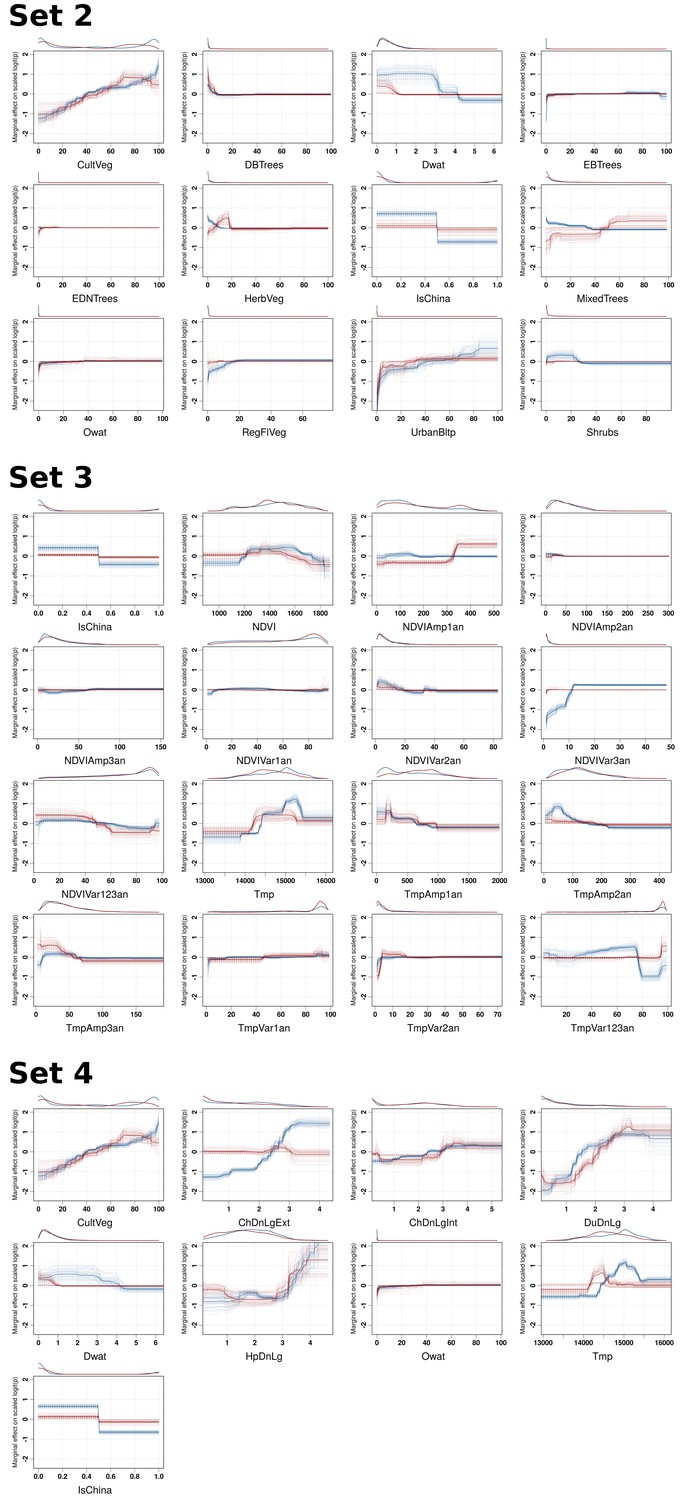
BRT profiles of Set 2, Set 3 and Set 4 predictor variables.
BRT partial dependence plots for the predictor variables for the global HPAI H5N1 (blue) and H5Nx clade 2.3.4.4 model (red) for Set 2, Set 3, and Set 4. Abbreviations of the variables are detailed in Table 1.
Figure 3—figure supplement 2
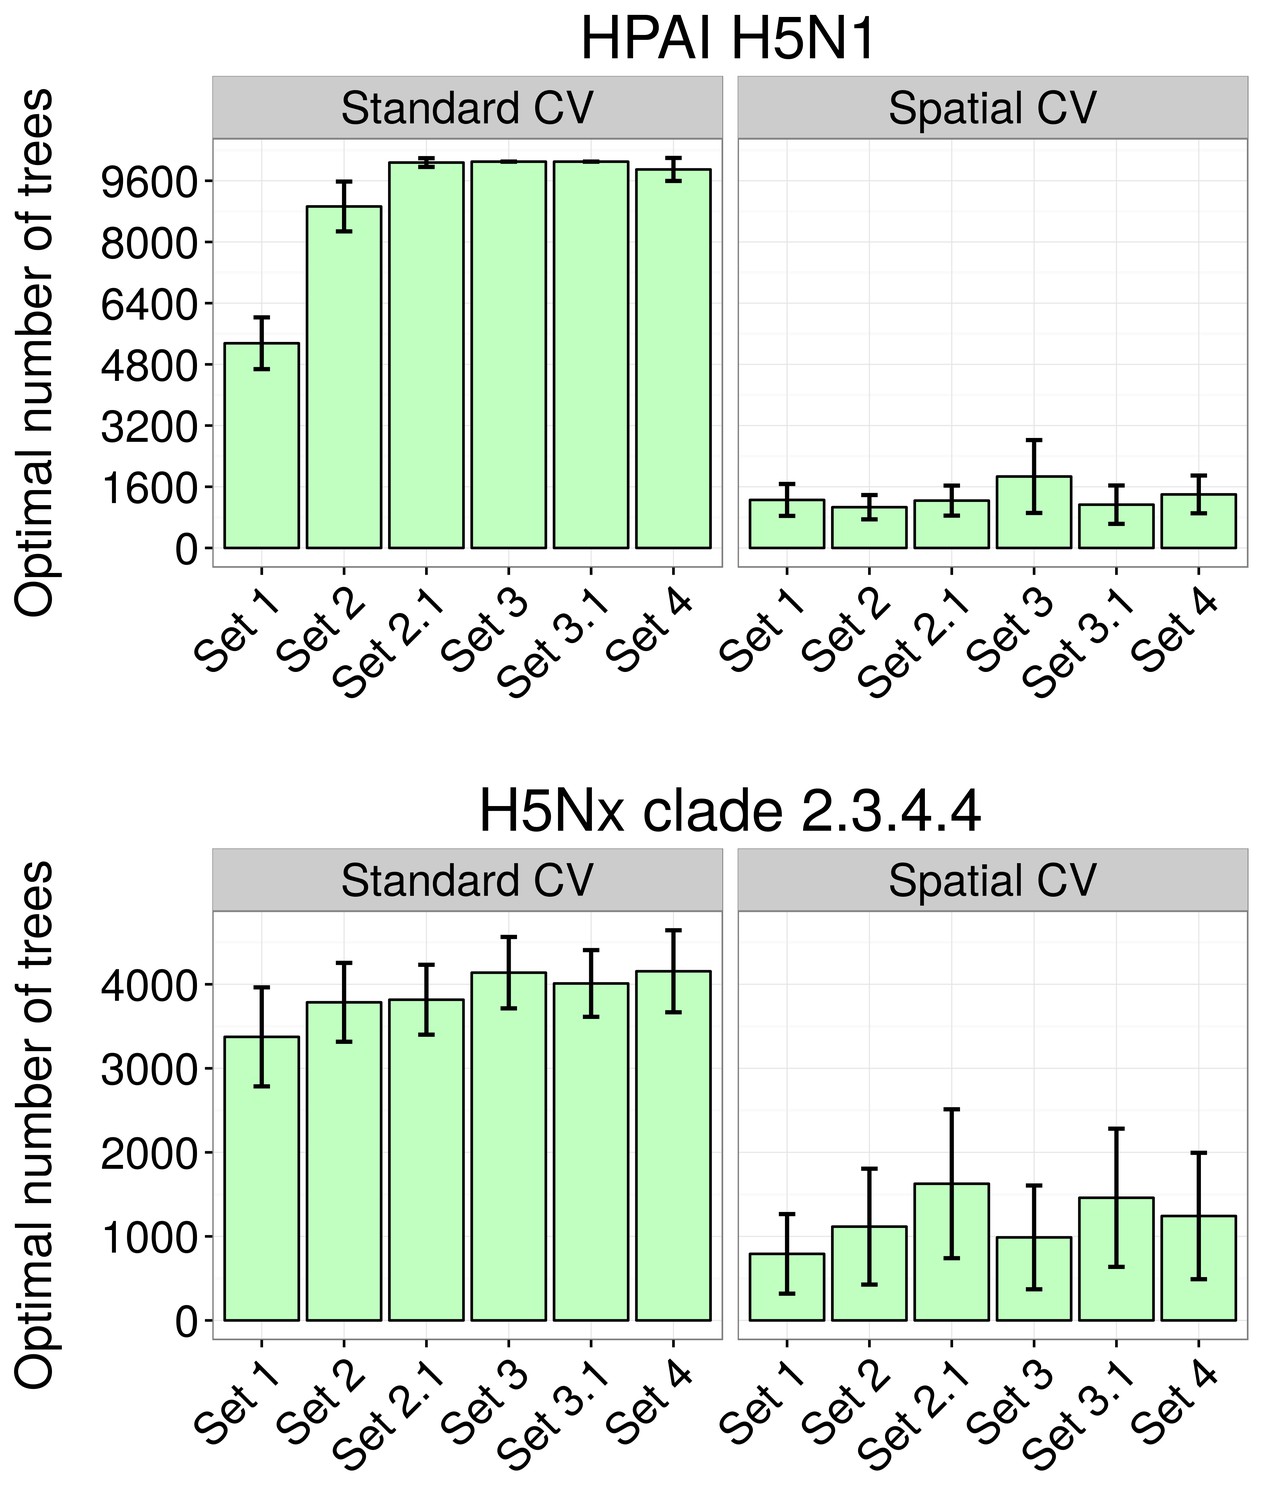
Optimal number of trees at which holdout deviance is minimised in BRT models.
Optimal number of trees at which holdout deviance is minimised (with standard deviation) for prediction in BRT models for HPAI H5N1 (top) and H5Nx clade 2.3.4.4 (bottom) for all sets of predictor variables, using standard and spatial cross validation (CV), showing the drastic reduction in optimal number of trees resulting form the spatial CV. The BRT models were trained with two sets of setting parameter, one set for each virus.
Figure 4 with 3 supplements
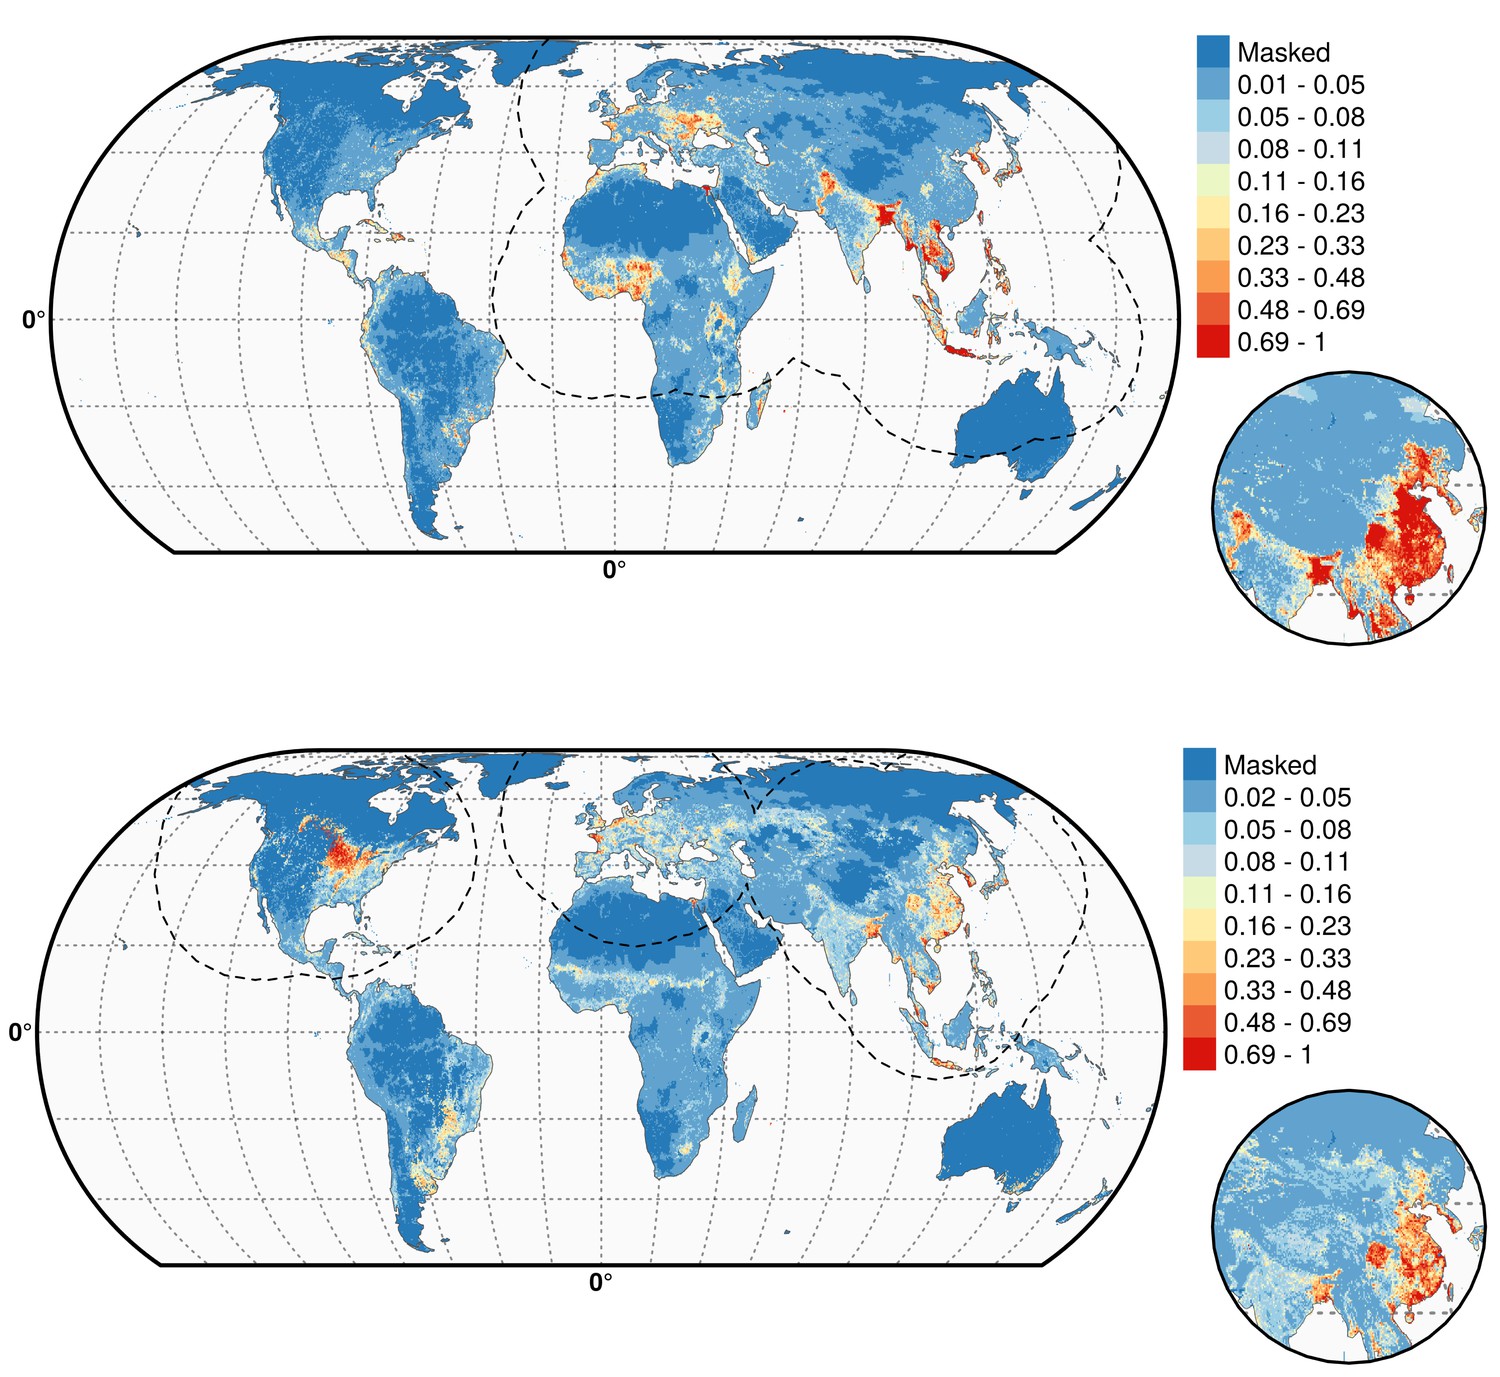
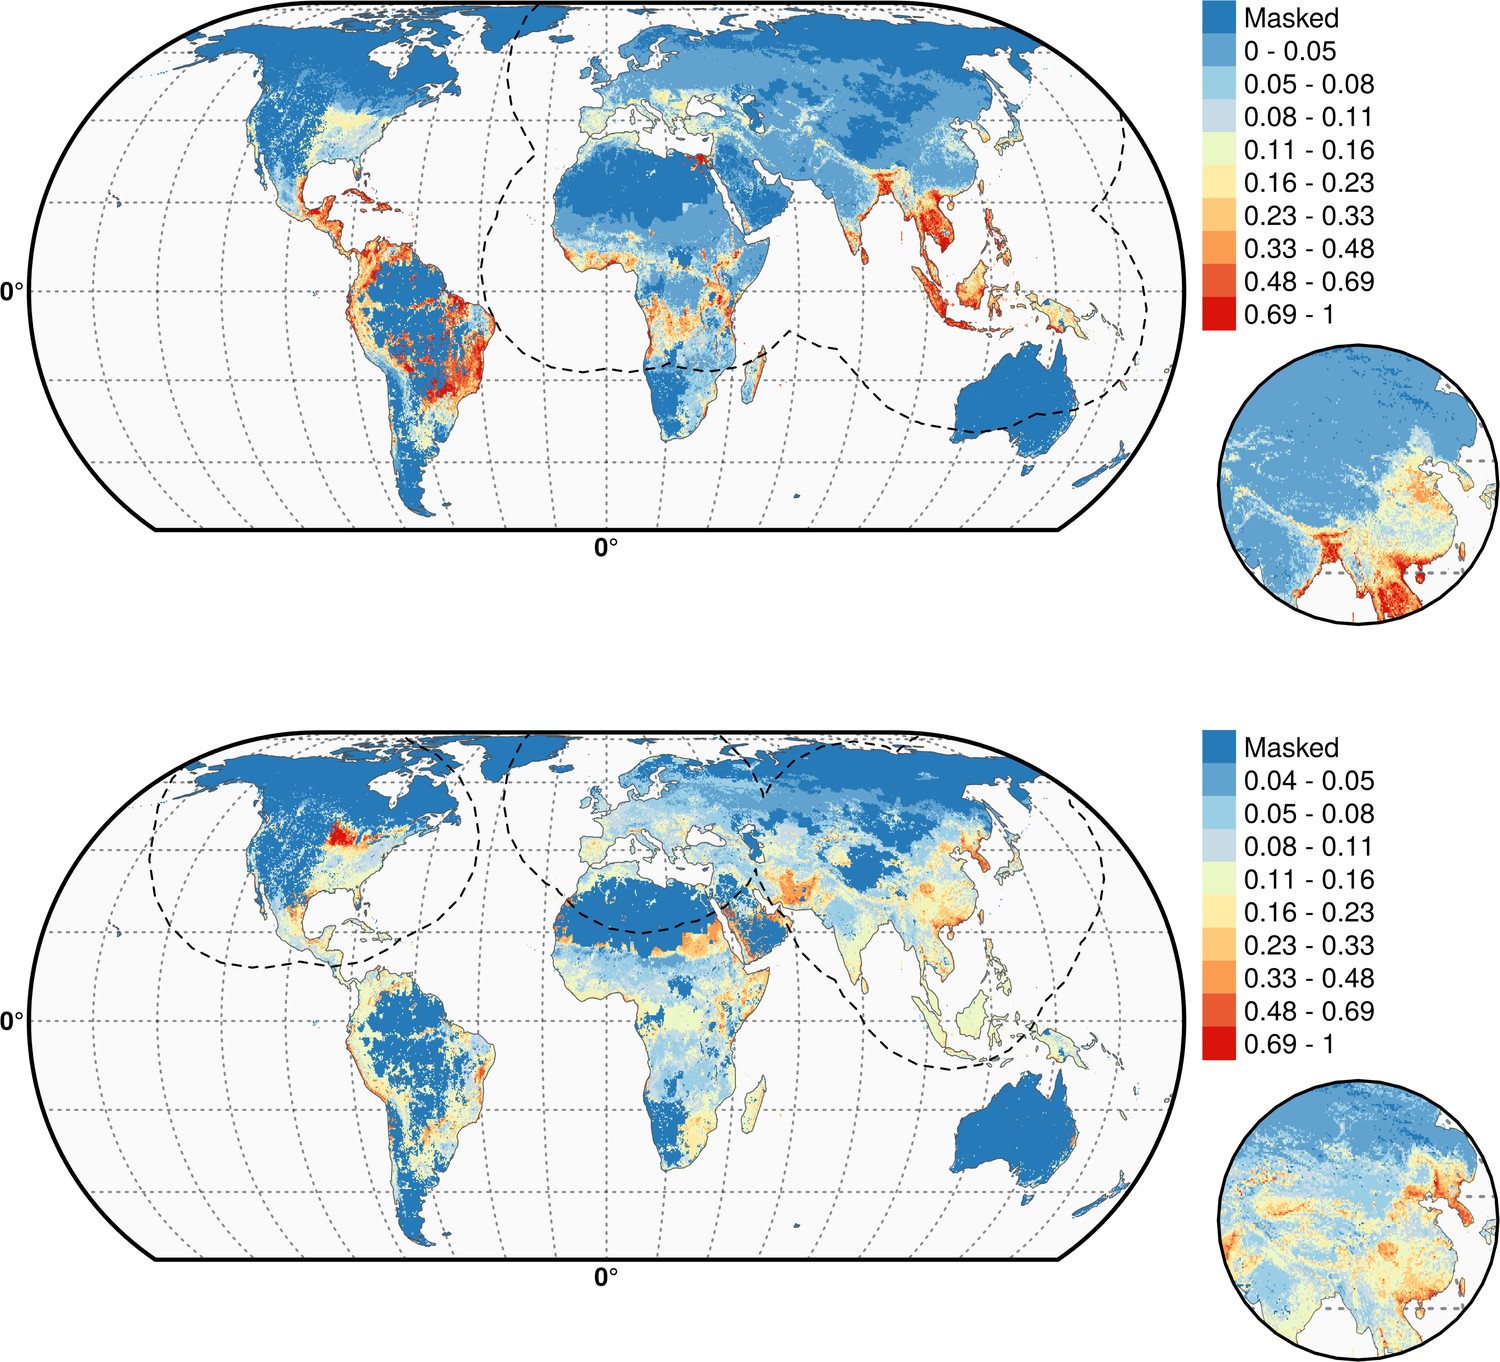
Predicted probability of occurrence of HPAI H5N1 and H5Nx clade 2.3.4.4.
Predicted probability of occurrence of HPAI H5N1 for the Set 1 (top) and of H5Nx clade 2.3.4.4 for the Set 4 (bottom) (Figure 4—source data 1 and 2 respectively). The dashed black line represents a buffer around the occurrence data for the HPAI H5N1 and H5Nx clade 2.3.4.4 predictions, corresponding to an area from which pseudo-absences were selected. The circle inset shows the prediction obtained when the effect of the variable IsChina was removed. The suitability maps HPAI H5N1 and H5Nx clade 2.3.4.4 for Set 2 and Set 3 variables are presented in Figure 4—figure supplement 1 and Figure 4—figure supplement 2 , respectively. The shapefile data used to produce these maps were all from public sources (http://www.naturalearthdata.com/). The graticule is composed of a 20-degree increments and the coordinate system is Eckert IV (EPSG: 54012). This figure was built with the R-3.2.4 software (https://cran.r-project.org/). Additionally, Figure 4—figure supplement 3 depicts the Multivariate environmental similarity surfaces (MESS) maps for HPAI H5N1 and H5Nx clade 2.3.4.4 for the four sets of predictor variables.
-
Figure 4—source data 1
Suitability predictions for the HPAI H5N1 best model (GeoTiff format).
- https://doi.org/10.7554/eLife.19571.010
-
Figure 4—source data 2
Suitability predictions for the H5Nx clade 2.3.4.4 best model (GeoTiff format).
- https://doi.org/10.7554/eLife.19571.011
Figure 4—figure supplement 1
Predicted probability of occurrence of HPAI H5N1 (top) and of H5Nx clade 2.3.4.4 (bottom) for the Set 2 variables.
The dashed black line represents a buffer around the occurrence data for the HPAI H5N1 and H5Nx clade 2.3.4.4 predictions, corresponding to an area from which pseudo-absences were selected. This figure was built with the R-3.2.4 software (https://cran.r-project.org/). The shapefile data used to produce these maps were all from public sources. (http://www.naturalearthdata.com/). The graticule is composed of a 20-degree increments and the coordinate system is Eckert IV (EPSG: 54012).
Figure 4—figure supplement 2
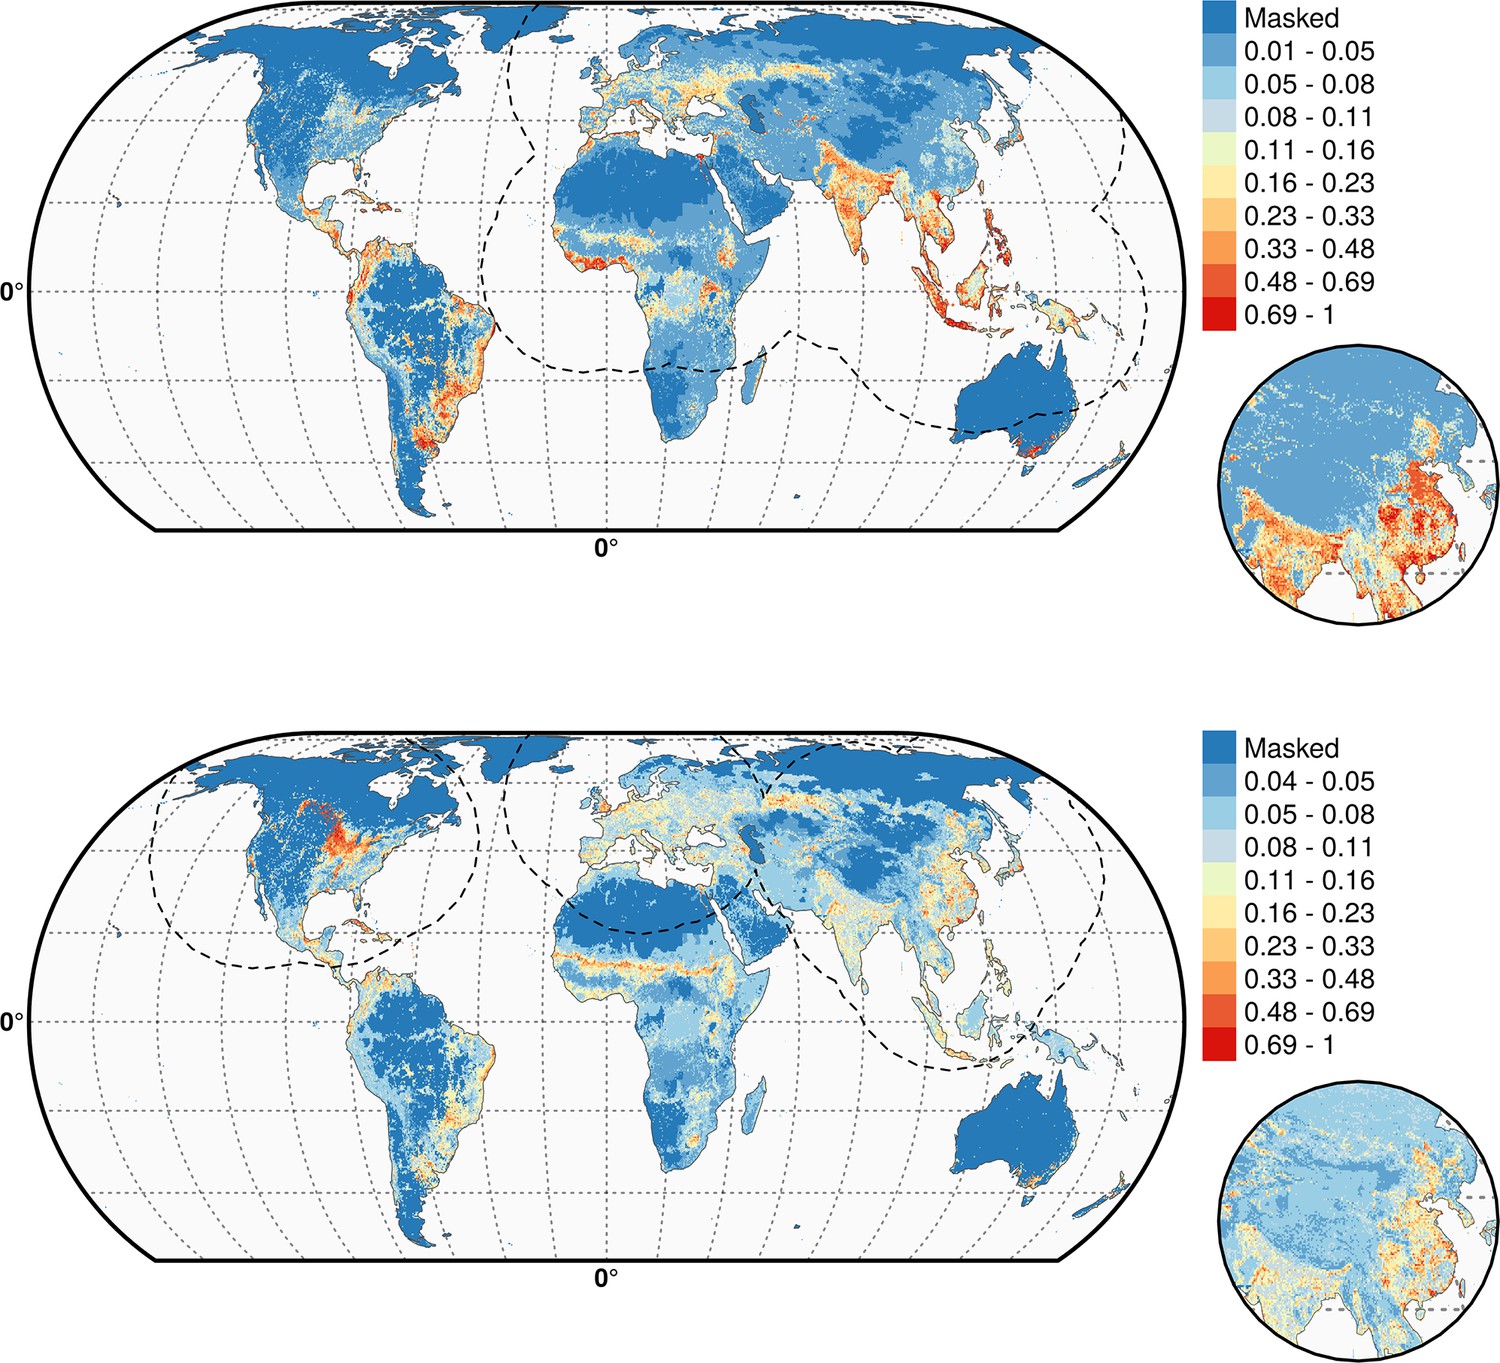
Predicted probability of occurrence of HPAI H5N1 (top) and of H5Nx clade 2.3.4.4 (bottom) for the Set 3 variables.
Predicted probability of occurrence of HPAI H5N1 (top) and of H5Nx clade 2.3.4.4 (bottom) for the Set 3 variables. The dashed black line represents a buffer around the occurrence data for the HPAI H5N1 and H5Nx clade 2.3.4.4 predictions, corresponding to an area from which pseudo-absences were selected.. This figure was built with the R-3.2.4 software (https://cran.r-project.org/).The shapefile data used to produce these maps were all from public sources (http://www.naturalearthdata.com/). The graticule is composed of a 20-degree increments and the coordinate system is Eckert IV (EPSG: 54012).
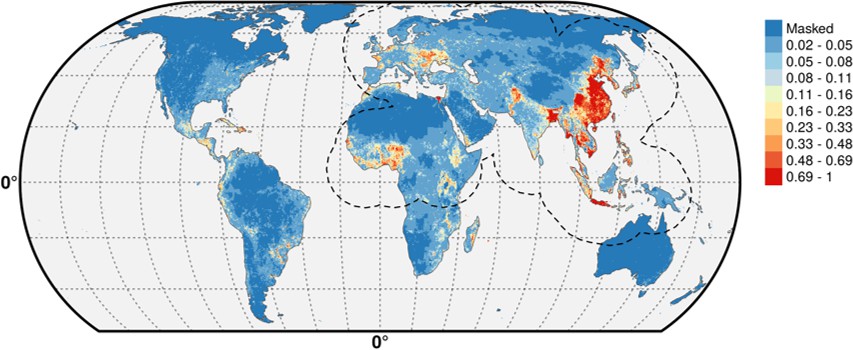
Figure 4—figure supplement 3
Multivariate environmental similarity surfaces (MESS) maps for HPAI H5N1 and H5Nx clade 2.3.4.4.
Predicted probability of occurrence of HPAI H5N1 and of H5Nx clade 2.3.4.4 for the different sets of predictors, with the Multivariate environmental similarity surfaces (MESS) mask. The MESS mask covers areas that had predictor variables outside of the range of the predictor variable values in the occurrence points, as quantified by a negative MESS similarity index.
Figure 5
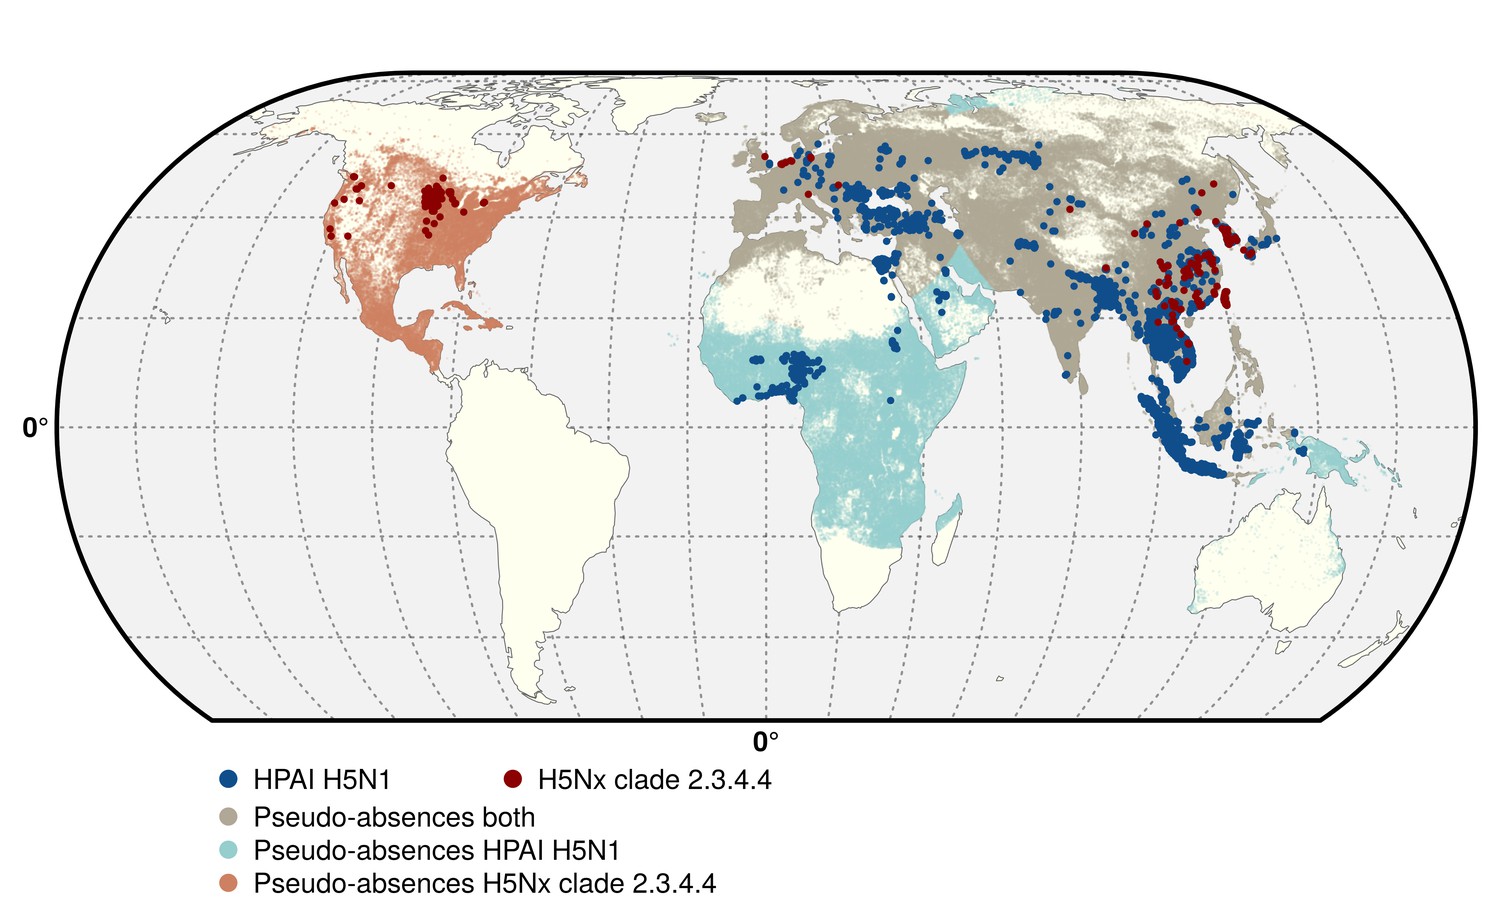
Geographic distribution of presence and pseudo-absences of HPAI H5N1 and HPAI H5Nx clade 2.3.4.4.
Geographic distribution of presence points of HPAI H5N1 (blue) and HPAI H5Nx clade 2.3.4.4 (red). The pseudo-absences are represented in light blue, light red and light brown. This figure was built with the R-3.2.4 software (https://cran.r-project.org/). The shapefile data used to produce these maps were all from public sources (http://www.naturalearthdata.com/). The graticule is composed of a 20-degree increments and the coordinate system is 'EPSG: 54012'.
Figure 6

Spatial cross-validation partition for H5N1 HPAI and H5Nx clade 2.3.4.4.
Visualisation of a typical partition used for the spatial cross-validation of the H5N1 HPAI (top) and H5Nx clade 2.3.4.4 (bottom). The presence and pseudo-absences are partitioned into k (five) clusters for training and testing set. One cluster is used for testing data and k-1 clusters are used for sampling training data. The k (five) reference presence points (randomly sampled in each bootstrap) used to build each clusters are represented in black in the map. The code used for implementing the spatial cross validation is detailed in Source code 1. This figure was built with the R-3.2.4 software (https://cran.r-project.org/). The shapefile data used to produce these maps were all from public sources (http://www.naturalearthdata.com/). The graticule is composed of a 20-degree increments and the coordinate system is 'EPSG:54012.
Author response image 1
Author response image 2

Tables
Table 1
List of predictor variables used for modelling the suitability of HPAI H5N1 and H5Nx clade 2.3.4.4 viruses using BRT models.
Set | Variable full name | Abbreviation | Source |
|---|---|---|---|
Set 1: Host Variables | |||
Duck density | DuDnLg | ||
Extensive Chicken Density | ChDnLgExt | ||
Intensive Chicken Density | ChDnLgInt | ||
Human Population Density | HpDnLg | Linard et al. (2012); Gaughan et al. (2013); Sorichetta et al. (2015); CIESIN's GPW Database | |
Vaccination in China | IsChina | FAO Global Administrative Unit Layers (GAUL) database | |
Set 2 - Land Cover Variables | |||
Evergreen Deciduous Needleleaf Trees | EDNTrees | ||
Evergreen Broadleaf Trees | EBTrees | ||
Deciduous Broadleaf Trees | DBTrees | ||
Mixed/Other Trees | MixedTrees | ||
Shrubs | Shrubs | ||
Herbaceous Vegetation | HerbVeg | ||
Cultivated and Managed Vegetation | CultVeg | ||
Regularly Flooded Vegetation | RegFlVeg | ||
Urban/Built-up | UrbanBltp | ||
Open Water | Owat | ||
Distance to Water | Dwat | - | |
Vaccination in China | IsChina | FAO Global Administrative Unit Layers (GAUL) database | |
Set 3- Eco-climatic Variables | |||
Day LST* Annual mean | Tmp | ||
Day LST Amplitude annual | TmpAmp1an | ||
Day LST Amplitude bi-annual | TmpAmp2an | ||
Day LST Amplitude tri-annual | TmpAmp3an | ||
Day LST Variance annual | TmpVar1an | ||
Day LST Variance bi-annual | TmpVar2an | ||
Day LST Variance annual, bi and tri-annual | TmpVar123an | ||
NDVI† Annual mean | NDVI | ||
NDVI Amplitude annual | NDVIAmp1an | ||
NDVI Amplitude bi-annual | NDVIAmp2an | ||
NDVI Amplitude tri-annual | NDVIAmp3an | ||
NDVI Variance annual | NDVIVar1an | ||
NDVI Variance bi-annual | NDVIVar2an | ||
NDVI Variance tri-annual | NDVIVar3an | ||
NDVI Variance annual, bi and tri-annual | NDVIVar123an | ||
Vaccination in China | IsChina | FAO Global Administrative Unit Layers (GAUL) database | |
Set 4: Risk-based selection of variables | |||
Duck density | DuDnLg | ||
Extensive Chicken Density | ChDnLgExt | ||
Intensive Chicken Density | ChDnLgInt | ||
Human Population Density | HpDnLg | Linard et al. (2012); Gaughan et al. (2013); Sorichetta et al. (2015); CIESIN's GPW Database | |
Cultivated and Managed Vegetation | CultVeg | ||
Open Water | Owat | ||
Distance to Water | Dwat | - | |
Day LST annual mean | Tmp | ||
Vaccination in China | IsChina | FAO Global Administrative Unit Layers (GAUL) database | |
-
*LST = Land Surface Temperature, †NDVI = Normalised Difference Vegetation Index
Additional files
-
Source code 1
R script implementing the cross validations (CV); namely, partition into geographic folds, running the BRT models with standard CV, standard CV accounting for the spatial sorting bias (SSB), and the spatial CV.
- https://doi.org/10.7554/eLife.19571.017
Download links
A two-part list of links to download the article, or parts of the article, in various formats.
Downloads (link to download the article as PDF)
Open citations (links to open the citations from this article in various online reference manager services)
Cite this article (links to download the citations from this article in formats compatible with various reference manager tools)
Global mapping of highly pathogenic avian influenza H5N1 and H5Nx clade 2.3.4.4 viruses with spatial cross-validation
eLife 5:e19571.
https://doi.org/10.7554/eLife.19571


