Epidermal cell turnover across tight junctions based on Kelvin's tetrakaidecahedron cell shape
- Keio University School of Medicine, Japan
- Nerima General Hospital, Japan
- KOSÉ Corporation, Japan
- Imperial College London, United Kingdom
- Exploratory Research for Advanced Technology, Japan Science and Technology, Japan
- National Institute for Physiological Sciences, Japan
- SOKENDAI (The Graduate University for Advanced Studies), Japan
- RIKEN Center for Integrative Medical Sciences, Japan
Figures
Figure 1 with 3 supplements
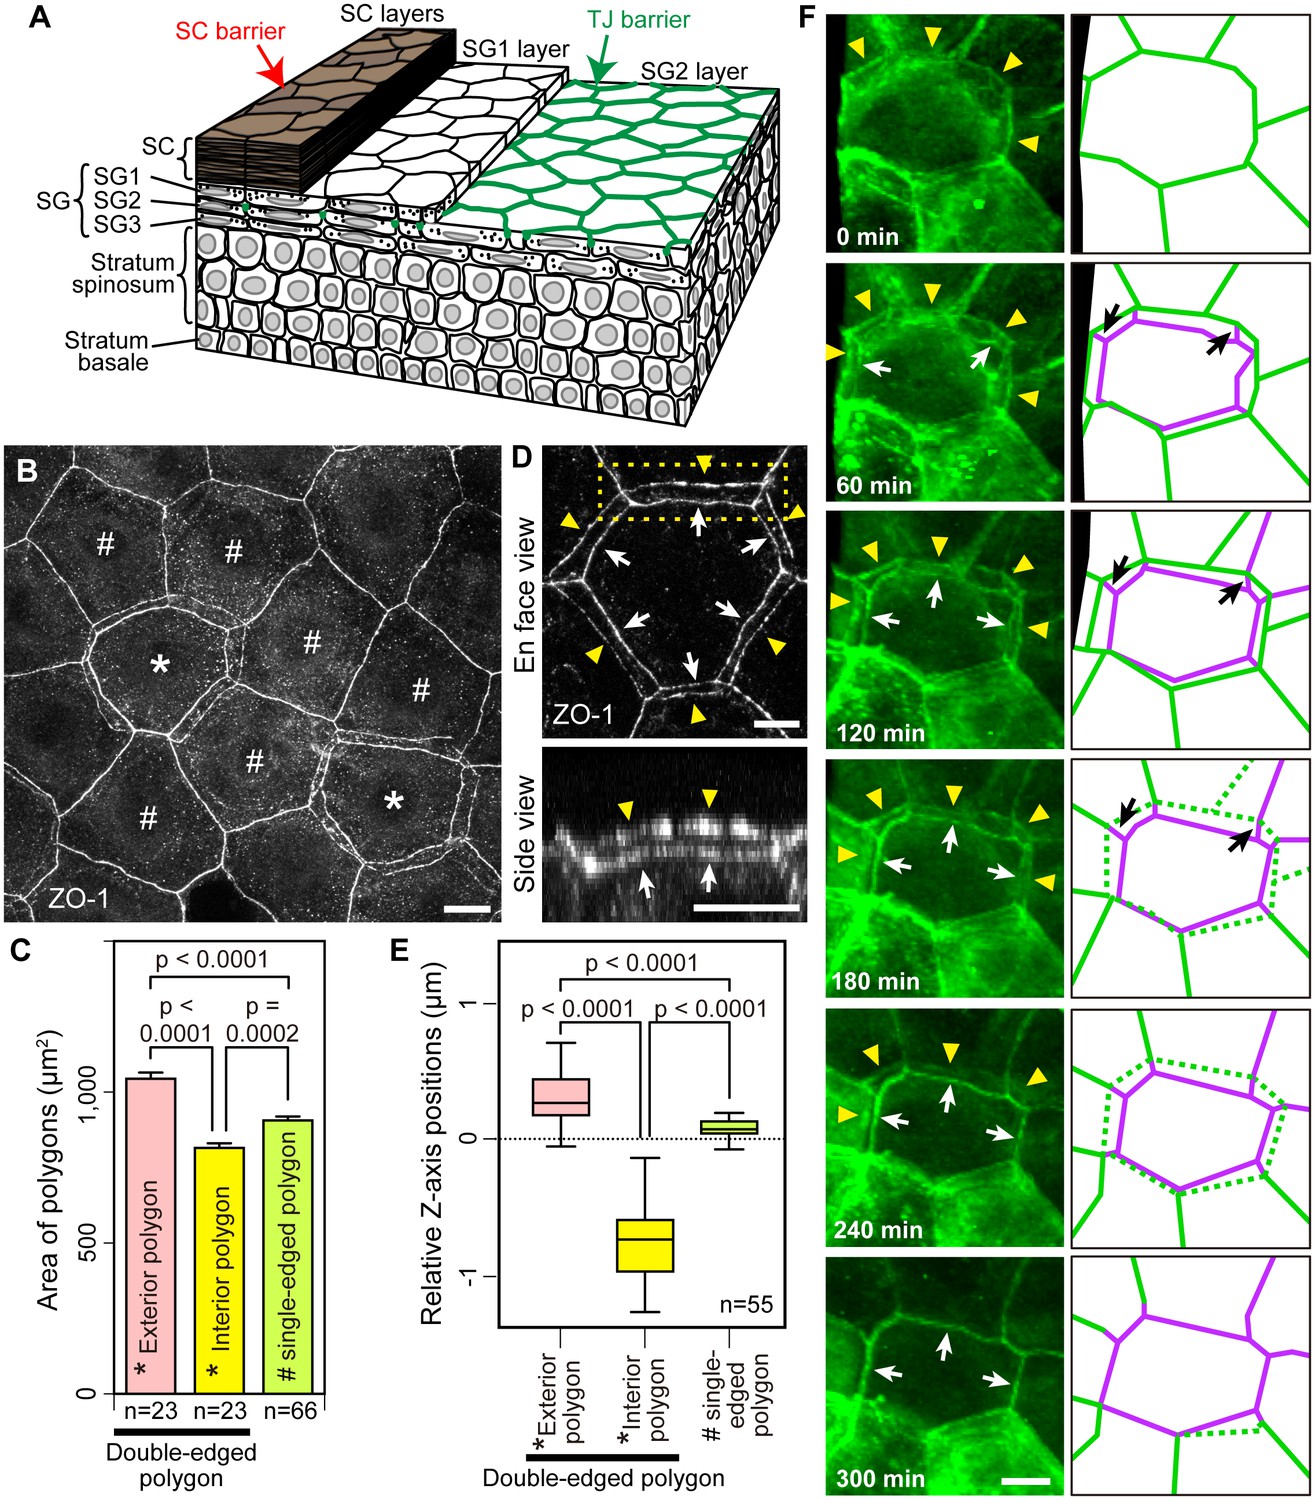
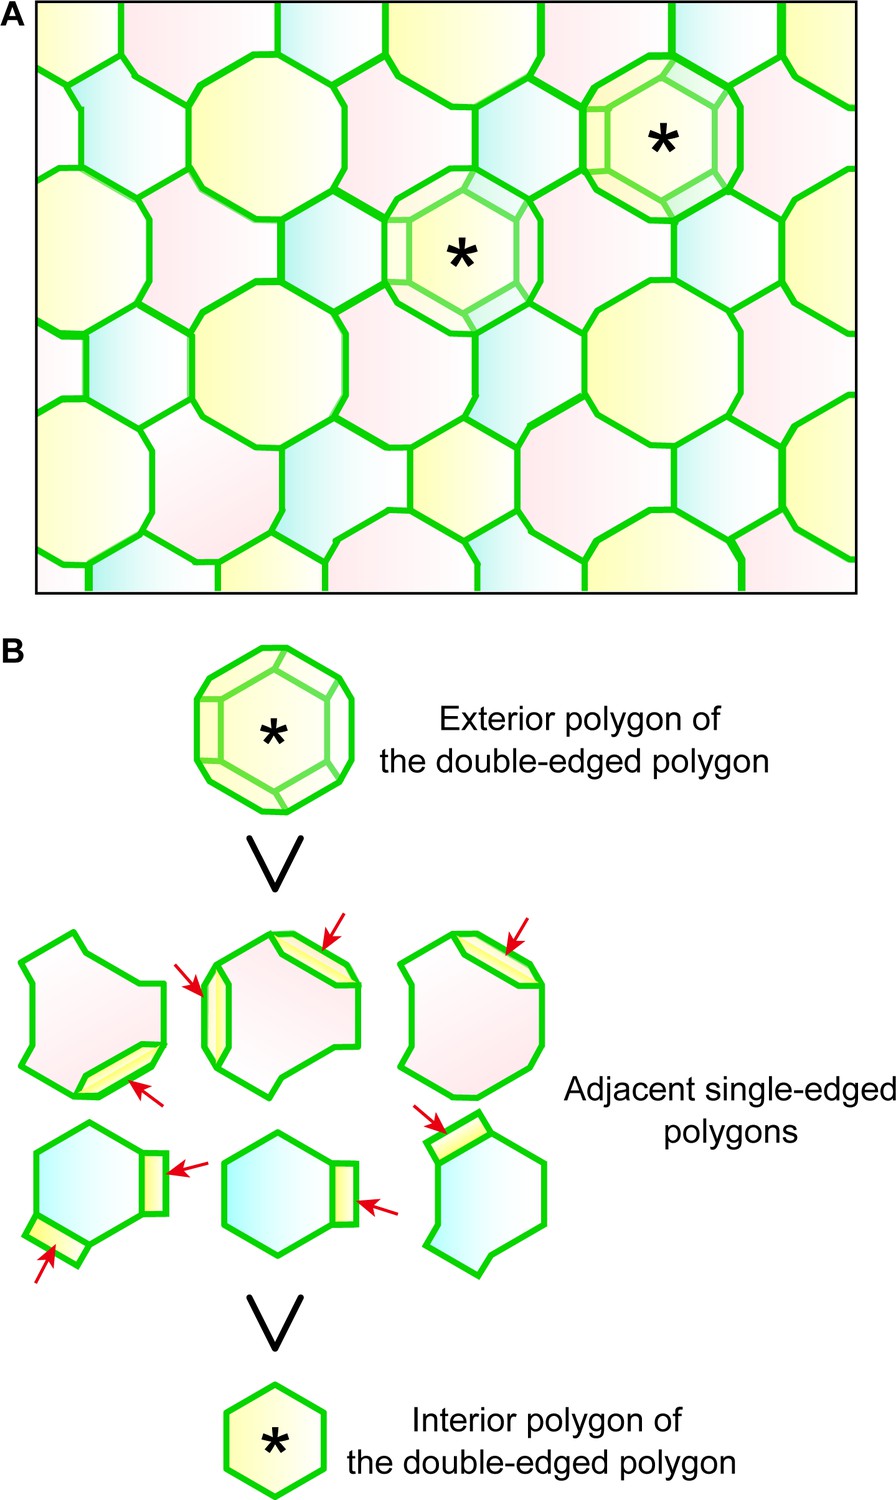
Multi-dimensional visualization of epidermal TJs and TJ-bearing cells in mouse-ear skin.
(A) 3D structure of the epidermis. (B) En face image of ZO-1-positive honeycomb in mouse-ear epidermis showing double-edged polygons (*) and single-edged polygons (#). (C) Regularity in the size of the ZO-1-positive polygons represented in (B) and Figure 1—figure supplement 1, shown by the mean ± SEM [error bars] (one-way ANOVA multiple comparison test). (D) 3D image of a ZO-1-positive double-edged polygon in en face view (top) and 90°-rotated side view of the yellow-dotted rectangle (bottom). Upper exterior polygon, yellow arrowheads; lower interior polygon, white arrows. See Video 1. (E) Regularity of relative Z-axis position. Boxplots show the median, minimum, maximum, and interquartile range (one-way ANOVA multiple comparison test) for the ZO-1-positive polygons represented in Figure 1—figure supplement 2. (F) In vivo live images of Venus in the ear of ZO-1-Venus mice (left column) and their schematics (right column). Yellow arrowheads and green edges, edges of a Venus-positive polygon; white arrows and purple edges, edges of a newly appearing Venus-positive polygon; black arrows, Venus-positive edges connecting each vertex of the two polygons. See Video 4. Scale bars, 10 µm. TJ, tight junction; SC, stratum corneum.
-
Figure 1—source data 1
Percentage of double-edged polygons in ZO-1-positive honeycomb.
The number of single- and double-edged polygons in 20 square en face images of 15376 µm2 from five independent assays. A represented image is shown in Figure 1B.
- https://doi.org/10.7554/eLife.19593.004
-
Figure 1—source data 2
Size of the ZO-1-positive polygons.
The size of single- and double-edged polygons in ZO-1-positive honeycomb statistically analyzed in Figure 1C. How to define areas of polygons are shown in Figure 1—figure supplement 1.
- https://doi.org/10.7554/eLife.19593.005
-
Figure 1—source data 3
Z-axis position of the ZO-1-positive polygons.
The Z-axis position of single- and double-edged polygons in ZO-1-positive honeycomb statistically analyzed in Figure 1E.
- https://doi.org/10.7554/eLife.19593.006
Figure 1—figure supplement 1
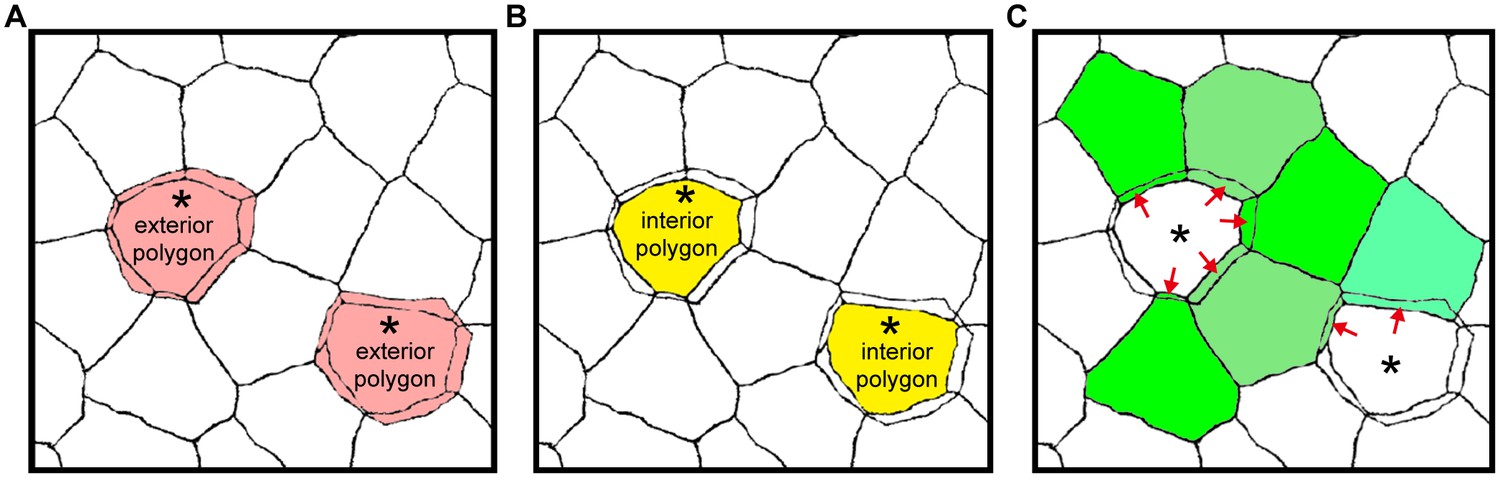
Areas of exterior, interior and single-edged polygons.
(A–C) Drawings of the ZO-1-positive edges shown in Figure 1B. The areas of polygons evaluated in Figure 1C are depicted for the exterior [pink in (A)] and interior [yellow in (B)] polygons of double-edged polygons (*), and for the single-edged polygon [green in (C)] adjacent to the double-edged polygons. The area of the single-edged polygon includes the overlapping area with the adjacent exterior polygons (red arrows).
Figure 1—figure supplement 2
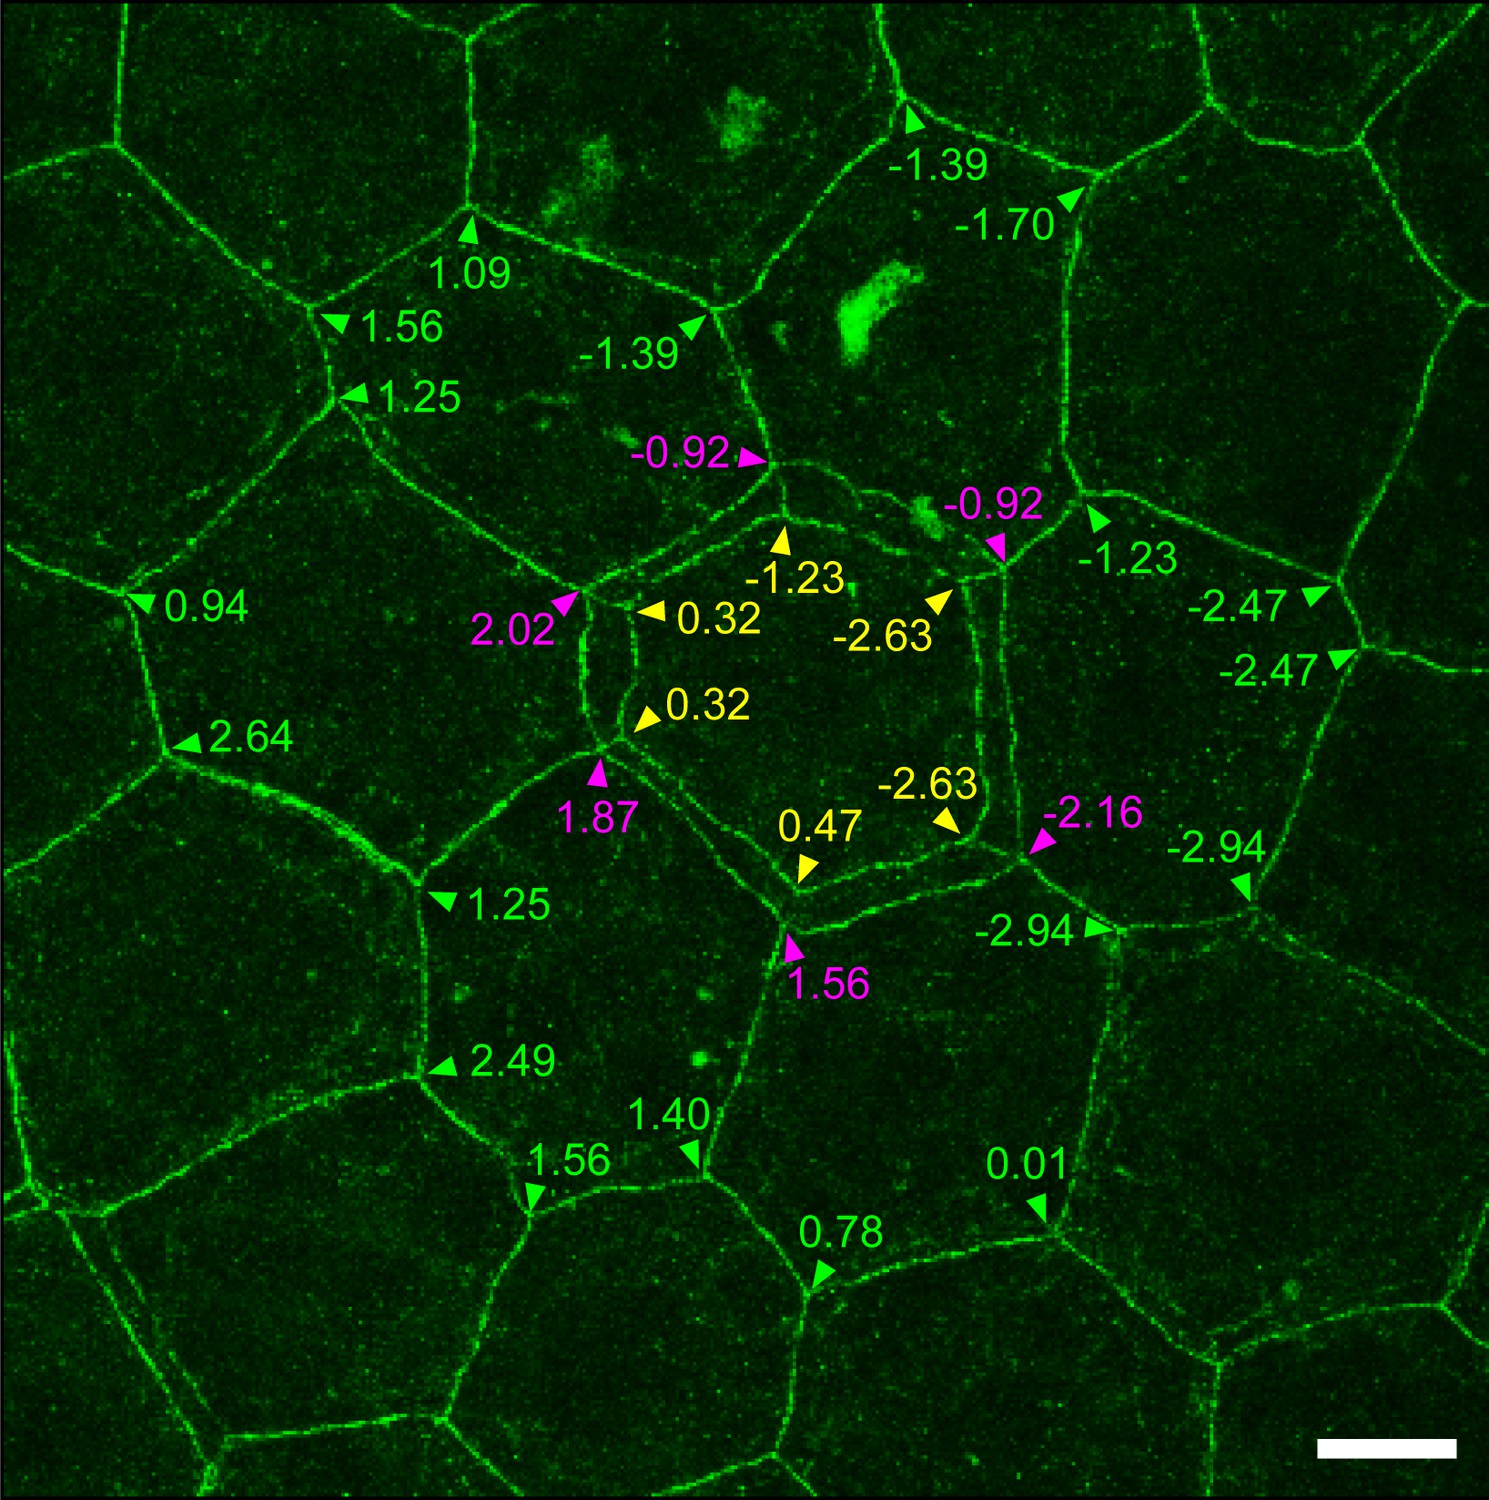
Relative Z-axis position of TJ polygons in TJ honeycomb evaluated in vivo.
A representative image of a ZO-1-positive double-edged polygon surrounded by six single-edged polygons evaluated in Figure 1E. The Z-axis position of each polygon was defined by an average of the Z-axis positions (numbers) of its vertices, analyzed by Imaris software (purple arrowheads, external polygon; yellow arrowheads, internal polygon; green arrowheads, adjacent single-edged polygons). Scale bar, 10 µm. TJ, tight junction.
Figure 1—figure supplement 3

Epidermal TJ in ZO-1-Venus transgenic mice.
(A) Colocalization of occludin, a transmembrane protein located at the TJs, with Venus in whole-mounted epidermal sheet from the ear skin of a ZO-1-Venus transgenic mouse. No morphological changes were observed in the TJ honeycomb in ZO-1-Venus transgenic mice. (B) Skin section staining of ZO-1-Venus transgenic mice after intradermal injection of Sulfo-NHS-LC-biotin as a tracer (Furuse et al., 2002; Yokouchi et al., 2015). Venus-positive junctions were observed to limit the inside-out permeation of the tracer (yellow arrows), indicating that Venus successfully labeled the TJs without any apparent change in their occlusive function. Scale bars, 10 µm. TJ, tight junction.
Figure 2 with 2 supplements
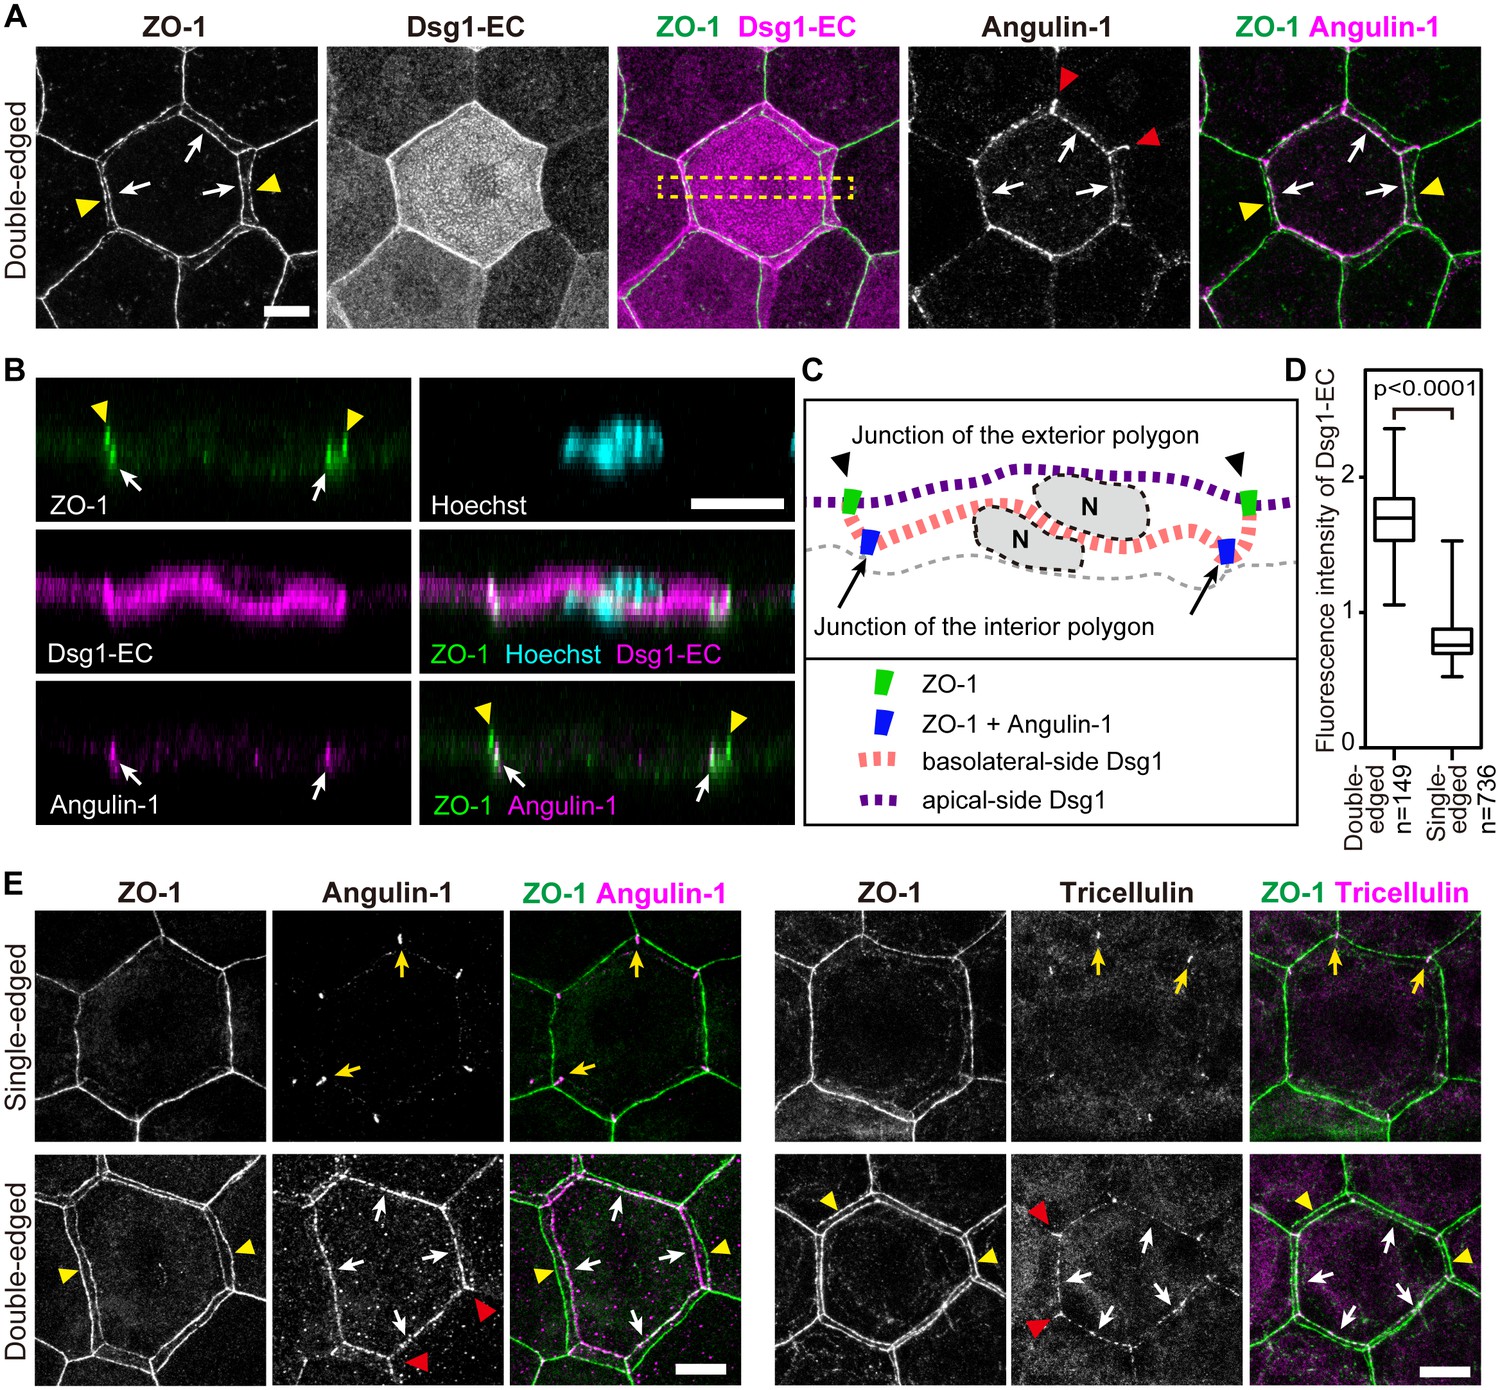
Characterization of interior polygons in the epidermal TJ honeycomb.
(A and E) En face images of double-edged [A and lower panels in E] and single-edged [upper panels in E] TJ polygons in the ETA-induced cell sheet of the epidermis (Figure 2—figure supplement 1). (A) Subcellular localization of Dsg1-EC and angulin-1 at double-edged polygons. (B) 90°-rotated image of the yellow-dotted rectangle in (A) (see Videos 5 and 6). (C) Schematic of (B). N, nuclei; gray dotted lines, cell borders predicted from background cytosolic staining. (D) Fluorescence intensity of Dsg1-EC at the center of double- and single-edged polygons. The boxplots show the median, minimum, maximum, and interquartile range (Student’s t-test). (E) Subcellular localization of tricellular TJ components (angulin-1 and tricellulin) at the single- and double-edged polygons. Yellow arrowheads, edges of the exterior polygon; white arrows, edges of the interior polygon; red arrowheads, vertical edges connecting the vertices of double-edged polygons; yellow arrows, vertices of single-edged polygons; Dsg1-EC, immunostained signals for extracellular portion of desmoglein 1, presumably representing desmosome-accumulating Dsg1. Scale bars, 10 µm.
-
Figure 2—source data 1
Fluorescent intensity of Dsg1-EC at single- and double-edged polygons.
Fluorescent intensity of Dsg1-EC at the center of ZO-1-positive polygons in ETA-induced cellular sheet statistically analyzed in Figure 2D.
- https://doi.org/10.7554/eLife.19593.015
Figure 2—figure supplement 1
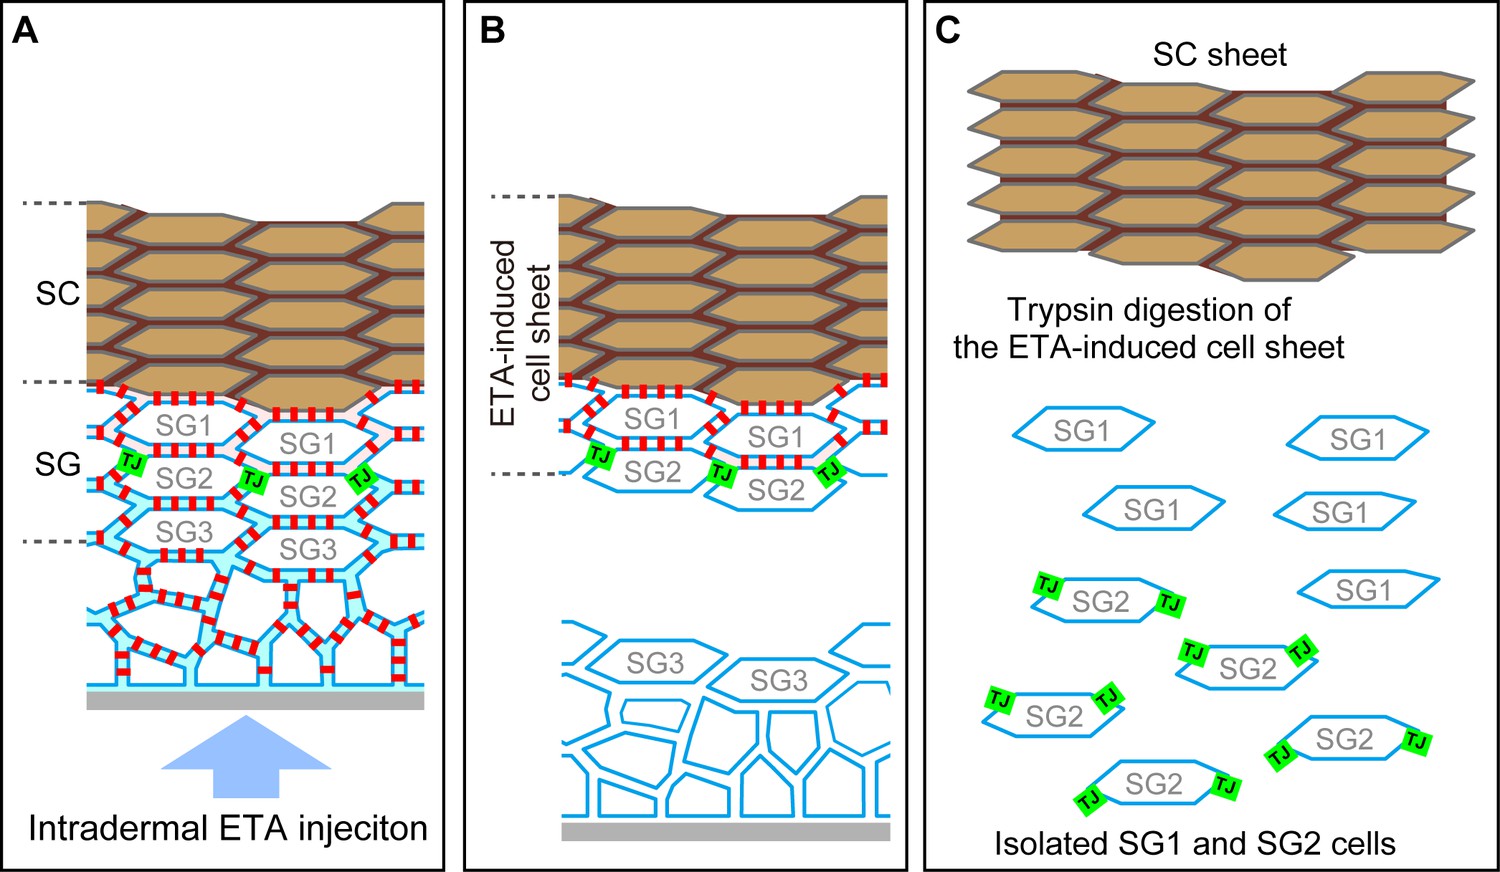
Preparation of the exfoliative toxin (ETA)-induced cell sheet and isolation of TJ-bearing keratinocytes from the skin.
(A–C) Schematics of a vertical section of the epidermis before ETA treatment (A), after intradermal injection of ETA (B), and after trypsin treatment (C). Green squares, TJ; red squares, desmosome; SG, stratum granulosum; SC, stratum corneum. Both SC and SG cells are drawn as f-TKD (see Figure 4A–C). (A) TJs are located at the apical edges of the SG2–SG2 cell contact. (B) Desmosomal junctions are digested by ETA beneath the TJ barrier but not above it, as the permeation of ETA is limited at the TJ barrier, and a stratified cell sheet consisting of SC, SG1, and SG2 cells is separated from the skin (Yoshida et al., 2013; Yokouchi et al., 2015). The en face images of the resulting ETA-induced cell sheet are shown in Figure 2A and E. (C) SG1 and SG2 cells are dissociated from the ETA-induced cell sheet by trypsin, as trypsin digests both TJs and desmosomal junctions. ZO-1, the TJ intracellular scaffold protein, remains undigested [green squares in (C)]. The cytosolic portion of Dsg1 also remains undigested in the cytoplasm (not shown). The representative en face images of the isolated SG2 cells are shown in Figure 3F and Video 7. TJ, tight junction.
Figure 2—figure supplement 2
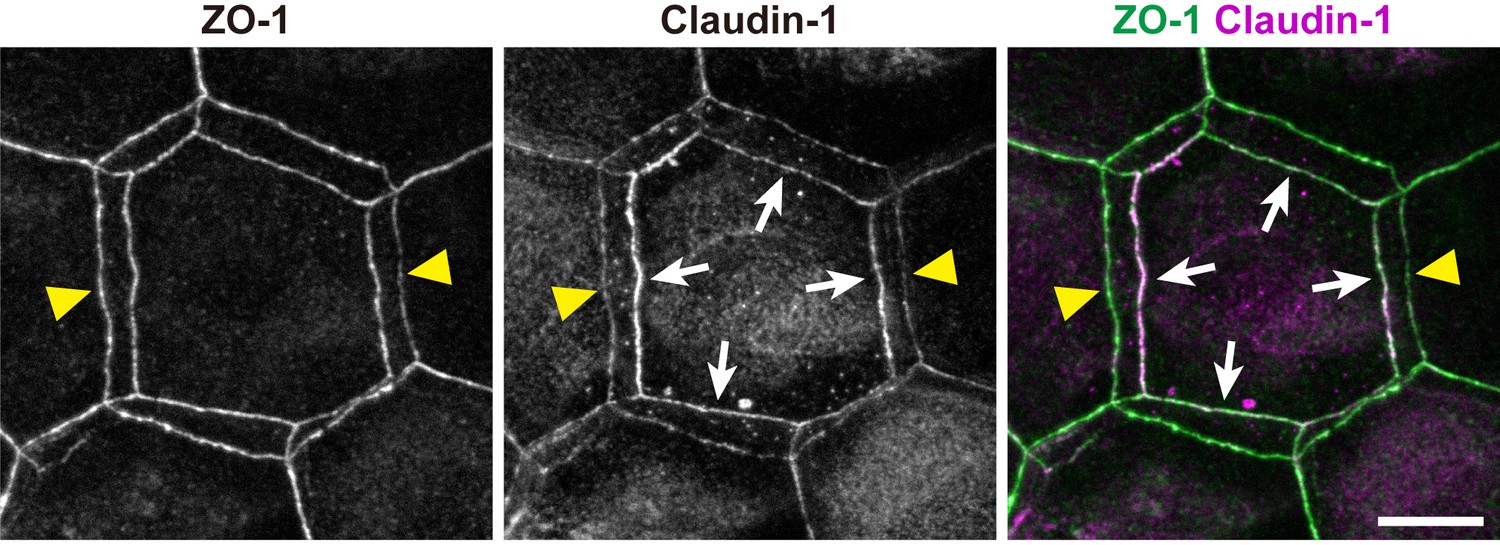
Subcellular localization of claudin-1 at double-edged polygons.
Subcellular localization of claudin-1 at the ZO-1-positive double-edged polygons in the ETA-induced cell sheet. Yellow arrowheads, edges of the exterior polygon; white arrows, edges of the interior polygon. Scale bar, 10 µm.
Figure 3 with 1 supplement
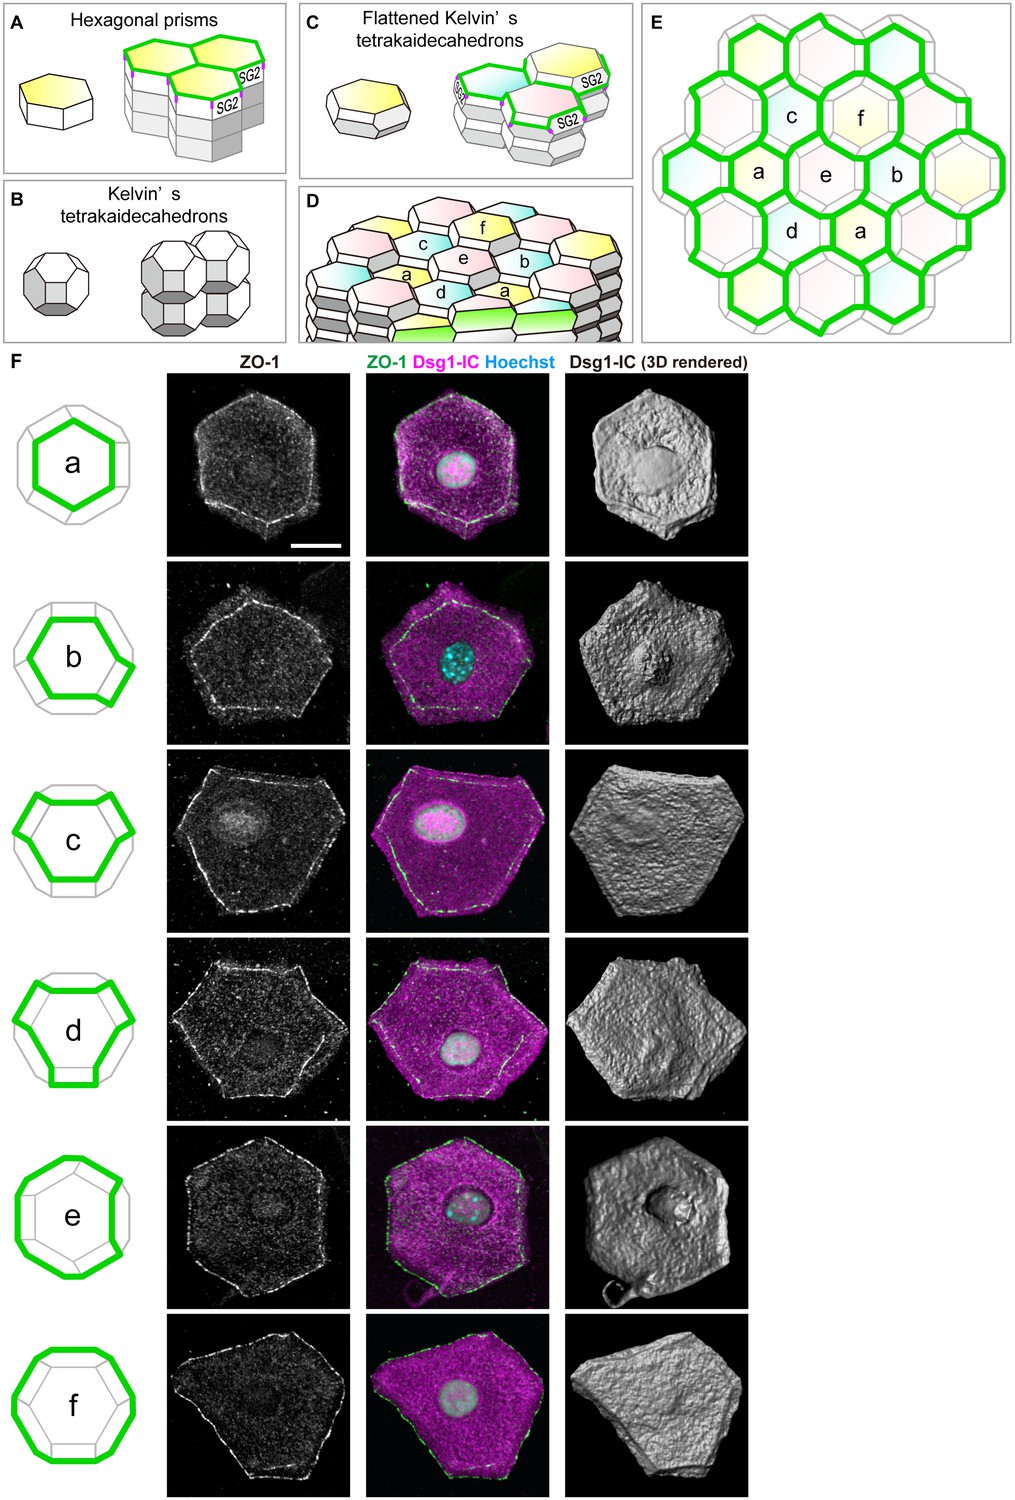
Characterization of the shape of SG2 cells and structures of epidermal TJ honeycomb.
(A–C) Three possible space-filling structures of the SG. (D) Regular interdigitated stacks of f-TKD cells. SG2 cells are displayed at the top of cell columns. (E) En face view of the TJ honeycomb (green edges) on the f-TKD cell stacks shown in (D). (F) Six representative polyhedral shapes (a–f) of isolated SG2 cells, corresponding to the TJ polygons (green edges) in (D) and (E). The cells were visualized by cytoplasmic staining for the intracellular portion of desmoglein 1 (Dsg1-IC, middle column), with ZO-1-positive TJ at the edges (left and middle column), and their 3D rendered images (right column). See Video 7 for 3D rendered images. TJ, tight junction.
Figure 3—figure supplement 1
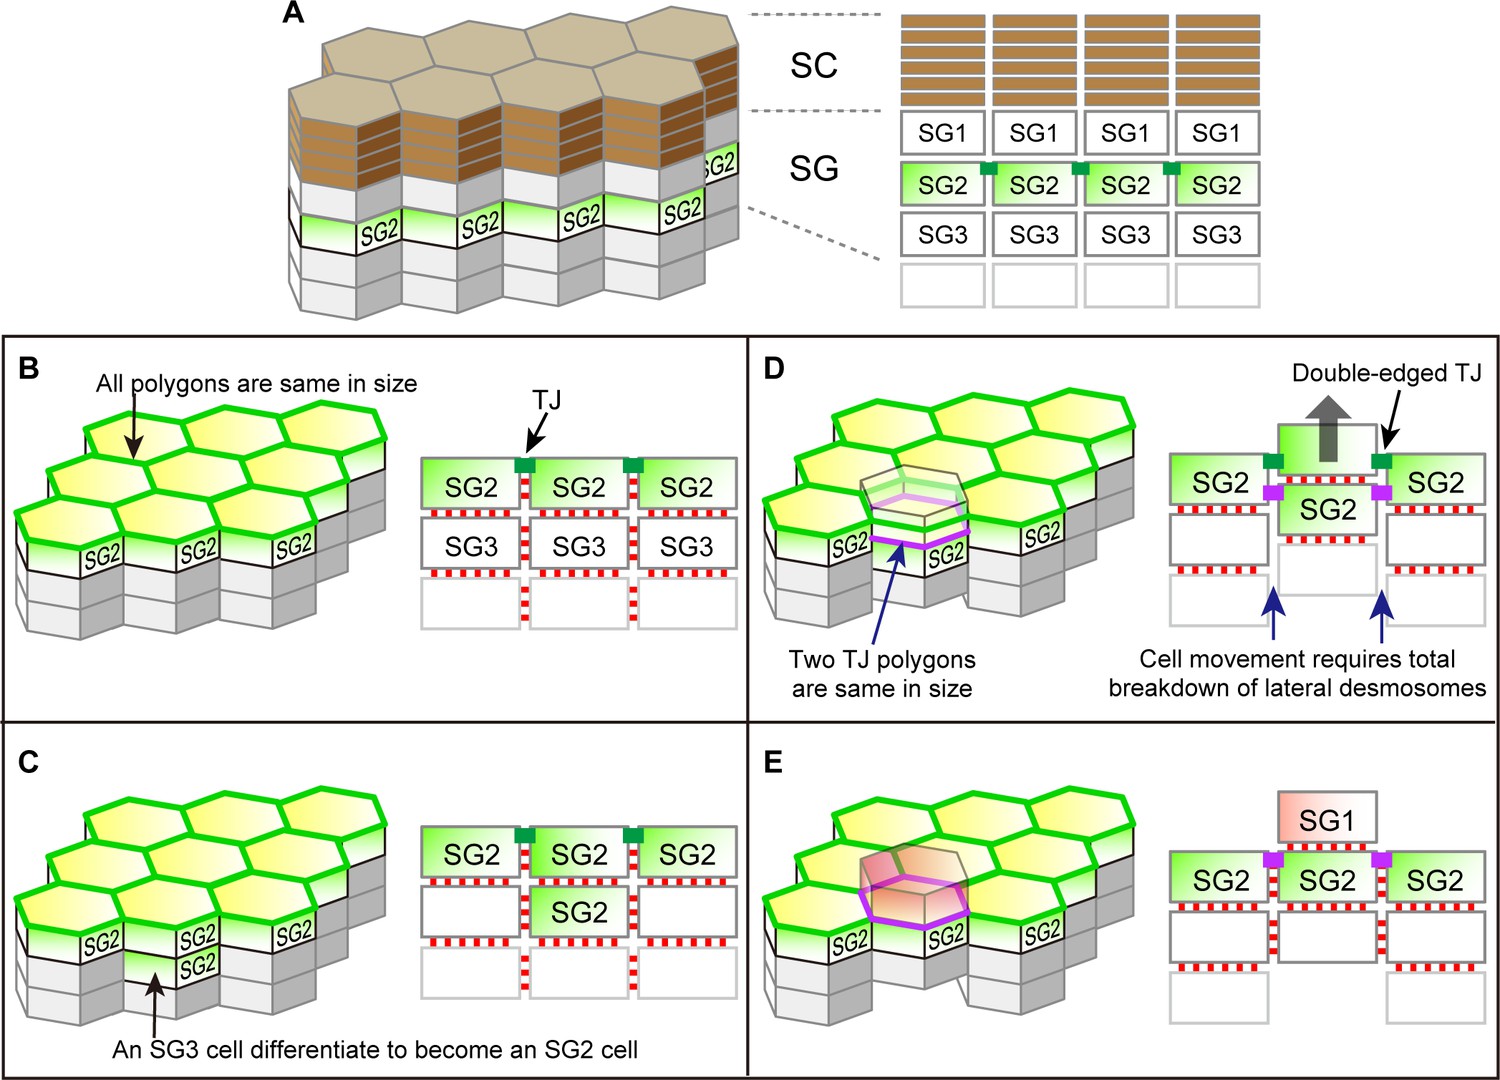
Possible cell turnover and TJ replacement in the conventionally proposed structure of SG and SC with hexagonal prism cells.
(A) 3D schematic (left) and a vertical section (right) of the structure. (B–E) Temporal order of cell turnover and TJ replacement (3D structure, left panels; vertical-sectional views, right panels). TJ honeycomb is formed at the apical edges of SG2–SG2 cell junctions in (B); Two SG2 cells are vertically aligned as a result of an SG3 cell differentiated to an SG2 cell in (C); The entire cell column slides upward for cell turnover in (D); Cell turnover is completed when the upper SG2 cell differentiates to become an SG1 cell (red) in (E). This process is inconsistent with our in vivo observations, because (1) the interior TJ polygon newly formed by the two vertically aligned SG2 cells (purple polygon in (D)) is of the same size as the pre-existing TJ polygon, and (2) the upward sliding of the cell column requires a total breakdown of their lateral desmosomal junctions in (D). Green edges in left panels, pre-existing TJ honeycomb; green closed rectangles in right panels, pre-existing TJ; purple edges in left panels, newly produced TJ polygons; purple closed rectangles in right panels, newly produced TJ; red closed rectangles in right panels, desmosomes. TJ, tight junction.
Figure 4 with 2 supplements

Cell turnover and TJ replacement in the SG2 f-TKD cells.
(A and B) Cell turnover and TJ replacement in the SG2 layer of regular interdigitated stacks of f-TKD cells [3D structure of the cell stack with SG2 cells displayed at the top of cell columns, left panels in (A) and (B); 3D structure of the TJ barrier, right panels in (A); vertical sectional views, middle panels in (B); en face view of the TJ honeycomb, right panels in B]. Four SG2 cells (*) are located higher than their six adjacent SG2 cells in phase 0 in (A), and they differentiate to become SG1 cells in phase 2. The differentiation of SG3 cells to SG2 cells [red arrowheads in A and B] in phase 1 results in the vertical alignment of two SG2 cells, between which tTJ polygons (purple edges) are formed. Differentiation of the top SG2 cells (shown in red) to SG1 cells is completed in phase 2. (C) Schematics showing the occlusive function of single-edged TJ polygons (phase 0 and 2) and an interior tTJ polygon (phase 1) against the permeation of ETA. Green edges, bTJs; purple dots and edges, tTJs.
Figure 4—figure supplement 1
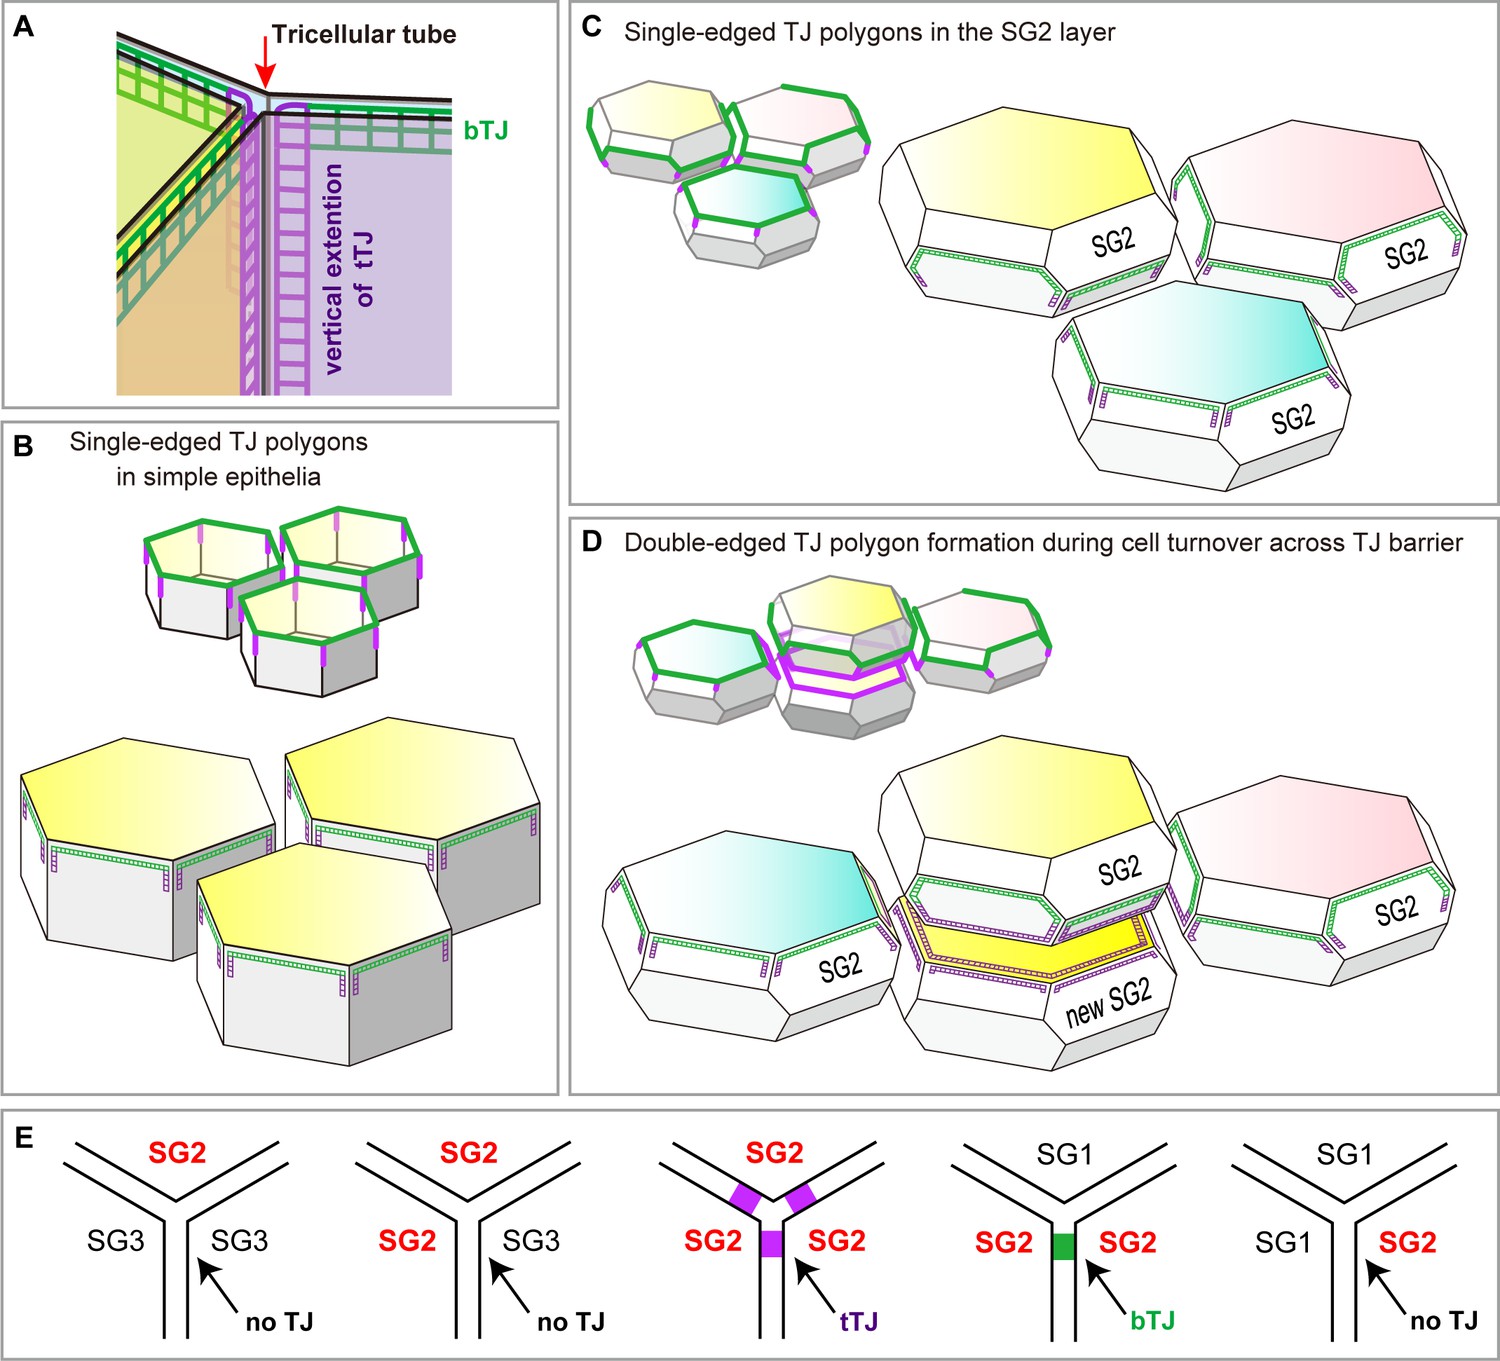
Localization of TJ strands on the hexagonal prism cells in simple epithelia and on f-TKD cells in stratified epithelia.
(A) The two meshes of TJ strands facing each other between adjacent cells bind together like Velcro tape to seal the paracellular space (Tsukita et al., 2001). bTJs seal the paracellular space between two adjacent cells (green mesh), and tTJs (three purple meshes) narrow the tricellular tube (arrow), the paracellular space among three cells (Furuse et al., 2014). (B–C) Hexagonal prism cells in simple epithelia (B) and f-TKD SG2 cells in stratified epithelia (C). Conventional bTJs are located at the apical edges of lateral cell-cell contacts (green edges) (Furuse et al., 2014; Van Itallie and Anderson, 2014), and tTJs are formed with some vertical elongation along the edges of the tricellular contact (purple lines) (Furuse et al., 2014). Presumed localization of TJ strands for bTJs and tTJs is shown as green mesh and purple mesh, respectively. (D) Formation of a double-edged TJ polygon on f-TKD cells in stratified epithelia during cell turnover, corresponding to phase 1 in Figure 4B–C. The exterior and interior TJ polygons are bTJ polygons and tTJ polygons, respectively. The tTJ is formed on the edges at the tricellular contact among two vertically aligned SG2 cells and one laterally adjacent SG2 cell. (E) Formation of bTJs or tTJs at a tricellular contact between three SG cells in the epidermis. TJ, tight junction.
Figure 4—figure supplement 2
Regularity of polygon size in the TJ honeycomb on f-TKD cells in stratified epithelia.
(A) Representative en face image of the TJ honeycomb (green edges) on the f-TKD cell layer. Double-edged polygons are marked by *. Any two adjacent SG2 cells (shown in two different colors) are located at different heights (z-axis), as shown in Figure 3D. (B) The exterior polygon (top) is larger than its adjacent single-edged polygons (middle), any of which is larger than the interior polygon (bottom). The area of single-edged polygons is defined to include the overlapped area with the exterior polygons (arrows) as shown in Figure 1—figure supplement 1. Our in vivo observation definitively confirmed that the single-edged polygons were smaller than the exterior polygons and larger than the interior polygons (Figure 1C).
Figure 5 with 1 supplement
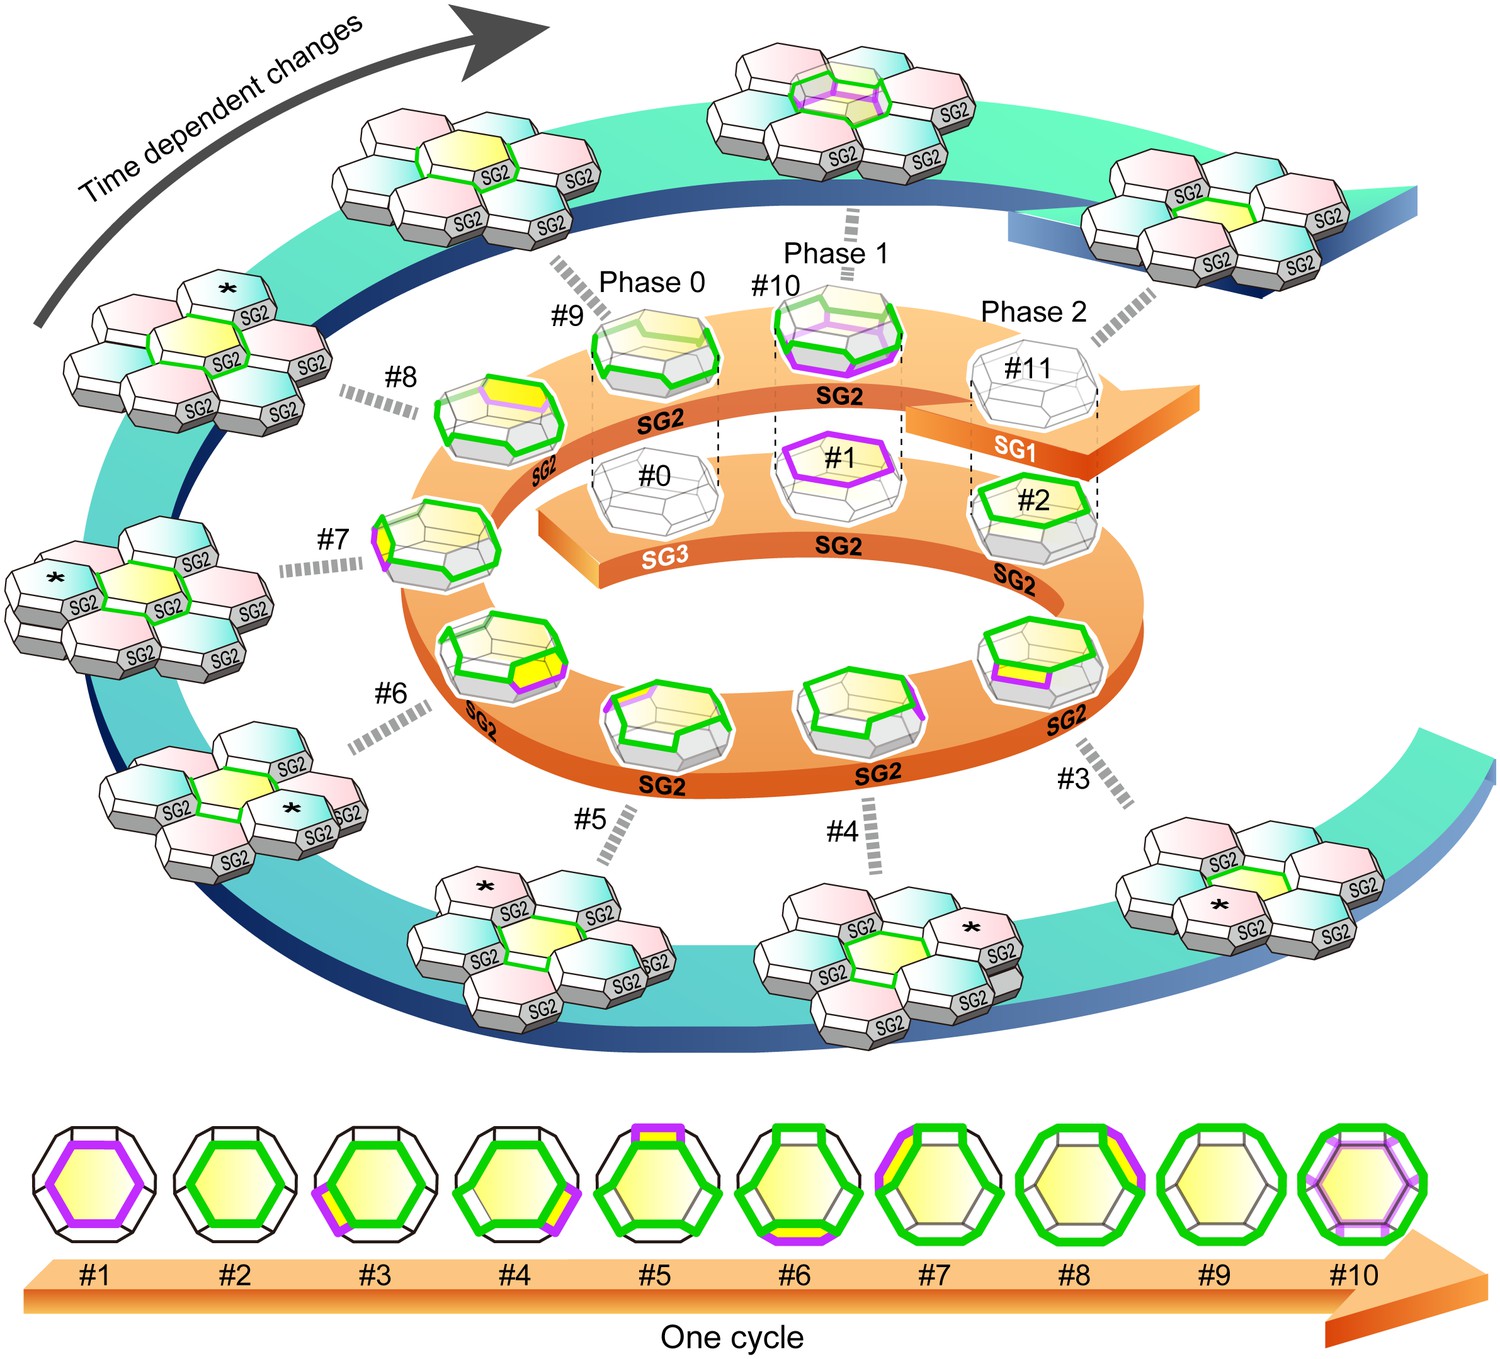
f-TKD turnover model.
An entire cycle of the turnover of a set of f-TKD SG2 cells is shown on the outer blue spiral arrow, from the appearance of aTJ polygon (time point #1) to its disappearance (time point #11) on a particular SG2 f-TKD cell (the center yellow cell of the set of f-TKD cells). Three-dimensional cartoons and en face views of the yellow cell at each timepoint are depicted on the spiral and straight orange arrows, respectively. The relative Z-axis position of the cell changes from the lowest (time point #2) to the next highest (time point #9), while the adjacent SG2 cells (asterisked cells) are turned over. The TJ polygon of the cell becomes larger in a stepwise manner via edge-by-edge TJ replacement (timepoint #2–#9). The phases 0–2 correspond to those in Figure 4B. See Video 8. Green edges, bTJs; purple edges, tTJs.
Figure 5—figure supplement 1
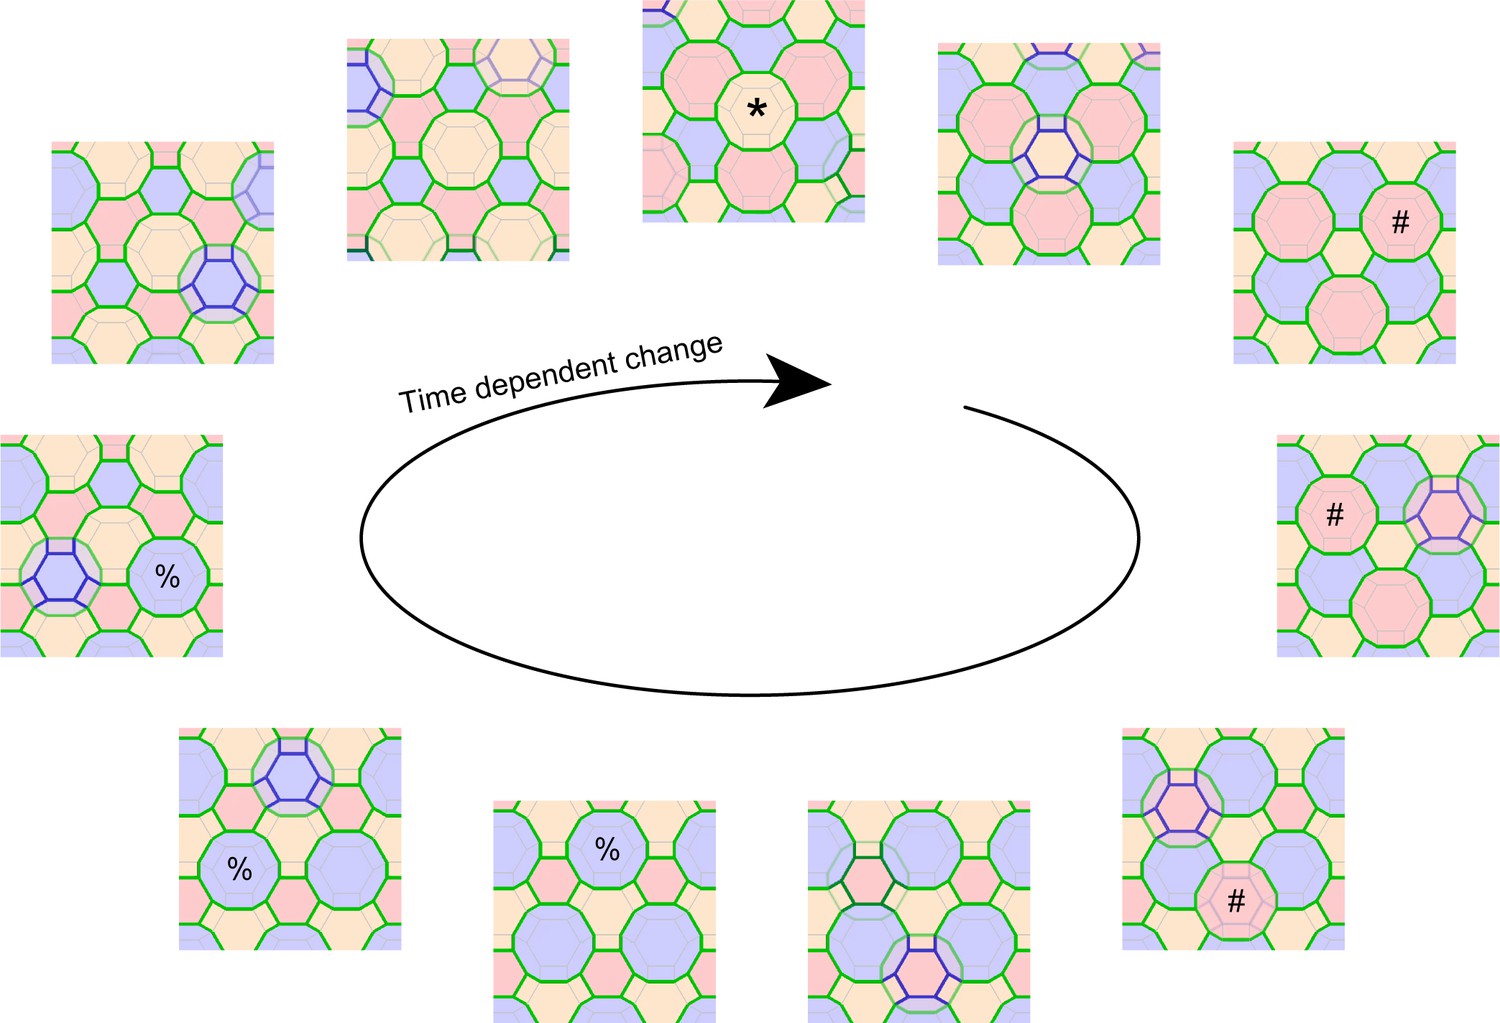
Computational simulation of f-TKD model for continuous cell turnover.
A computational simulation for the f-TKD model confirmed that the proposed three local rules ensure TJ homeostasis with continuous cell turnover in a stratified cell sheet (2D movie, Video 9; 3D movie, Video 10). En face view of the time-dependent change in the TJ honeycomb reproduced the cycle of edge-by-edge TJ replacement shown in Figure 5 and Video 8. Polygons replaced in the next panel are marked with *, #, and % in the yellow, pink, and blue layer cells, respectively. Only the TJ-bearing SG2 cells are depicted in three different colors, depending on their cell height. The tTJs at the vertices of single-edged TJ polygons are not displayed, to better illustrate the honeycomb-mesh structure of TJs.
Figure 6 with 1 supplement

Spatiotemporal orchestration of cell differentiation in the f-TKD model generates interdigitated stacks of corneocytes.
(A) The f-TKD model provides a coherent explanation of how the regular interdigitation of corneocytes is produced in the SG2 layer. Arrows show SG3 cells that are newly aligned to the columnar stack. One cycle of cell turnover (orange arrow) corresponds to one cycle indicated in Figure 5. The yellow-colored cell is differentiated from SG3 to SG1 in the time course. (B) Previously proposed columnar unit concept of epidermal structure and turnover. (C) Our proposed f-TKD model for epidermal homeostasis.
Figure 6—figure supplement 1
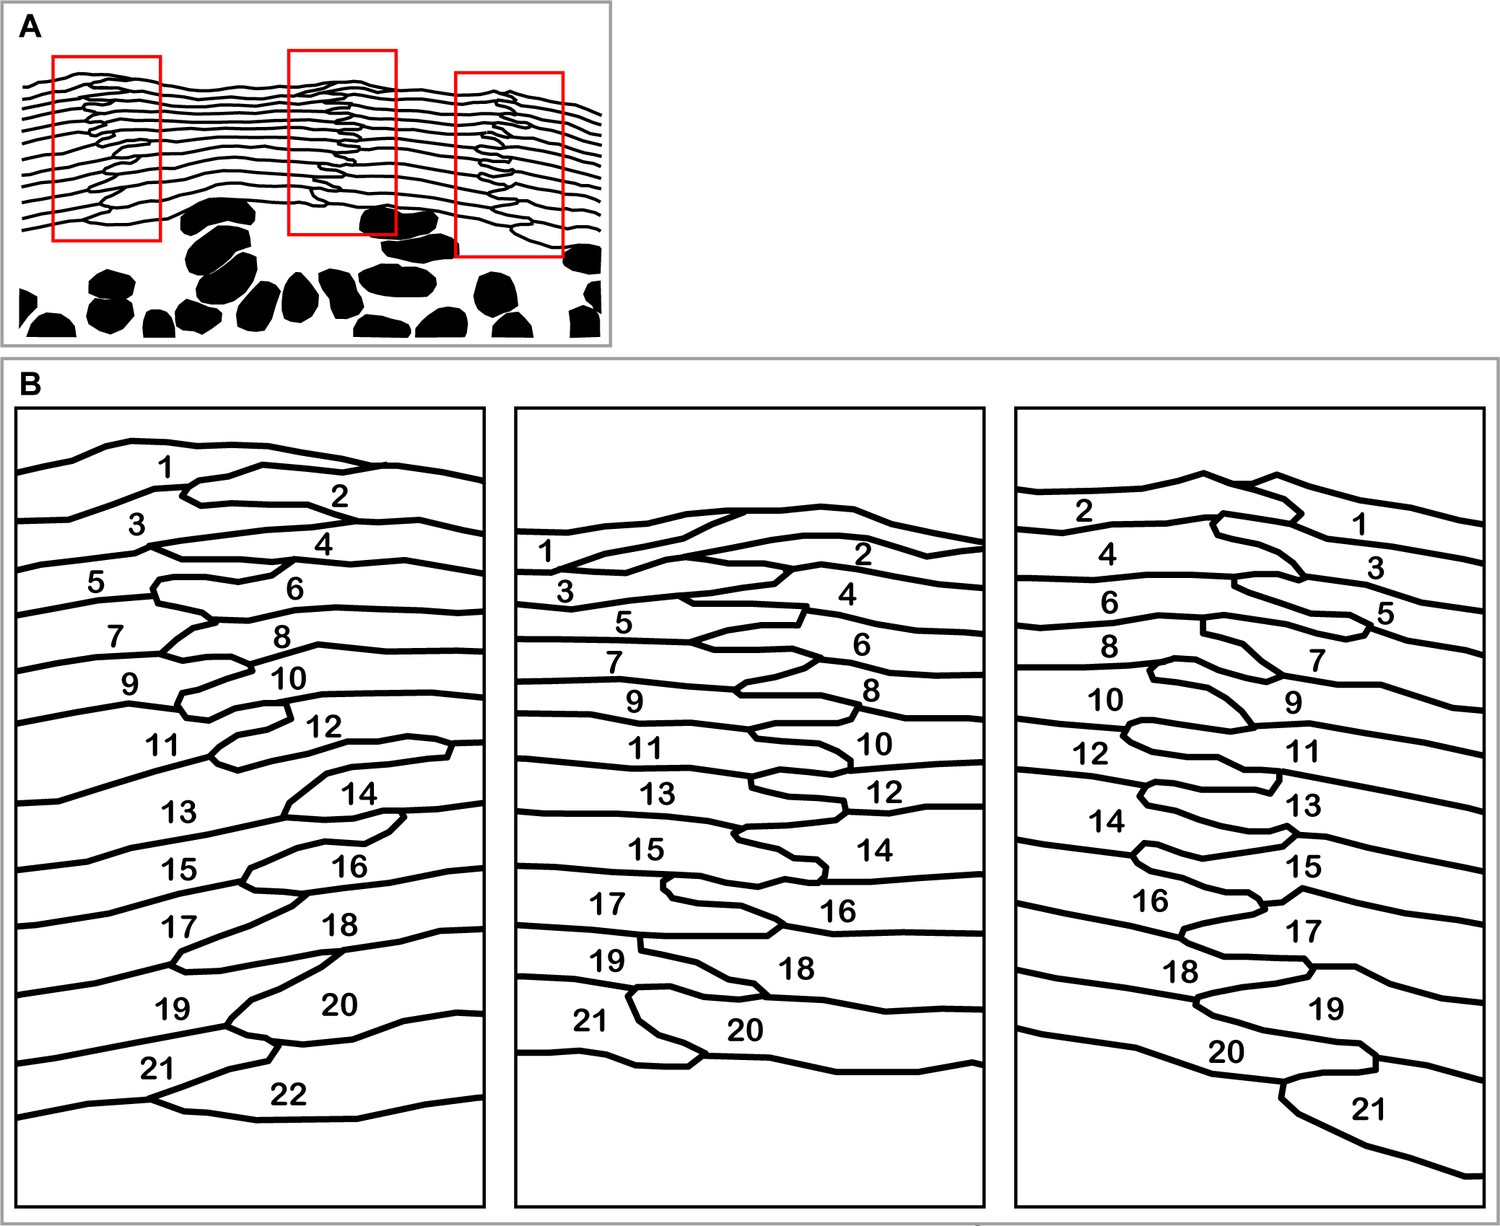
Interdigitated stacks of corneocytes as a footprint of spatio-temporally regulated differentiation in SG2 cells.
(A) A section of hamster epidermis originally shown in (Mackenzie, 1975, Figure 1) clearly demonstrates columnar stacks of corneocytes and SG cells. The red rectangular areas are magnified in (B). (B) Regular zig-zag pattern of interdigitation between corneocytes suggests the synchronization of cell differentiation between adjacent cell columns. The numbers indicate the order of terminal differentiation suggested by the spatial relationships between corneocytes.
Videos
Video 1
En face 3D imaging of TJ honeycomb in mouse-ear skin.
Representative 3D image of a ZO-1-positive double-edged polygon, shown in Figure 1D. TJ, tight jjunction.
Video 2
In vivo 3D live imaging of epidermal TJs in the ear skin of a ZO-1 Venus mouse.
Sporadic disappearance of TJ polygons (polygons marked with an asterisk). TJ, tight junction.
Video 3
In vivo 3D live imaging of epidermal TJs in the ear skin of a ZO-1 Venus mouse.
Sporadic appearance of new TJ polygons (polygons marked with an asterisk). TJ, tight juction.
Video 4
In vivo 3D live imaging of edge-by-edge replacement of epidermal TJs in a particular polygon.
Sequential appearance and disappearance of particular TJ polygons, shown in Figure 1F. TJ, tight junction.
Video 5
Characterization of the interior (smaller) polygon of double-edged TJ polygons.
The newly formed polygon limits ETA permeation (Figure 2A–C).
Video 6
Characterization of the interior (smaller) polygon of double-edged TJ polygons.
The newly formed polygon is a tTJ polygon (Figure 2E).
Video 7
Three-dimensional imaging of TJ-bearing SG2 cells isolated from mouse ear epidermis.
Representative polyhedral shapes of isolated SG2 cells with TJs on their edges, shown in Figure 3F. TJ, tight junction.
Video 8
Entire sequences of the edge-by-edge TJ replacement on a particular f-TKD cell (see Figure 5).
https://doi.org/10.7554/eLife.19593.028
Video 9
2D movie of computational simulation for the maintenance of SG2 layer integrity and continuity of TJ honeycomb during cell turnover in the f-TKD model of the epidermis.
The 2D movie demonstrates the SG dynamics for 33 hr, with five frames per second and 7.2 min between frames. Green edges, conventional bTJ; purple edges, tTJ. bTJ (green edges) is formed at the apical edges of lateral SG2–SG2 cell contact faces, and tTJ (purple edges) is formed at the tricellular cell contact edges among three SG2 cells. tTJs at the vertices of single-edged TJ polygons were omitted from the display to better illustrate the honeycomb-mesh structure of TJ. Only the TJ-bearing SG2 cells are colored with three different colors depending on cell height.
Video 10
3D movie of computational simulation for the maintenance of SG2 layer integrity and continuity of TJ honeycomb during cell turnover in the f-TKD model of the epidermis.
The 3D movie demonstrates the SG dynamics for 66 hr, with 20 frames per second and 7.2 min between frames. Green edges, conventional bTJ; purple edges, tTJ. bTJ (green edges) is formed at the apical edges of lateral SG2–SG2 cell contact faces, and tTJ (purple edges) is formed at the tricellular cell contact edges among three SG2 cells. tTJs at the vertices of single-edged TJ polygons were omitted from the display to better illustrate the honeycomb-mesh structure of TJ. Only the TJ-bearing SG2 cells are colored with three different colors depending on cell height. TJ, tight junction.
Download links
A two-part list of links to download the article, or parts of the article, in various formats.
Downloads (link to download the article as PDF)
Open citations (links to open the citations from this article in various online reference manager services)
Cite this article (links to download the citations from this article in formats compatible with various reference manager tools)
Epidermal cell turnover across tight junctions based on Kelvin's tetrakaidecahedron cell shape
eLife 5:e19593.
https://doi.org/10.7554/eLife.19593


