Controlling contractile instabilities in the actomyosin cortex
- Technical University Dresden, Germany
- Max Planck Institute for the Physics of Complex Systems, Germany
- Max Planck Institute of Molecular Cell Biology and Genetics, Germany
Figures
Figure 1 with 3 supplements
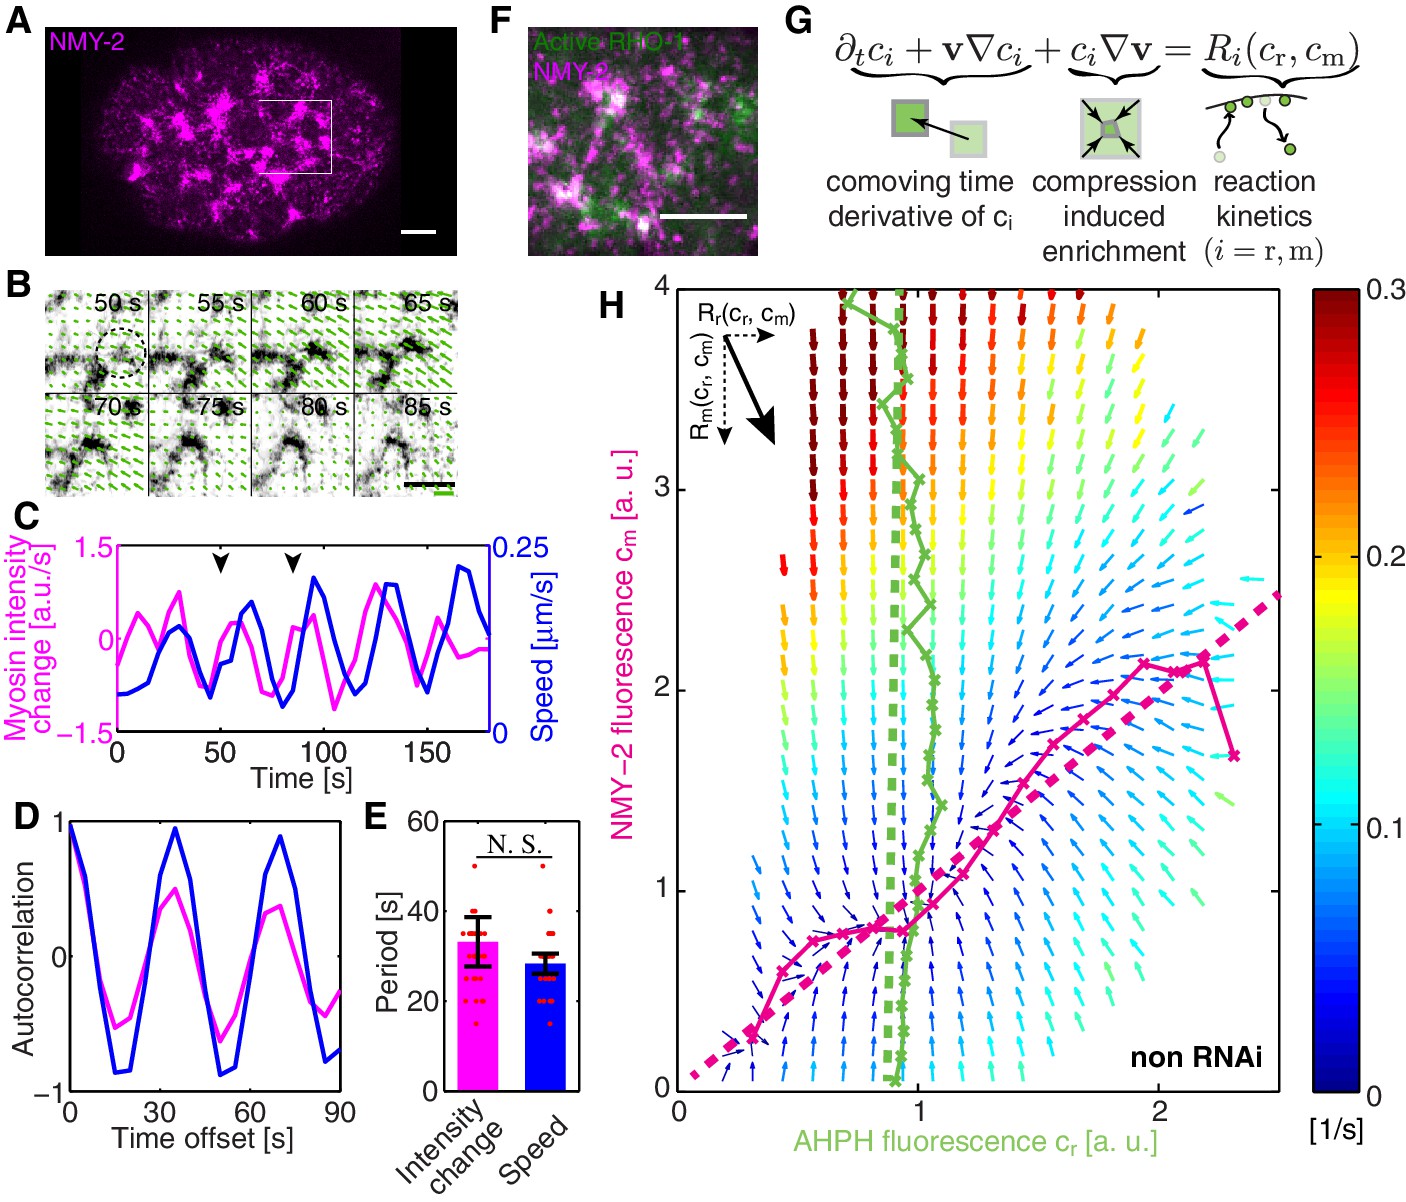
COMBI of active RhoA and NMY-2.
(A) A representative image of NMY-2::GFP showing the NMY-2 foci pattern (magenta) in the C. elegans zygote. Anterior is to the left throughout, white box denotes region shown in B. (B) Myosin focus assembly and disassembly time-course from A in inverted contrast; dashed circle indicates a myosin focus. Arrows denote the velocity field determined by PIV; thick green line: velocity scale bar 0.4 . (C) The temporal dynamics of NMY-2 fluorescence intensity time-rate change (magenta) and cortical flow speed (blue, obtained by PIV) for the region in (B), arrowheads indicate the time interval shown in (B). (D) Normalized autocorrelation of NMY-2 intensity change and flow speed timecourses in (C) and (E) respective oscillation periods. (F) NMY-2::RFP (magenta) and AHPH::GFP (green), a probe for active RhoA, co-localize at myosin foci. (G) COMBI analysis schematic. (H) Effective reaction terms of NMY-2 and active RhoA in the phase plane of normalized NMY-2 and active RhoA concentrations (N = 25 embryos). Arrows represent concentration changes, colors indicate the magnitude of change. Thin solid magenta (NMY-2) and green (RhoA) lines, numerically determined nullclines. Thick dashed lines, linearized nullclines (see Appendix). Scale bars; .
Figure 1—figure supplement 1
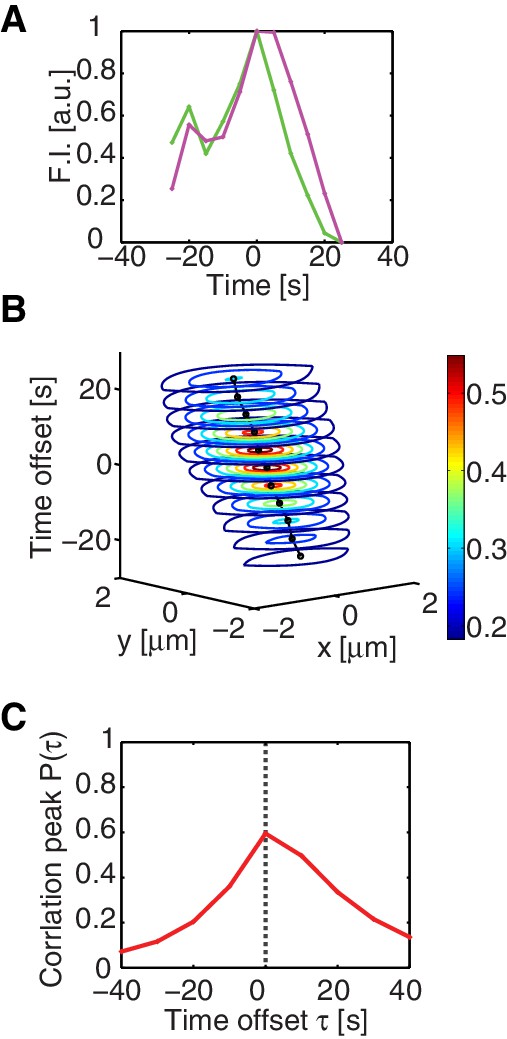
Co-localization of active RhoA and myosin.
(A) The temporal dynamics of AHPH (green) and NMY-2 (magenta) foci intensities (n = 16). (B) Normalized spatiotemporal cross-correlation function of AHPH and NMY2 intensities. For visualization purpose, only the contours of the cross-correlation values are plotted (n = 25 embryos). (C) A plot of the normalized cross-correlation peak value, obtained from (B) at different time offsets. Note that the peak value is highest at , indicating that active RhoA and myosin tend to come together at foci at the same time. Note also that the graph is asymmetric, indicating distinct dynamics in the assembly and disassembly phase.
Figure 1—figure supplement 2
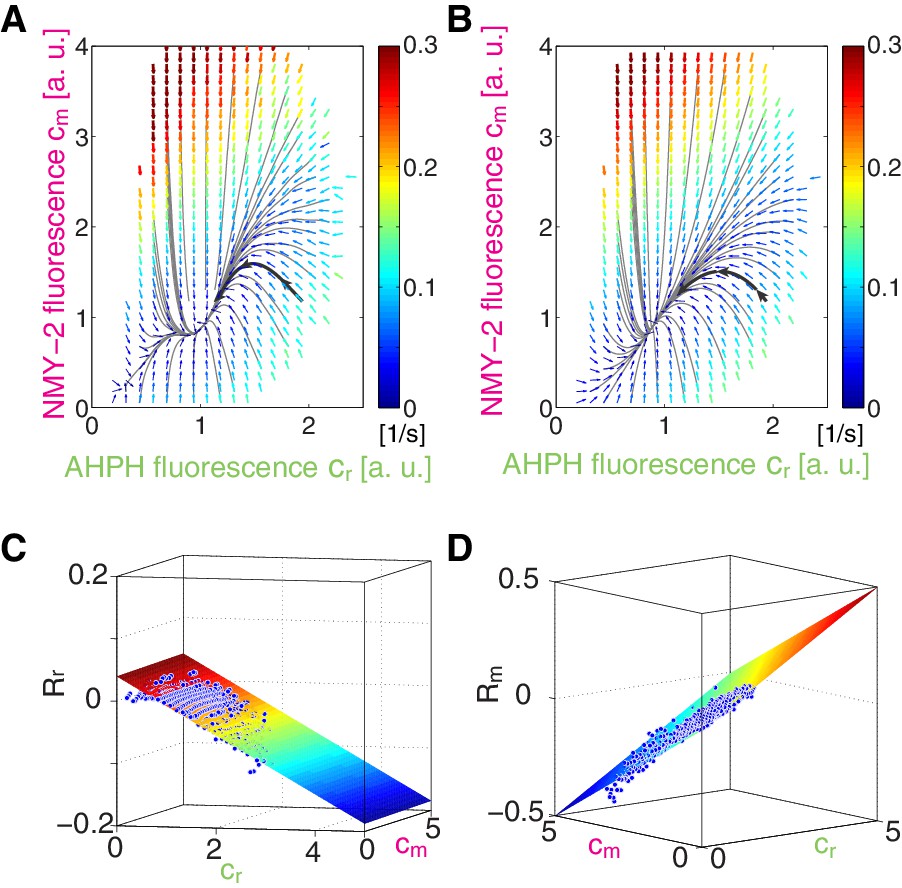
Trajectories in the phase plane of AHPH and NMY-2 concentrations.
(A) Effective reaction terms of NMY-2 and active RhoA obtained by COMBI (man text Figure 1H). Arrows represent concentration changes, colors indicate the magnitude of change. Black lines indicate the integrated trajectories, the solid black line with arrows highlights a trajectory that states with high active RhoA and low myosin, and overshoots in its level of myosion prior reaching the fixpoint. (B) Trajectories (black lines) are obtained from linearized reaction kinetics shown in (C) and (D). (C,D) Linearization of (C) and (D) .
Figure 1—figure supplement 3
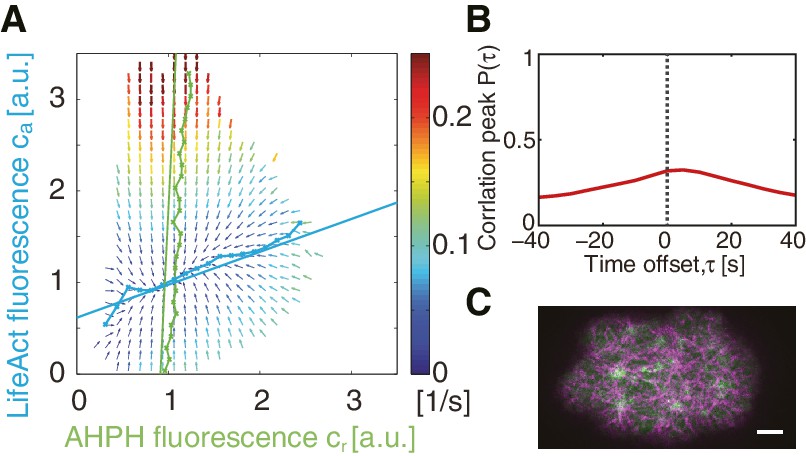
COMBI of active RhoA and actin.
(A) Effective reaction terms of active RhoA and actin in the phase plane of normalized active RhoA and LifeAct concentrations (N = 14 embryos). Arrows represent concentration changes, colors indicate the magnitude of change. Thin solid green (active RhoA) and blue (actin) lines, numerically determined nullclines. Thick dashed lines, linearized nullclines (see Appendix). (B) A plot of peak value of the normalized , spatiotemporal cross-correlation function between LifeAct and AHPH fluorescence. (C) A representative image of AHPH::GFP (green) and LifeAct::tagRFP-T (magenta) in the non-RNAi condition. Scale bar; .
Figure 2 with 2 supplements
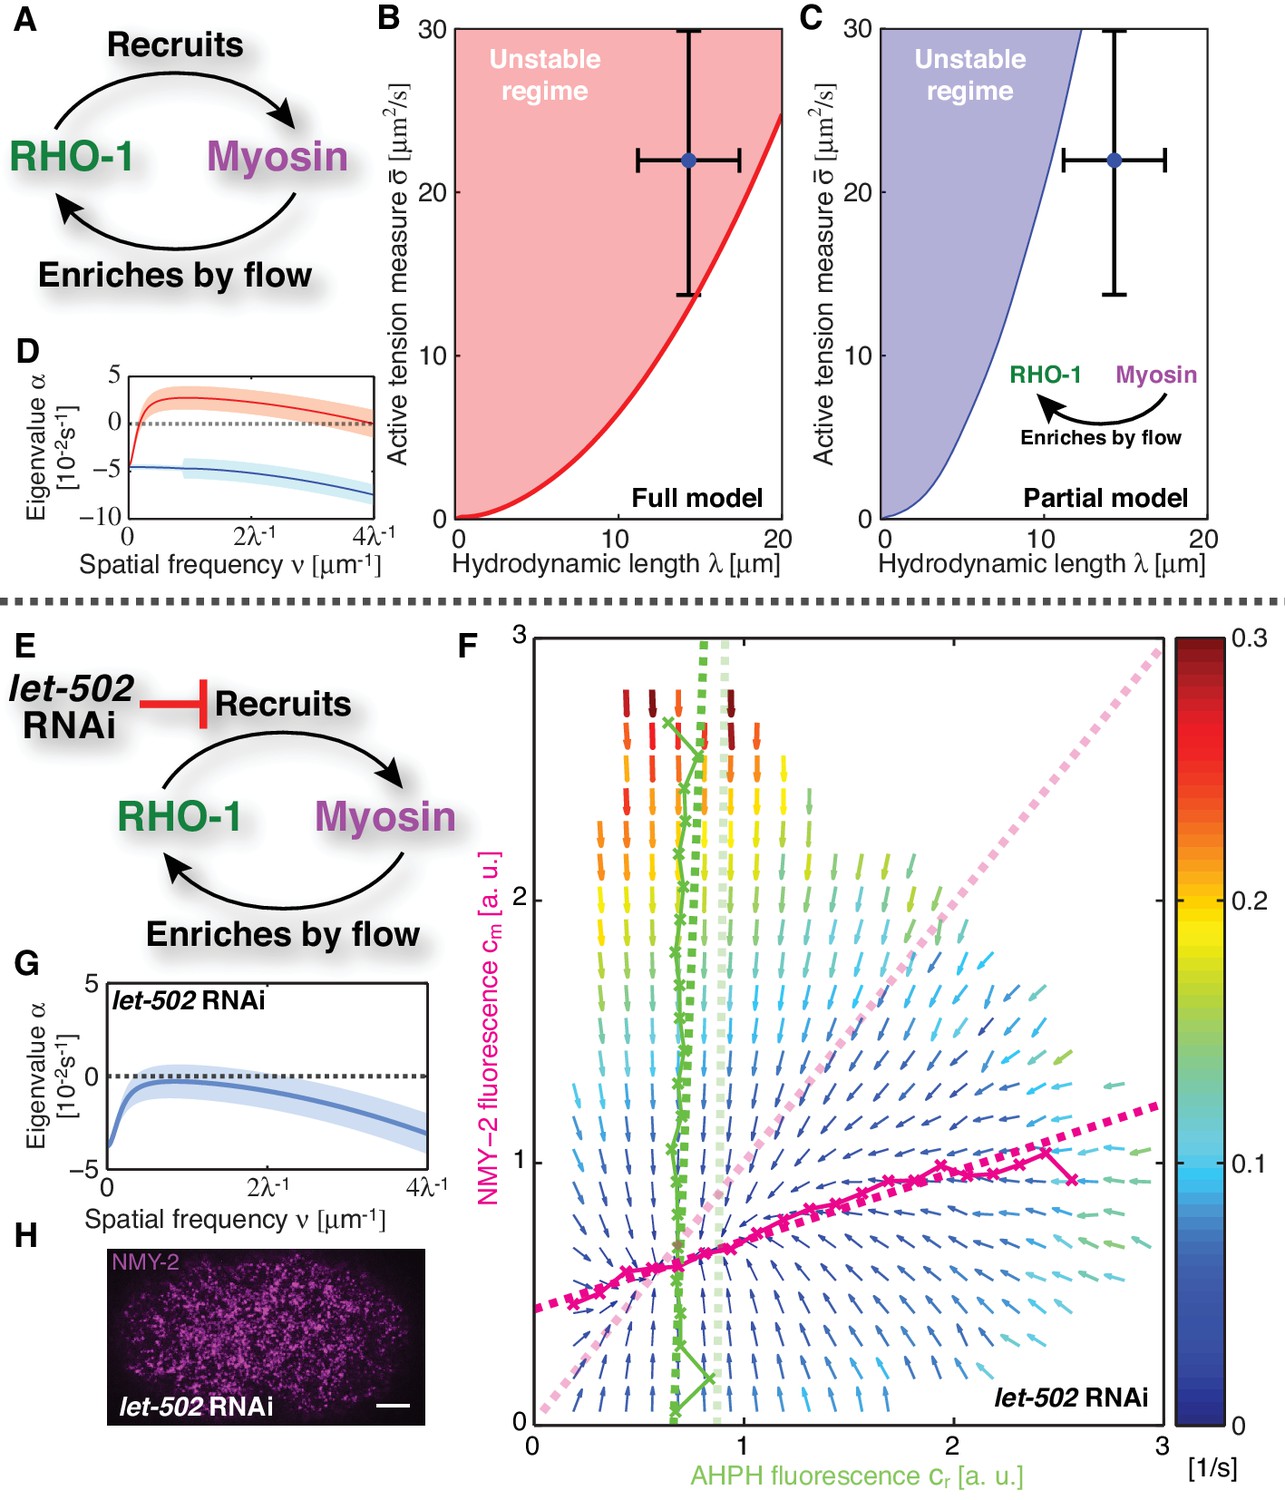
Linear stability analysis reveals that the actomyosin cortex in C. elegans is unstable.
(A) Schematic of the full mechanochemical patterning system. (B) Stability diagram of the homogeneous state in the plane of hydrodynamic length and active tension measure (see Appendix). The homogeneous state is unstable within the red region. Blue dot represents the parameter values of the non-RNAi C. elegans cortex; error bars denote 95% confidence intervals. (C) Stability diagram for a partial model without NMY-2 recruitment by RhoA; inset: corresponding schematic. The homogeneous state is unstable within the blue region. (D) Dispersion relations of the full mechanochemical patterning system with (red) and without (blue) RhoA mediated NMY-2 recruitment. Lighter shared areas represent 95% confidence intervals. (E) let-502 RNAi suppresses RhoA mediated recruitment of NMY-2. (F) COMBI diagram for let-502 RNAi (30 hr), N = 12 embryos. Thin solid magenta (NMY-2) and green (RhoA) lines; numerically determined nullclines. Thick solid dashed lines, linearized nullclines. Light dashed lines, linearized nullclines for the non-RNAi condition (Figure 1H) for comparison. (G) Dispersion relation for let-502 RNAi, lighter blue area indicates the 95% confidence interval. (H) NMY-2 distribution under let-502 RNAi. Scale bar; .
Figure 2—figure supplement 1
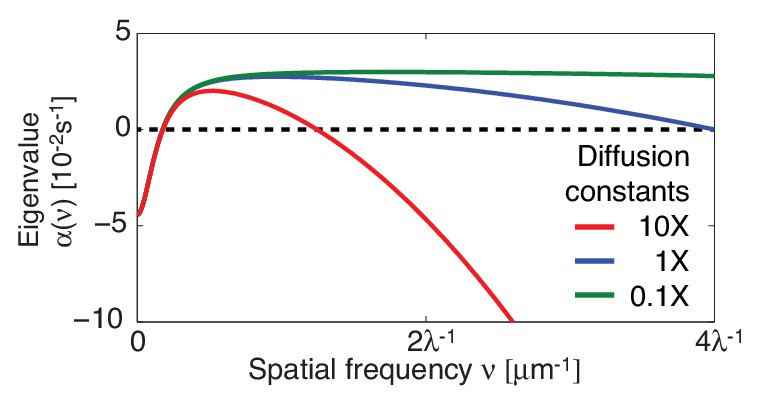
The contractile instability is insensitive to changing the diffusion constants over two orders of magnitude.
Dispersion relations for measured diffusion coefficients (blue) and for a ten-fold increase (red) and a ten-fold decrease (green).
Figure 2—figure supplement 2
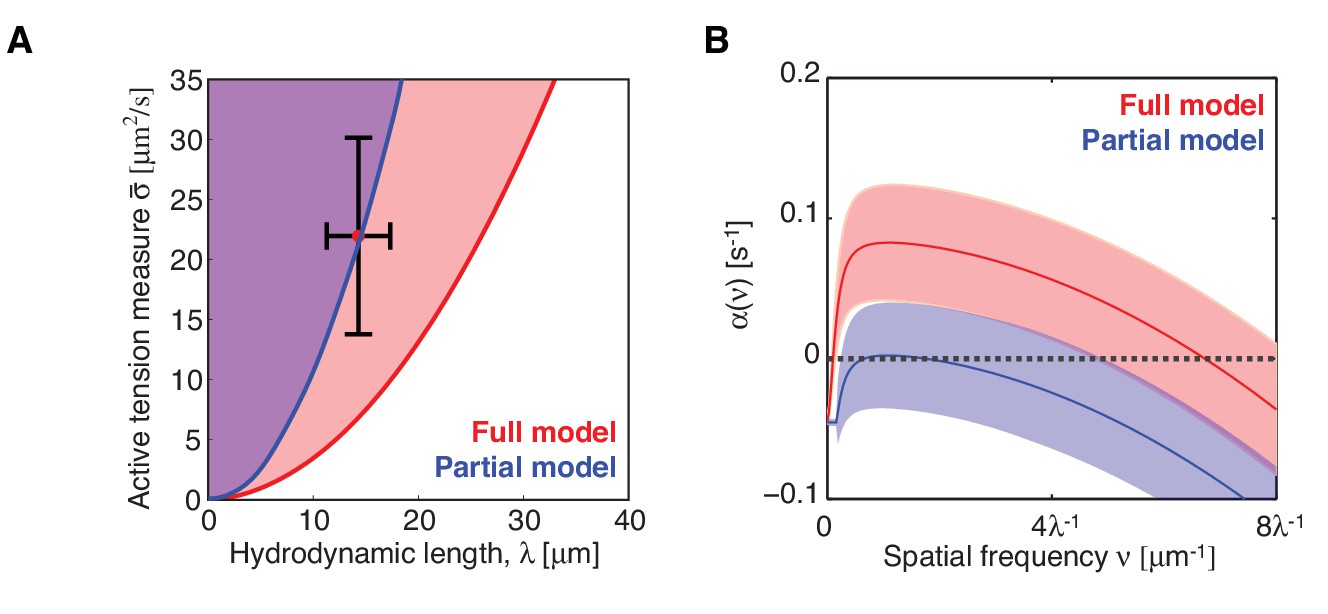
Stability of the homogeneous state with a linear form of .
(A) Stability diagram of the homogeneous state in the plane of hydrodynamic length and active tension measure . The homogeneous state is unstable for the full system within the red region, and unstable for the partial system without myosin recruitment by active RhoA within the blue region. (B) Corresponding dispersion relations, shaded regions indicate 95% confidence.
Figure 3 with 2 supplements
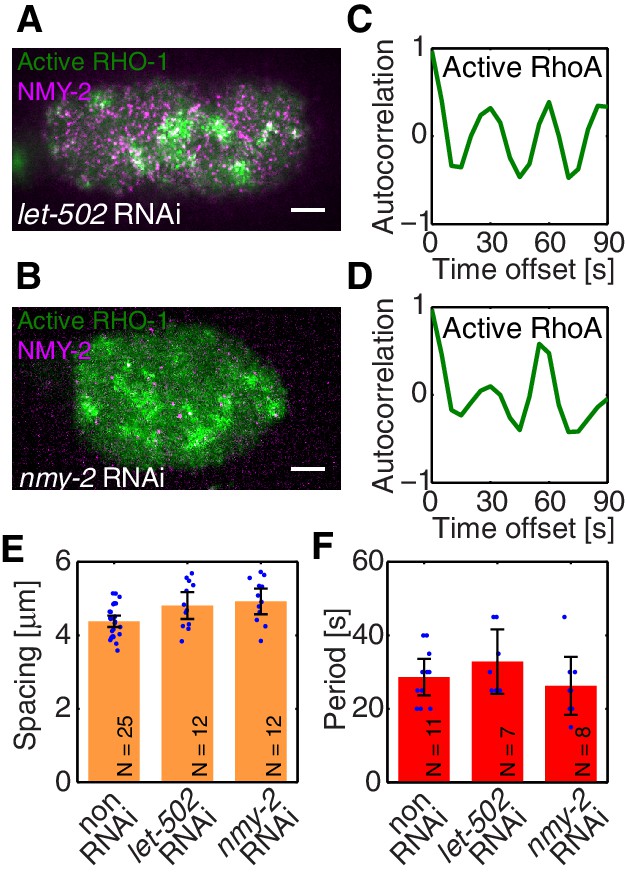
Active RhoA exhibits pulsatory dynamics under conditions of reduced myosin activity.
(A,B) AHPH::GFP (green) and NMY-2::RFP (magenta) in (A) a representative let-502 RNAi and (B) a representative nmy-2 RNAi embryo. (C,D) Normalized AHPH::GFP intensity change autocorrelation (C) for (A) and (D) for B, obtained within the posterior. (E,F) Characteristic (E) spacing of AHPH patterns and (F) period of AHPH intensity change in non-RNAi, nmy-2 RNAi, and let-502 RNAi embryos. Scale bars, .
Figure 3—figure supplement 1
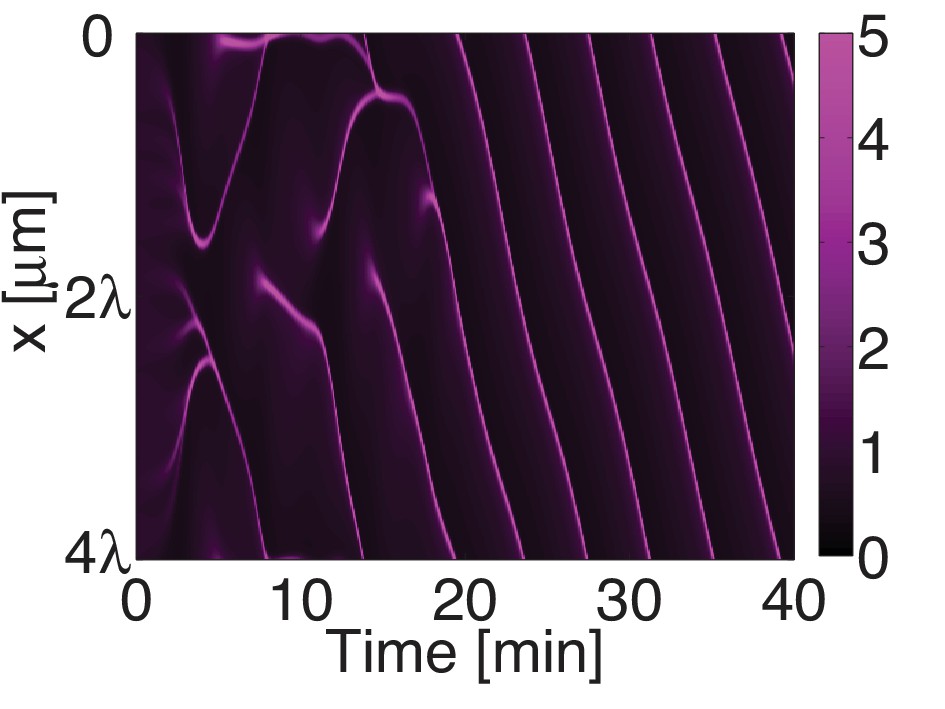
Myosin forms traveling peaks that are spaced approximately apart.
Space time plot of the myosin distribution obtained by numerical integration the full mechanochemical system (no active RhoA pacemaer). The system forms a single traveling peak with rapid flows impinging upon it.
Figure 3—figure supplement 2

Characteristic spacing of AHPH foci.
(A,B) A representative example of a preprocessed GFP-AHPH image by (A) background subtraction and (B) contrast enhancement (contrast limited adaptive histogram equalization method, Matlab) prior to computing the spatial autocorrelation function of the intensity. Scale bar, 5 . (C) Corresponding spatial autocorrelation function. (D) Corresponding radially averaged correlation function. The position of the first peak at indicates the characteristic spacing of AHPH foci in this embryo.
Figure 4 with 1 supplement
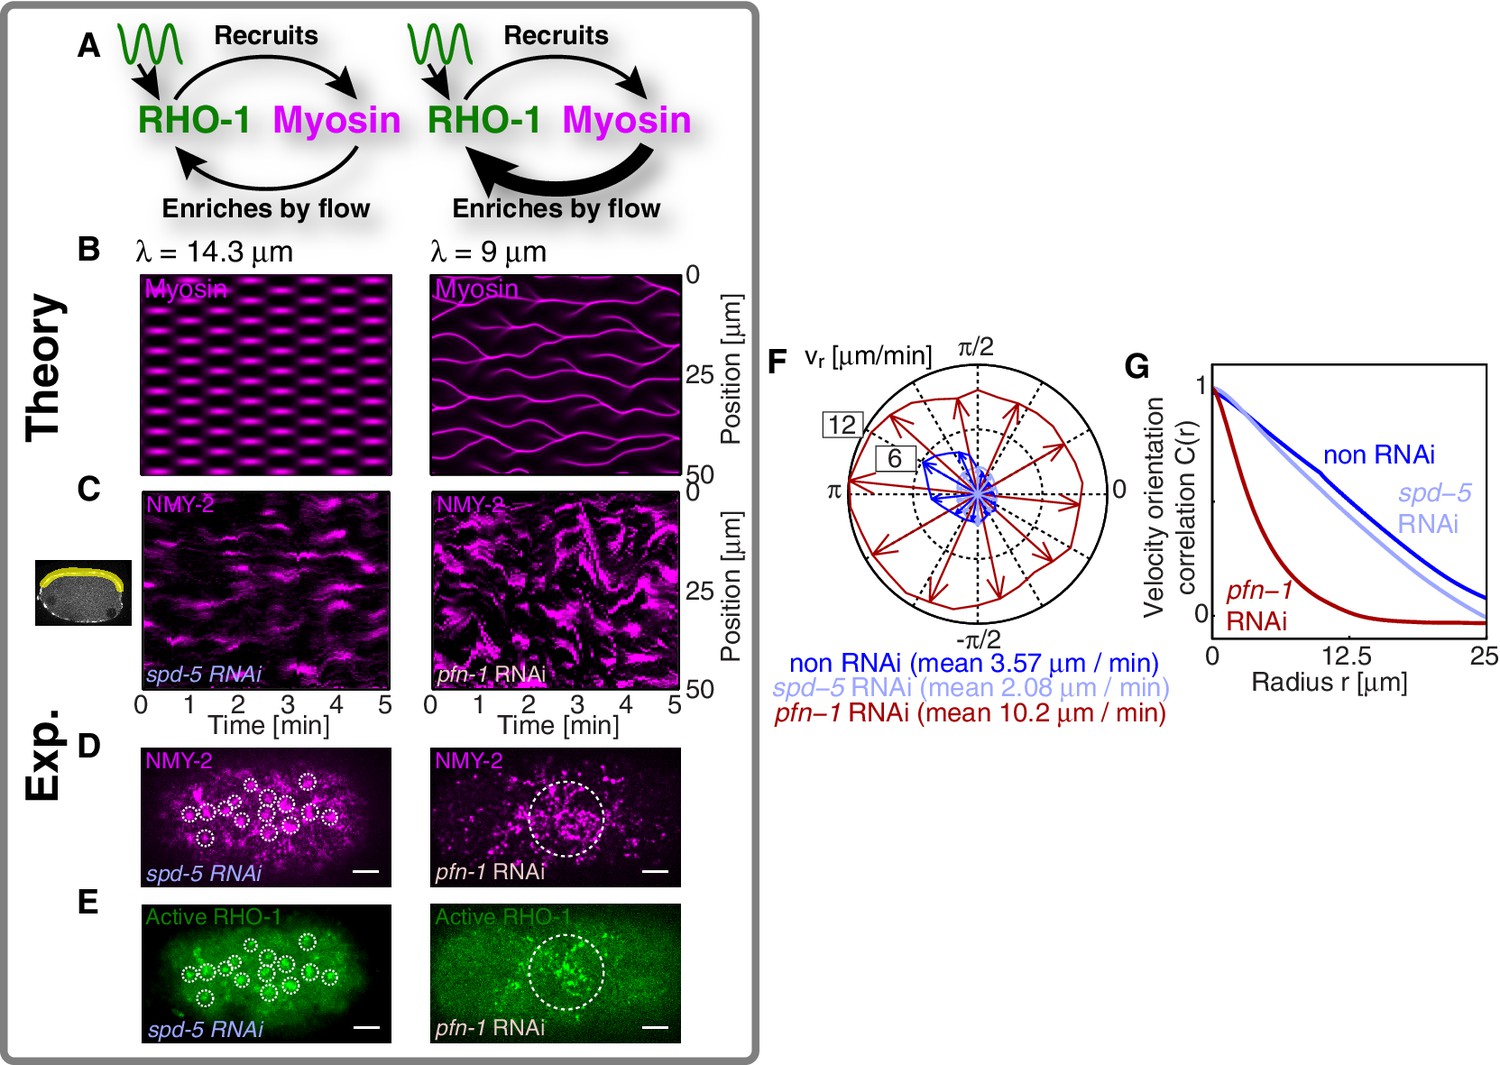
A RhoA pacemaking oscillator controls the contractile instability.
(A) Schematic of a mechanochemical patterning system under control of a RhoA pacemaker, with (left) normal conditions and (right) with increased mechanochemical feedback and with faster flows. (B) Numerically obtained space time plots of the myosin distribution, for normal conditions (; left) and for a weakened cortex with increased mechanochemical feedback (; right); see Appendix. (C) Kymographs of NMY-2 intensity under normal conditions (spd-5 RNAi; left) and under conditions of a weakened cortex (pfn-1 RNAi; right) obtained in mid-plane images and from the yellow region illustrated in the inset image on the right. (D,E) Representative cortical plane images of (D) NMY-2::tagRFP-T and (E) RhoA::GFP, dotted circles indicate foci. (F) Average cortical flow speed as a function of direction under conditions of a normal cortex (dark blue: non-RNAi; light blue: spd-5 RNAi) as well as for a weakened cortex (red: pfn-1 RNAi). (G) Radially averaged velocity orientation correlation function (Materials and methods) for the same three conditions, note that the pfn-1 RNAi embryo cannot drive coherent flow over large distances. Scale bars, .
Figure 4—figure supplement 1
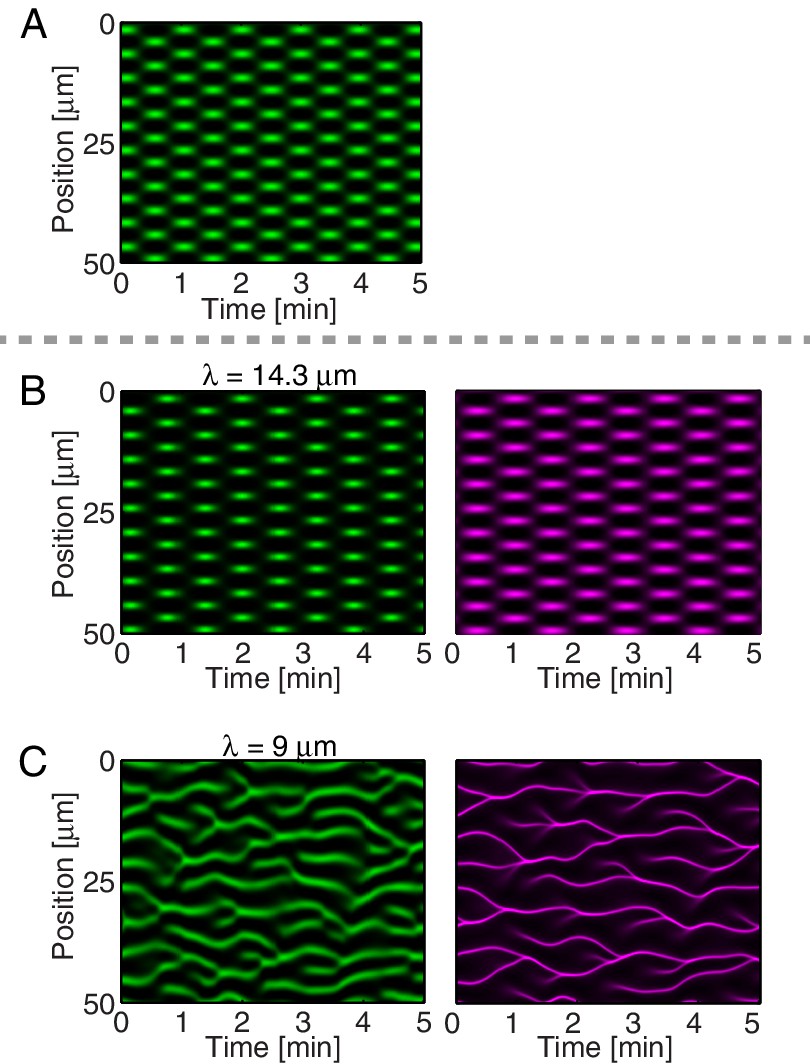
A RhoA pacemaking oscillator can control the myosin pattern in the model.
(A) Spatiotemporal plot of the active RhoA pacemaker in the absence of myosin and cortical flow, by utilizing a generic spatiotemporal oscillator for active RhoA dynamics (the complex Swift-Hohenberg equation, see Appendix). (B) Spatiotemporal plot of this active RhoA pacemaker coupled of the full mechanochemical system with , describing the normal state the cortex (non-RNAi or spd-5 RNAi). Left (green) shows the active RhoA pattern; right (magenta) shows myosin. Compared to (A), the full mechanochemical system displays a slightly longer time-scale, and the active RhoA foci appear slighlty more ’condensed’. Note also that in our experiments, active RhoA foci appear more condensed when myosin is active (main text Figure 4E, left) as compared to when myosin function is reduced or when myosin is absent (main text Figure 3A,B). (C) Spatiotemporal plot of the active RhoA pacemaker coupled of the full mechanochemical system with reduced mechanochemical feedback and , mimicking pfn-1 RNAi. Now the dynamical pattern is characterized by irregular movements.
Videos
Video 1
Active RhoA and myosin co-localization in pulsatile foci.
Time lapse movie shows the cortical plane of embryo that expresses both AHPH::GFP (green) and NMY-2::tagRFP-T (magenta) in non-RNAi condition. Scale bar, 5 .
Video 2
Homogeneous myosin distribution in suppressed RhoA mediated myosin recruitment.
Time lapse movies show the cortical planes of the embryo that expresses NMY-2::tagRFP-T in let-502 RNAi embryo (upper) and in non-RNAi embryo (lower). Scale bar, 5 .
Video 3
Traveling peaks of myosin in the mechanochemical patterning system.
Time evolution of the myosin pattern, obtained by the numerical integration of the mechanochemical patterning system without an active RhoA pacemaking oscillator.
Video 4
Pulsatile dynamics of the active RhoA exhibits pulsatile dynamics in homogenous myosin cortex.
Time lapse movie shows the cortical plane of the embryo that expresses both AHPH::GFP (green) and NMY-2::tagRFP-T (magenta) in let-502 RNAi embryo. Scale bar, 5 .
Video 5
Pulsatile dynamics of the active RhoA exhibits pulsatile dynamics independently of myosin function.
Time lapse movie shows the cortical plane of the embryo that expresses both AHPH::GFP (green) and NMY-2::tagRFP-T (magenta) in nmy-2 RNAi embryo. Scale bar, 5 .
Video 6
The absence of the active RhoA pacemaking oscillator in ect-2 RNAi embryo.
Time lapse movies show the cortical planes of the embryos that expresses AHPH::GFP (green) in nmy-2 RNAi embryo (upper), and in ect-2 RNAi embryo (lower). Scale bar, 5 .
Video 7
Active RhoA pacemaker can determine the myosin pattern in the contractile instability regime.
Time evolution of the myosin pattern, obtained by the numerical integration of the mechanochemical patterning system, coupled with the active RhoA pacemaking oscillator.
Video 8
Rapid and irregularly moving myosin pattern in the cortex with the reduced hydrodynamic length.
Time evolution of the myosin pattern, obtained by the numerical integration of the mechanochemical patterning system with the reduced hydrodynamic length by 5 to 9 , and coupled with the active RhoA pacemaking oscillator.
Video 9
Rapid and irregular movement of myosin foci for a pfn-1 RNAi embryo.
Time lapse movies show the midplane sections of the embryos that express NMY-2::GFP (magenta) in spd-5 RNAi embryo (upper) and pfn-1 RNAi embryo (lower). Scale bar, 5 .
Video 10
Pulsatile dynamics of the active RhoA and the myosin in spd-5 RNAi embryo.
Time lapse movies show the cortical planes of the embryo that expresses both AHPH::GFP (green) and NMY-2::tagRFP-T (magenta) in spd-5 RNAi embryo. Scale bar, 5 .
Video 11
Irregular dynamics of the active RhoA and the myosin in pfn-1 RNAi embryo.
Time lapse movies show the cortical planes of the embryo that expresses both AHPH::GFP (green) and NMY-2::tagRFP-T (magenta) in pfn-1 RNAi embryo. Scale bar, 5 .
Video 12
Pulsatile dynamics of the active RhoA in pfn-1;nmy-2 RNAi embryo.
Time lapse movies show the cortical planes of the embryos that expresses AHPH::GFP (green) in nmy-2 RNAi embryo (upper), and in pfn-1;nmy-2 RNAi embryo (lower). Scale bar, 5 .
Tables
Table 1
Parameter values.
| Parameters*,† | Value |
|---|---|
| Determined in this study | |
| Kinetic parameter for non RNAi | |
| Kinetic parameter for let-502 RNAi | |
| Determined in Saha et al., | |
| Parameter values for complex Swift-Hohenberg equation | |
-
*Parameter values are shown with 95 % confidence intervals.
-
†Active RhoA and NMY-2 densities are normalized by their average concentrations, and reported in dimensionless units of fluorescence intensities per unit area of , corresponding to .
Download links
A two-part list of links to download the article, or parts of the article, in various formats.
Downloads (link to download the article as PDF)
Open citations (links to open the citations from this article in various online reference manager services)
Cite this article (links to download the citations from this article in formats compatible with various reference manager tools)
Controlling contractile instabilities in the actomyosin cortex
eLife 6:e19595.
https://doi.org/10.7554/eLife.19595


