A long-term epigenetic memory switch controls bacterial virulence bimodality
- The Hebrew University of Jerusalem, Israel
Figures
Figure 1 with 1 supplement
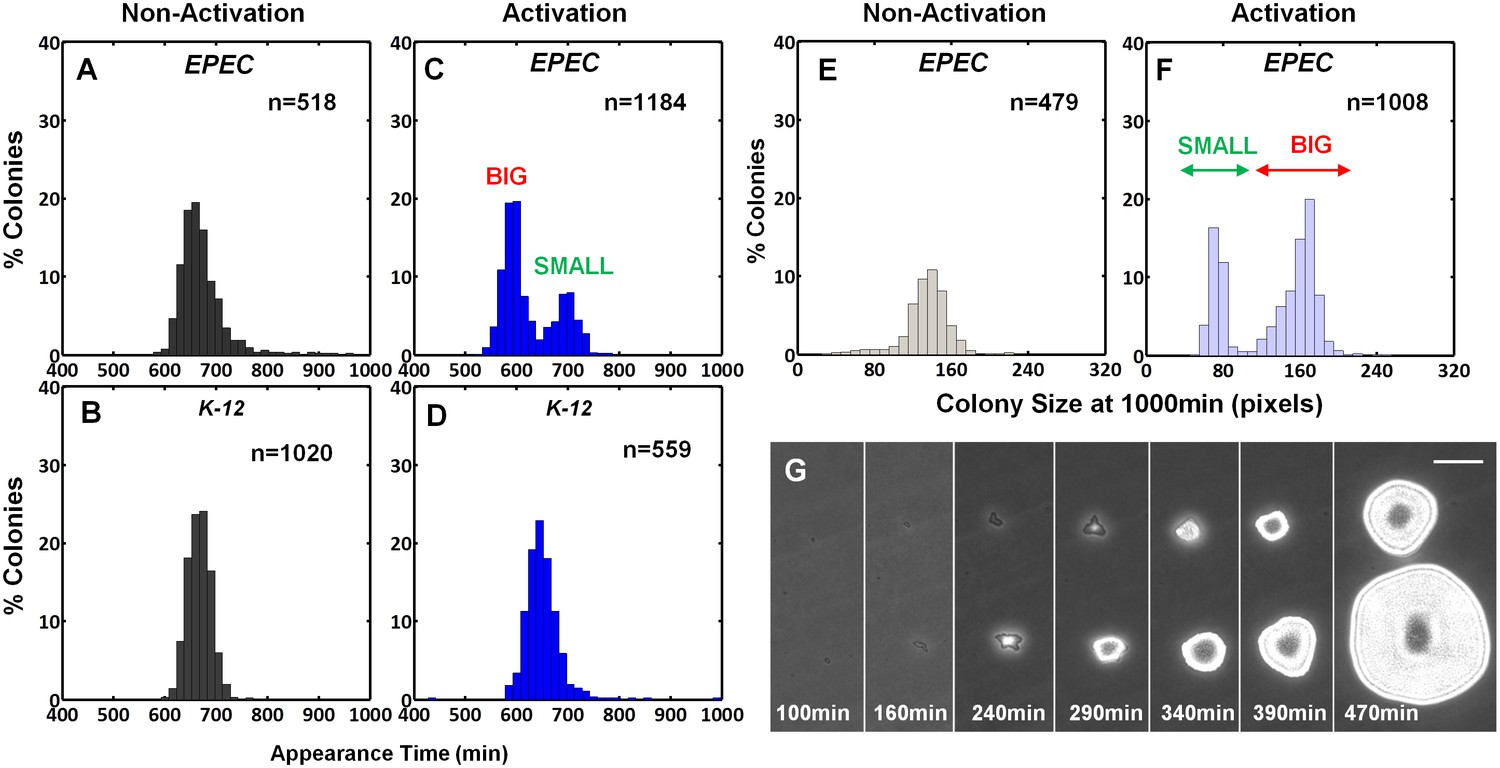
EPEC displays the bimodal colony size after virulence activation.
Bacterial cultures of EPEC or E. coli K-12 were grown overnight in LB media (Non-Activation) or in DMEM for 3 hr at 37°C to OD600 ~0.3 (Activation). Cultures were then diluted, plated on LB agar, and incubated at 32°C (non-activating conditions). Colony appearance time was monitored by ScanLag at 15 min intervals. The resulting histograms show (A, B, C, D) the fractions of colonies detected at each time point and (E, F) colony size distributions 1000 min after plating. Colonies larger or smaller than 105 pixels were defined as ‘BIG’ and ‘SMALL’ morphotypes, respectively. (A–C, E, F) Experiments were repeated in at least four independent biological replicates. (D) shows the cumulative of 4 independent biological replicates. (G) Time-lapse microscopy phase-contrast images of the two co-existing morphotypes, BIG and SMALL. Time points are indicated. Similar results were obtained in at least 10 different locations and in two independent biological replicates. Scale bar: 50 μm.
-
Figure 1—source data 1
This Source Data file contains appearance time histogram raw data for Figure 1A and C (activated and non-activated EPEC cultures) from ScanLag experiments.
Data collected from four experiments. The data were collected by the ScanningManager software application and analyzed by TimeLapse analysis software application http://bio-site.phys.huji.ac.il/Materials. For figures histogram was fitted to total 100% bacteria. Data columns marked with * and ** are used for creating Figure 1A and C respectively.
- https://doi.org/10.7554/eLife.19599.004
Figure 1—figure supplement 1
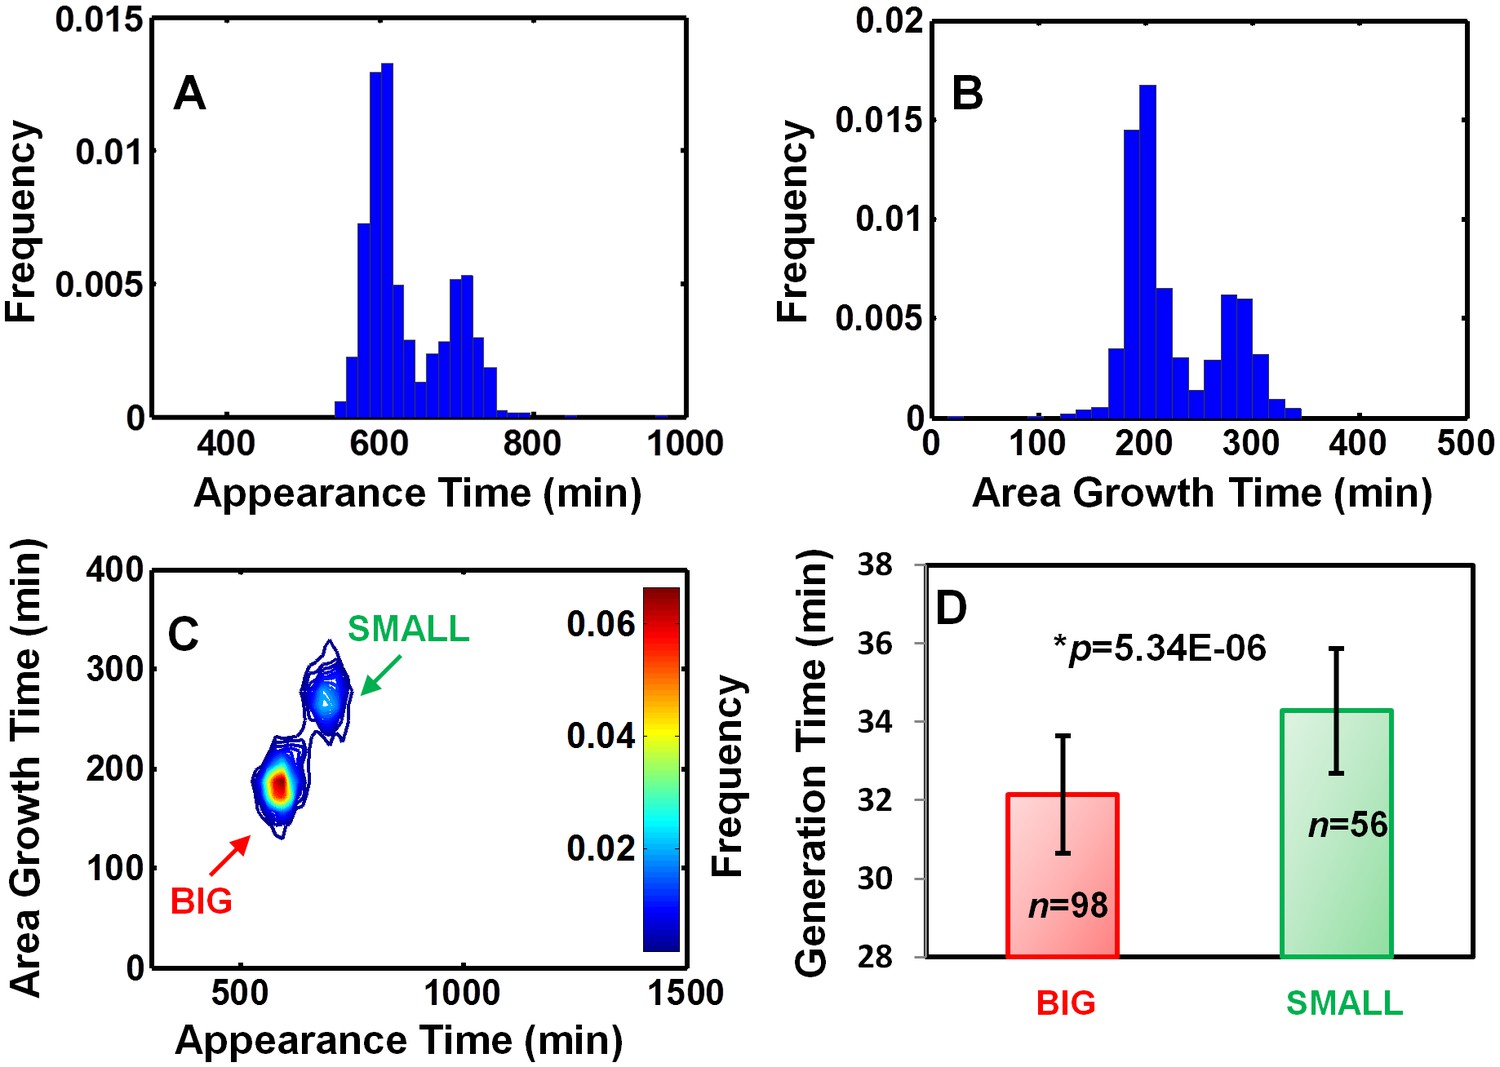
EPEC growth on LB measured by ScanLag and time-lapse microscopy.
Static cultures of EPEC were grown in DMEM for 3 hr at 37°C to OD600 ~0.3 (activating conditions). Cultures were then diluted, plated on LB agar, and incubated at 32°C (non-activating conditions). (A–C) Growth of colonies was monitored at 15 min intervals using the ScanLag system. (A) Histogram of the fraction of colonies detected at each time point. (B) Histogram of colony area growth time, i.e. the time taken to increase the colony area from 20 to 80 pixels. (C) Two-dimensional histogram of the data in (A) and (B) allows the visualization of the bimodal phenotype. Note the diagonal shift of the SMALL morphotype suggesting an increase in time to reach the given area and not an increased lag duration (Levin-Reisman et al., 2010) (n = 1184). (A–C) Experiments were repeated in at least four independent biological replicates. (D) Analysis of single-cell generation time by time-lapse phase microscopy. Bacteria from BIG and SMALL colonies were suspended in LB and were placed on LB agar pads and observed by microscopy. Data are presented as the median ± Median Absolute Deviation (MAD) of each morphotype. The p-value was calculated by Wilcoxon rank sum test, h = 1. (2% of non-dividing cells were excluded from the analysis since their division was out of the observed time range). Similar results were obtained in two independent biological repeats.
Figure 2
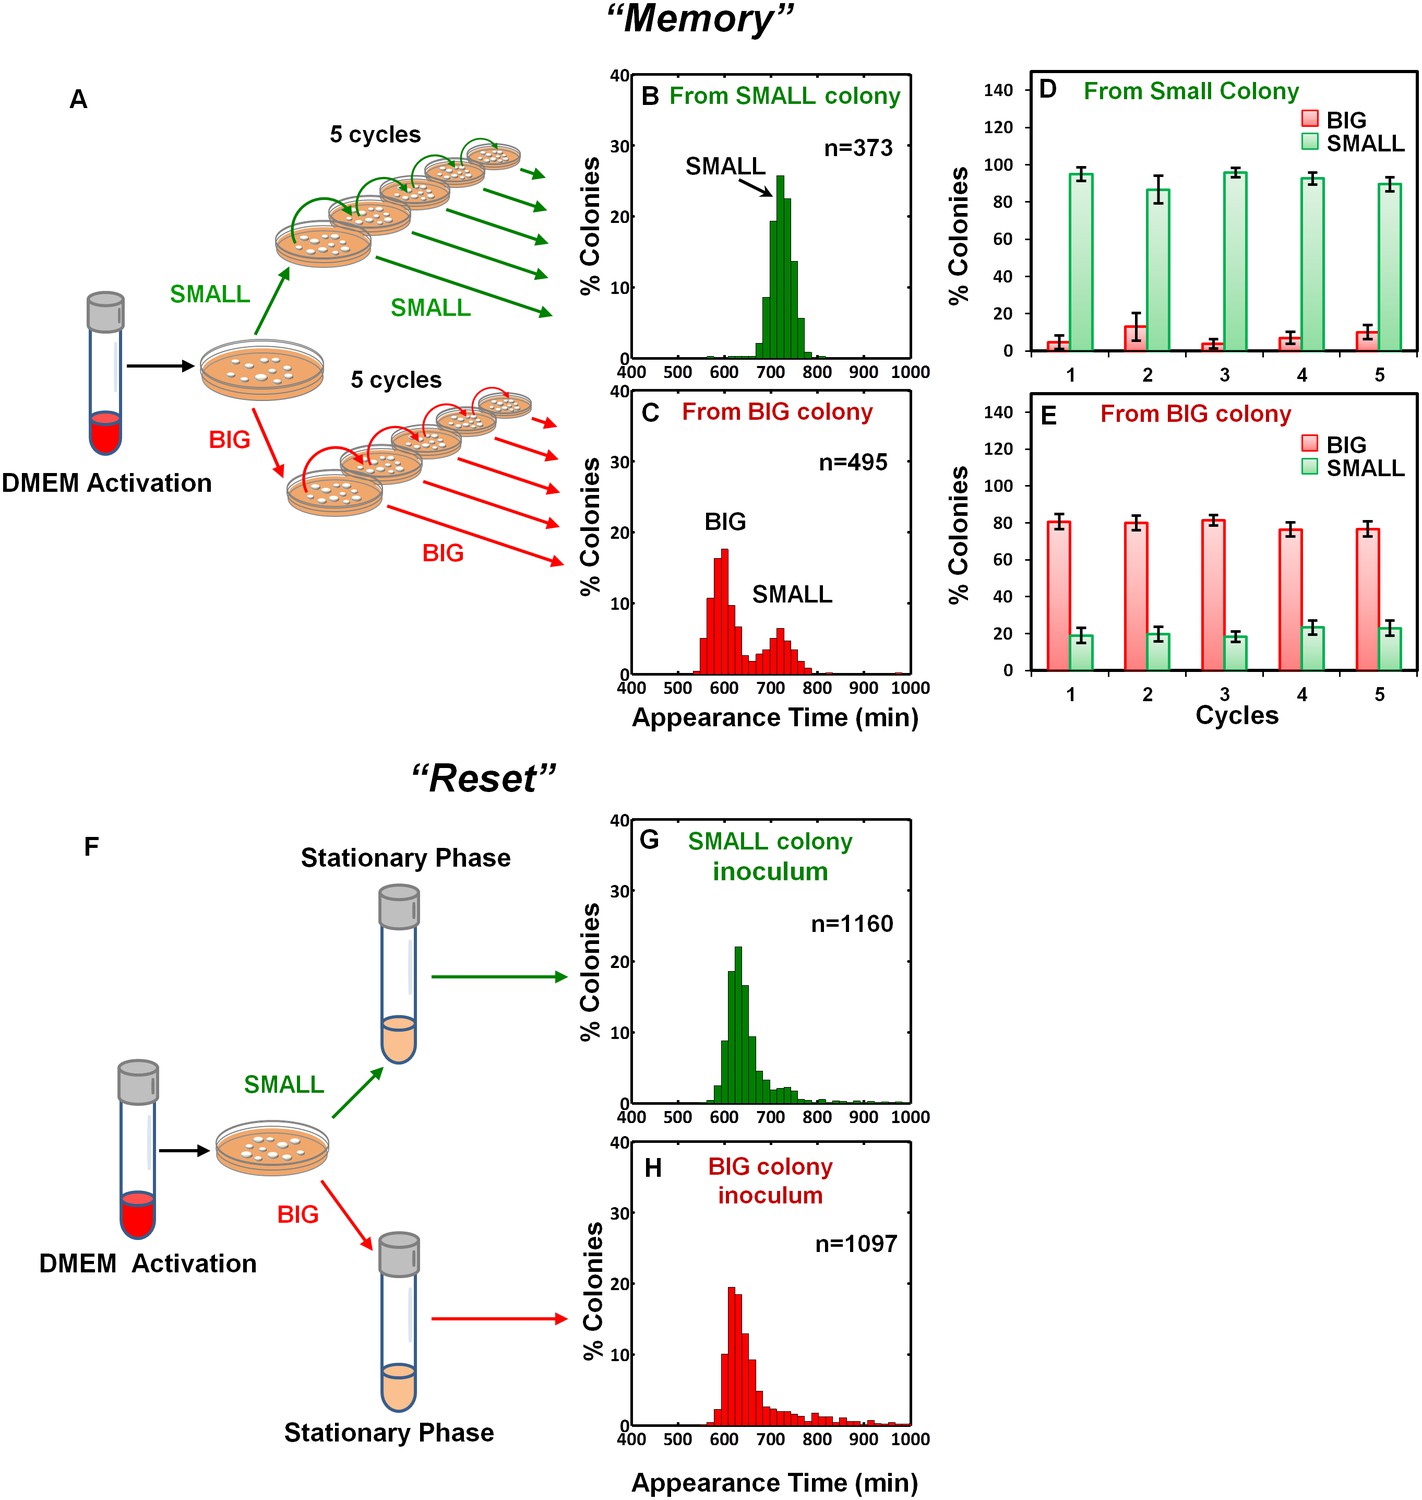
Memory and reset of colony-size bimodality.
(A) Scheme of the experimental procedure for measuring the stability of colony morphotypes: Colonies of EPEC grown on LB agar were picked 1000 min after plating, resuspended, re-plated on LB agar, and subjected to ScanLag analysis. (B) Histogram of the fraction of colonies detected at each time point for bacteria taken from a SMALL colony. (C) Histogram of the fraction of colonies detected at each time point for bacteria taken from a BIG colony. (B–C) Experiments were repeated in at least four independent biological replicates. (D, E) The same procedure was repeated for four consecutive cycles using bacteria taken from (D) SMALL or (E) BIG colonies, and in each cycle the fraction of BIG and SMALL colonies was determined. Data are presented as the means ± s.d. of five technical replicates. (F) Scheme of the experimental procedure for the ‘reset’ of the bimodality. (G) SMALL or (H) BIG colonies of EPEC were picked 1000 min after plating, resuspended in LB broth and grown overnight to stationary phase at 37°C. Cultures were then plated and subjected to ScanLag analysis.
Figure 3

Model and measurements of bimodal switching rates.
(A) Scheme and equations of a bimodal switching model. The two morphotypes, BIG and SMALL, are characterized by different growth rates, µB and µS, respectively, and different switching rates a and b. Note that these parameters depend on growth conditions. (B) Measurement and fit to the analytical solution of equations Equations 1 and 2 during exponential growth under activating conditions with initial conditions B(t = 0)=1, S(t = 0)=0, see Materials and methods-Mathematical model. Green and red lines are ScanLag measurements of the SMALL and BIG morphotype fractions, respectively (means ± s.d. of three independent biological replicates). Solid lines are the fit to data using Equations 1 and 2, resulting in a = 0.24 ± 0.13 h−1 and b<<a under activating conditions. These switching rates result in a population dominated by the SMALL morphotype after a few hours. Note that stationary phase caused resetting of the culture to the BIG morphotype. (C) Model (solid line) and experimental measurement (dotted line and markers) of the growth of the total population for the data presented in (B).
Figure 4 with 1 supplement
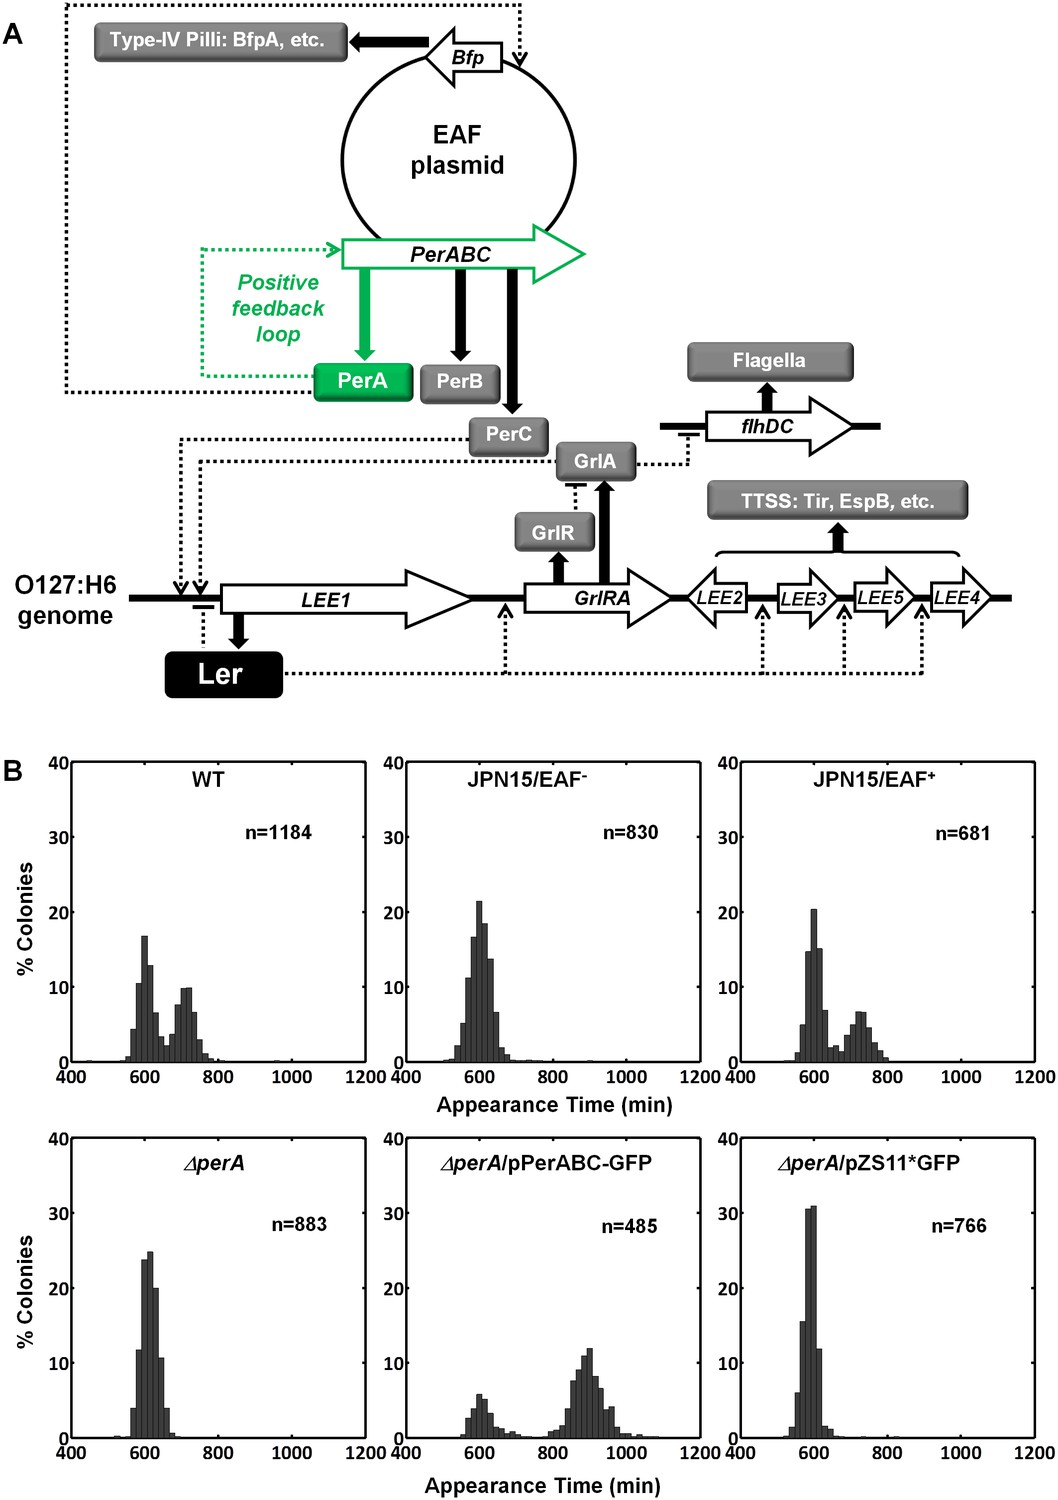
Per operon is essential for establishing colony-size bimodality.
(A) Scheme of key regulatory genes of the EPEC virulence machinery. Ler is the T3SS master regulator and its expression is induced by two redundant positive regulators, PerC and GrlA (Bustamante et al., 2011). PerA is a positive autoregulator (Ibarra et al., 2003; Martínez-Laguna et al., 1999; Porter et al., 2004) of perABC operon and positive transcription regulator of typeIV pilli (bfpA) (Ibarra et al., 2003; Tobe et al., 1996). Open arrows represent operons, thick arrows and filled boxes represent protein production. Dotted lines indicate regulatory circuits. PerA positive feedback loop is marked in green. (B) Histogram of colony appearance times for bacteria taken from activated cultures of indicated strains. Strains without perA, either by gene deletion (ΔperA) or EAF plasmid curing (JPN15/EAF-), result in unimodality. These experiments were repeated in at least two independent biological replicates.
Figure 4—figure supplement 1
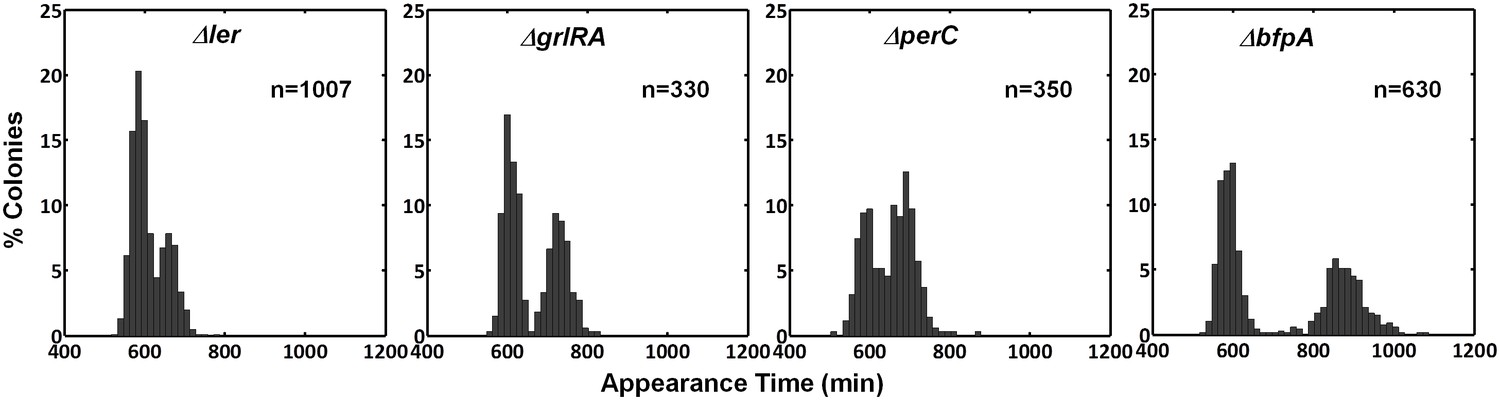
ScanLag colony appearance phenotype of EPEC virulence pathway mutants.
A histogram of the fraction of colonies detected at each time point for bacteria taken from indicated activated cultures. Deletions in genes ler, grlRA, bfpA, and perC, encoding key regulators of EPEC virulence (shown in Figure 4A), did not prevent bimodality. This experiment was repeated in at least two independent biological replicates.
Figure 5 with 2 supplements

Co-expression of PerA and PerB results in colony-size bimodality.
(A) A histogram of the fraction of colonies detected at each time point for bacteria taken from indicated cultures of EPEC ΔperA mutant transformed with pPerA-GFP (ΔperA/pPerA-GFP), pPerB-GFP (ΔperA/pPerB-GFP) and pPerAB-GFP plasmids (ΔperA/pPerAB-GFP). Cultures were started from a single colony (BIG) and grown in activating conditions. Only pAB-GFP plasmid, co-expressing PerA and PerB, restored the bimodality. This experiment was repeated in at least two independent biological replicates. (B) Expression of perA, perB and perAB using a transcriptional GFP reporter by time-lapse microscopy of single cells extracted from BIG colonies as in (A) collected 1000 min after plating. Similar results were obtained in two independent biological replicates and in at least three different locations. Scale bar: 15 μm.
Figure 5—figure supplement 1
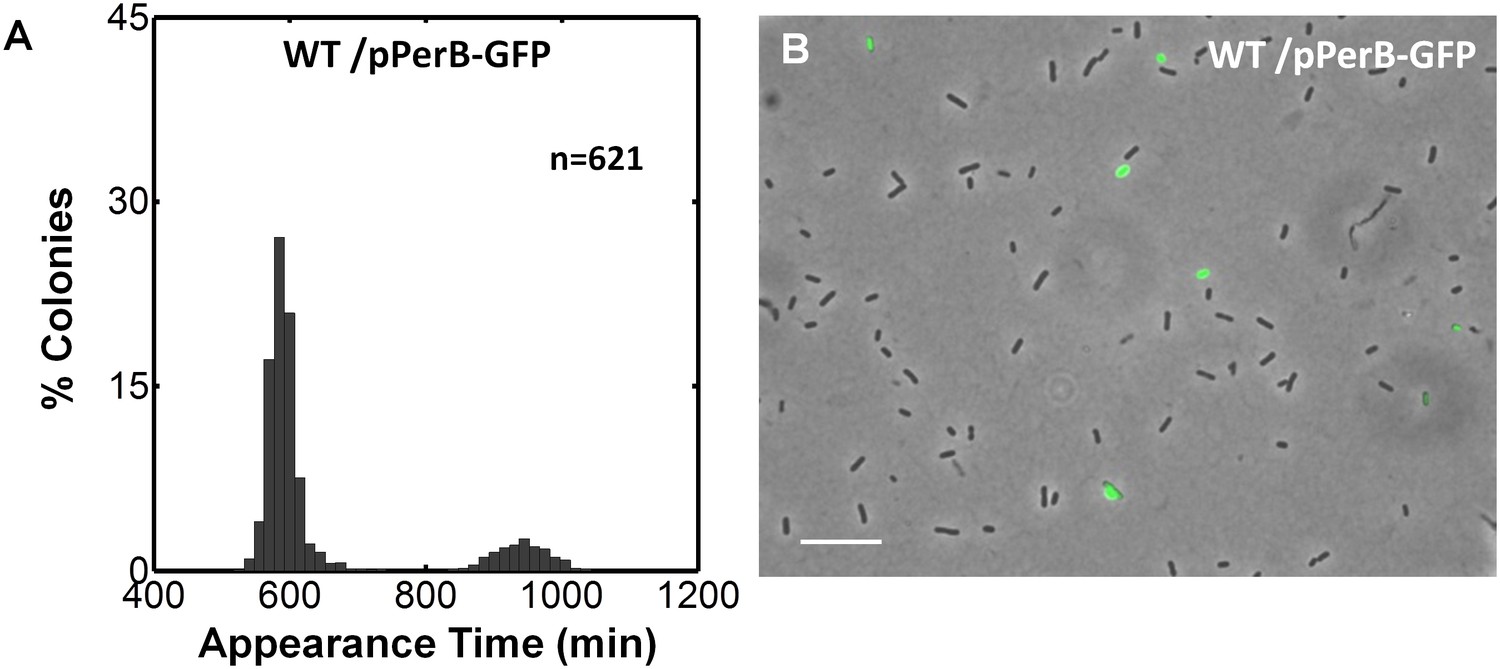
Expression control of pPerB-GFP in wild type EPEC.
(A) Histogram of the fraction of colonies wild type EPEC transformed with pPerB-GFP plasmid (wt/pPerB-GFP) and grown as in Figure 5. This experiment was repeated in at least two independent biological replicates. (B) Expression of perB using a transcriptional GFP reporter by time-lapse microscopy in BIG colonies of wild type EPEC (wt/pPerB-GFP) from (A) collected 1000 min after plating. PerB is expressed in a subpopulation of wild type EPEC. Similar results were obtained in two independent biological replicates and in at least three different locations. Scale bar: 15 μm.
Figure 5—figure supplement 2
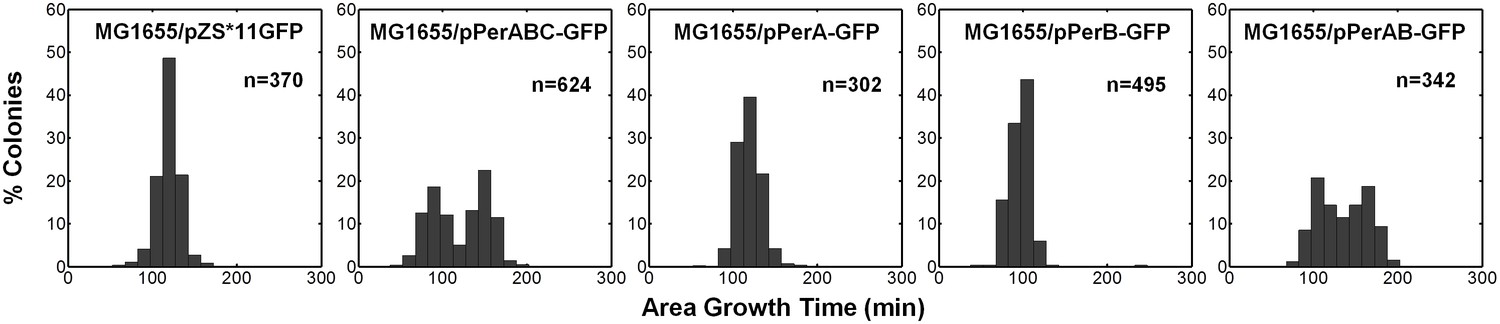
Co-expression of PerA and PerB causes bimodality of colony growth in E. Coli K-12 MG1655.
A histogram of colony area growth time, i.e. the time taken to increase the colony area from 20 to 80 pixels for bacteria taken from indicated activated cultures of MG1655 E. Coli K-12 bacteria transformed with pZS*11GFP (MG1655/pPerA-GFP), pPerABC-GFP (MG1655/pPerABC-GFP), pPerA-GFP (MG1655/pPerA-GFP), pPerB-GFP (MG1655/pPerB-GFP) and pPerAB-GFP plasmids (MG1655/pPerAB-GFP). Co-expression of PerA and PerB causes bimodality of colony growth in MG1655. This experiment was repeated in at least two independent biological replicates.
Figure 6 with 1 supplement
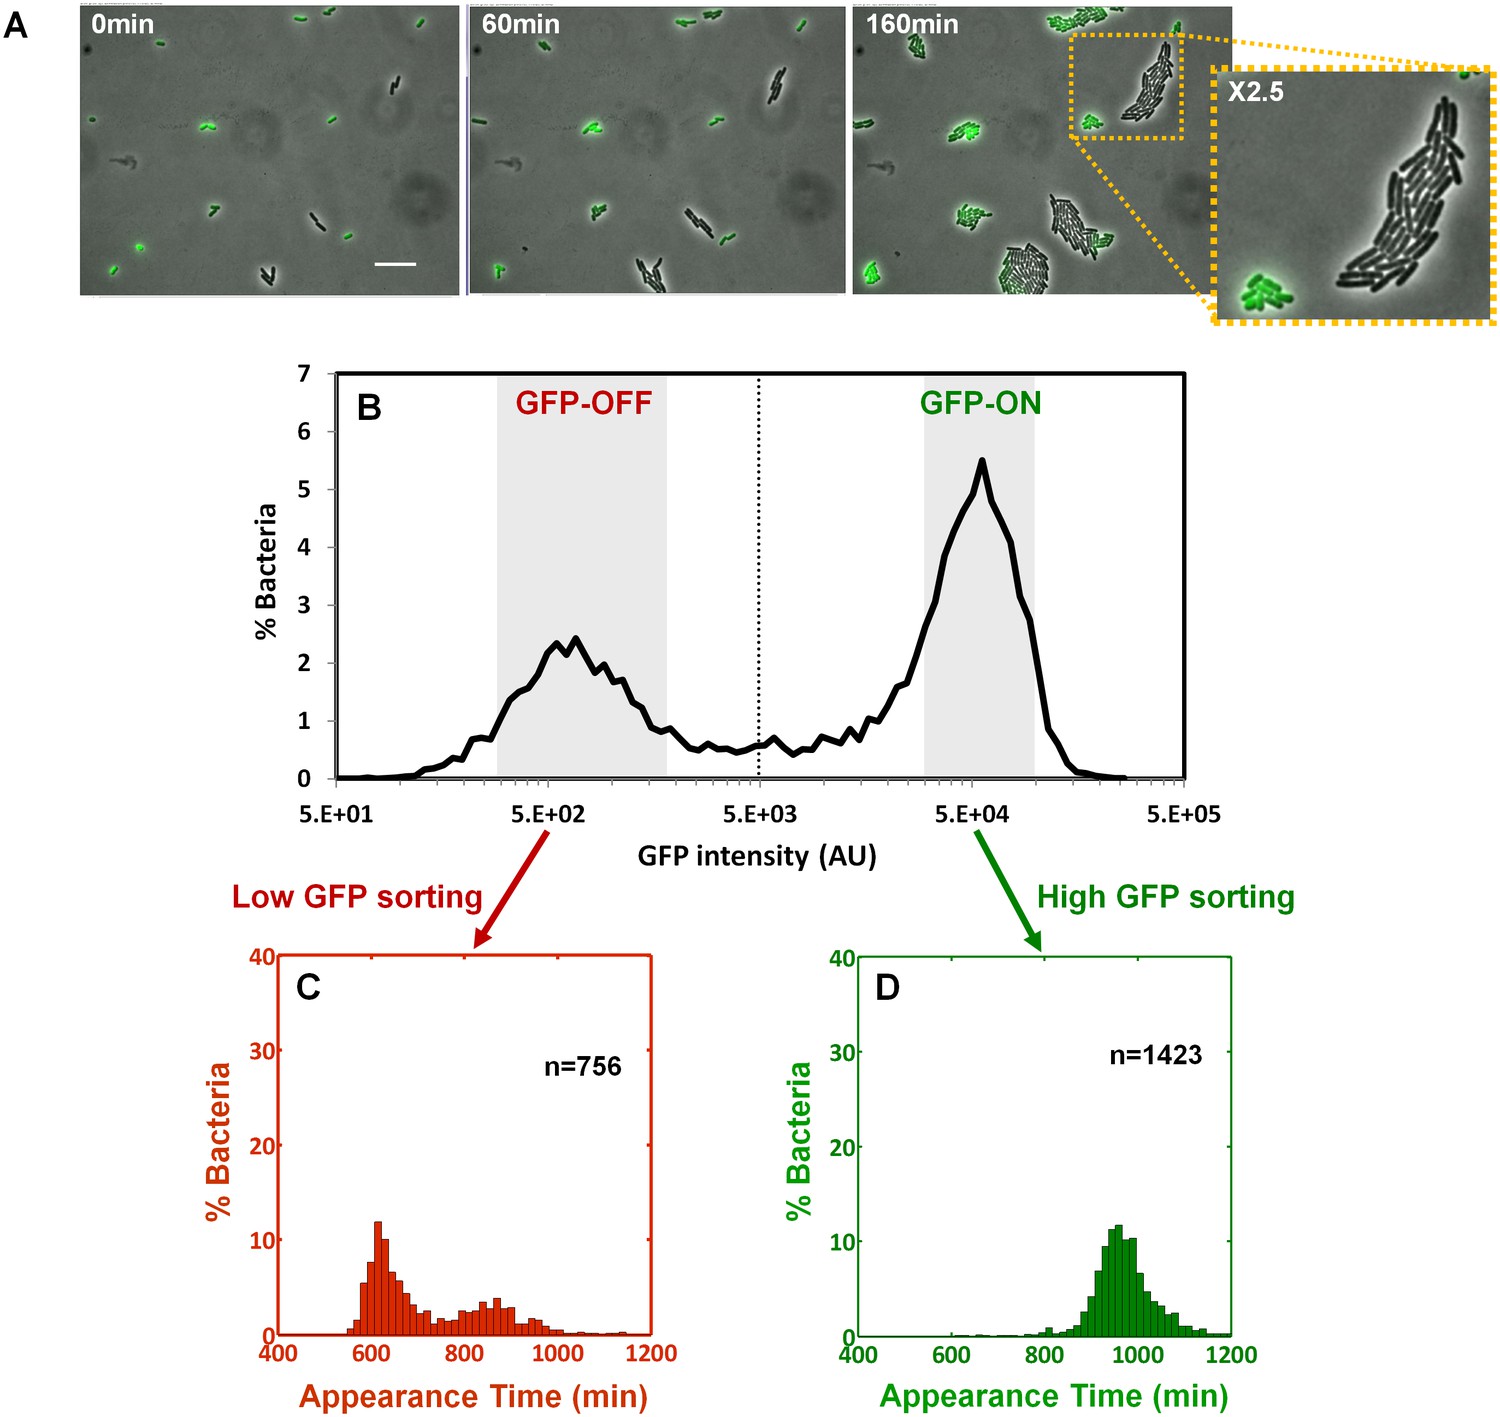
Bimodality of perABC expression during activation underlies colony-size bimodality.
EPEC ΔperA containing the plasmid pPerABC-GFP was grown under activating conditions. (A) Time-lapse microscopy of the activated ΔperA/ pPerABC-GFP under non-activating conditions (i.e. on LB-agar pads, at 32°C) Scale bar: 15 μm. (B) Flow cytometry analysis (t = 0 min) for levels of GFP in the cells (n = 10000 bacteria). Time points are indicated. Similar results were obtained in at least five different locations and in two independent biological replicates. (C–D) Sorted fractions of perABC GFP-ON and GFP-OFF (from B) populations were plated under non-activating conditions and analyzed by ScanLag. Histograms show appearance time of sorted (C) GFP-OFF and (D) GFP-ON subpopulations. (B–D) Experiments were repeated in at least two independent biological replicates.
Figure 6—figure supplement 1
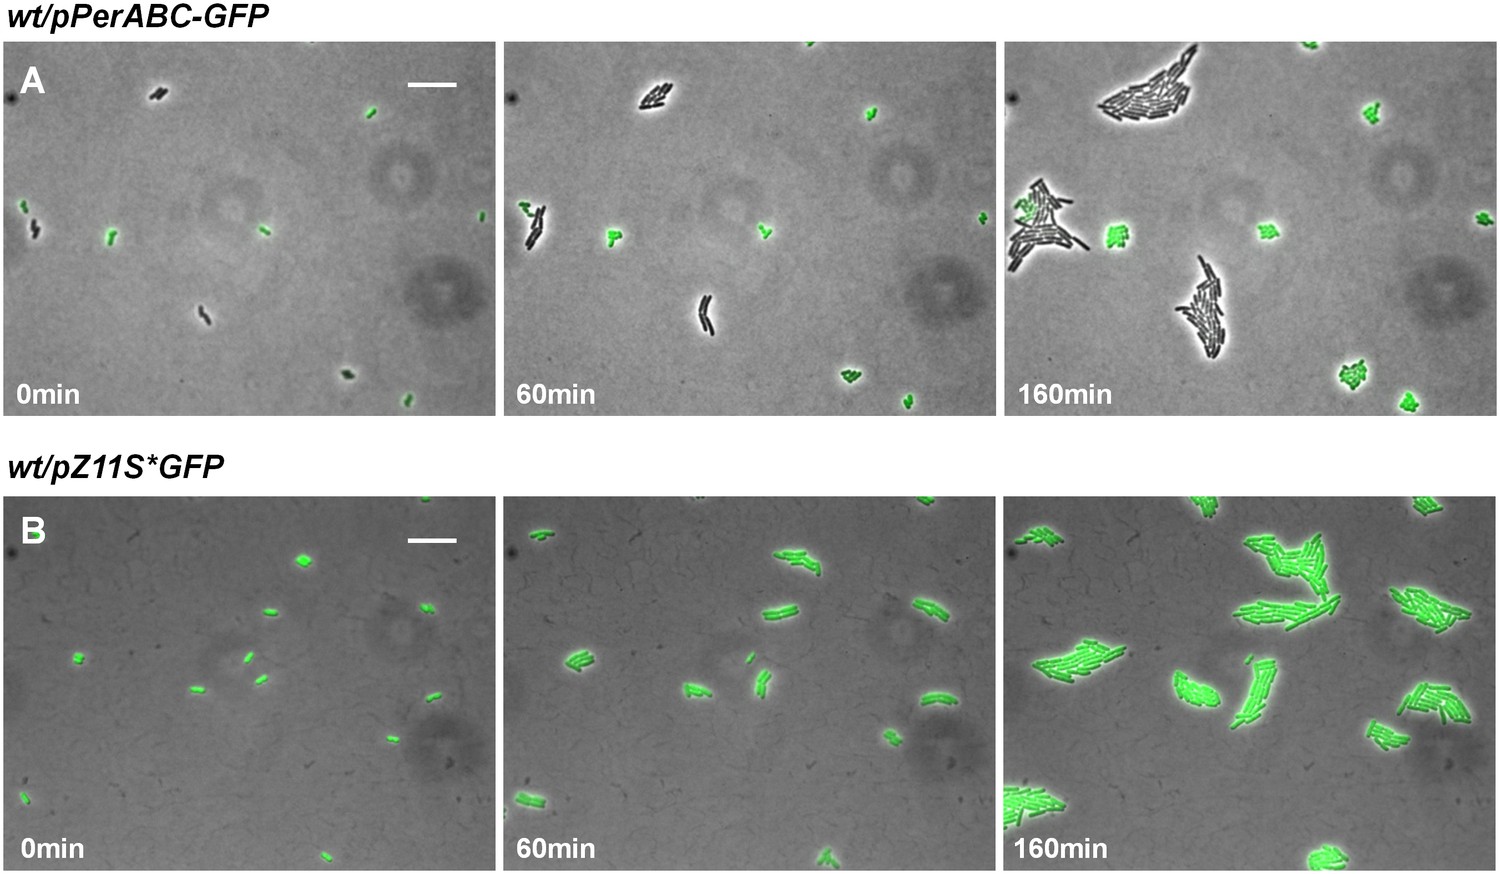
Expression of perABC in wild-type EPEC during activation.
(A) Expression of perABC in a wild-type EPEC population grown in activating conditions was analyzed using a transcriptional GFP reporter for perABC (wt/pPerABC-GFP). Activated culture was placed on LB agar pads (non-activating conditions. i.e. LB agar at 32°C) and analyzed by time-lapse microscopy. Similar results were obtained in at least five different locations and in two independent biological replicates. (B) A wild type EPEC control strain, containing a plasmid expressing GFP from PLtetO-1 promoter (wt/ pZS11*GFP) did not display bimodal GFP expression under the same conditions. Similar results were obtained in at least five technical replicates. Scale bars: 15 μm.
Figure 7 with 1 supplement

Ler expression is unimodal during activation but becomes bimodal when cells are shifted to non-activating conditions.
EPEC ler-gfp was grown under activating conditions. (A) Flow cytometry analysis (t = 0 min) shows unimodal GFP (Ler-ON state) expression (n = 10000). (B) Time-lapse microscopy during growth under non-activating at indicated times. Scale bar: 15 μm. (C–D) Quantification of GFP levels from the images shown in panel (B). Similar results were obtained in at least five different locations and in two independent biological replicates.
Figure 7—figure supplement 1
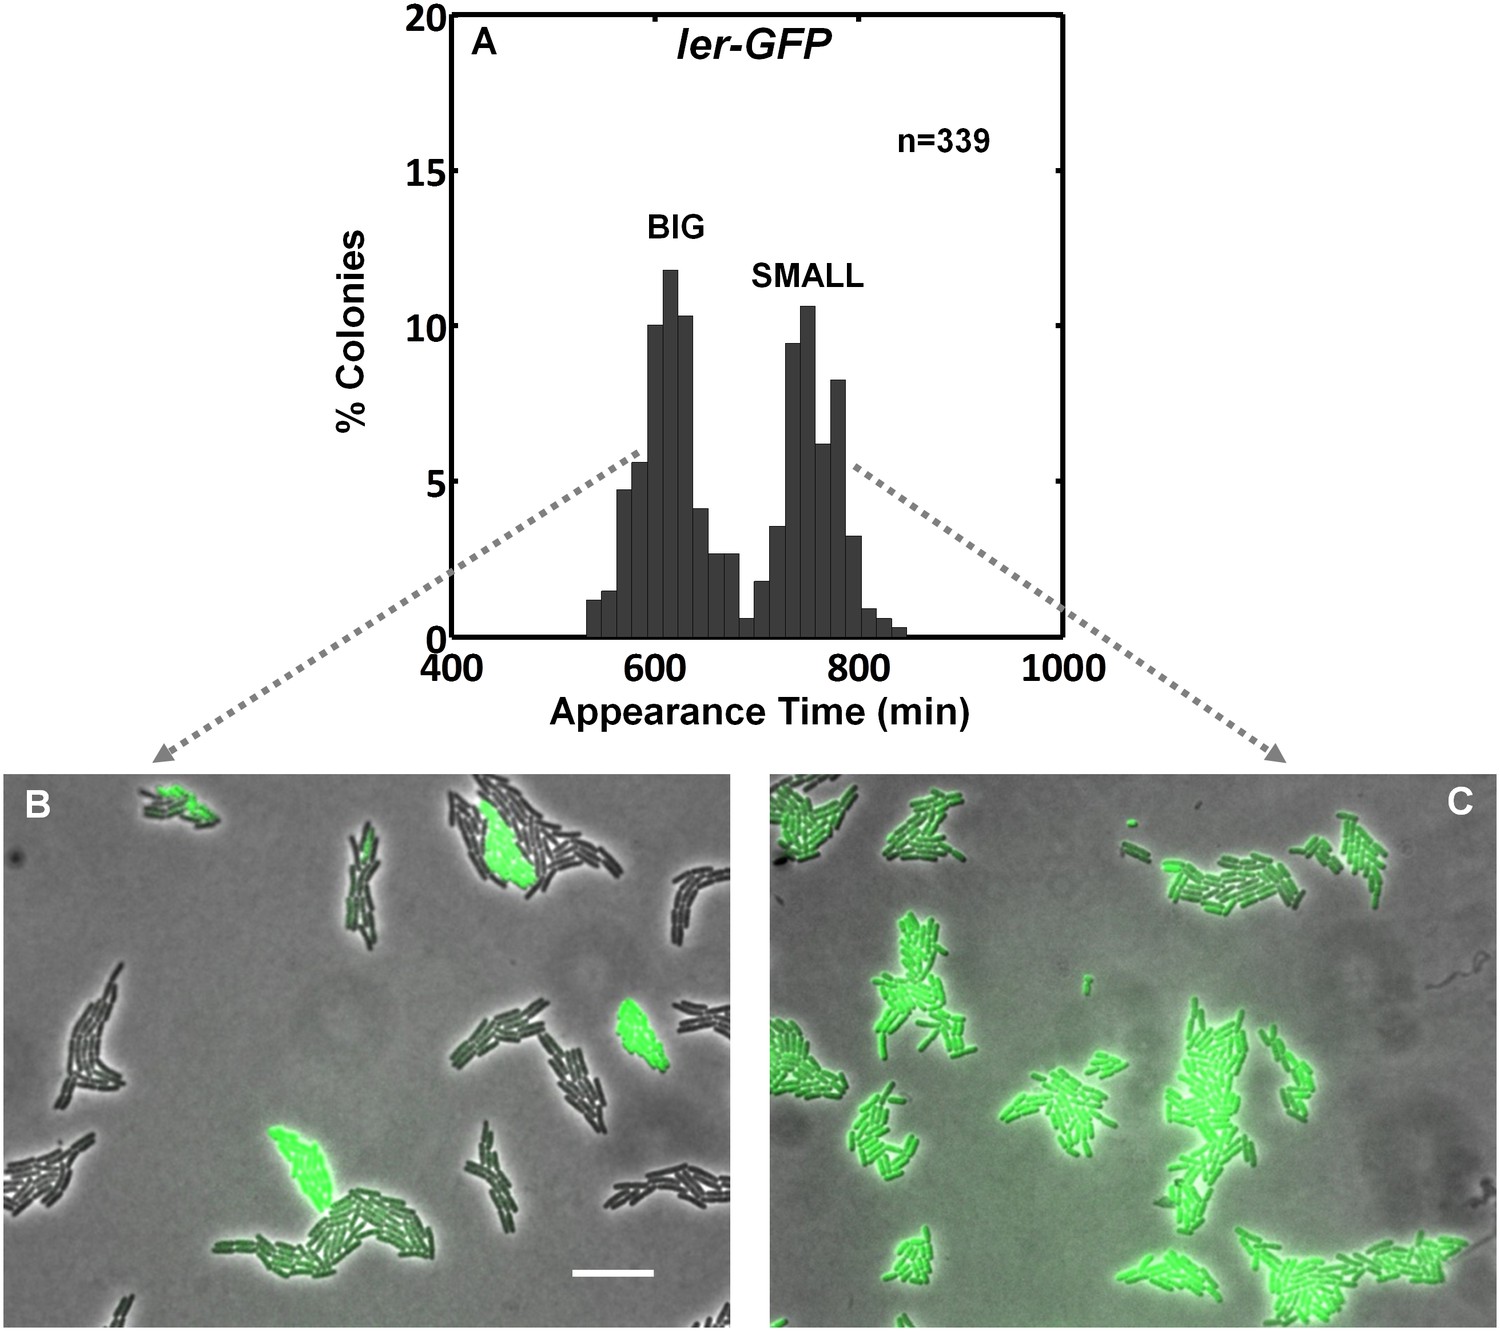
Ler is differentially expressed in BIG and SMALL colony morphotypes.
(A) EPEC containing a chromosomal ler-gfp fusion was grown for 3 hr in DMEM at 37°C and plated on LB agar at 32°C. ScanLag analysis and colony appearance time was monitored and plotted. (B) BIG and (C) SMALL colonies of ler-gfp EPEC were picked separately after 1000 min, suspended in LB, re-plated on LB agar pads (non-activating conditions. i.e. LB agar at 32°C), and time-lapse microscopy was used to measure the ler-gfp expression during 3 hr of growth. GFP, reflecting ler expression, in bacteria that originated from a SMALL morphotype colony is uniformly high but is bimodal in the bacteria that originated from a BIG morphotype colony. Similar results were obtained in at least five different locations and in two independent biological replicates. Scale bar: 15 μm.
Figure 8 with 1 supplement
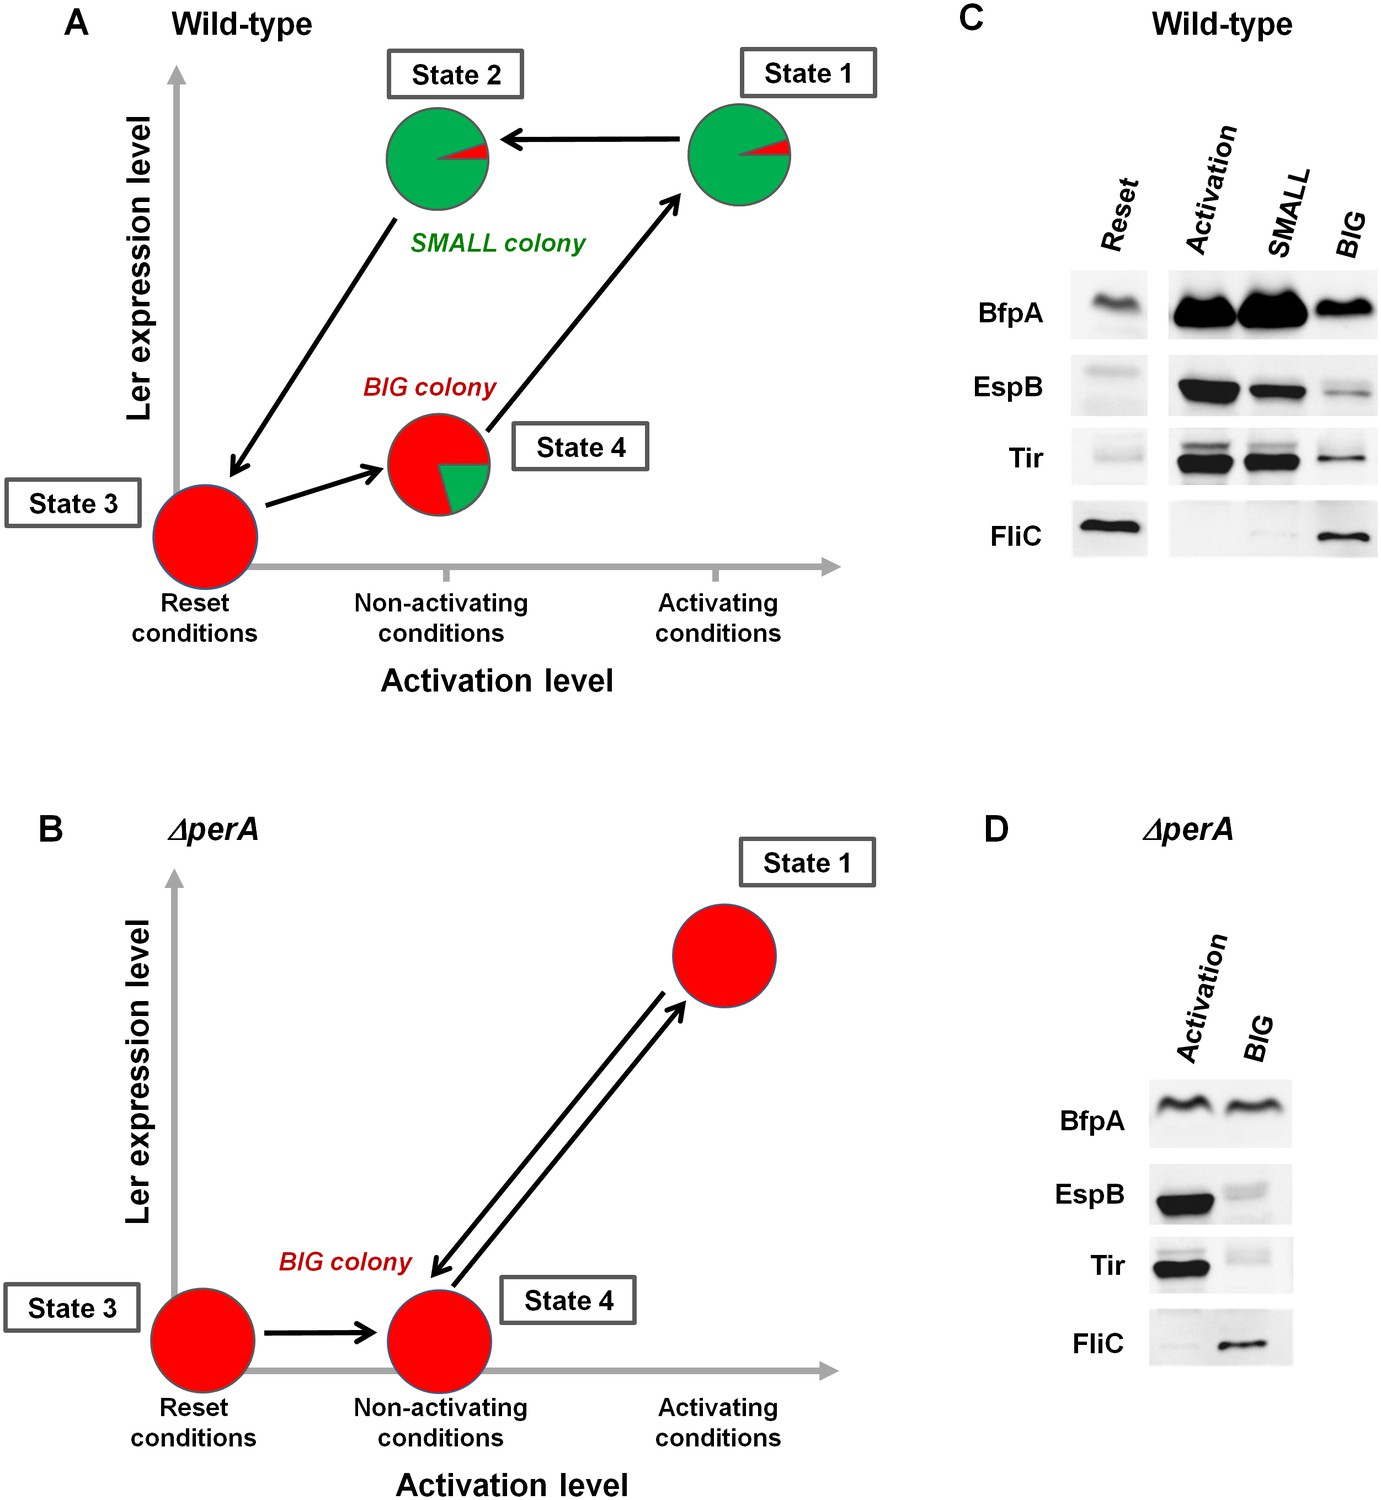
PerABC maintains long-term memory through a hysteretic switch.
(A) Scheme of the hysteretic switch in wild-type EPEC. Subjecting a culture to activating conditions for several hours results in a majority of SMALL bacteria (green) (State 1) (Figure 3B). Even when transferred to non-activating conditions, the SMALL bacteria maintain their phenotype (State 2), unless subjected to stationary phase conditions results in BIG (red) colonies (State3, ‘Reset’). Growth under non-activating conditions maintains a majority of the BIG phenotype (State 4). Shifting again to activating conditions regenerates the SMALL phenotype (State 1). (B) Deletion of perA abolishes the hysteretic switch but does not prevent ler activation. (C) Western blot analysis of proteins extracted from wild-type EPEC in the different states defined in (A) using antibodies raised against BfpA, EspB, Tir, and FliCH6. The following conditions were used: Reset: LB overnight culture (State3); Activation (State1); SMALL colony (State2); BIG colony (State 4). (D) Western blot analysis of proteins extracted from EPEC ΔperA grown in Activation (State 1) and BIG colony (State 4). (C,D) Similar results were obtained in at least two independent biological replicates.
Figure 8—figure supplement 1
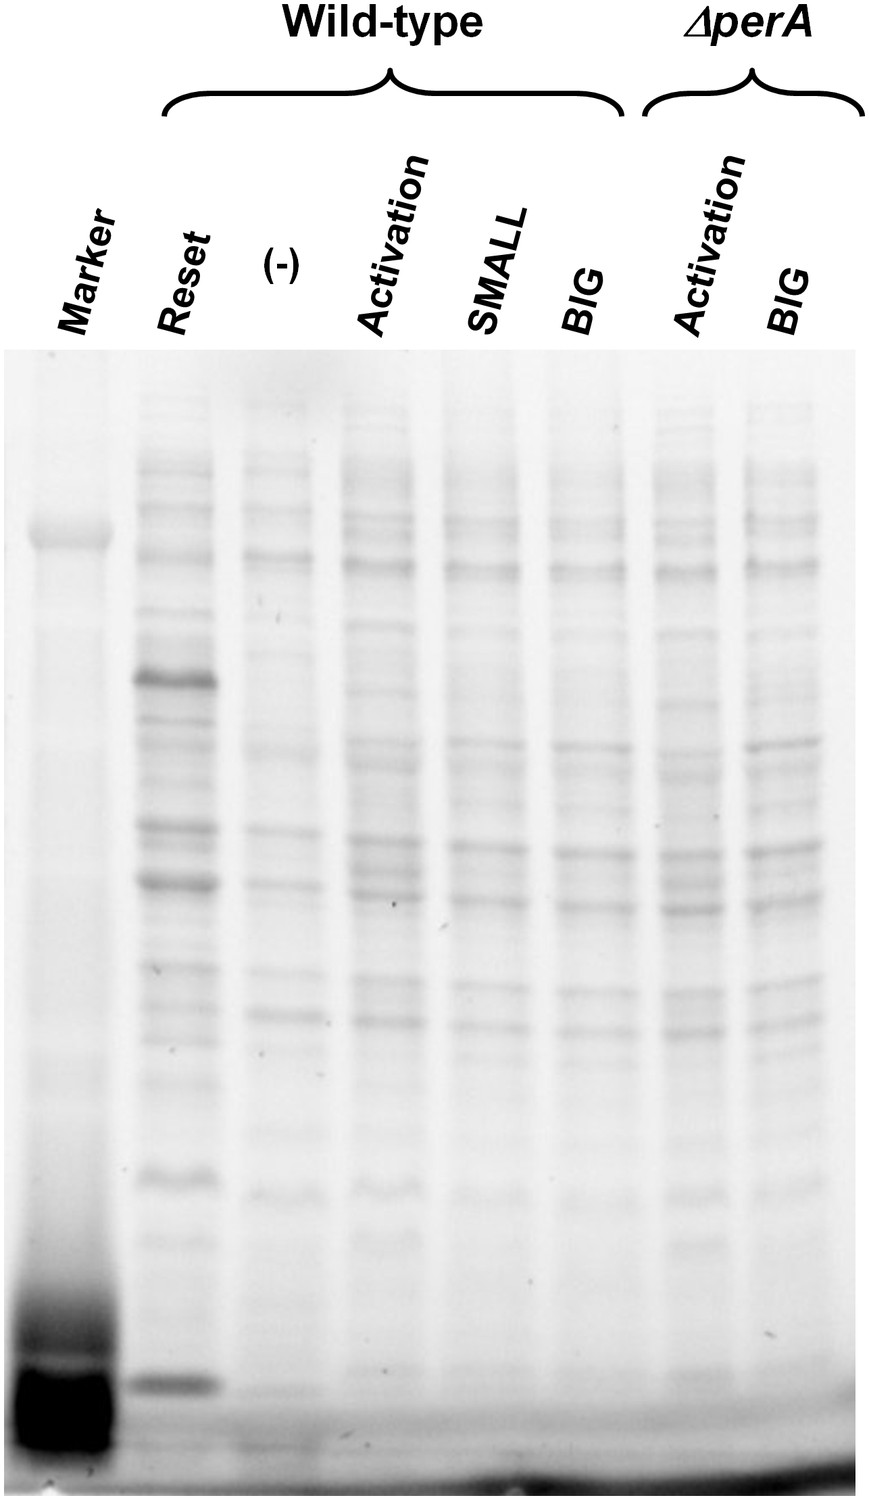
Loading control of proteins for Western blot analysis.
Total protein analysis of Stain-Free Precast Gels (Bio-Rad) was used as loading control. Same gel was used for protein transfer to membrane and following Western blot procedure (Figure 8). Lane (−) was not used in this experiment.
Figure 9 with 3 supplements
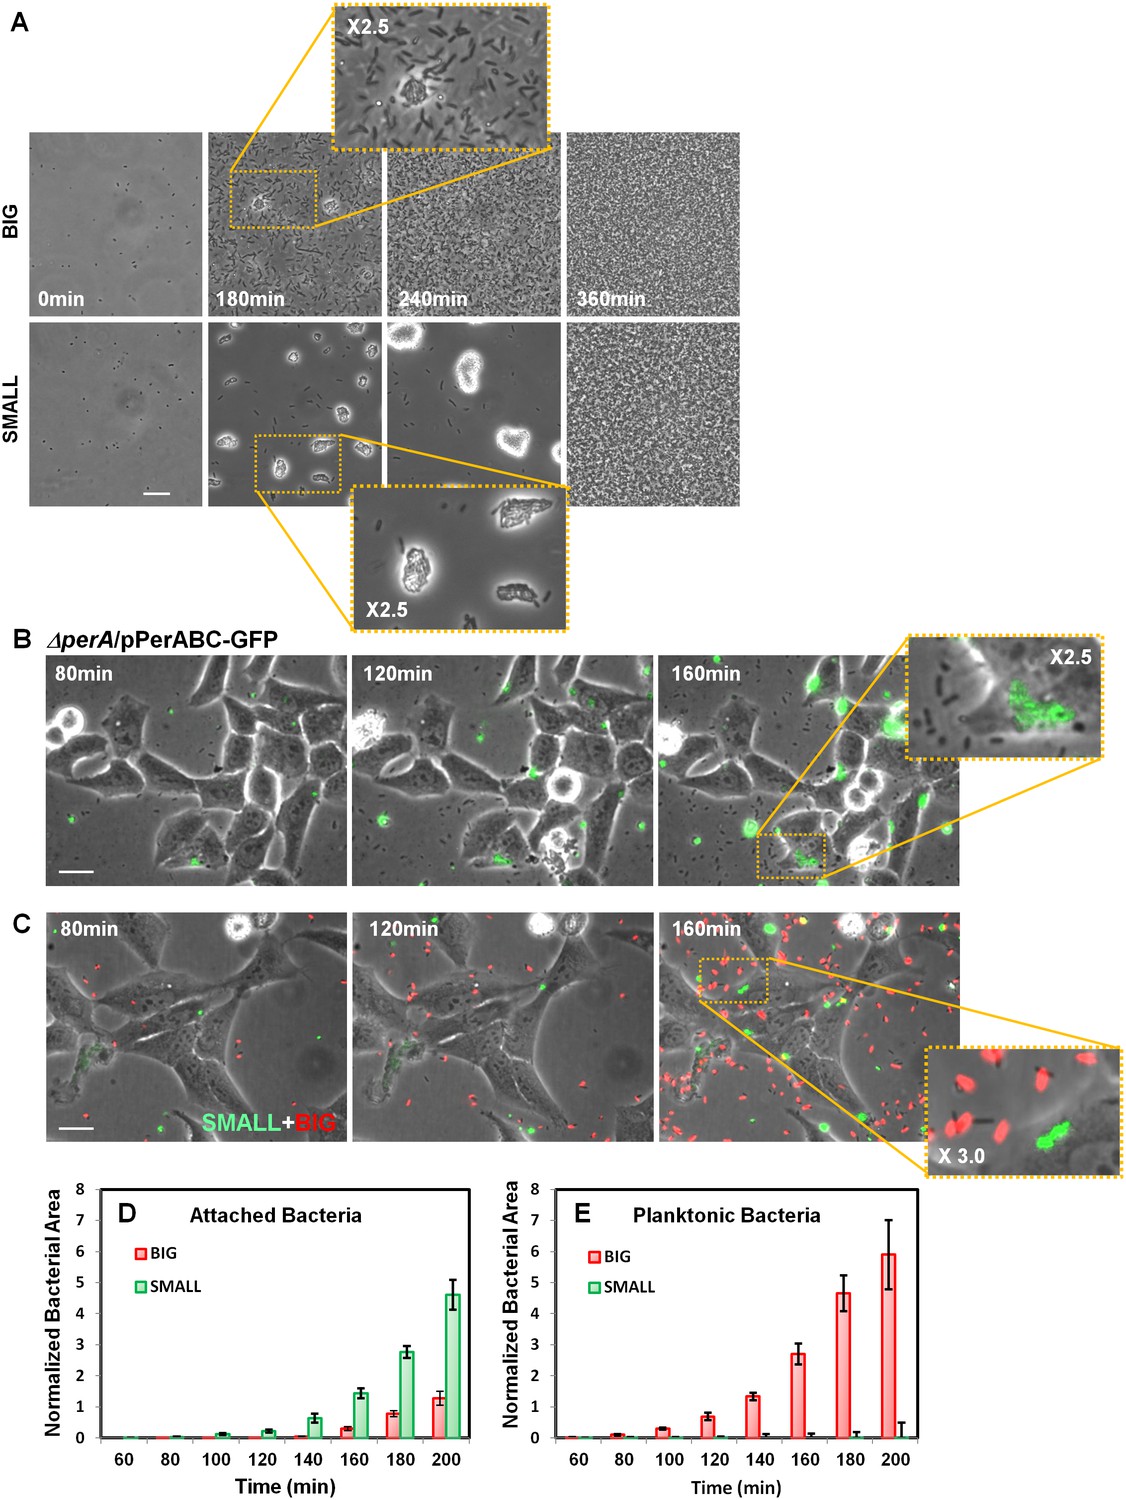
Bimodal perABC expression correlates with bimodality in microcolony formation and host cell attachment.
(A) Phase-contrast images of the dynamics of self-aggregation observed by time-lapse microscopy of bacteria from BIG or SMALL colonies. Scale bar: 15 μm. See also Videos 1 and 2. (B) Time-lapse microscopy of HeLa cells infected with EPEC ΔperA/pPerABC-GFP. Scale bar: 25 μm. (C) Fluorescent time-lapse microscopy of HeLa cells infected with a 1:1 mixture of wild-type EPEC from BIG and SMALL colonies tagged with mCherry and YFP, respectively. Scale bar: 25 μm. Enlarged image shows SMALL bacteria attached to the Hela cells whereas the BIG bacteria are planktonic resulting in a shift between phase-contrast and red fluorescent image. (D, E) Quantification of (D) attached and (E) planktonic bacteria in images taken from (C). The area of bacteria was determined based on fluorescent signal. The attached bacteria area was normalized to the total area of HeLa cells in the frame. Planktonic bacteria area was normalized to the area free of cells. Data are presented as the means ± s.d. of 6 frames. The experiment was repeated three times. See also Videos 3 and 4. Similar results were obtained in at least five different locations and in two independent biological replicates.
Figure 9—figure supplement 1
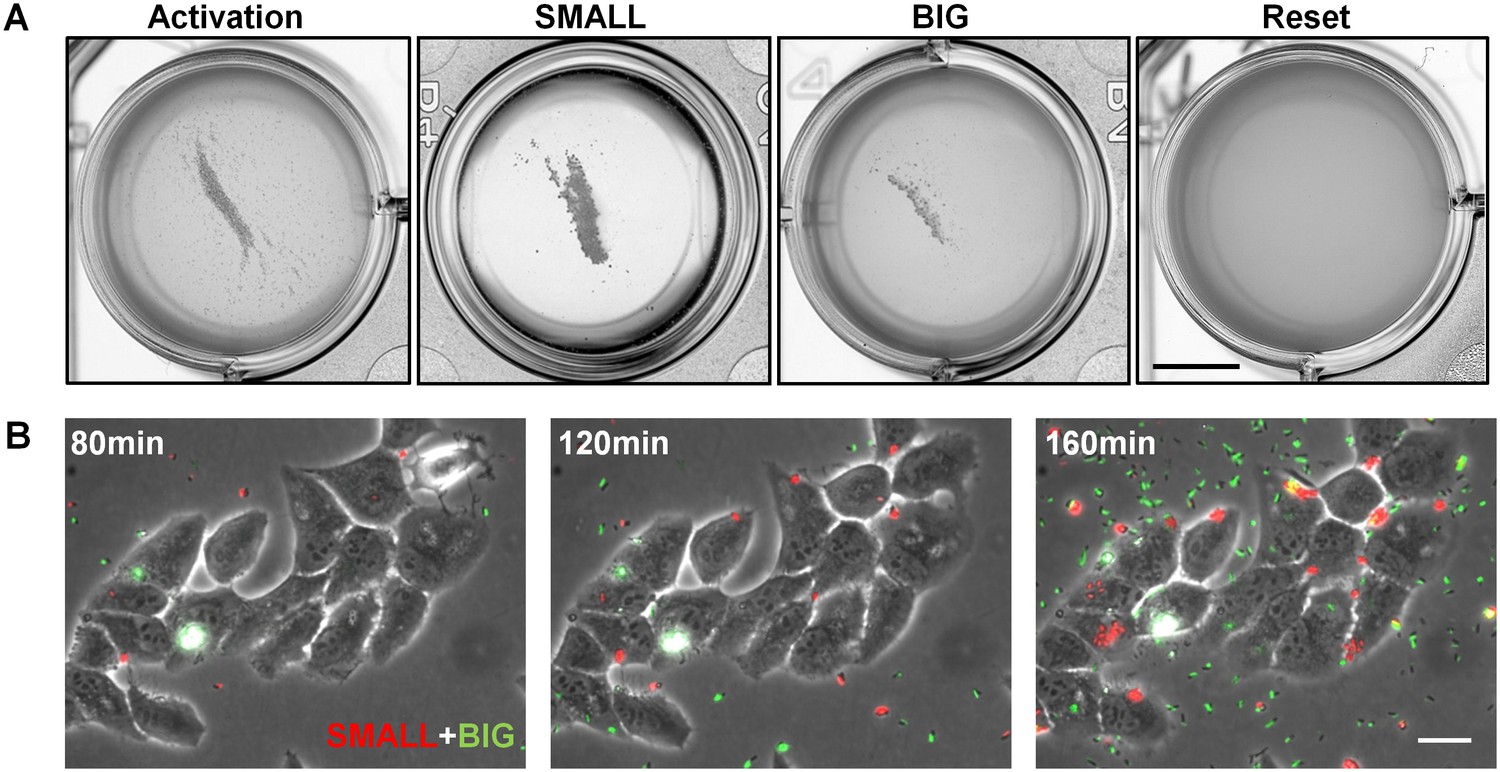
Bacteria from SMALL colonies have enhanced self-aggregation properties in liquid culture and increased formation of microcolonies on host cells.
(A) BFP-related aggregation observed directly in EPEC cultures. EPEC bacteria from different conditions were diluted in LB to ~107 bacteria/ml and grown under non-activating conditions. Images were acquired with a scanner. The following cultures were used for inoculation: EPEC culture grown in DMEM for 3 hr at 37°C (Activated), bacteria from suspended SMALL, or BIG colonies (SMALL and BIG respectively), EPEC grown in LB to stationary phase at 37°C (Reset). Note the low turbidity reflecting the absence of planktonic bacteria only in the SMALL well. Scale bar: 4 mm. Similar results were obtained in at least two independent biological replicates. (B) Fluorescent time-lapse microscopy of HeLa cells infected with a 1:1 mixture of wild-type EPEC from BIG and SMALL colonies tagged with YFP and mCherry, respectively (this tagging is the opposite of that in Figure 9B). Similar results were obtained in at least five different locations and in two independent biological replicates. Scale bar: 25 μm.
Figure 9—figure supplement 2
Bacteria from SMALL colonies induce massive pedestal formation during HeLa infection.
HeLa cells were infected for 2 hr with different inoculums of ler-GFP EPEC (green). The following cultures were used: EPEC culture grown in DMEM for 3 hr at 37°C (activated), and bacteria from suspended SMALL, or BIG, colonies (SMALL and BIG respectively). Infected cells were fixed and stained for actin (phalloidin rhodamine-red) and DNA (DAPI-blue). Experiments were carried out in duplicate and representative images are shown. Similar results were obtained in two technical replicates. Scale bar: 20 µm.
Figure 9—figure supplement 3

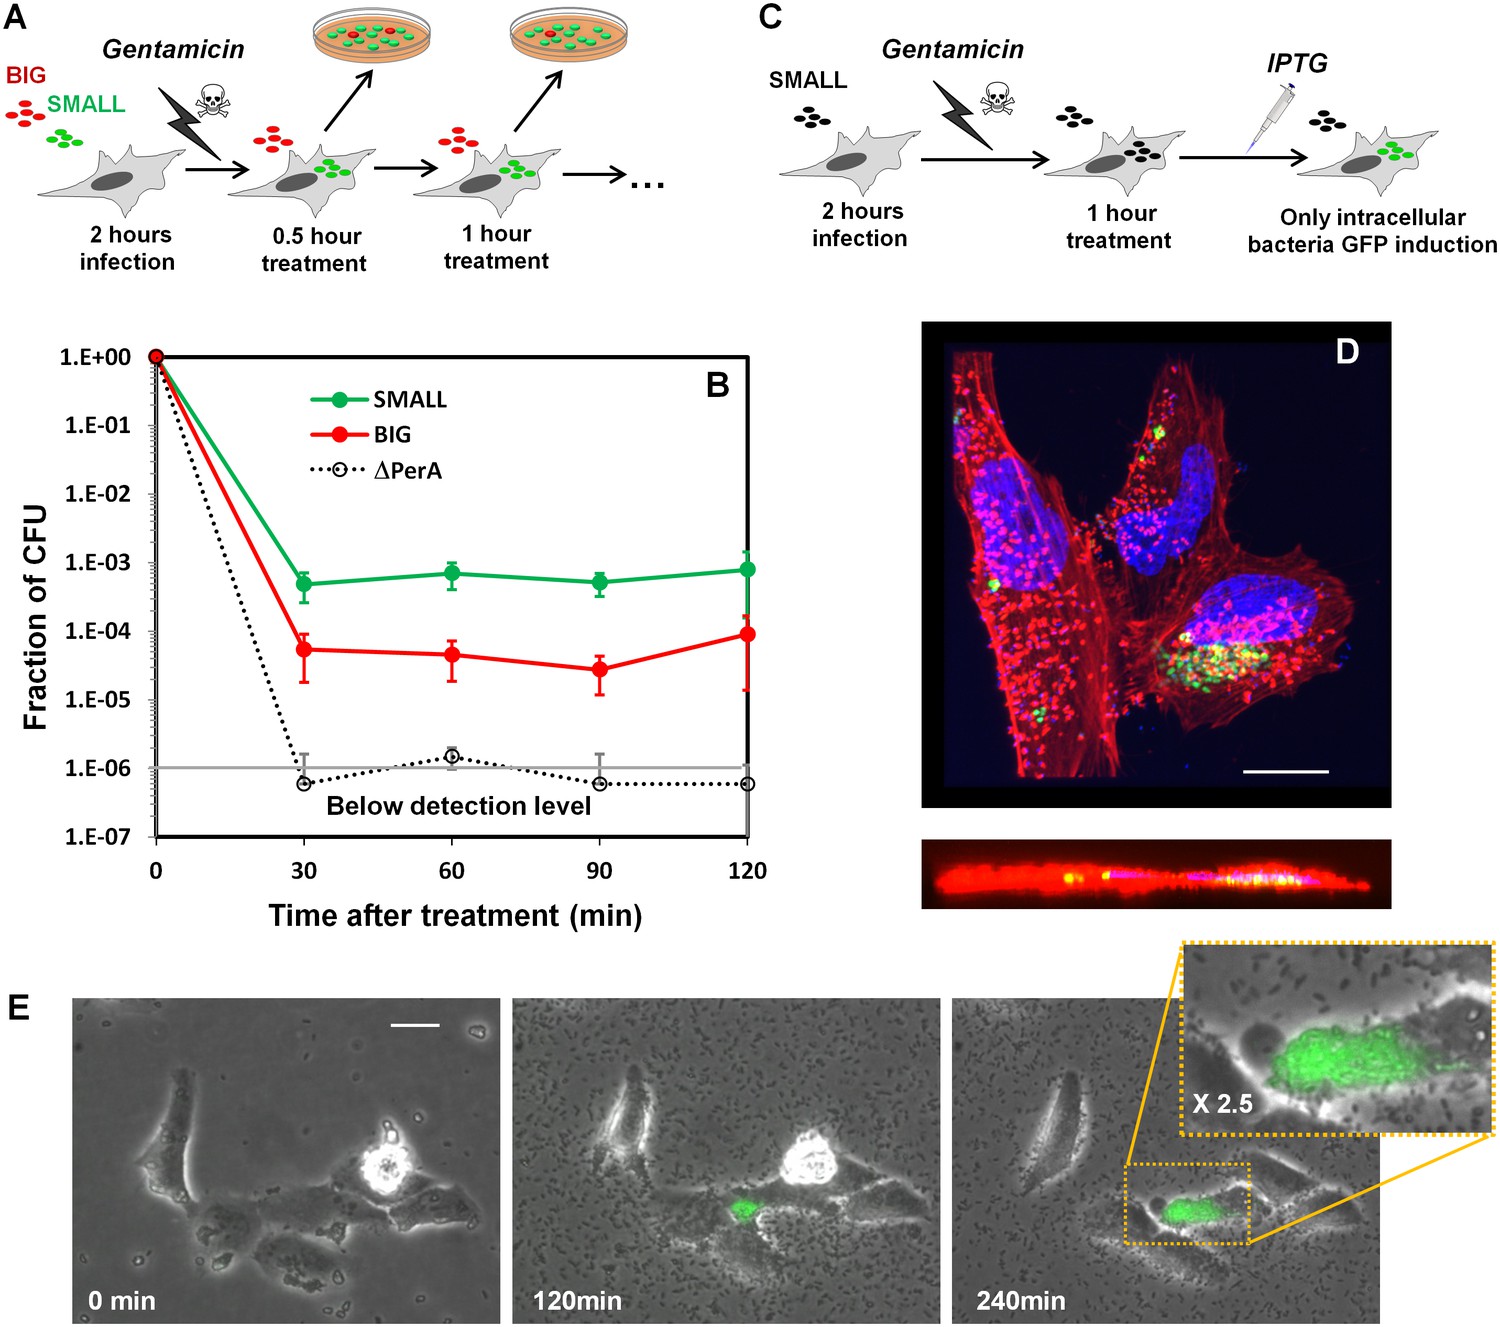
Invasion of HeLa cells by EPEC from SMALL and BIG colonies.
(A) Schematic illustration of gentamicin protection assay of HeLa cells infected with a 1:1 mixture of wild-type EPEC from SMALL and BIG colonies tagged with GFP and mCherry, respectively. (B) Plot of the results of the gentamicin protection assay for wild-type EPEC bacteria and for the ΔperA mutant. Data were normalized to initial CFU (t = 0 min) and are presented as the means ± s.d. of at least three technical repeats. (C) Schematic illustration of the microscopy-based gentamicin invasion assay together with induction dynamics. Induction of GFP fluorescence by IPTG 1 hr after gentamcin treatment enables the visualization of only live intracellular bacteria. (D) Confocal images (top and side views) of intracellular bacteria expressing GFP using the protocol described in (C). HeLa cells were fixed and stained for actin (red) and DNA (blue). Scale bar: 10 μm. (E) Time-lapse microscopy of HeLa cells infected according to the protocol shown in (C) showing growth of intracellular bacteria. Overlay of phase contrast and green fluorescence images are shown. Similar results were obtained in at least three different locations and in three independent biological replicates. Scale bar: 25 μm.
Videos
Video 1
Dynamics of self-aggregation observed by time-lapse microscopy in BIG bacteria.
Bacteria were resuspended from a BIG colony and placed on a wet LB agarose pad for imaging bacteria in suspension. Bacteria divide and remain mostly planktonic.
Video 2
The dynamics of self-aggregation observed by time-lapse microscopy in SMALL bacteria.
Bacteria were resuspended from a SMALL colony and placed on a wet LB agarose pad for imaging bacteria in suspension. Bacteria divide and aggregate continuously until they reach stationary phase, which results in the disintegration of the aggregates.
Video 3
Dynamics of infection by SMALL (green) and BIG (red) bacteria on HeLa cells.
The SMALL bacteria form microcolonies attached to the HeLa cells, whereas the BIG bacteria remain mostly planktonic (same as Figure 9C).
Video 4
Dynamics of infection by SMALL (red) and BIG (green) bacteria on HeLa cells.
The SMALL bacteria form microcolonies attached to the HeLa cells, whereas the BIG bacteria remain mostly planktonic (same as Video 3 but with fluorescent markers opposite tagging).
Additional files
-
Supplementary file 1
Whole genome sequencing of the BIG and SMALL morphotypes.
The relative copy number was obtained by coverage analysis of the whole genome sequencing data for BIG and SMALL bacteria (Goldberg et al., 2014). The WGS analysis reveals differences in EAF plasmid copy number only and the raw data is available as NCBI BioProject PRJNA255355 (Accessions: SRX757584 and SRX757585 for SMALL and BIG respectively).
- https://doi.org/10.7554/eLife.19599.027
-
Supplementary file 2
List of strains and plasmids.
- https://doi.org/10.7554/eLife.19599.028
-
Supplementary file 3
List of primers used in this study.
- https://doi.org/10.7554/eLife.19599.029
Download links
A two-part list of links to download the article, or parts of the article, in various formats.
Downloads (link to download the article as PDF)
Open citations (links to open the citations from this article in various online reference manager services)
Cite this article (links to download the citations from this article in formats compatible with various reference manager tools)
A long-term epigenetic memory switch controls bacterial virulence bimodality
eLife 6:e19599.
https://doi.org/10.7554/eLife.19599


