Stereotyped responses of Drosophila peptidergic neuronal ensemble depend on downstream neuromodulators
- Universidad de Valparaiso, Chile
- University of Würzburg, Germany
Figures
Figure 1
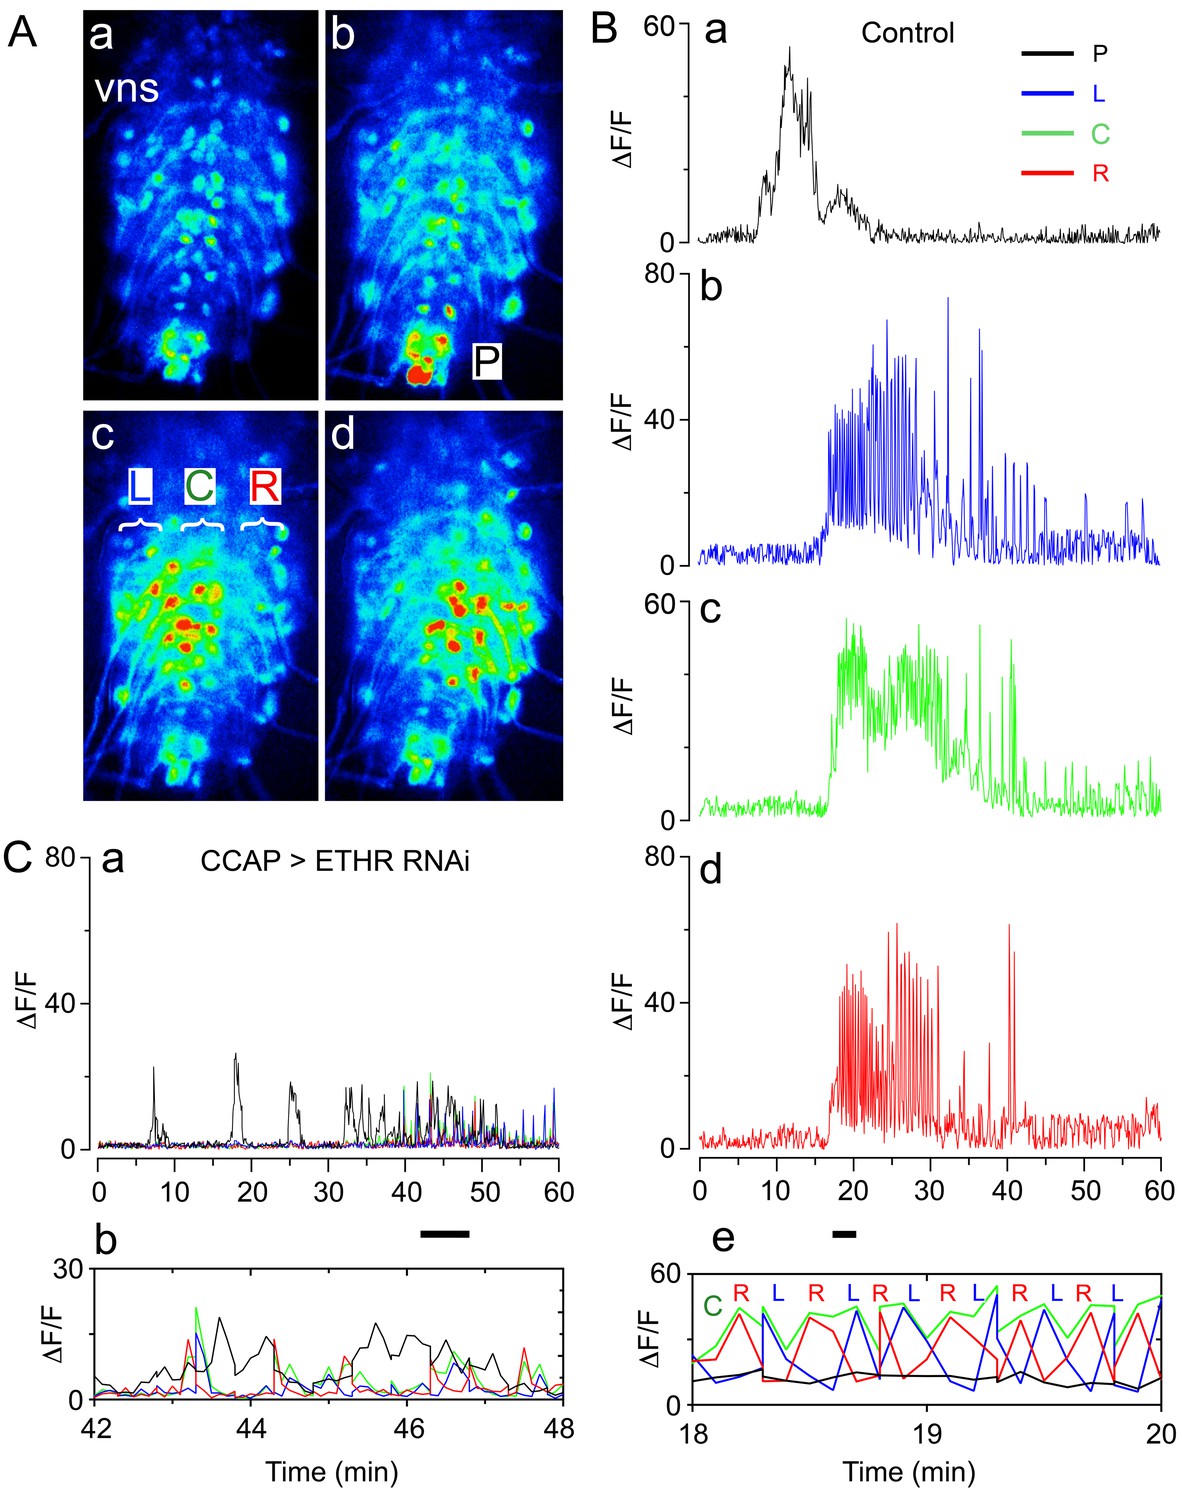
Fictive ecdysial behavior in normal and ETHR knockdown animals.
(A) Snapshots of the pattern of GCaMP signal recorded from motoneurons of control animals at 0 min (a), 10 min (b), and at around 20 min (c,d) after in vitro challenge with 600 nM ETH. (B) Corresponding recording of GCaMP signal, color-coded according to regions indicated in (Ab and Ac): (a) 'P' (posterior, black trace; cf., Ab); (b): 'L' (left, blue trace; cf., Ac); (c): 'C' (center, green trace; cf., Ac); (d) 'R' (right, red trace; cf., Ac). (e) Expanded segment of recording (recordings for 'P', 'L', 'C' and 'R' regions superimposed) during 18–20 min period (indicated by small bar beneath time axis of (d)). Note the alternating activity in 'L' and 'R' regions. (C) (a) Motoneuron activity patterns (recordings for 'P', 'L', 'C' and 'R' regions superimposed) from animals that express ETHR RNAi in CCAP neurons; (b) Expanded segment of recording shown in (a) (recordings for 'P', 'L', 'C' and 'R' regions superimposed) during 42–48 min period (indicated by small bar beneath time axis in (a)). Note that 'L' and 'R' activity no longer alternate (compare with Be). Zero min indicates time of ETH challenge in all records. Genotypes: Controls (A,B): CCAP>GCaMP (Ccap-GAL4 + UAS-GCaMP); ETHR knockdown in CCAP neurons (C): CCAP+MN>GCaMP+ETHR RNAi (MN: C164 motoneuron GAL4; see Materials and methods). Note that this genotype also knocks down ETHR expression in motoneurons (MNs). Nevertheless, knockdown of ETHR only in MNs had only a slight effect on ecdysis behavior (cf. Figure 2), suggesting that most defects observed here were due to knockdown of ETHR in CCAP neurons. In all experiments using RNAi, its effectiveness was boosted by including a UAS-dcr2 transgene.
Figure 2
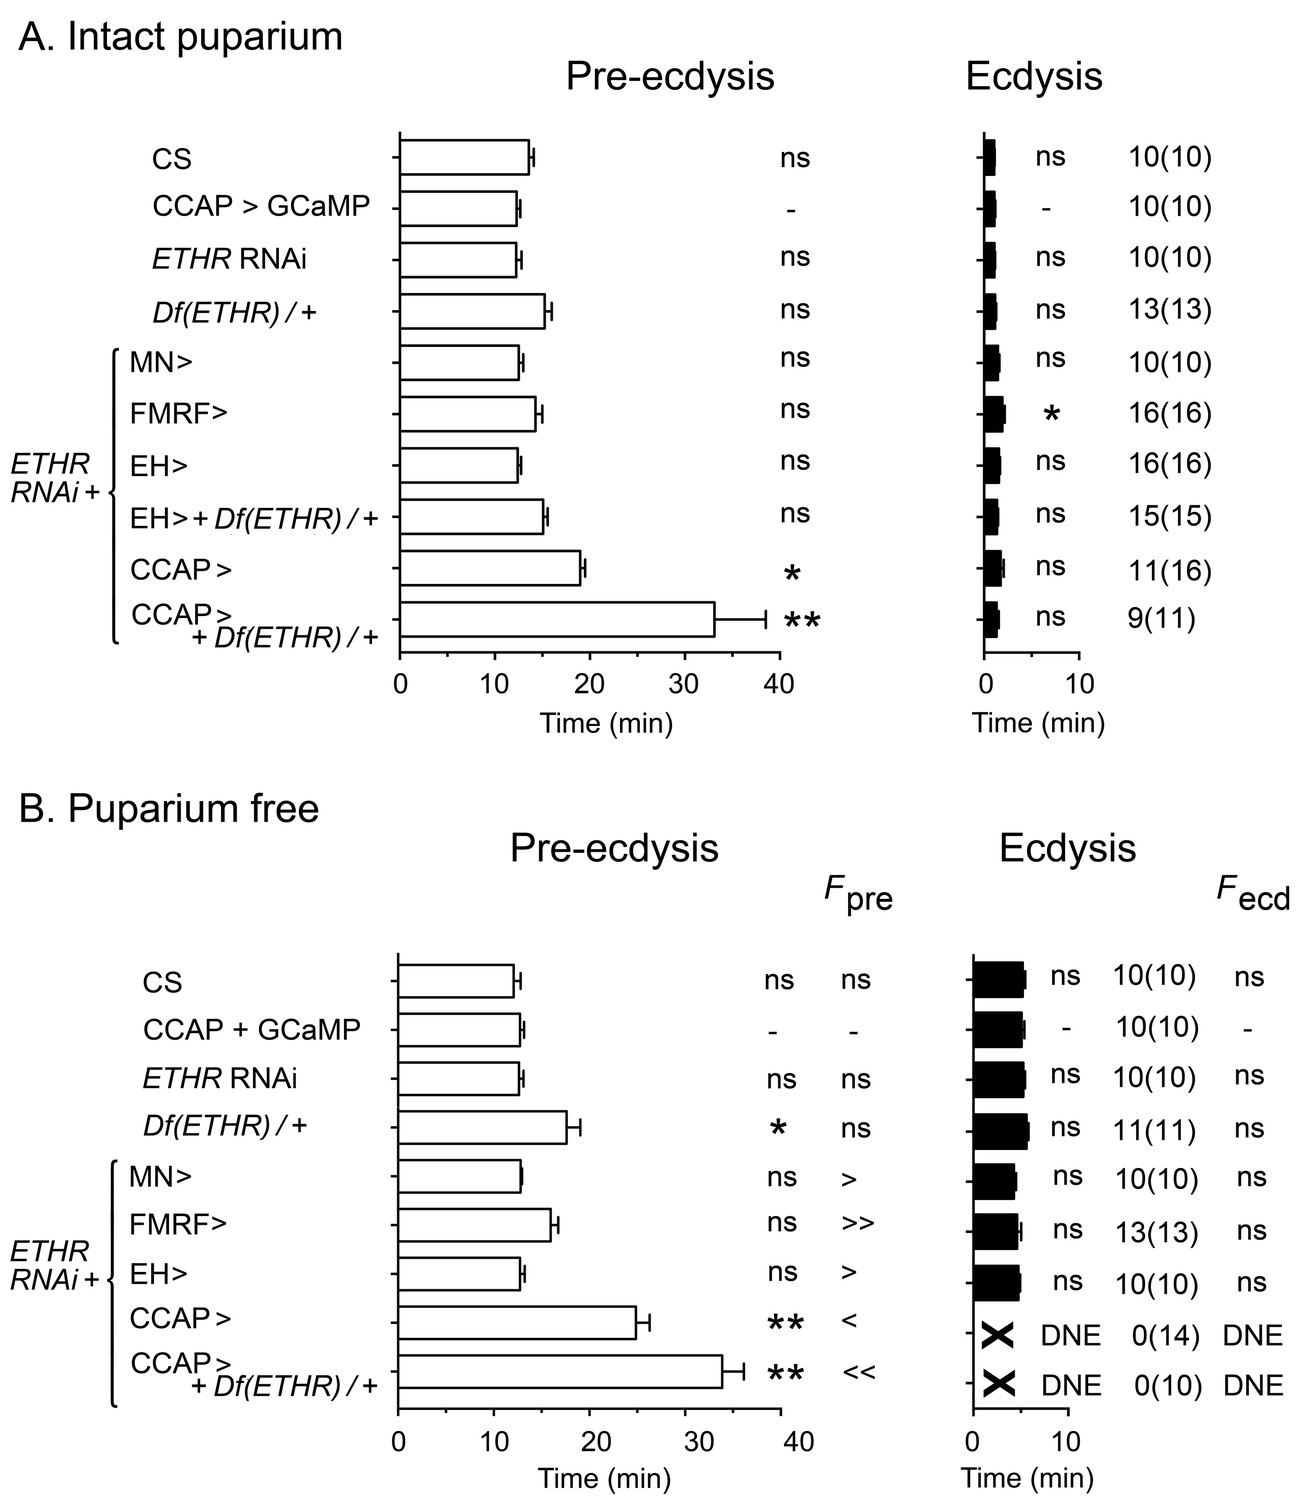
Impact on ecdysial behaviors of manipulating ETH effectiveness on downstream targets.
(A) Ecdysial behaviors in intact puparium. Duration of pre-ecdysis (left; open bars) and ecdysis (right; filled bars) in controls (CS and CCAP>GCaMP), and in animals expressing ETHR RNAi in different subsets of ETH targets. (B) Corresponding ecdysial behaviors of puparium-free preparations. Data are mean ± SEM. In (A) and (B) duration of ecdysial phases is indicated as not significantly different (‘ns') or significantly different ('*': p<0.5; '**’: p<0.01) than those of CCAP>GCaMP control (one-way ANOVA, Dunnett's post-hoc to control). Comparison of frequency of contractions per minute for pre-ecdysis and ecdysis (labeled Fpre and Fecd, respectively) in puparium-free preparations is indicated as not significantly different (‘ns') or significantly smaller ('<': p<0.05; '<<’ p<001) or greater ('>': p<0.05; '>>’ p<001) than that of CCAP>GCaMP controls (one-way ANOVA, Dunnett's post-hoc to control). Actual p values can be found in Supplementary file 1. Genotypes: all animals expressed GCaMP under control of Ccap-GAL4 (Ccap-GAL4 + UAS-GCaMP). ETHR RNAi: UAS-ETHR RNAi; Df(ETHR)/+: hemizygosity for ETHR; MN>: motoneuron GAL4 (C164; see Materials and methods). In all experiments using RNAi, its effectiveness was boosted by including a UAS-dcr2 transgene.
Figure 3 with 1 supplement
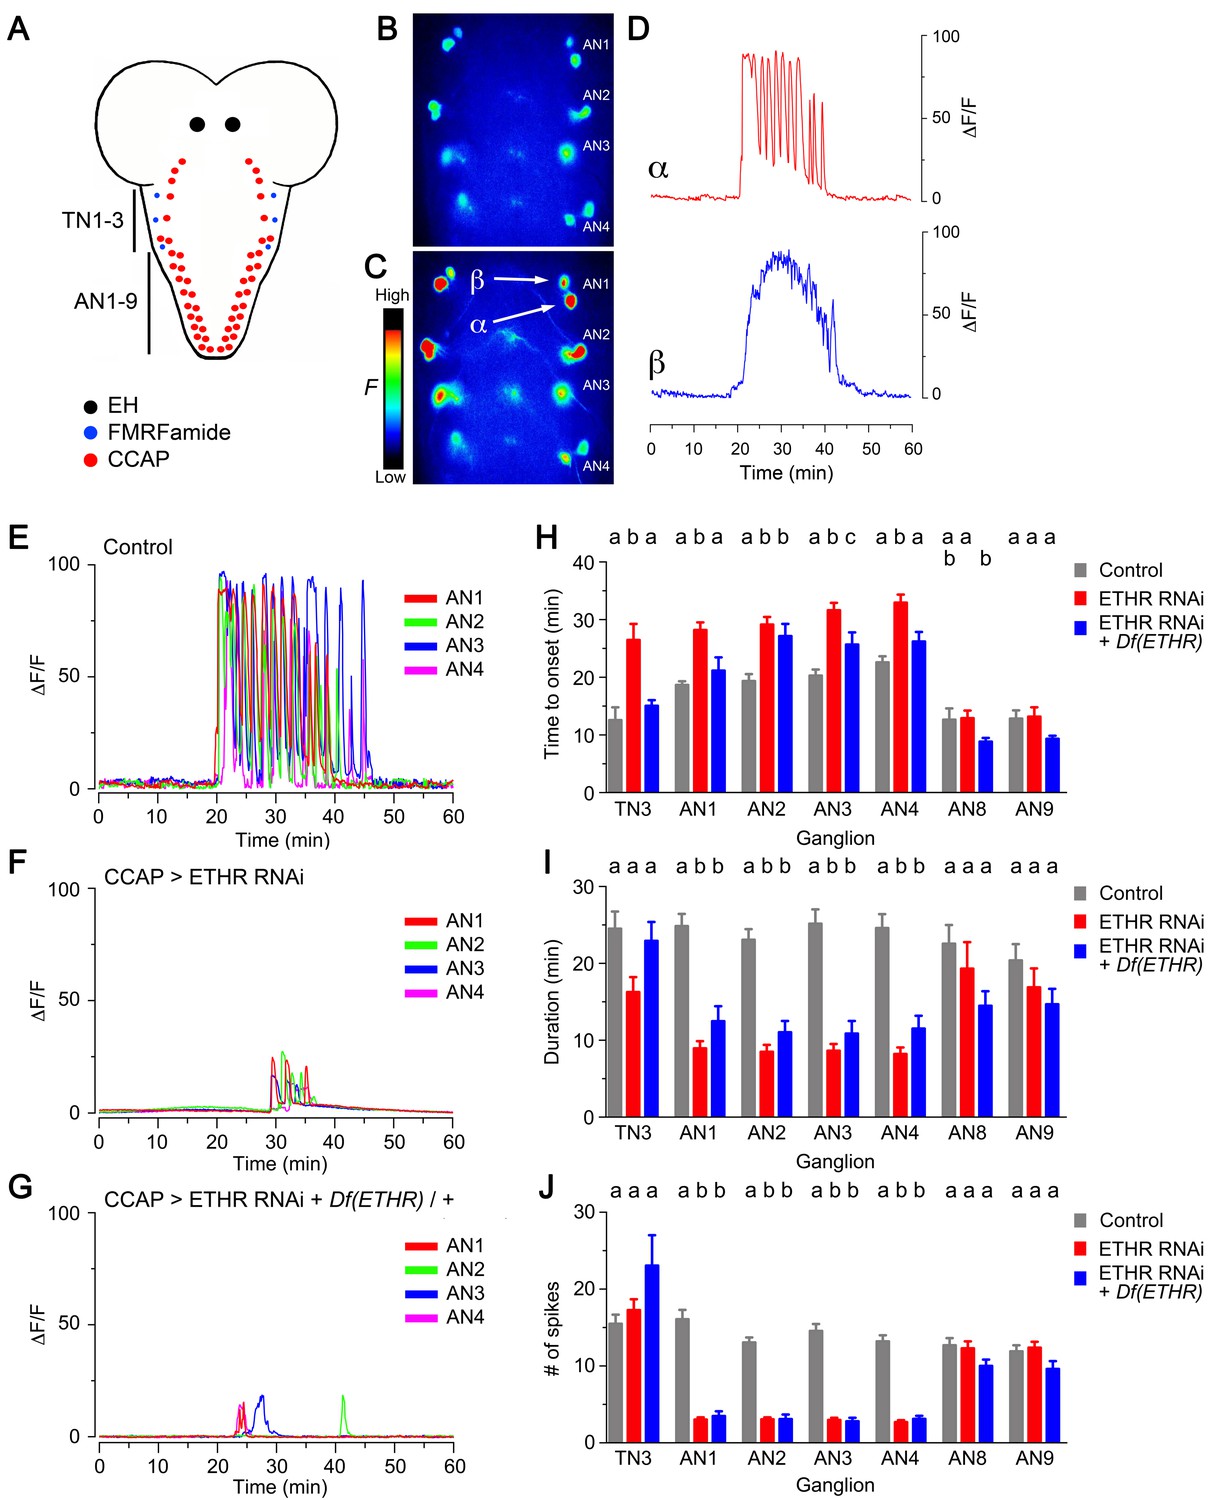
Impact on CCAP neuron activation of ETHR knockdown in CCAP neurons.
(A) Schematic of Drosophila nervous system indicating the location of EH, FMRFa, and CCAP neurons. (B–C) Snapshots of the pattern of GCaMP signal in CCAP neurons in segments AN1-4, recorded from wild-type animals at 0 min (B) and 20 min (C) after in vitro challenge with 600 nM ETH. (D) Calcium dynamics of AN1 α (top, red trace) and β (lower, blue trace) neurons (cf., 3C) after ETH challenge. (E–G) Pattern of GCaMP activity recorded from CCAP neurons AN1-4 following in vitro challenge with 600 nM ETH in wildtype CNSs (E), in CNSs expressing ETHR RNAi in CCAP neurons (F), and in CNSs of ETHR hemizygous animals expressing ETHR RNAi in CCAP neurons (G). (H–J) Quantitation of time of onset (H), duration (I), and number of spikes (J) for the different genotypes tested. TN3: thoracic ganglion 3; AN: abdominal ganglion. Zero min indicates time of ETH challenge. N = 10 preparations for all genotypes. Data are mean ± SEM. Different letters indicate statistically significant groups (p<0.05); one-way ANOVA, Tukey's post-hoc multiple comparison analyses. Actual p values can be found in Supplementary file 1. Genotypes: all animals expressed GCaMP under control of Ccap-GAL4 (Ccap-GAL4 + UAS-GCaMP); ETHR RNAi: UAS-ETHR RNAi; Df(ETHR)/+: hemizygosity for ETHR. In all experiments using RNAi, its effectiveness was boosted by including a UAS-dcr2 transgene.
Figure 3—figure supplement 1
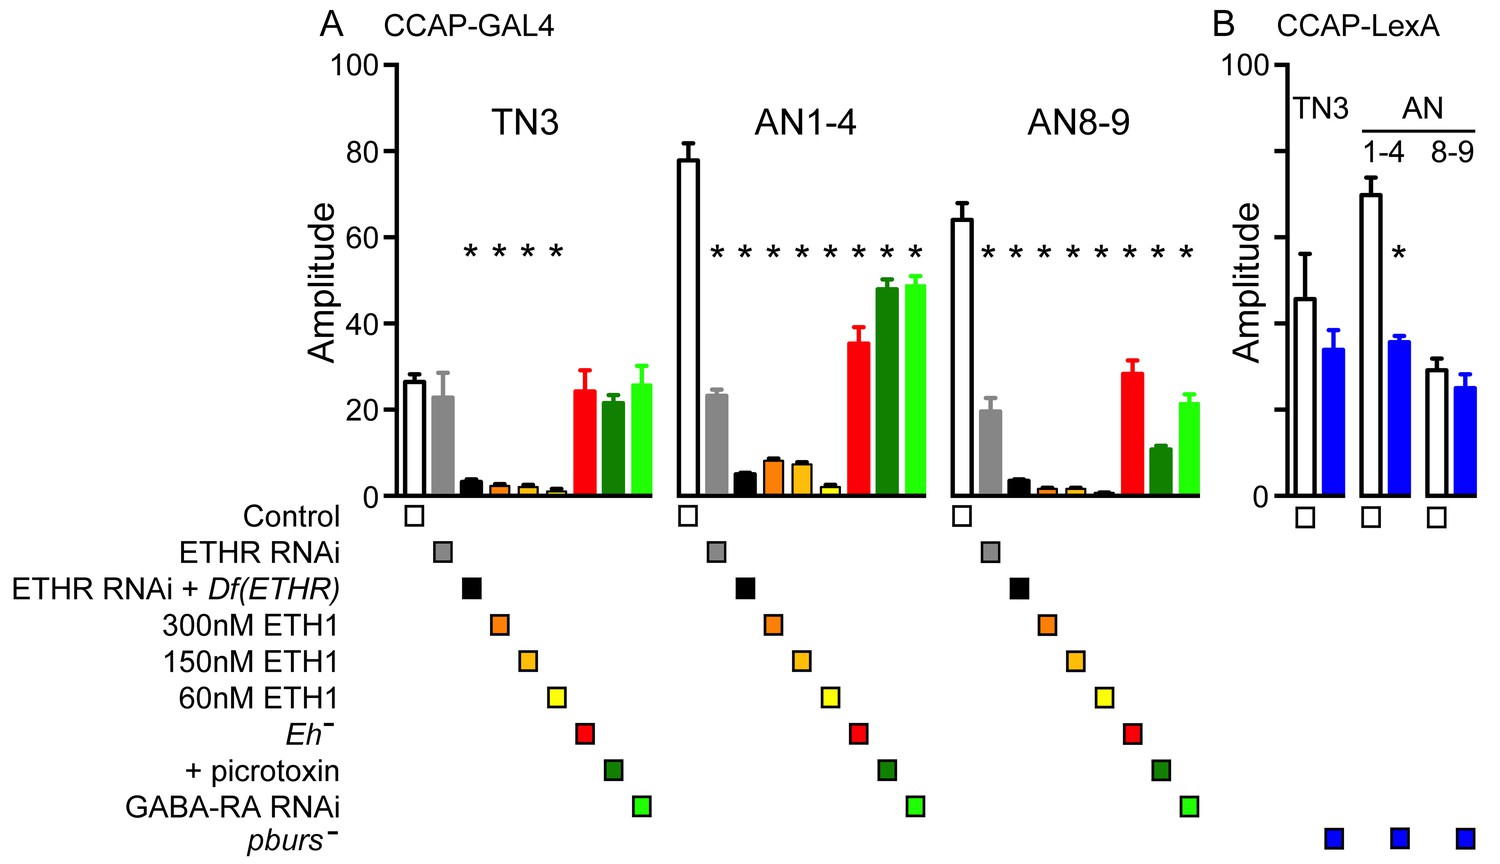
Amplitude of GCaMP response induced by ETH in CCAP neurons.
Quantitation of mean amplitude of GCaMP response to ETH of CCAP neurons in TN3, AN1-4, and AN8-9 for different genotypes and conditions (Note: some of the results shown in this figure relate to data shown in Figures 4, 5, and 7). (A) Results obtained for genotypes that used Ccap-GAL4 to drive GCaMP expression. (B) Results obtained for genotypes involving pburs mutants, for which Ccap-LexA was used to drive GCaMP expression (see Figure 6 for further details). N = 6–13 for all conditions. Data are mean ± SEM. One-way ANOVA, followed by Dunnett's post-hoc analyses to control (A) or unpaired two-tailed t test to control (B); ‘*’ p<0.05. Actual p values for all analyses can be found in Supplementary file 1. All animals expressed Ccap-GAL4+GCaMP (A) or Ccap-LexA+LexAop-GCaMP (B); Df(ETHR)/+ indicates hemizygosity for ETHR; Eh[-]: Eh[-]/Df(3)Eh; pburs[-]: pburs[-]/Df(2)pburs. In all experiments using RNAi, its effectiveness was boosted by including a UAS-dcr2 transgene.
Figure 4
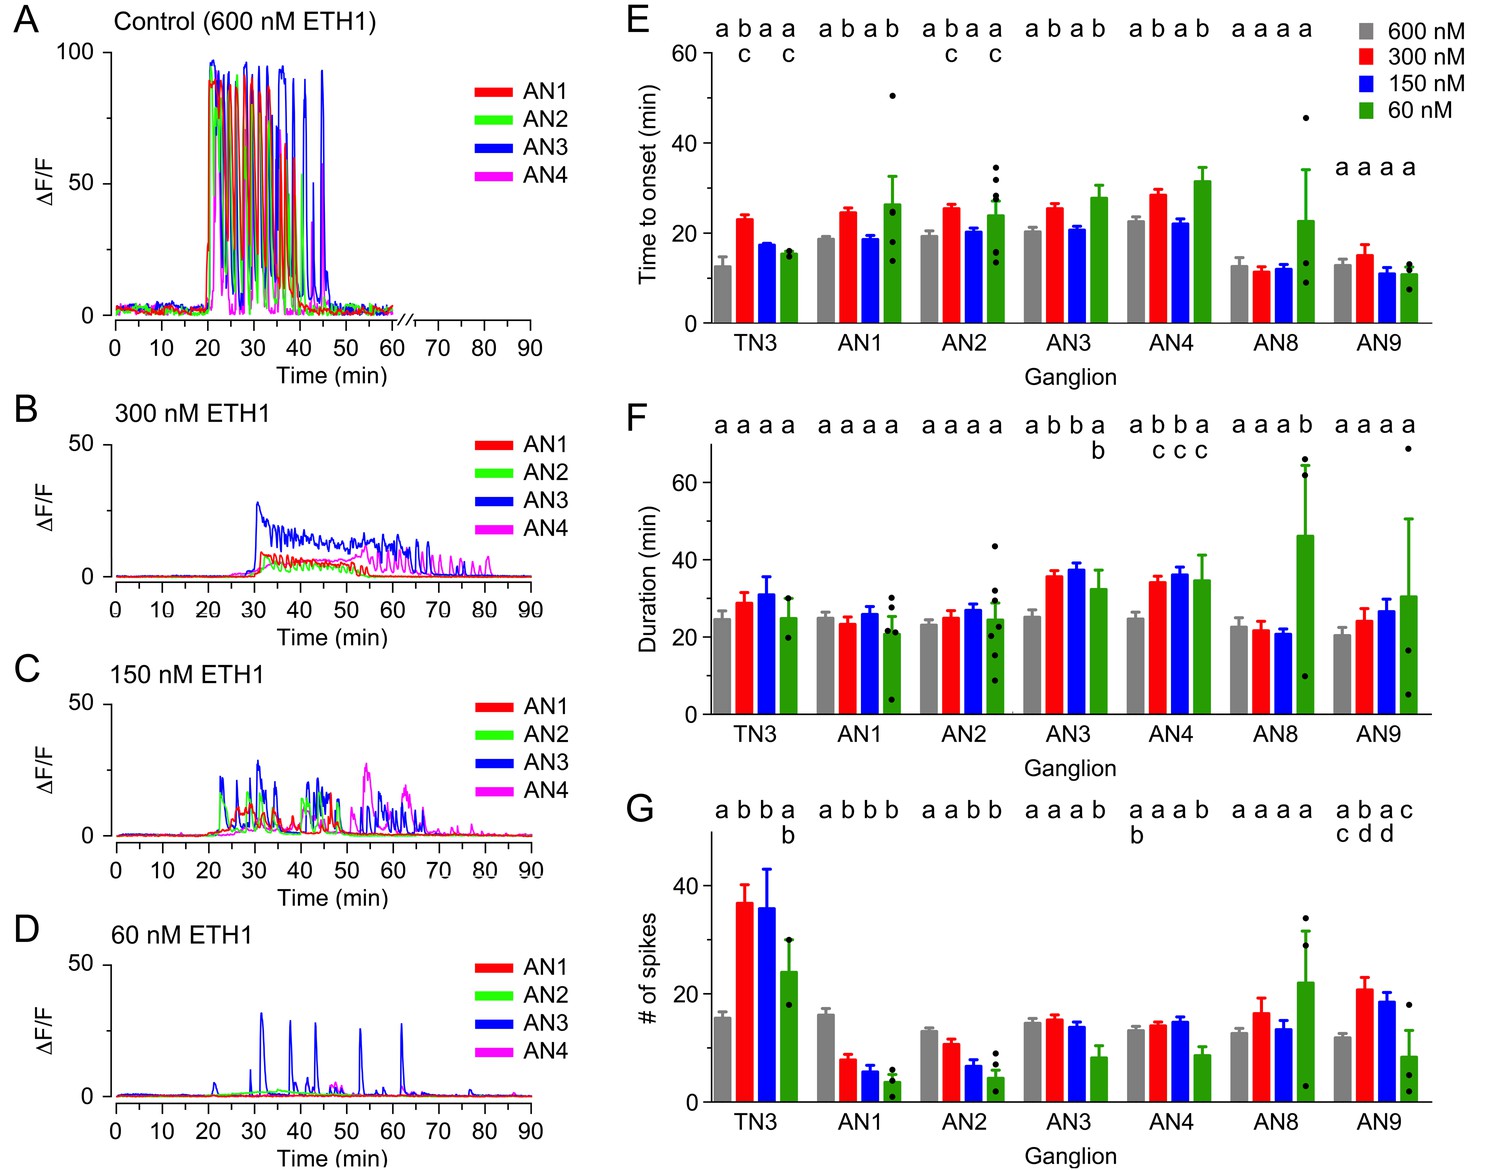
Calcium responses induced by different concentrations of ETH in CCAP neurons.
(A–D) Pattern of GCaMP activity recorded from CCAP neurons in AN1-4 from control CNSs challenged in vitro with 600 nM (A), 300 nM (B), 150 nM (C), and 60 nM (D) ETH. Zero min indicates time of ETH challenge. (E–G) Quantitation of results, shown as described in Figure 3H–J. N = 10 for all preparations. Data are mean ± SEM. Different letters indicate statistically significant groups (p<0.05); one-way ANOVA, Tukey's post-hoc multiple comparison analyses. Actual p values can be found in Supplementary file 1. The responsiveness and amplitude of the responses were also affected; see text and Figure 3—figure supplement 1. Individual measurements have been superimposed on the summary histogram when <8 neurons showed a measurable response. Genotypes: all animals expressed GCaMP under control of Ccap-GAL4 (Ccap-GAL4 + UAS-GCaMP).
Figure 5
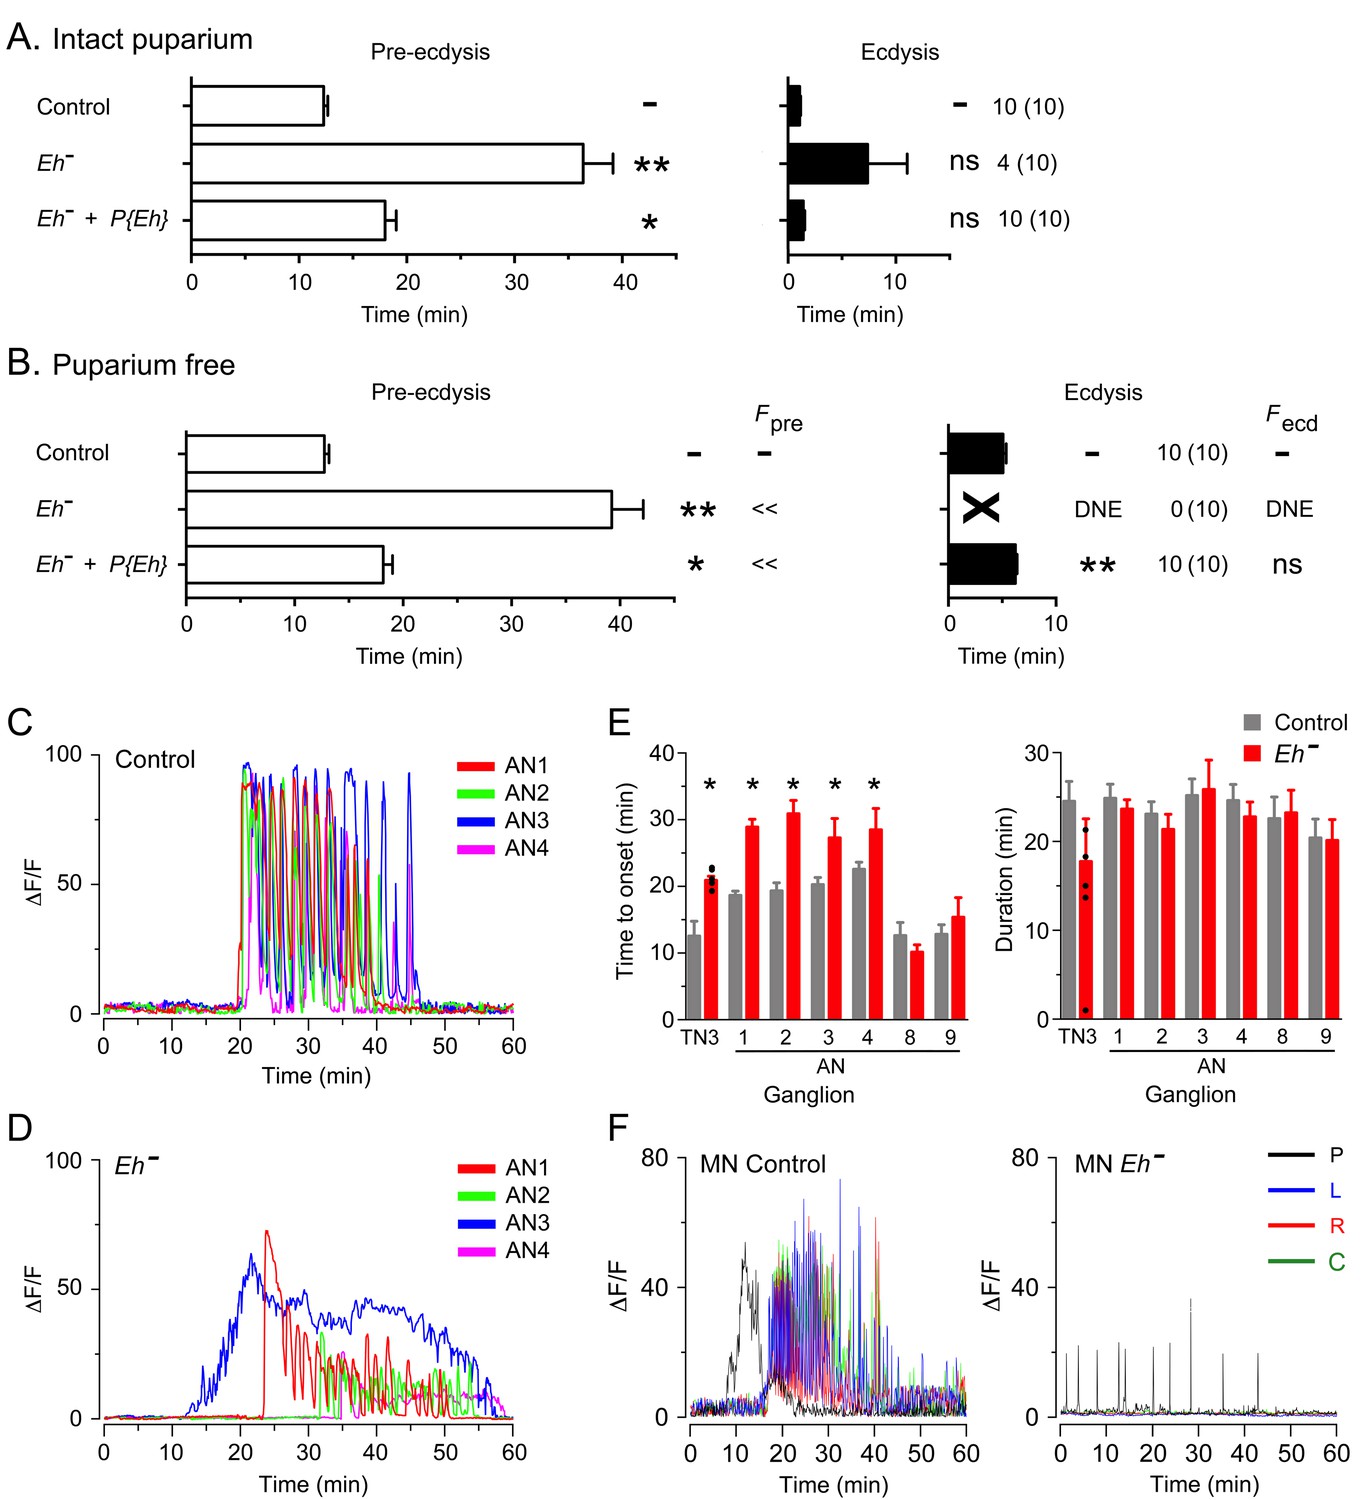
Absence of EH abolishes ecdysis and alters the response of CCAP neurons to ETH.
(A,B) Duration of pre-ecdysis (left; open bars) and ecdysis (right; filled bars) behavior of animals hemizygous for Eh in intact (A) and puparium-free preparations (B), shown as described in Figure 2. Behavioral defects in (A, B) were qualitatively rescued by transgene containing Eh gene, indicating that they are caused by lack of EH neuropeptide. (C,D) Pattern of GCaMP activity in CCAP neurons AN1-4 induced by ETH in CNS from control animals (C) and from animals hemizygous mutant for Eh (D). Zero min indicates time of ETH challenge. (E) Summary of results obtained for latency (left) and duration (right) of response. (F) Recording from motoneurons from CNS of controls (left; cf. Figure 1B) and animals hemizygous for Eh (right); traces color-coded as described in Figure 1. Zero min indicates time of ETH challenge. N = 6–10 for all genotypes. Data in (A, B, and E) are mean ± SEM. One-way ANOVA, Dunnett's post-hoc to control; (*: p<0.05; **: p<0.01); actual p values can be found in Supplementary file 1. The amplitude of the responses was also affected; see text and Figure 3—figure supplement 1. In (E), individual measurements have been superimposed on the summary histogram when < 8 neurons showed a measurable response. Genotypes: in (A–D) all animals expressed GCaMP under control of Ccap-GAL4; in (F), they expressed GCaMP under control of MN-GAL4 (C164-GAL4). Eh[-]: Eh[-]/Df(3)Eh; Eh[-]+P{Eh}: Eh[-]/Df(3)Eh; P{Eh}; see Materials and methods for exact genotypes.
Figure 6

Ecdysial behaviors of pburs mutant animals.
(A,B) Duration of pre-ecdysis (left; open bars) and ecdysis (right; filled bars) behavior of animals hemizygous for pburs in intact (A) and in puparium-free preparations (B), shown as described in Figure 2. Data are mean ± SEM; one-way ANOVA, Dunnett's post-hoc to control. Actual p values can be found in Supplementary file 1. Lack of pburs function did not significantly alter the duration of the pre-edysis phase (unless CCAP neurons also expressed GAL4, see below), whereas it lengthened (intact preparations) or shortened (puparium free preparations) the duration of ecdysis; a similar result was obtained when pburs function was knocked down using RNAi. In (A), note that expression of GAL4 in CCAP neurons accentuated the defects expressed by pburs hemizygotes; these defects could not be rescued by pburs-containing transgene and were therefore not caused only by the lack of pburs function. For this reason, GCaMP responses to ETH of pburs mutants were assessed using Ccap-LexA driver (cf., Figure 7). Genotypes: Control (GAL4): CCAP-GAL4+UAS-GCaMP; Control (LexA): CCAP-LexA+LexAop-GCaMP. All genotypes including '(GAL4)' or ('LexA') contained CCAP-GAL4+UAS-GCaMP or CCAP-LexA+LexAop-GCaMP, respectively. pburs[-]: pburs[-]/Df(2)pburs; pburs[-]+P{pburs}: pburs[-]/Df(2)pburs; P{pburs}; see Materials and methods for exact genotypes. In all experiments using RNAi, its effectiveness was boosted by including a UAS-dcr2 transgene.
Figure 7
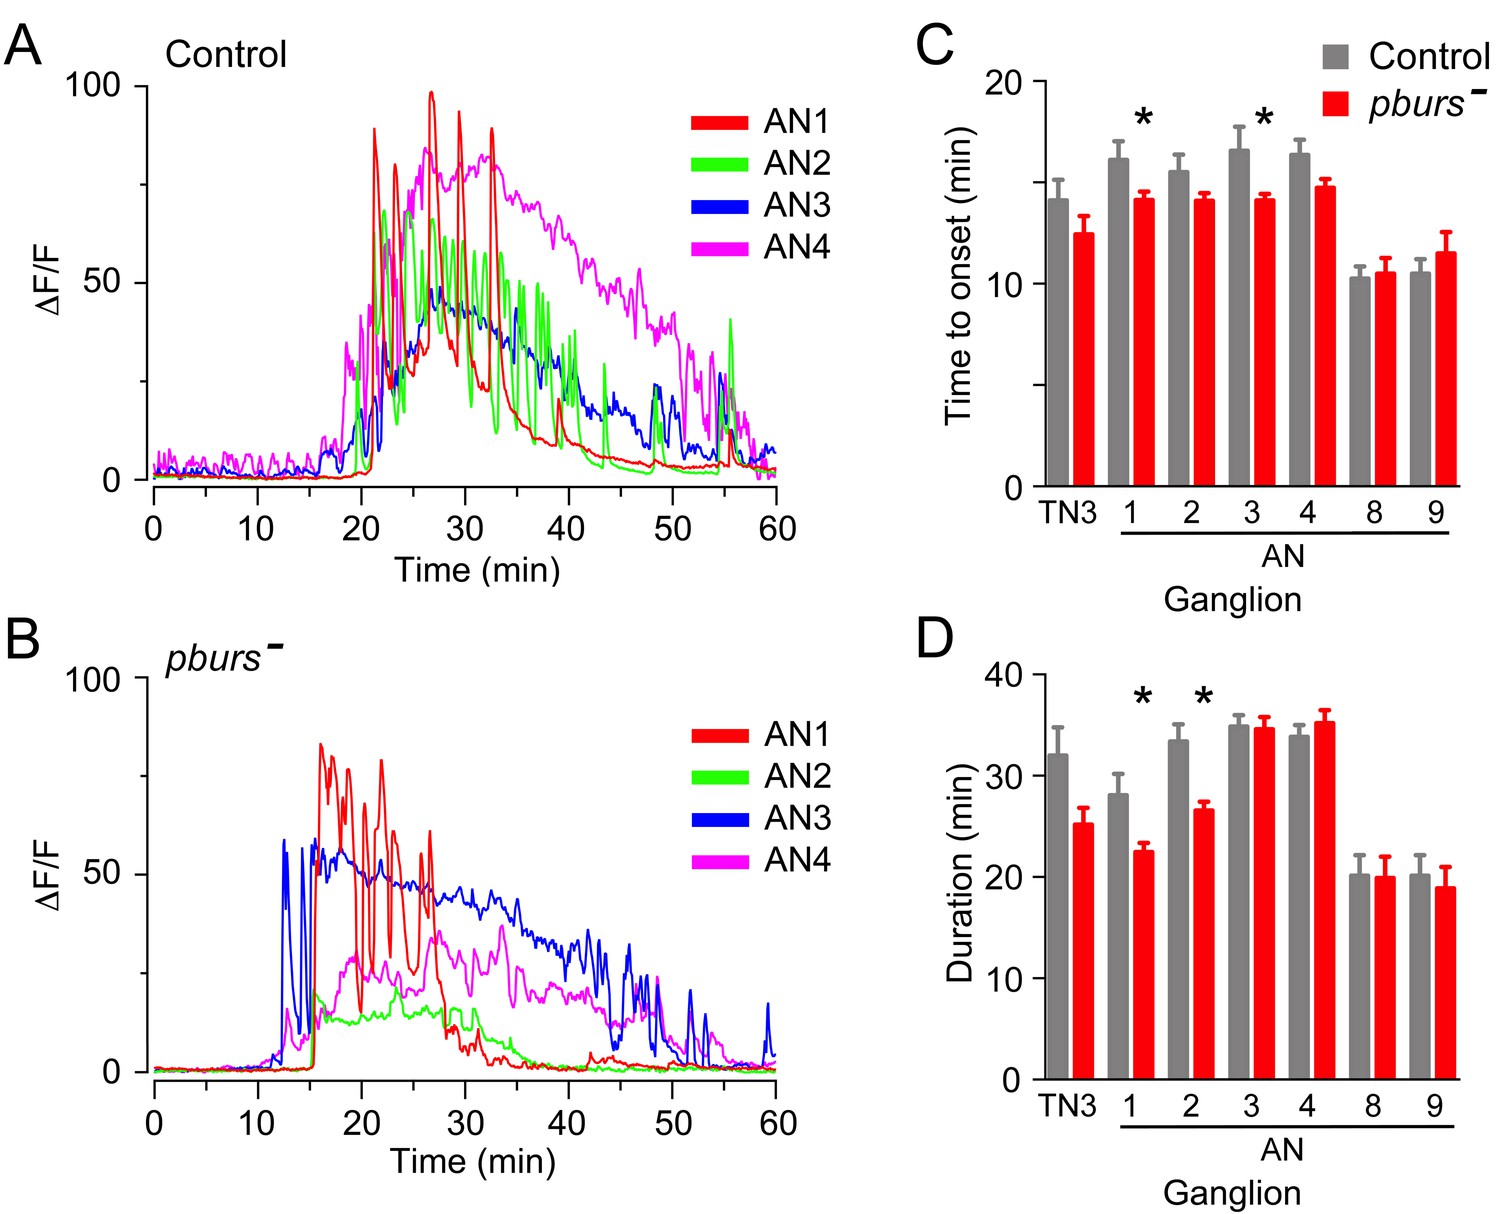
Absence of PBURS affects response of CCAP neurons to ETH.
(A,B) Pattern of GCaMP activity in CCAP neurons AN1-4 induced by ETH in CNS from control animals (A) and in CNS of animals hemizygous mutant for pburs (B). Zero min indicates time of ETH challenge. (C,D) Summary of results obtained for latency (C) and duration (D) of response, summarized as described in Figure 5. N = 7–10 for all genotypes and preparations. Data in (C,D) are mean ± SEM. Significant differences (p<0.05) compared to control are indicated by '*'; t test (unpaired, two-tailed). Actual p values can be found in Supplementary file 1. The amplitude of the responses was also affected; see text and Figure 3—figure supplement 1. Genotypes: Control: CCAP-LexA+LexAop-GCaMP. pburs[-]: pburs[-]/Df(2)pburs + CCAP-LexA+LexAop-GCaMP; see Materials and methods for exact genotypes.
Figure 8

GABA inhibition controls latency to ecdysis and of CCAP response to ETH.
(A,B) Duration of pre-ecdysis (left; open bars) and ecdysis (right; filled bars) behavior in intact (A) and in puparium-free (B) preparations expressing GABA-RA RNAi in CCAP neurons; results are summarized as shown in Figure 2. Animals also expressed GCaMP under control of Ccap-GAL4. (C–E) Pattern of GCaMP activity in CCAP neurons AN1-4 induced by ETH in CNSs from control animals (C), in CNSs from control animals recorded in the presence of GABA-RA antagonist picrotoxin (100 µM) (E), and in CNSs expressing GABA-RA RNAi in CCAP neurons (E). (F–H) Quantitation of results, shown as described in Figure 3H–J. Zero min indicates time of ETH challenge. N = 9–13 for all genotypes and preparations. Data in (A,B, F–H) are mean ± SEM. For panels A and B, data for experimental groups were compared to those of control (one-way ANOVA, Dunnett's post-hoc to control), and summarized as described in Figure 2. For panels F–H, different letters indicate statistically significant groups (p<0.05); one-way ANOVA, Tukey's post-hoc multiple comparison analyses. Actual p values for all analyses can be found in Supplementary file 1. All animals also expressed GCaMP under control of Ccap-GAL4 (Ccap-GAL4 + UAS-GCaMP). In all experiments using RNAi, its effectiveness was boosted by including a UAS-dcr2 transgene.
Figure 9

GABA delays depolarization of CCAP neurons induced by ETH.
(A) ArcLight fluorescence in CCAP neurons α and β from ganglion AN1-2. (B) ArcLight signal recorded from α (red trace) and β (blue trace) neurons following ETH stimulation in control CNS (+ETH; top traces) and in the presence of picrotoxin (+ETH+Px, lower traces). Zero min indicates time of ETH challenge. Inverted triangles indicate start and end of depolarization; 'Duration' corresponds to the time between these two events. (C) Quantitation of results showing time of onset of depolarization (top) and duration of depolarization (bottom) in CCAP neurons from TN3 and AN1-4 (neurons in AN8 and AN9 could not be visualized). (D) Comparison between timecourse of GCaMP and ArcLight signal. Data in (C,D) are mean ± SEM. N = 10–13 for all genotypes. In (C), statistically significant differences (p<0.05) relative to control are indicated with '*'; t test (unpaired, two-tailed). In (D), statistically significant differences (p<0.05) are indicated by different letters; one-way ANOVA, Tukey's post-hoc multiple comparison analyses. Actual p values for all analyses can be found in Supplementary file 1. Individual measurements have been superimposed on the summary histogram when <8 neurons showed a measurable response. Genotype of animals expressing ArcLight sensor: CCAP>Arclight; of those expressing GCaMP: CCAP>GCaMP.
Figure 10
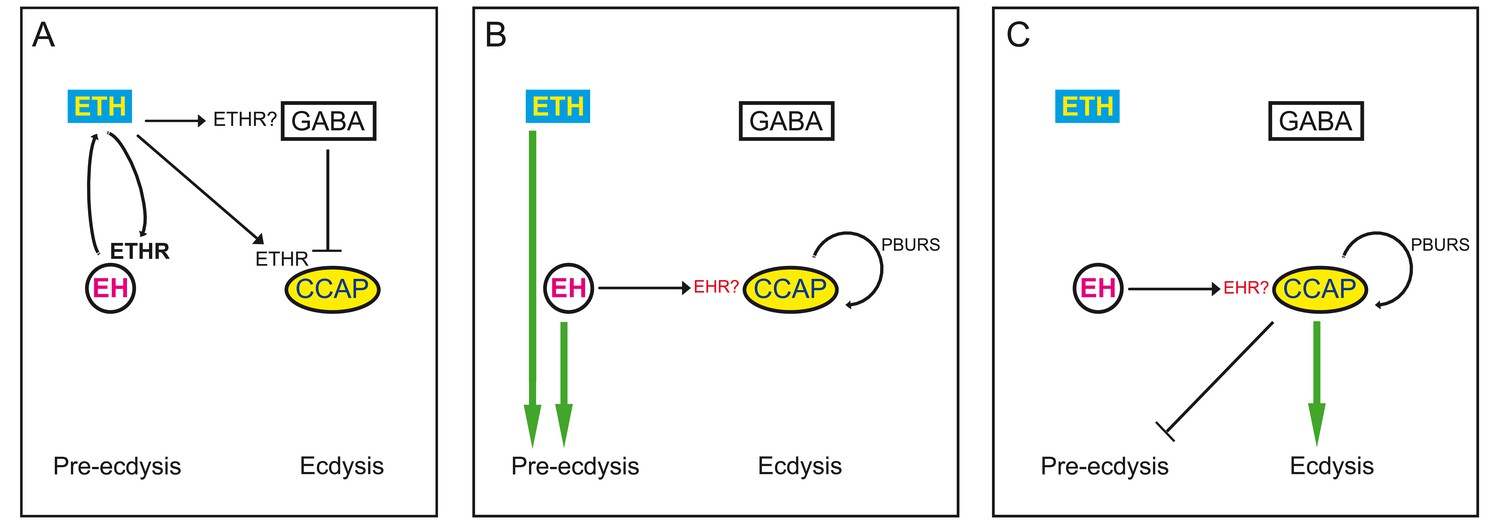
Model for endocrine control of ecdysial behaviors.
(A) ETH released from peripheral endocrine cells acts directly on EH and CCAP neurons, and directly or indirectly on GABA neurons. Release of ETH is further potentiated by ETH-induced EH release (reciprocal arrows). Direct GABA inhibition of CCAP neurons prevents onset of response. (B) EH and/or ETH turn on the preparatory phase of ecdysis; waning of GABA inhibition, and EH and autocrine PBURS action (presumably mediated by BURS+PBURS bursicon heterodimer) on CCAP neurons activates CCAP neurons. (C) Activation of CCAP neurons causes expression of ecdysis proper and silencing of pre-ecdysis phase. Except for reciprocal relationship between EH and ETH, and ETH actions on CCAP neurons, none of the actions indicated are known to be direct. Arrows indicate stimulation; cross bars indicate inhibition.
Additional files
-
Supplementary file 1
Actual p values for statistical analyses for results reported in main Figures 2–9, and for Figure 3—figure supplement 1.
- https://doi.org/10.7554/eLife.19686.014
Download links
A two-part list of links to download the article, or parts of the article, in various formats.
Downloads (link to download the article as PDF)
Open citations (links to open the citations from this article in various online reference manager services)
Cite this article (links to download the citations from this article in formats compatible with various reference manager tools)
Stereotyped responses of Drosophila peptidergic neuronal ensemble depend on downstream neuromodulators
eLife 5:e19686.
https://doi.org/10.7554/eLife.19686


