Neuronal sources of hedgehog modulate neurogenesis in the adult planarian brain
- Hospital for Sick Children, Canada
- University of Toronto, Canada
- Ontario Institute for Cancer Research, Canada
Figures
Figure 1 with 1 supplement
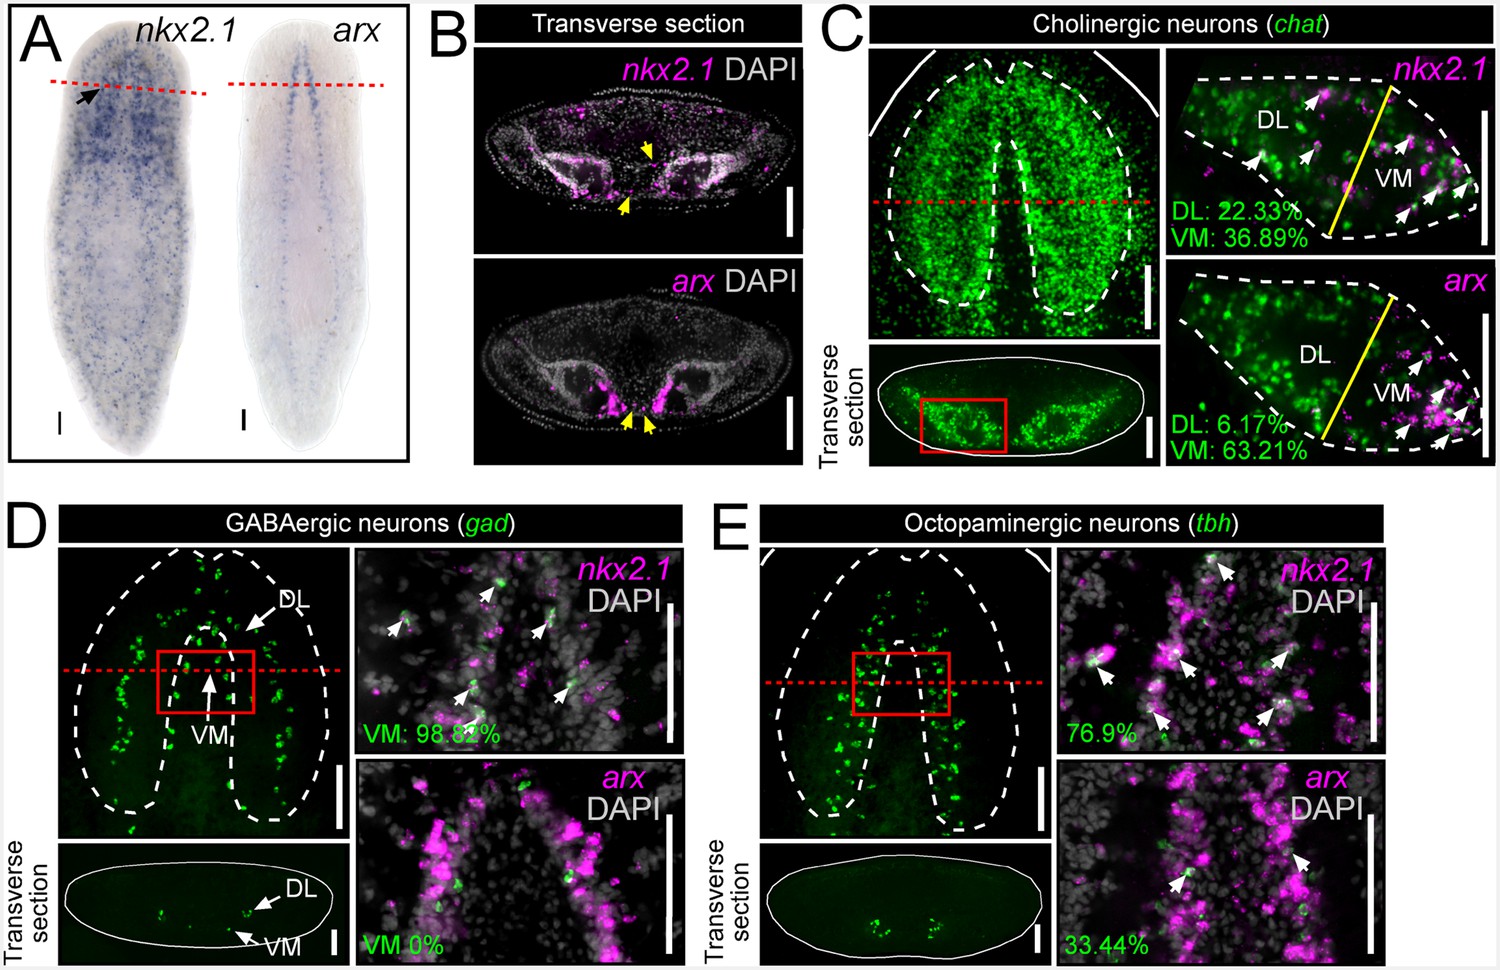
nkx2.1 and arx are expressed by VM neural cell types.
(A) WISH images of nkx2.1 and arx expression. Black arrow highlights CNS expression. (B) Single confocal plane from transverse sections of FISH images depicting expression of nkx2.1 and arx within the CNS. Yellow arrows highlight nkx2.1 and arx expression within stem cell-rich area. (C–E) For each set of images, the upper left panels are projections of confocal images from FISH experiments showing all cholinergic, GABAergic, or octopaminergic neurons in wild-type animals. Solid red boxes represent region of interest for the right panels, which are single confocal planes from dFISH experiments, showing co-expression of nkx2.1 or arx within a given neuron subtype. Solid yellow lines in (C) demarcate the division line between the VM and DL brain regions. White arrows in dFISH panels indicate double-positive cells. Solid white lines represent the border of the animal. Dashed white lines represent the approximate border of the CNS. Red dashed lines indicate approximate plane for transverse sections. Scale bar = 100 µm. CNS, Central nervous system; DL, Dorsal-lateral; FISH, Fluorescent in situ hybridization; VM, Ventral-medial.
Figure 1—figure supplement 1
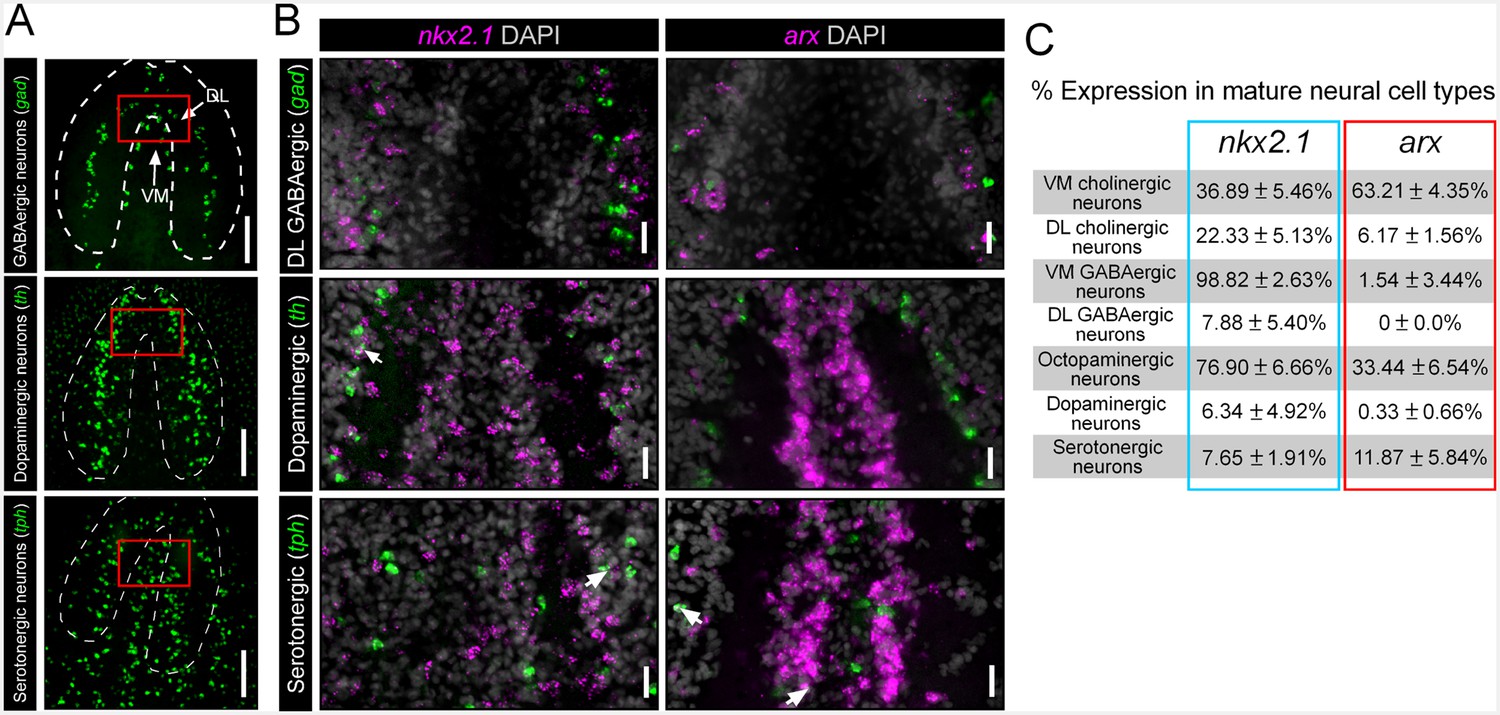
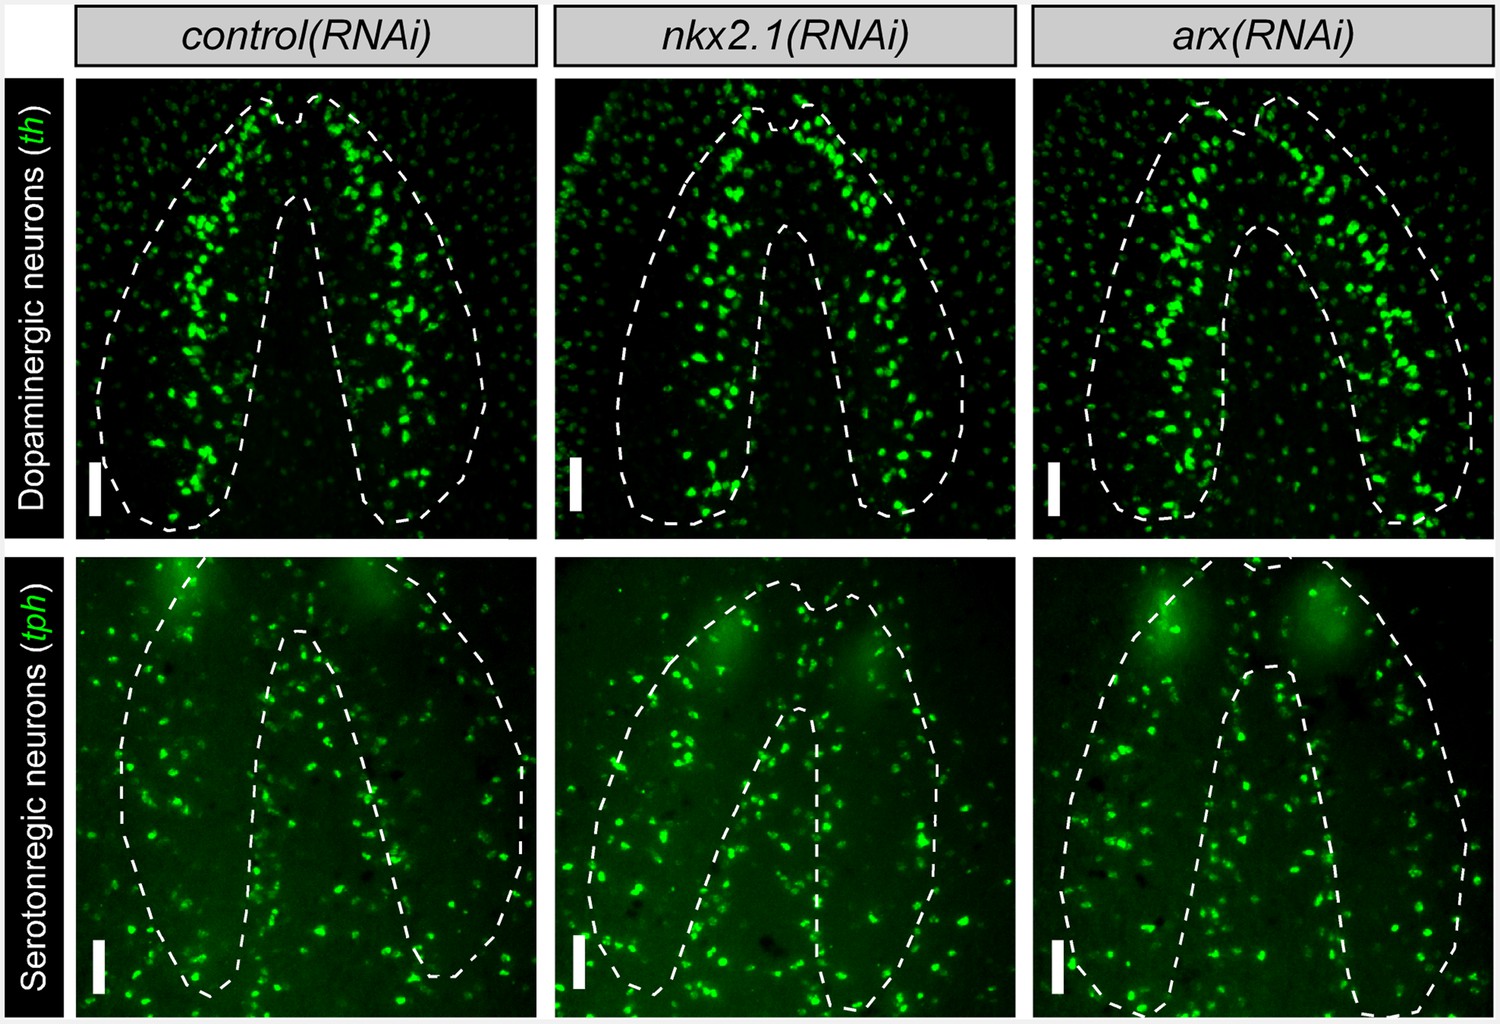
nkx2.1 and arx are not expressed by DL GABAergic, dopaminergic, or serotonergic neurons.
(A) Projected confocal images showing the full populations of GABAergic, dopaminergic, or serotonergic neurons. Dashed lines represent outer border of the CNS. Solid red box indicates region of interest for panels to the right. Scale bars = 100 µm. (B) Single confocal planes from dFISH images showing limited expression of nkx2.1 and arx, within DL GABAergic, dopaminergic, and serotonergic neurons (white arrows). Scale bars = 20 µm. (C) Table summarizing the percentage of neurons from each sub-population that express nkx2.1 and arx. Values are percentage of neurons ± standard deviation. CNS, Central nervous system; DL, Dorsal-lateral.
Figure 2 with 2 supplements
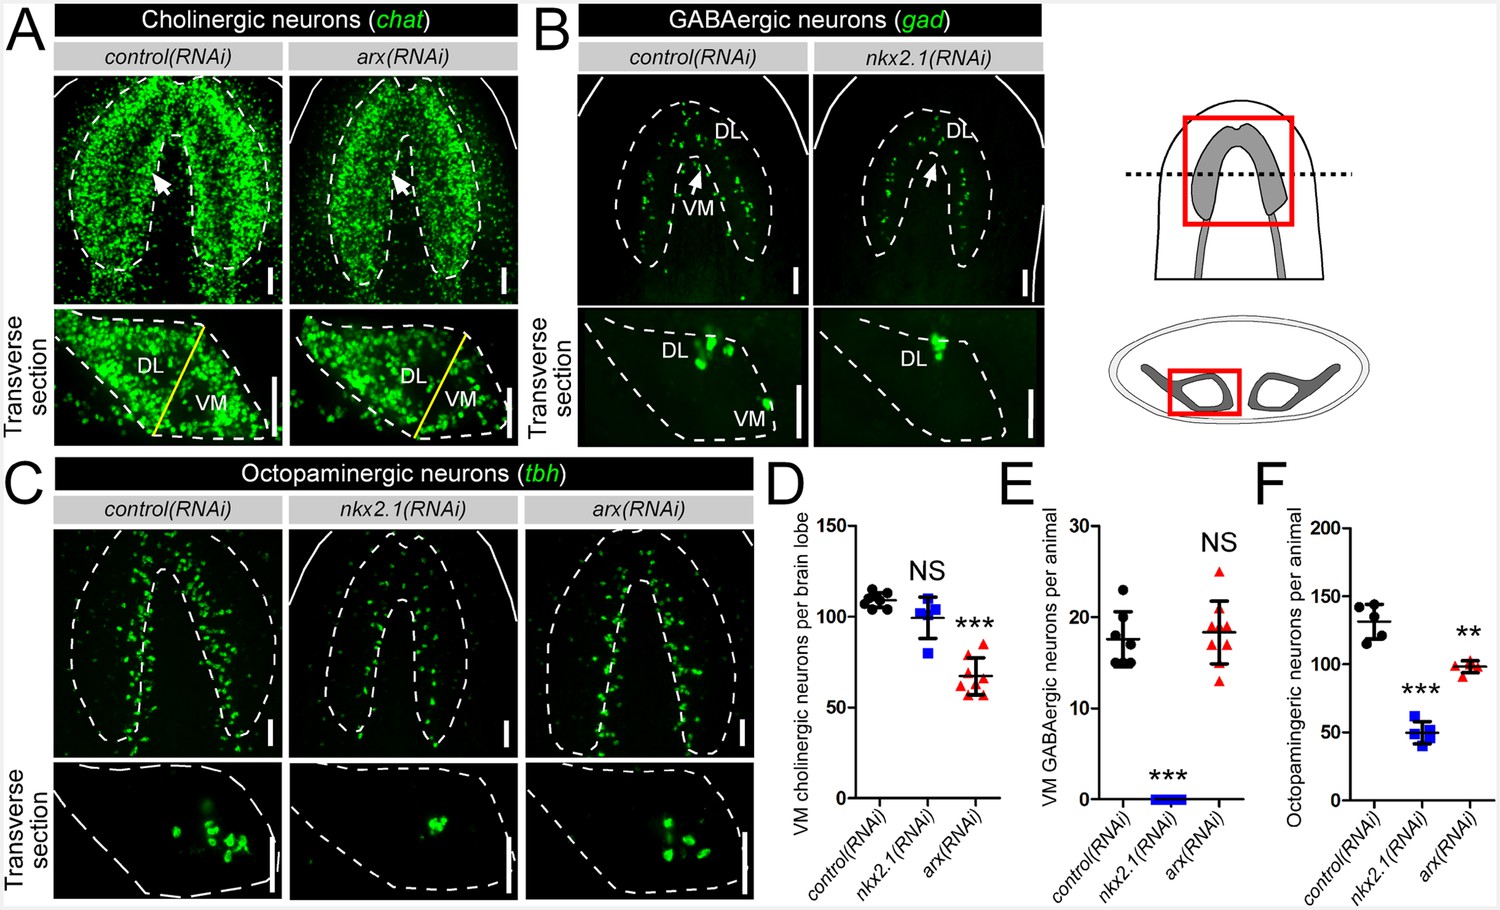
nkx2.1 and arx are required for the maintenance of VM neural cell types.
(A–C) Projected confocal image stacks showing cholinergic, GABAergic, or octopaminergic neuronal populations in RNAi-treated animals. VM neural subpopulations are highlighted by white arrows. Regions of interest are represented by cartoons at the right side of the figure. Solid white lines represent the outer border of the animal, and dashed white lines mark the outer border of the CNS. Solid yellow line demarcates the border between the VM and DL brain regions. Scale bar = 50 µm. (D–F) Quantification of VM cholinergic, VM GABAergic, and octopaminergic neurons in RNAi-treated animals. Significance levels in dot plots: **p<0.01, ***p<0.001, error bars are standard deviation. CNS, Central nervous system; DL, Dorsal-lateral; VM, Ventral-medial.
Figure 2—figure supplement 1
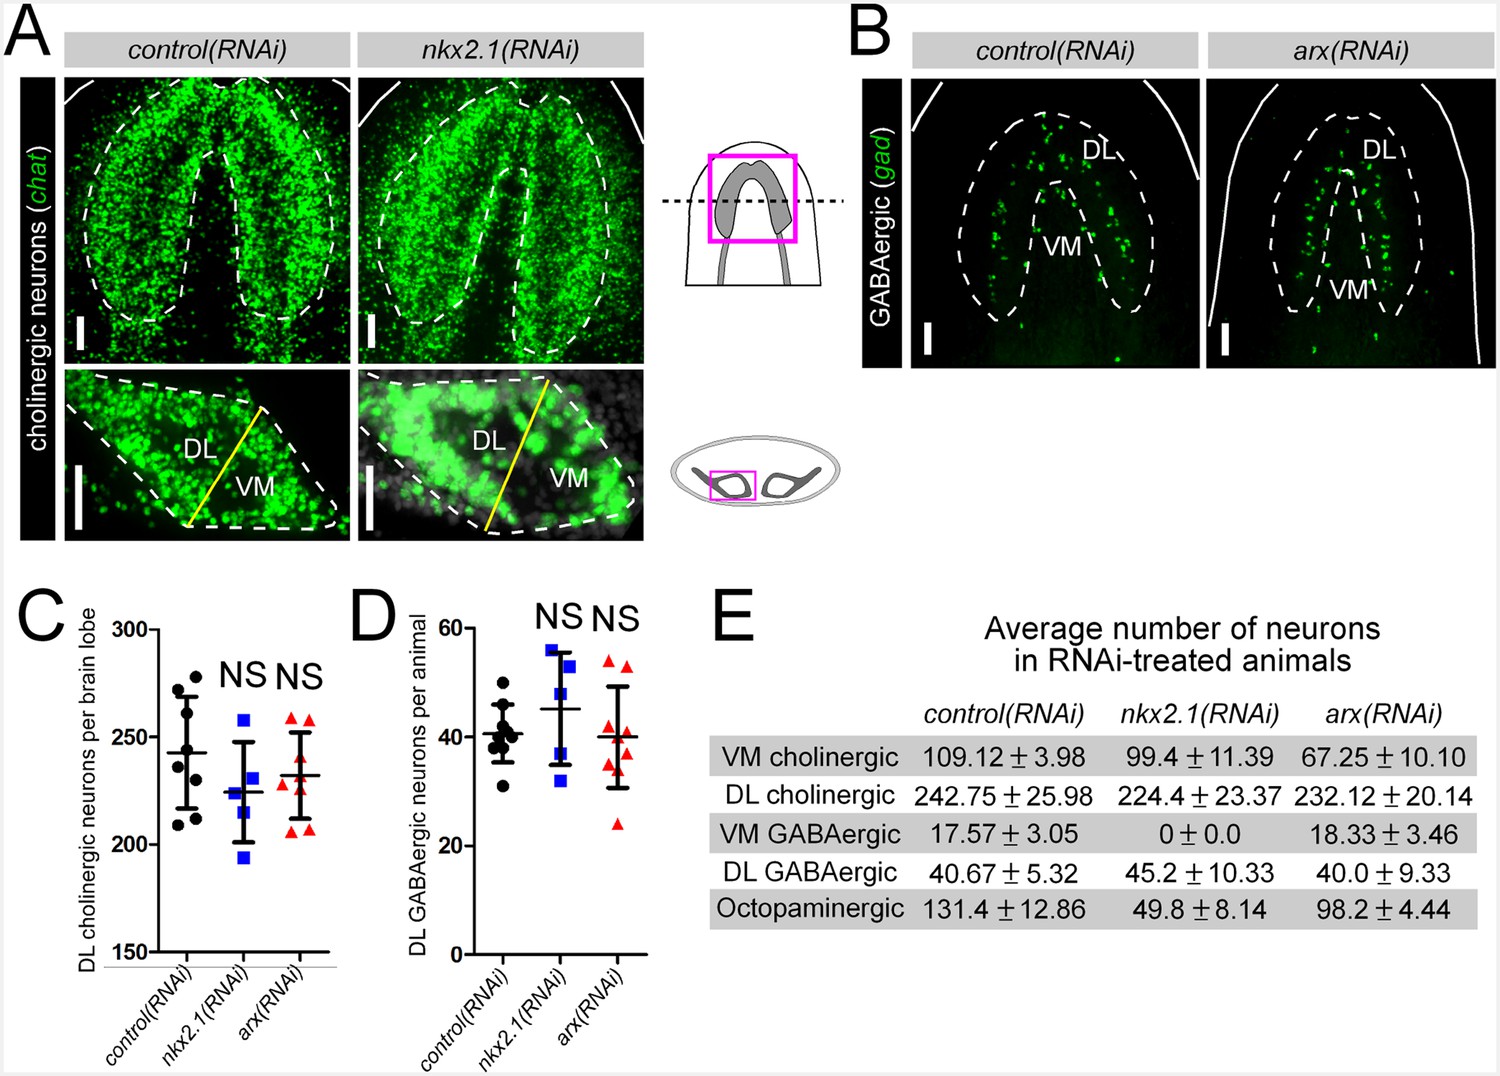
nkx2.1 and arx are not required for maintenance of DL neural cell types.
(A–B) Projected confocal images showing cholinergic or GABAergic neurons in RNAi-treated animals. Cartoons depict region of interest for all confocal projections. Solid white lines represent outer border of the animal, dashed white lines represent the borders of the brain and solid yellow lines demarcate the plane of division between the VM and DL brain regions. Scale bars = 50 µm. (C–D) Quantification of DL cholinergic and GABAergic neurons. Graphs are dot plots, n ≥ 5. (E) Table showing number of neurons for each subtype found in RNAi-treated animals. Values are mean number of neurons ± standard deviation. DL, Dorsal-lateral; VM, Ventral-medial.
Figure 2—figure supplement 2
nkx2.1 and arx are not required for the maintenance of dopaminergic or serotonergic neurons Projected confocal images showing dopaminergic neurons or serotonergic neurons.
Dashed lines represent the outer border of the CNS. Scale bars = 50 µm. CNS, Central nervous system.
Figure 3 with 3 supplements
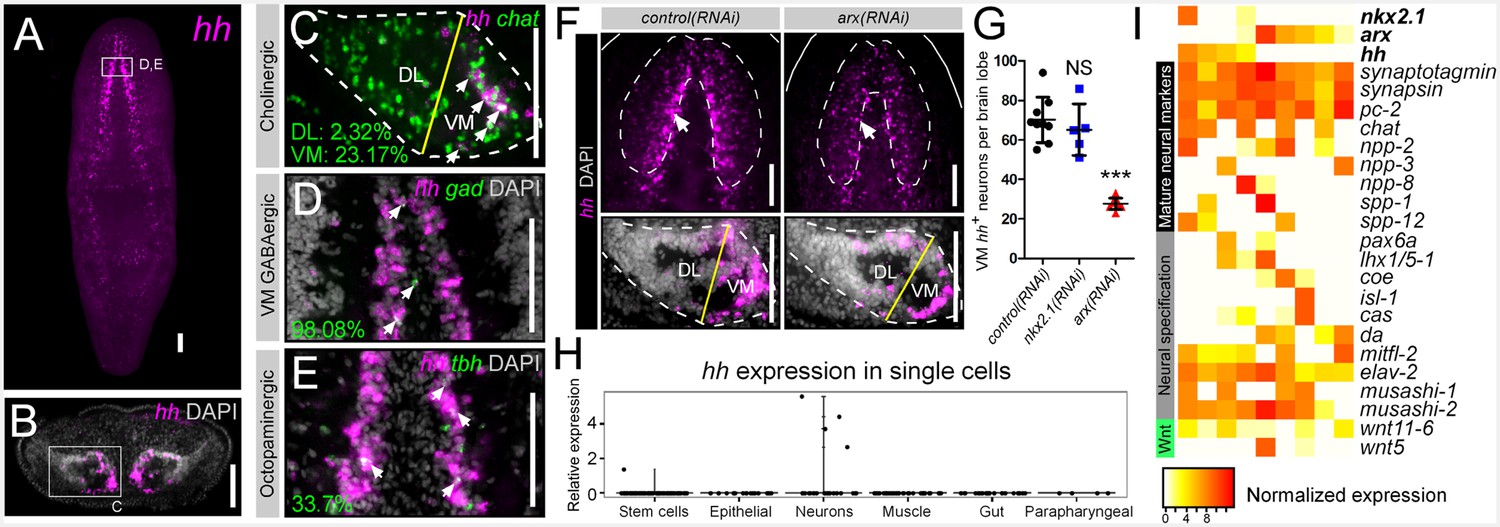
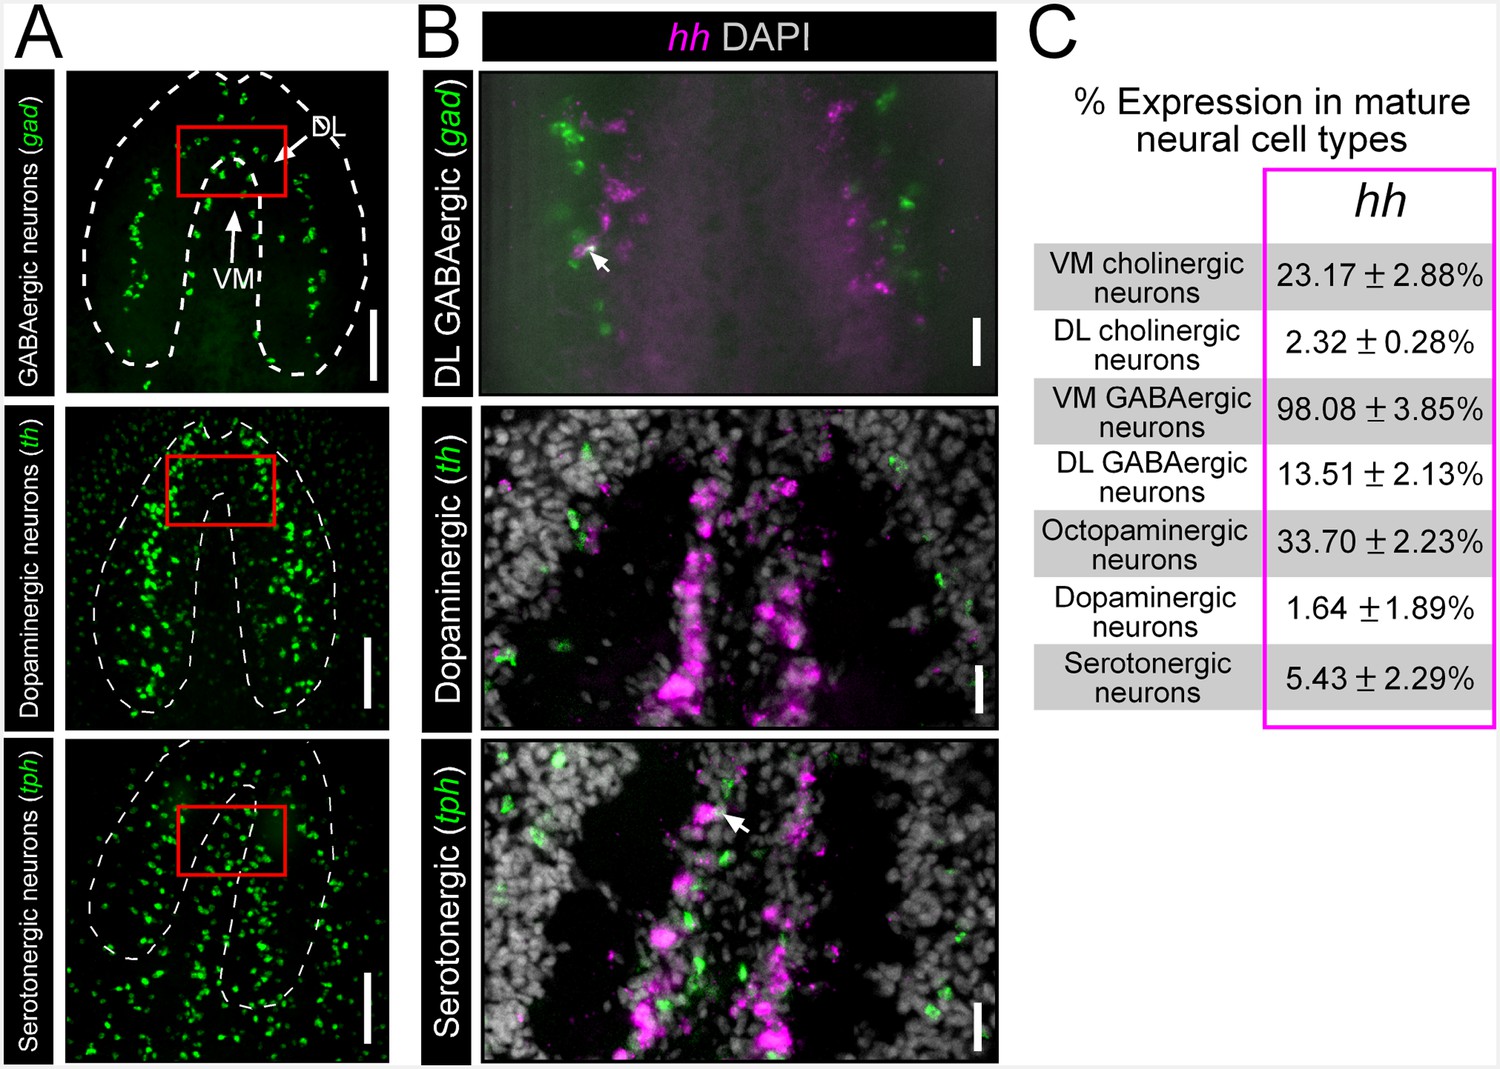
hh is expressed in VM neural cell types.
(A) FISH image of whole-mount hh expression. (B) FISH image of hh expression in a brain cross-section (C–E) Single confocal plane of dFISH images depicting hh expression in cholinergic, GABAergic, and octopaminergic neurons (white arrows). (F) Projected confocal image stacks displaying hh expression within the brain in RNAi-treated animals. White arrow highlights reduced hh expression in the VM region of the brain. Dashed lines represent the outer border of the brain lobe and yellow lines represent the plane of division between the VM and DL brain regions. (G) Quantification of VM hh+ neurons. Graph is a dot plot, ***p<0.001, error bars are standard deviation. (H) Violin plot showing relative expression of hh within sequenced single cells across various tissue types. (I) Heatmap depicting normalized expression levels of mature neuron markers and genes associated with neuronal specification within nine individually sequenced neurons that also express arx or nkx2.1. Scale bars = 100 µm. DL, Dorsal-lateral; FISH, Fluorescent in situ hybridization; VM, Ventral-medial.
Figure 3—figure supplement 1
hh is not significantly expressed in DL GABAergic, dopaminergic, or serotonergic neurons.
(A) Projectedconfocal images showing GABAergic, dopaminergic, and serotonergic neurons. Dashed white lines represent the outer border of the CNS, and solid red boxes represent regions of interest for panels to the right. Scale bars = 100 µm. (B) Single confocal planes from dFISH images showing a lack of expression of hh within DL GABAergic, dopaminergic and serotonergic neural populations. Scale bars = 20 µm. (C) Table showing the percentage of mature neural subpopulations that express the hh signaling molecule. Values are mean percentage of neurons ± standard deviation. CNS, Central nervous system; DL, Dorsal-lateral; dFISH, Double fluorescent in situ hybridization.
Figure 3—figure supplement 2
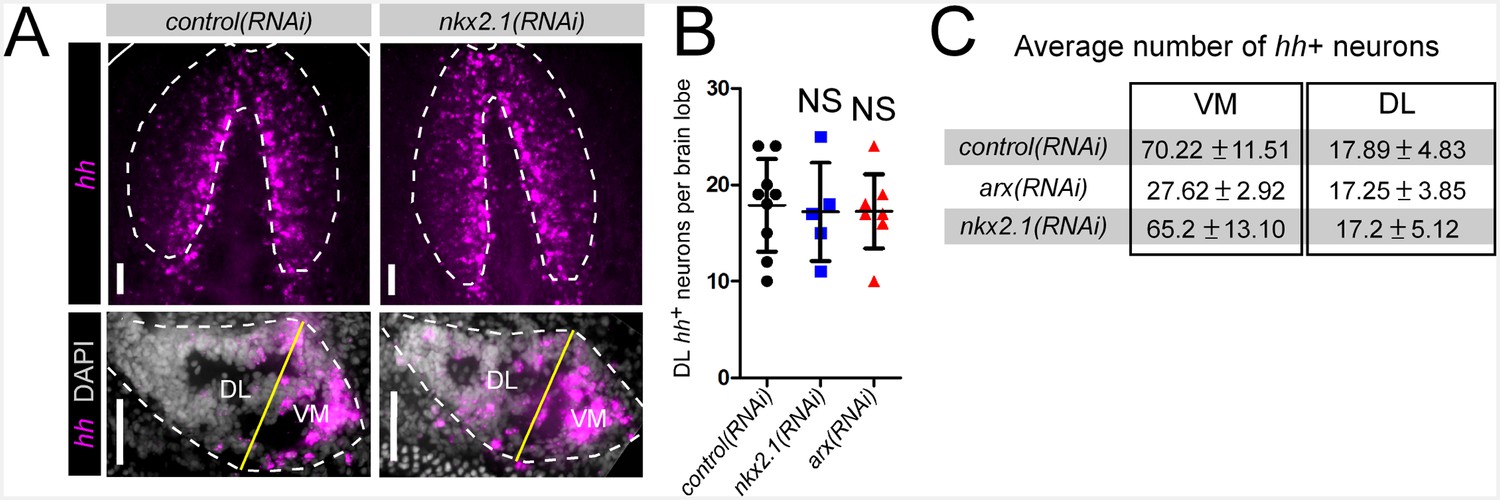
nkx2.1 is not required for neuronal hh expression.
(A) Projected confocal images showing hh+ neurons in the CNS. Top panels show the entire brain, while bottom panels show single brain lobes from transverse sections through the anterior-posterior midpoint of the brain. Solid white lines represent the outer border of the animal, dashed white lines represent the outer border of the CNS, and solid yellow line demarcates the plane of division between the VM and DL brain regions. (B) Quantification of hh+ neurons in the DL brain region. Graph is a dot plot n ≥ 5, error bars are standard deviation. (C) Table showing the number of hh+ neurons in RNAi-treated animals. Values are mean number of hh+ neurons ± standard deviation. CNS, Central nervous system; DL, Dorsal-lateral; VM, Ventral-medial.
Figure 3—figure supplement 3
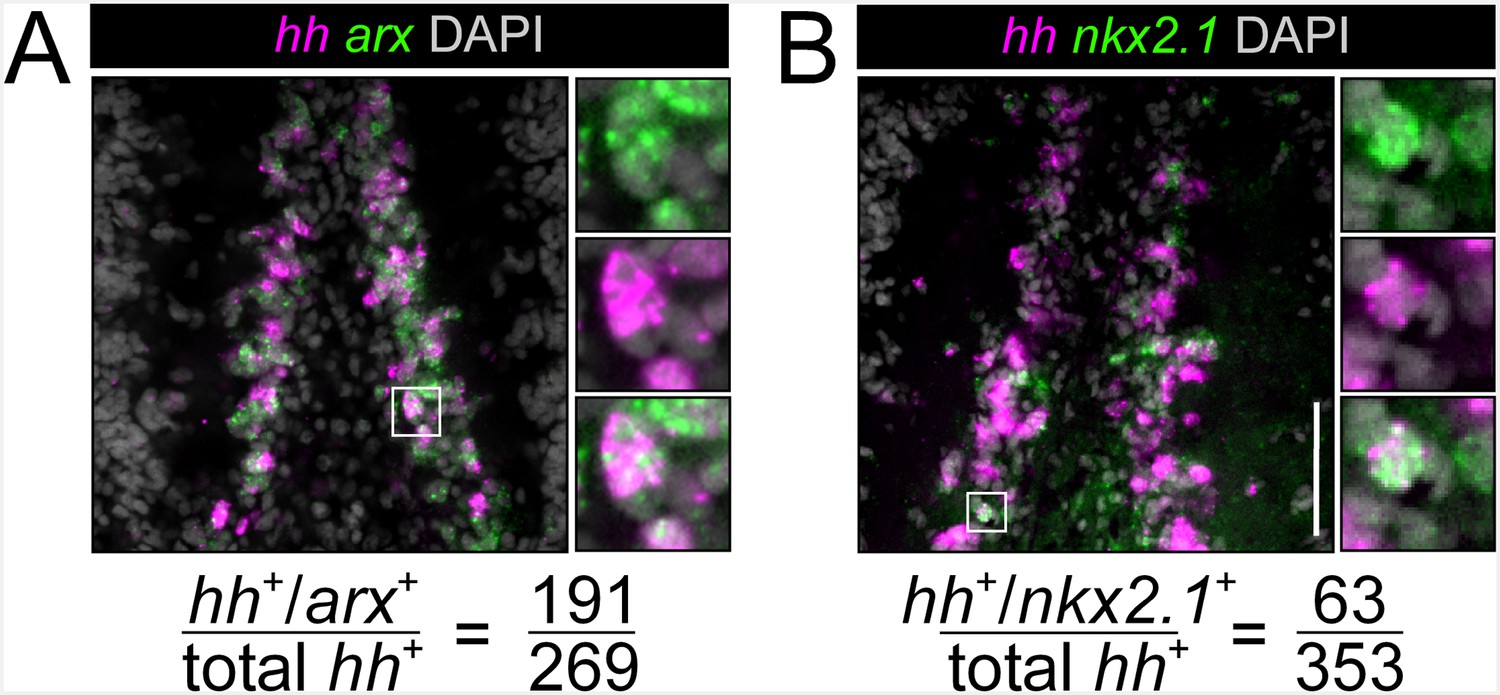
nkx2.1 and arx are expressed in hh+ cells in the brain
(A, B) Single confocal planes showing co-expression of nkx2.1 and arx within hh+ cells in the CNS. Highlighted cells in the solid white boxes are enlarged and individual channels are separated in the panels to the right. Scale bars = 100 µm. Co-expression quantification is at the bottom.
Figure 4 with 1 supplement
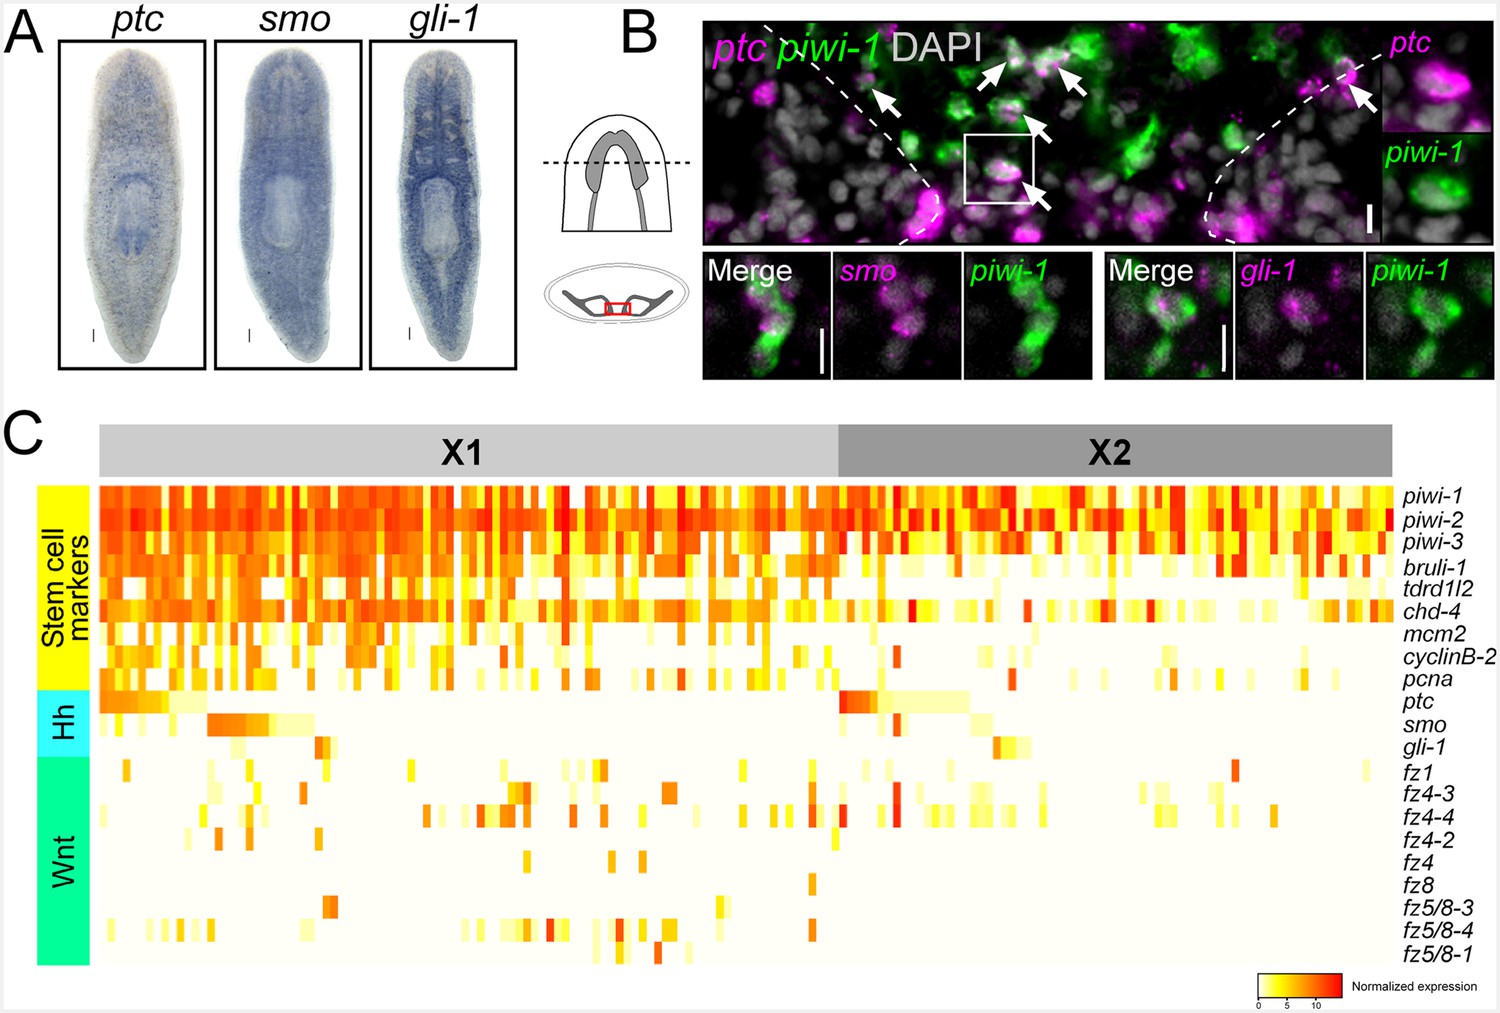
Planarian neoblasts express hh and Wnt signal transduction effectors.
(A) WISH images for ptc, smo, and gli-1. (B) Single confocal planes from dFISH images showing expression of ptc, smo, and gli-1 within piwi-1+ stem cells (white arrows) in between the two brain lobes in cross-section. Dashed lines mark the outer border of the brain lobes. Cell in solid white box is enlarged and channels are split in two right panels. Scale bars for dFISH images = 10 µm. (C) Heatmap depicting normalized expression levels of key hh and Wnt signal transduction genes and stem cell markers, within 168 individually sequenced head stem cells (X1) or stem cells + progeny (X2).
Figure 4—figure supplement 1
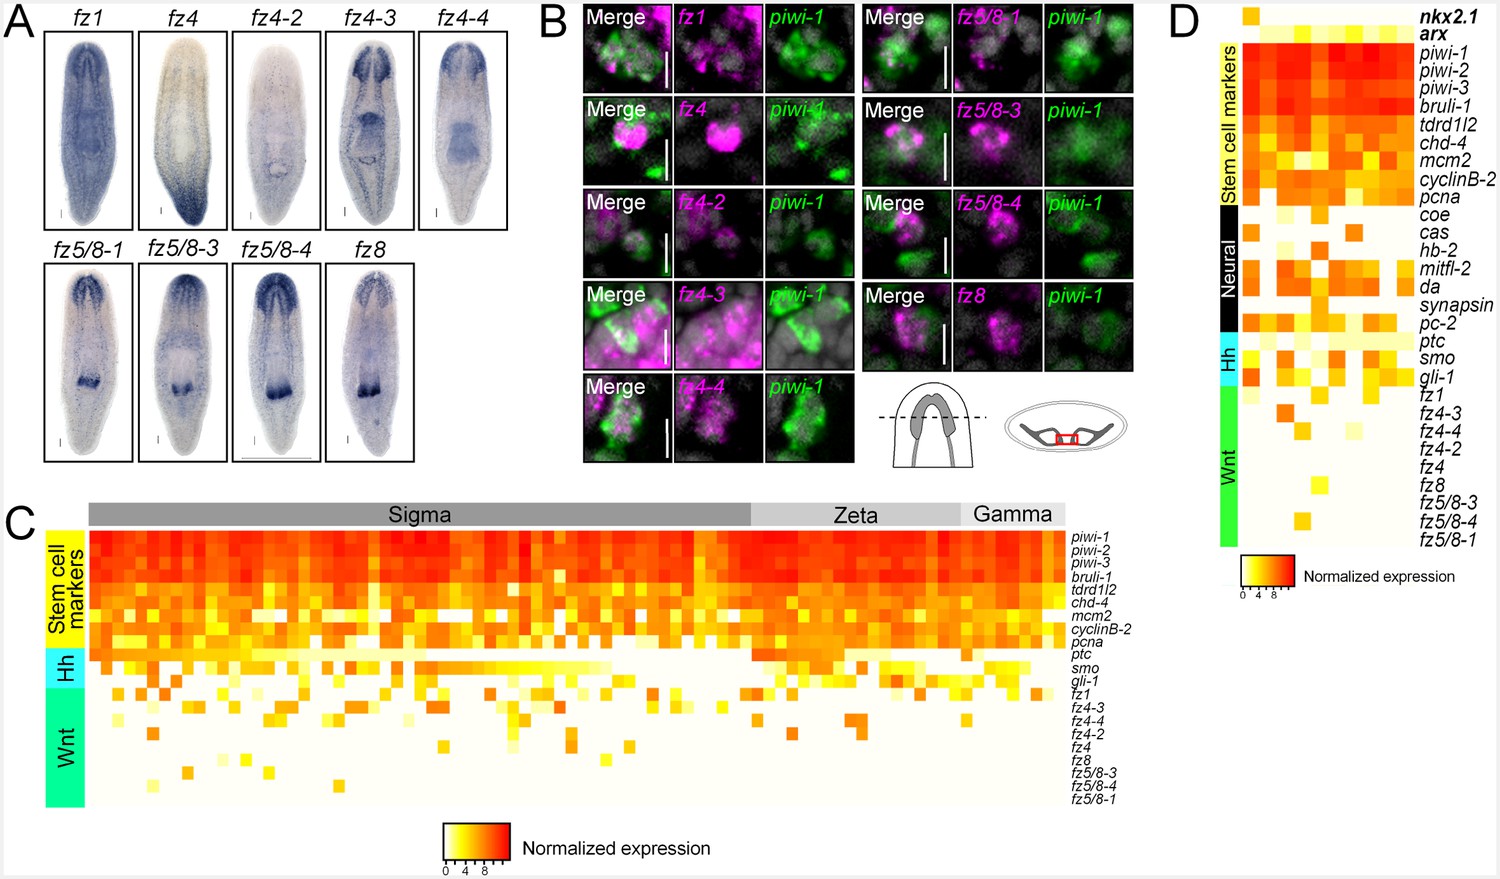
Planarian neoblasts express Wnt signal transduction effectors.
(A) WISH images for all planarian fz receptors. (B) Single confocal planes from dFISH images showing expression of all fz receptors within piwi-1+ stem cells in between the two brain lobes. Cartoon depicts region of interest for all dFISH images. Scales bar for WISH images = 100 µm. Scale bars for dFISH images = 10 µm. (C) Heatmap depicting normalized expression levels of key hh and Wnt signal transduction genes and stem cell markers, within 84 individually sequenced stem cells (Wurtzel et al., 2015). Stem cells are binned based on their known subtype (sigma, zeta, or gamma). (D) Heatmap depicting normalized expression of stem cell markers, genes associated with neurons, hh, and Wnt transduction genes, within 10 individually sequenced stem cells that also express arx or nkx2.1.
Figure 5 with 1 supplement

nkx2.1 and arx are expressed in stem cells and post-mitotic progenitors.
(A–F) Single confocal planes of dFISH images combined with immunolabelling, displaying expression of nkx2.1 and arx within stem cells (yellow arrows) and post-mitotic progenitors (white arrows). Green arrowheads highlight post-mitotic progenitors within the brain lobes. Boxed cells are enlarged below and individual channels are split. Dashed lines mark the outer border of the brain lobes. Cartoon depicts region of interest for all confocal images. Scale bars = 20 µm. (G) Heatmap depicting normalized expression of stem cell markers, genes associated with neurons, hh, and Wnt transduction genes, within 31 individually sequenced head stem cells (X1) or stem cells + progeny (X2) that also express arx or nkx2.1.
Figure 5—figure supplement 1
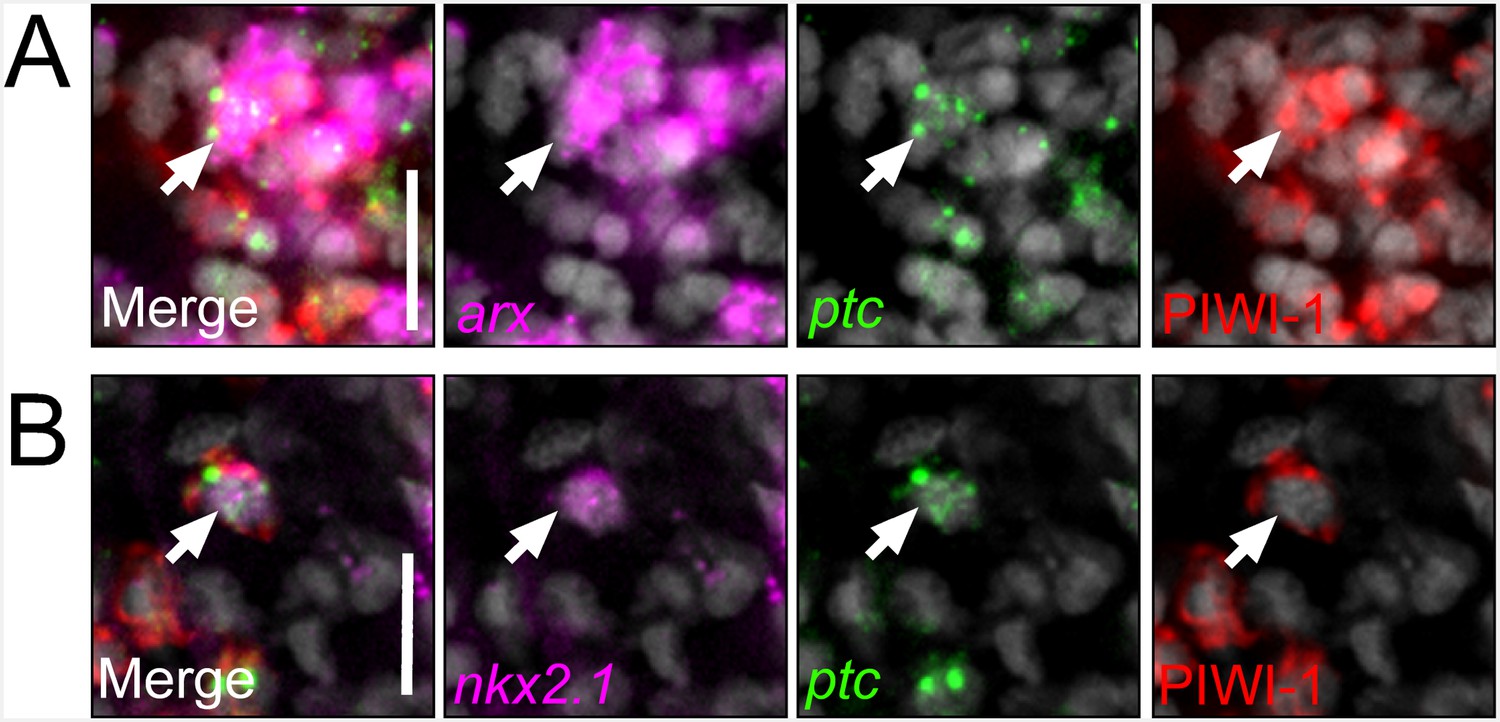
nkx2.1 and arx are expressed in ptc+/PIWI-1+ cells.
(A–B) Single confocal planes from dFISH images combined with immunolabelling, displaying expression of nkx2.1 and arx within ptc+/PIWI-1+ stem/progenitor cells. Merged image is to the left, with separated color channels to the right. DAPI is in grey. Scale bars = 20 µm.
Figure 6 with 4 supplements
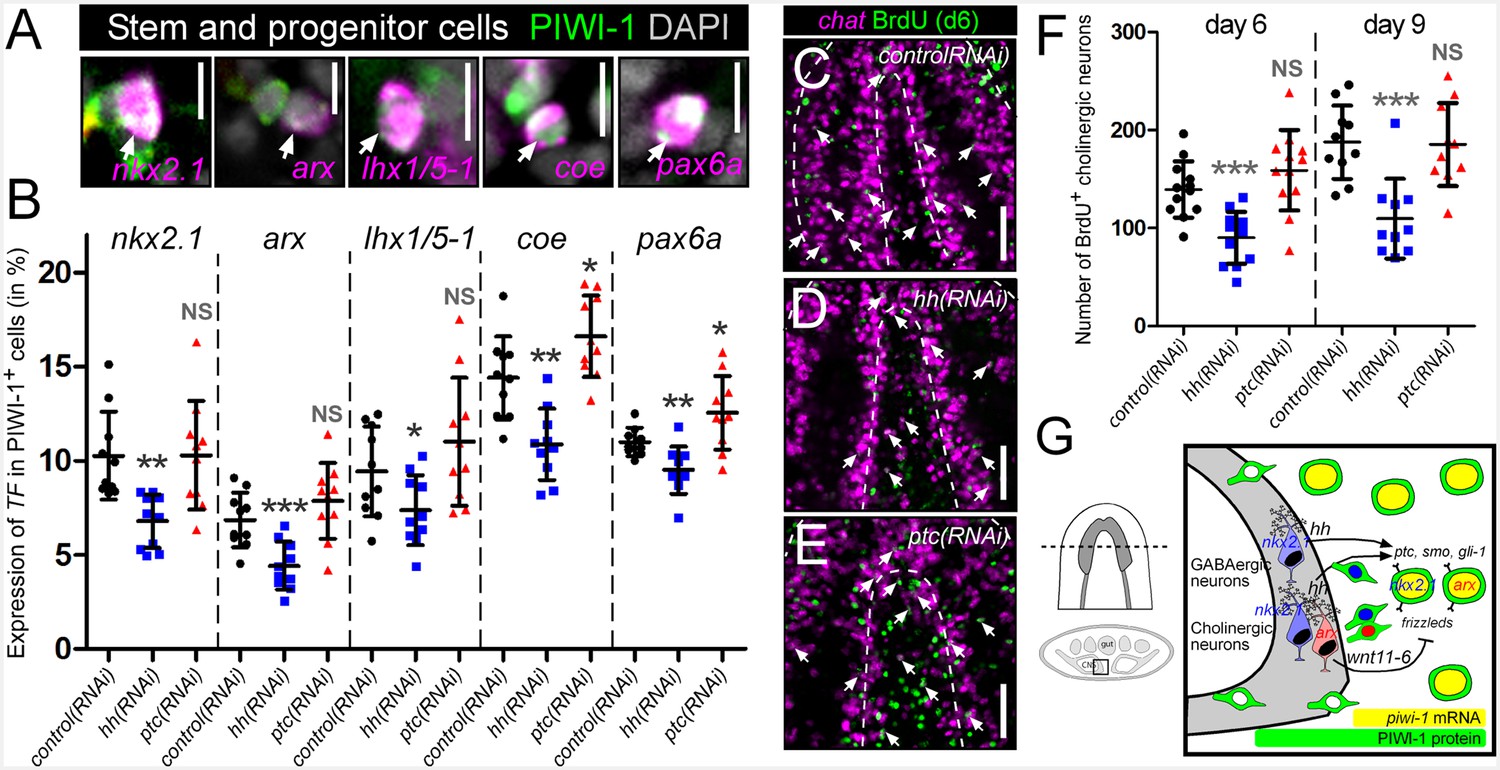
hh signaling regulates homeostatic neurogenesis.
(A) Single confocal plane images displaying examples of neural progenitor cells (white arrow), PIWI-1+ stem/progenitor cells that express neural transcription factors. Scale bar = 10 µM. (B) Quantification of neural progenitor levels in animals with altered levels of hh signaling. Graphs are dot plots measuring the percentage of PIWI-1+ cells that express each neural transcription factor. n = 10, *p<0.05, **p<0.01, ***p<0.001, error bars are standard deviation. (C–E) Single confocal planes displaying newly generated cholinergic neurons in the planarian brain 6 days after a single BrdU pulse (white arrows). Scale bar = 100 µm. (F) Dot plot quantifying the number of new cholinergic neurons. n ≥ 10, ***p<0.001, error bars are standard deviation. (G) Model displaying nkx2.1+ and arx+ neural stem and progenitor cells and the mature neurons that they produce. These same neural cell types also express the hh signaling molecule, which signals back onto adult stem cells, maintaining normal proliferation levels, and homeostatic neurogenesis.
Figure 6—figure supplement 1
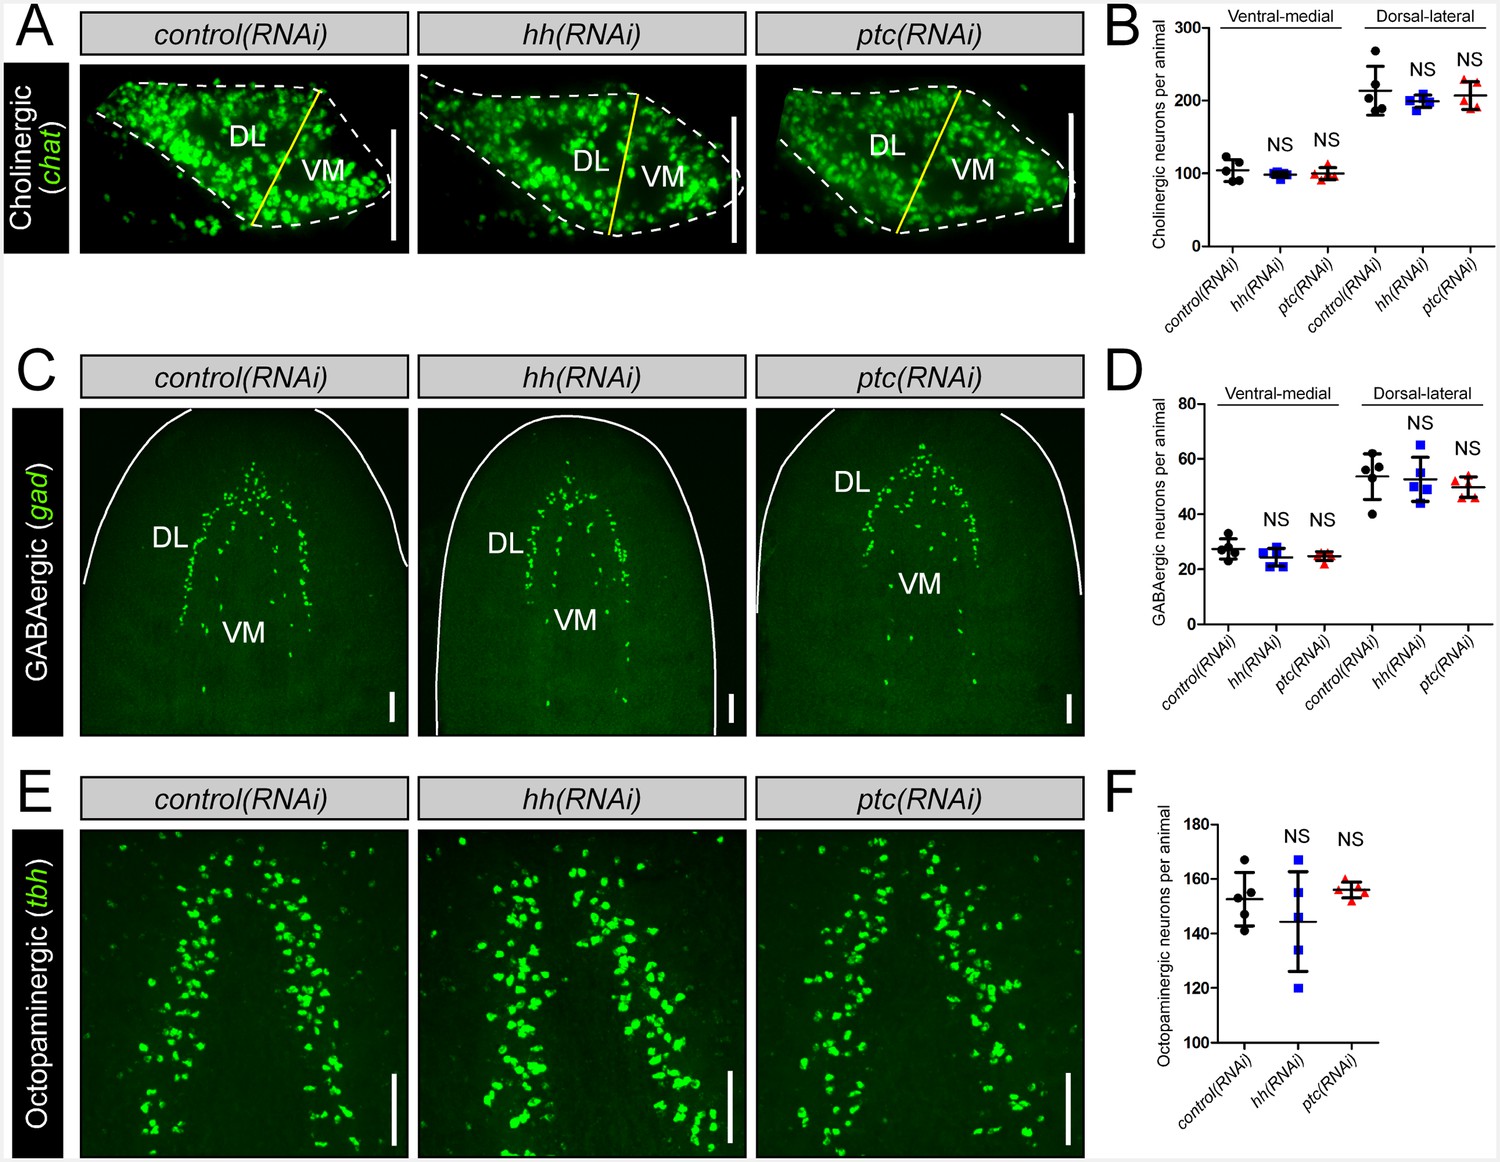
hh signaling levels do not affect existing neuronal subpopulations in the intact brain.
(A) Projected confocal images showing cholinergic neurons from 20 µm – thick recordings, of single brain lobes from transverse sections through the anterior-posterior midpoint of the brain. The plane of division (yellow line) separating the VM and DL brain halves occurs at the naturally occurring dorsal and ventral vertices of the brain lobe. (B) Quantification of cholinergic neurons observed in the VM and DL regions of a single brain lobe. (C) Projected confocal image showing GABAergic neurons. (D) Quantification of VM and DL GABAergic neurons. (E) Projected confocal images showing octopaminergic neurons. (F) Quantification of octopaminergic neurons. All images are from animals subjected to 10 RNAi feedings. Dashed lines represent the outer border of the CNS. Solid white lines represent the outer border of the animal. Scale bars = 100 µm. All graphs are dot plots showing value mean ± standard deviation.
Figure 6—figure supplement 2
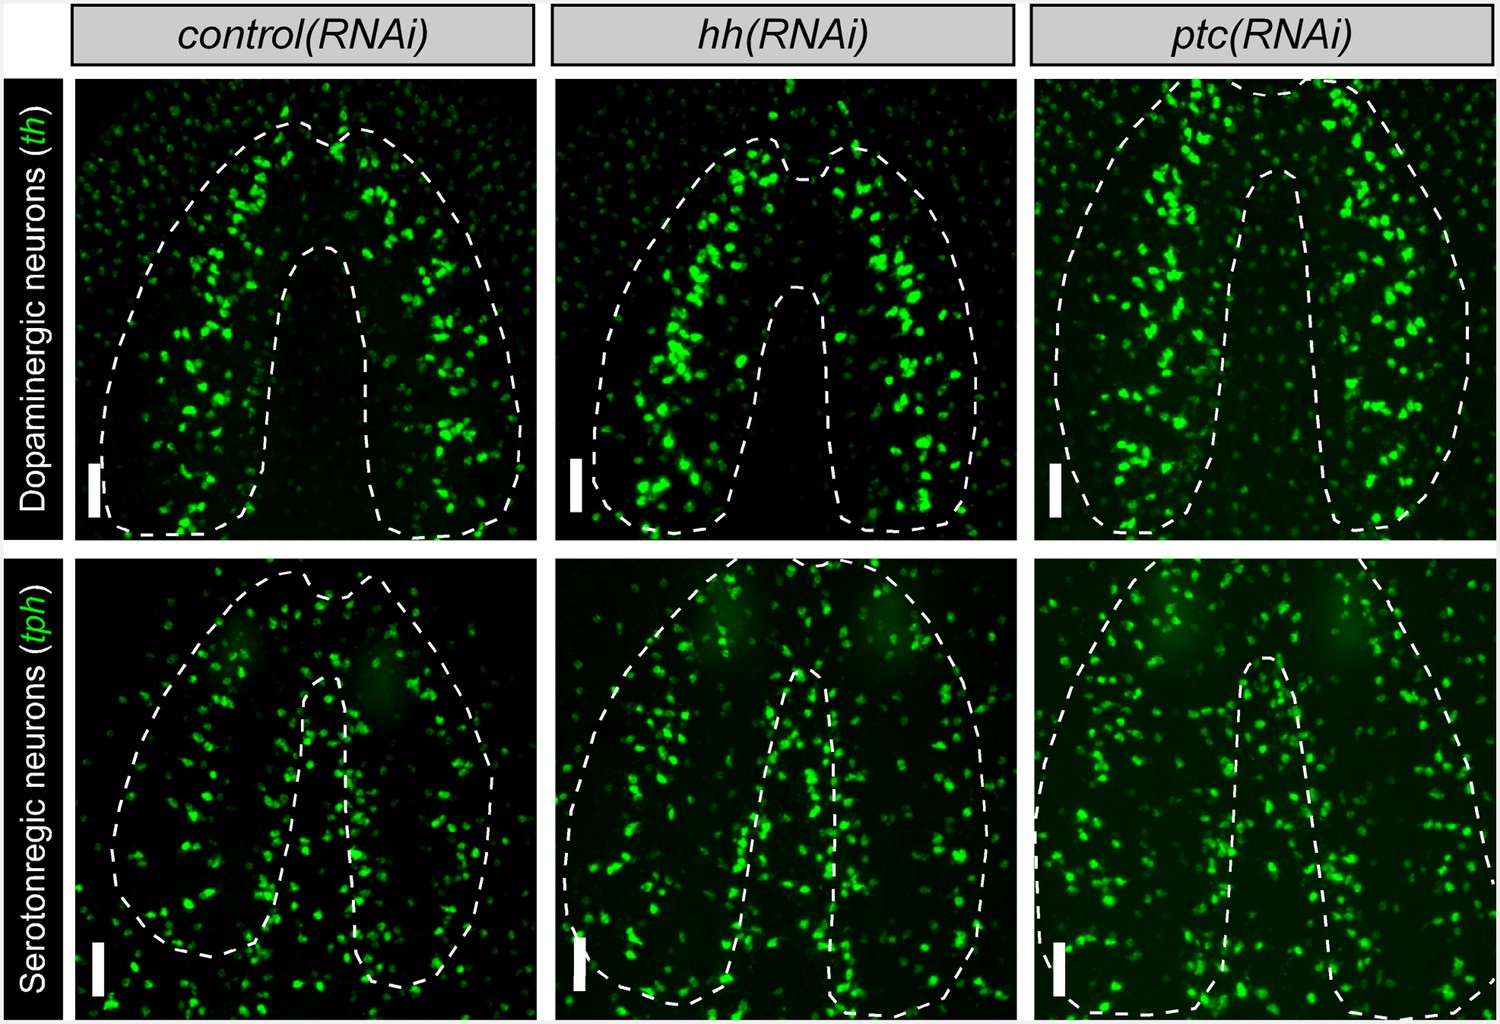
hh signaling levels do not affect existing neuronal subpopulations in the intact brain Projected confocal images showing dopaminergic and serotonergic neurons after six RNAi feedings to knockdown hh or ptc.
Dashed lines represent the outer border of the CNS. Scale bars = 50 µm.
Figure 6—figure supplement 3

hh signaling levels do not affect other planarian progenitor populations.
(A, D, G, J) WISH images showing expression domains of planarian tissue markers for the eye spots (ovo), pharynx (foxA), epidermis (prog-2), and gut (hnf4). (B, E, H, K) Single confocal planes showing tissue specific progenitors after RNAi knockdown of hh or ptc. Region of interest is represented by the white boxes in (A, D, G, and J). Scale bars = 100 µm. (C, F, I, L) Quantification of tissue progenitors after hh or ptc RNAi knockdown. All graphs are dot plots, showing the value mean ± standard deviation. *p<0.05, **p<0.01.
Figure 6—figure supplement 4
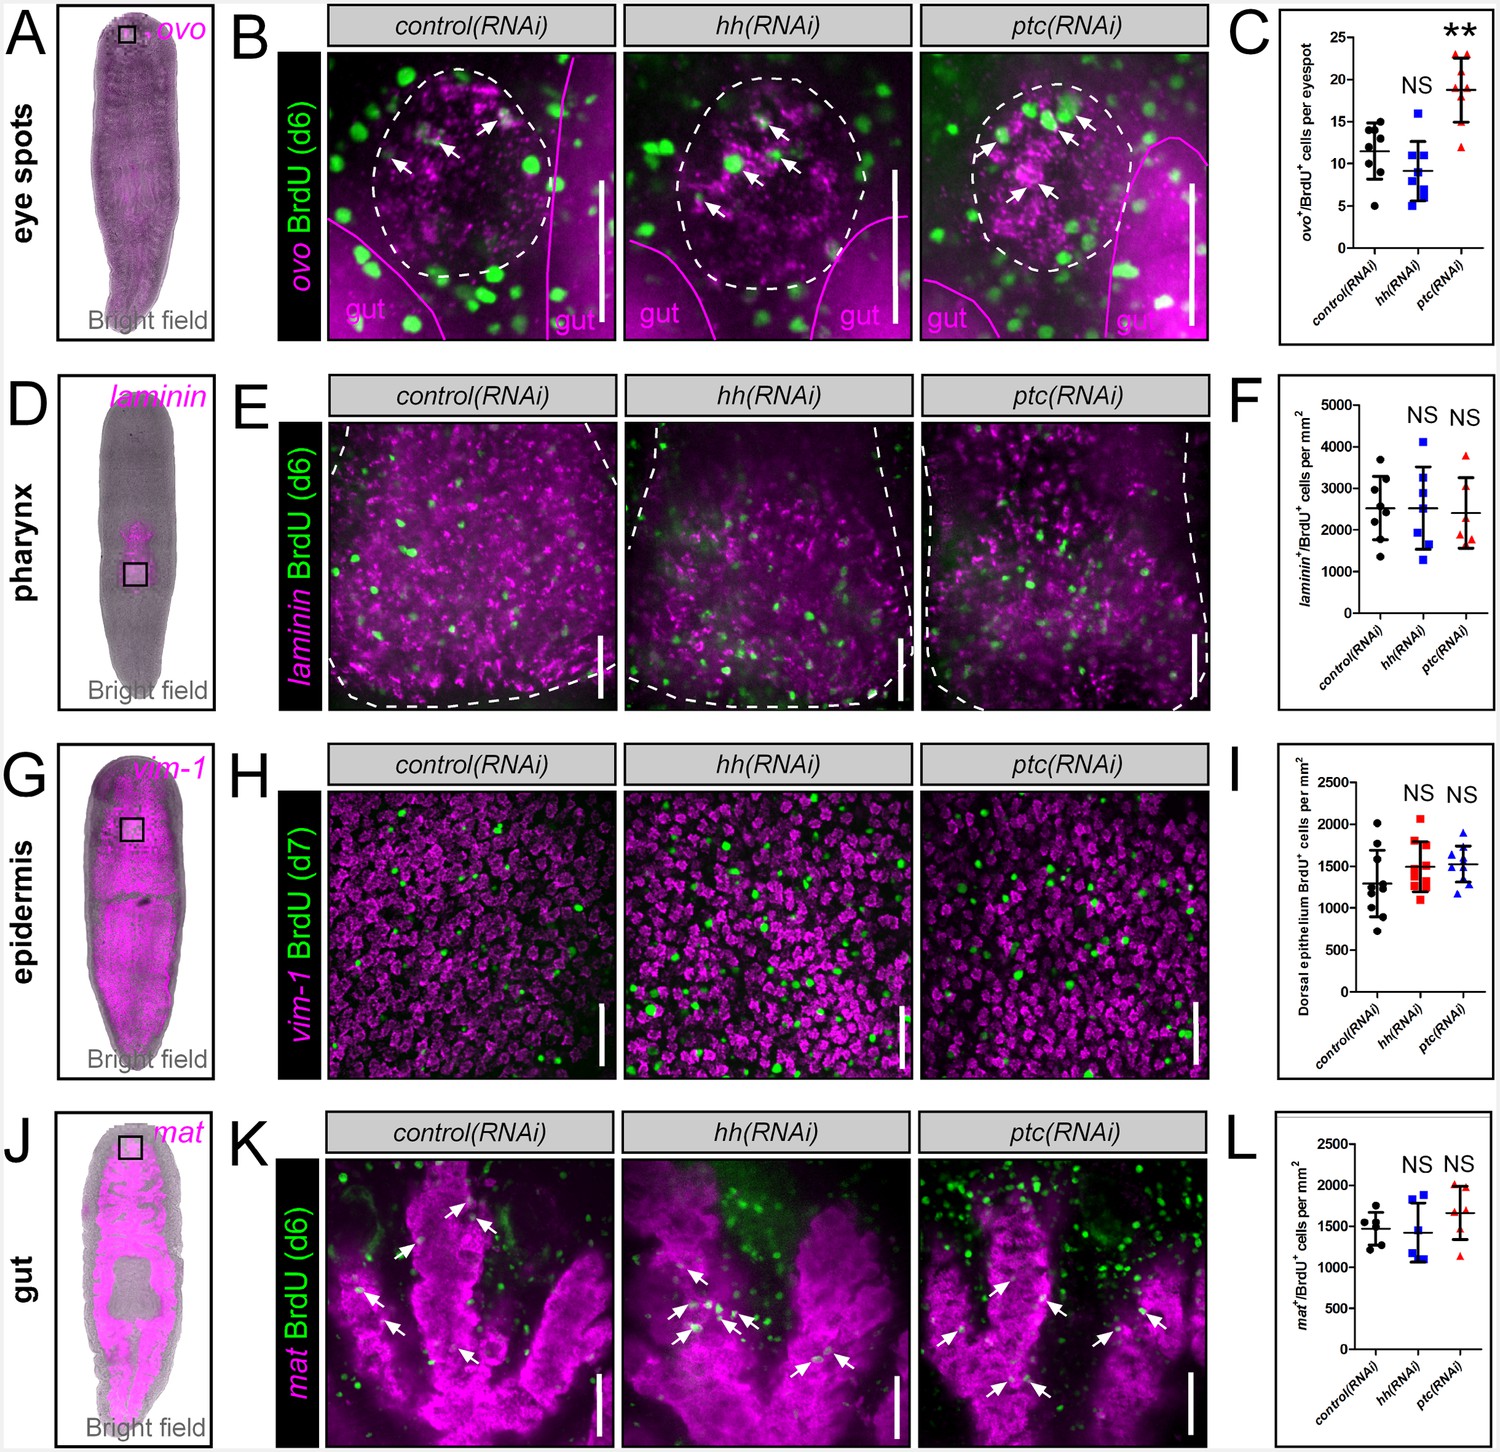
hh signaling levels do not affect BrdU incorporation into other planarian tissues.
(A, D, G, J) WISH images showing expression domains of planarian tissue markers for the eye spots (ovo), pharynx (laminin), epidermis (vim-1), and gut (mat). (B, E, H, K) Single confocal planes showing BrdU incorporation into mature tissues after RNAi knockdown of hh or ptc. Region of interest is represented by the white boxes in (A, D, G, and J). Scale bars = 100 µm. (C, F, I, L) Quantification of BrdU incorporation after hh or ptc RNAi knockdown. All graphs are dot plots, showing the value mean ± standard deviation. **p<0.01.
Videos
Video 1
Control(RNAi) worms exhibiting normal locomotion and ability to flip over from dorsal surface back onto ventral surface.
https://doi.org/10.7554/eLife.19735.003
Video 2
nkx2.1(RNAi) worms exhibiting abnormal behaviors, including tonic muscular contractions.
https://doi.org/10.7554/eLife.19735.004
Video 3
arx(RNAi) worms exhibiting abnormal muscular contractions and inability to flip back onto dorsal surface.
https://doi.org/10.7554/eLife.19735.005Download links
A two-part list of links to download the article, or parts of the article, in various formats.
Downloads (link to download the article as PDF)
Open citations (links to open the citations from this article in various online reference manager services)
Cite this article (links to download the citations from this article in formats compatible with various reference manager tools)
Neuronal sources of hedgehog modulate neurogenesis in the adult planarian brain
eLife 5:e19735.
https://doi.org/10.7554/eLife.19735


