Compact and highly active next-generation libraries for CRISPR-mediated gene repression and activation
- University of California, San Francisco, United States
- University of California, Berkeley, United States
- University of California, San Francisco, United states
Figures
Figure 1 with 2 supplements

A machine learning approach for identifying highly active sgRNAs for CRISPRi.
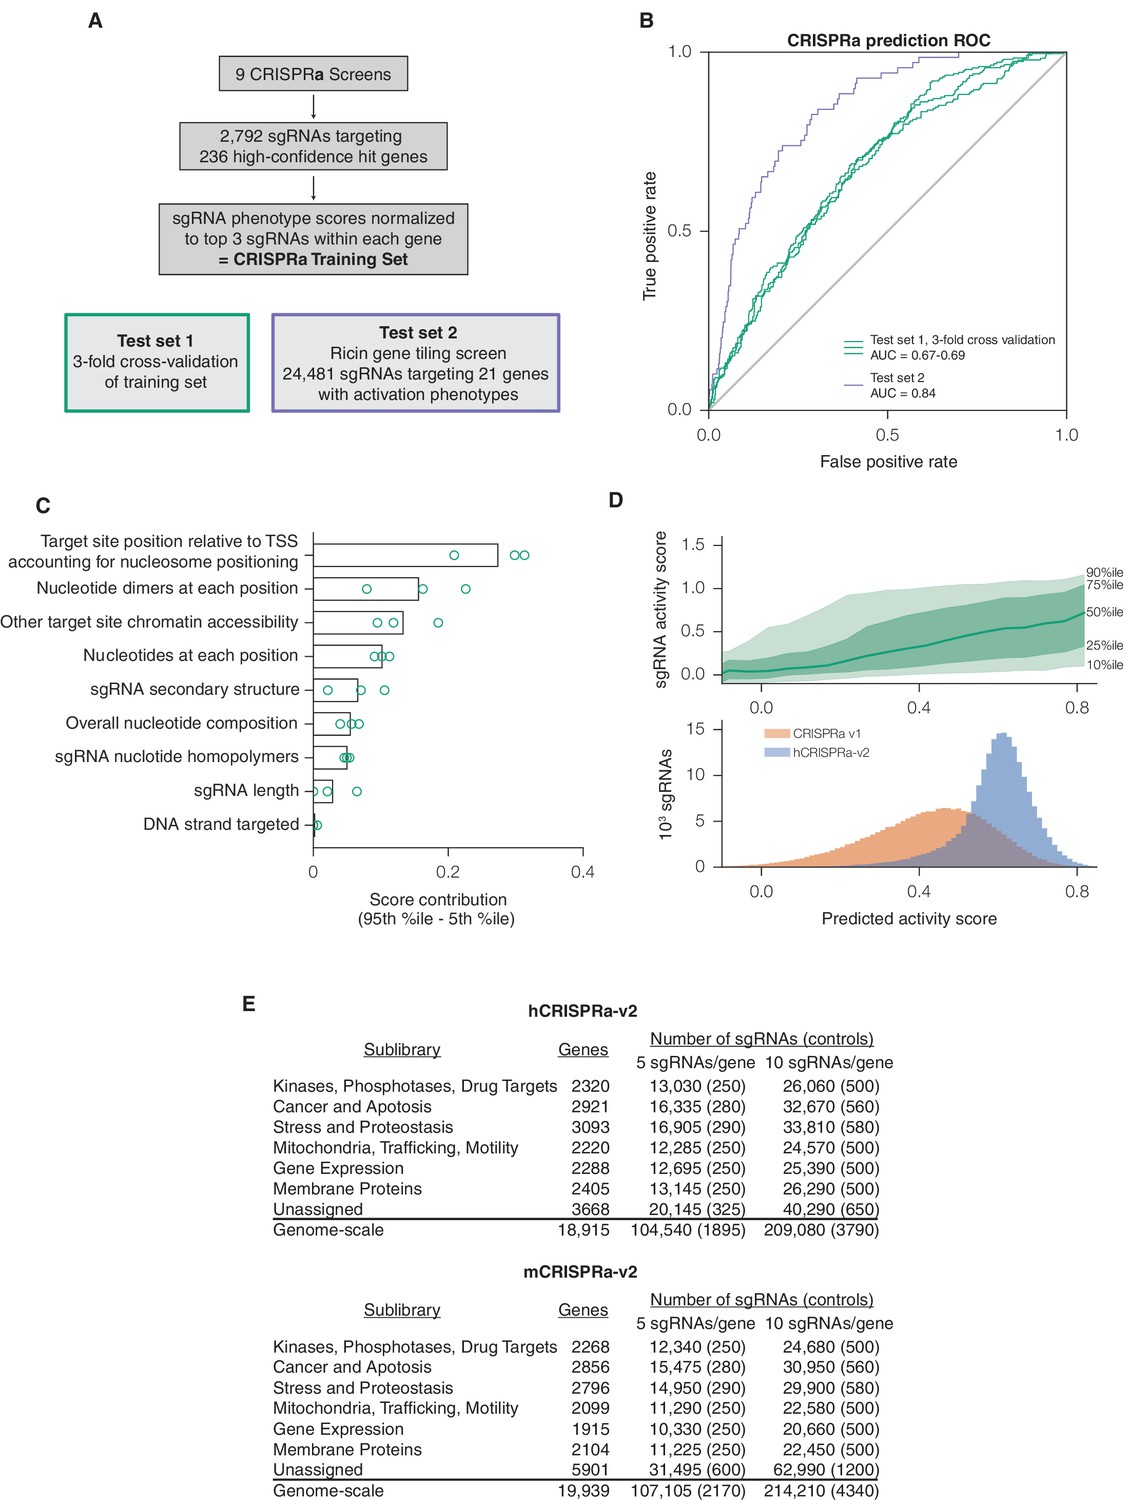
(A) Schematic of machine learning strategy and datasets. 808 features were calculated for each sgRNA, linearized as indicated, and z-standardized. A linear regression model was then generated using these features to fit to the activity scores of the CRISPRi training set (Horlbeck et al., 2016). 20% of the genes in the training set were reserved to test the predictive value of the resulting model. For display in Figures 1B,C, and Figure 1—figure supplement 2, five non-overlapping 20% datasets were randomly selected and training was performed on the corresponding 80% sets. An orthogonal dataset, based on tiling of every possible sgRNA within 10 kb of the TSS of 49 genes known to modulate sensitivity to ricin (Bassik et al., 2013; Gilbert et al., 2014), was also used to assess the predictive value of this model. (B) ROC analysis of the ability of the machine learning approach in (A) to predict highly active sgRNAs. For test set 1, sgRNAs with an activity score greater than 0.75 were considered highly active. For test set 2, sgRNAs with a phenotype greater than 0.75 of the maximum phenotype for each gene were considered highly active. (C) Relative contribution of feature categories to the sgRNA predicted scores. The individual weighting of each feature assigned by the linear regression model (see Figure 2—figure supplement 2) was grouped by the indicated categories, and the summed weights for each sgRNA within the 20% test datasets was calculated. The scores of the 95th and 5th percentile sgRNAs were subtracted to compute the overall contribution of the feature category to the distribution of predicted activity scores. Bars indicate the mean of the contributions from five 20% datasets (green circles). The target site position includes both the distance to the TSS and the periodic relationship as fit by SVR (Figure 1—figure supplement 1). (D) Distribution of predicted activity scores in next-generation CRISPRi libraries. (Top) Predicted CRISPRi activity correlates with empirical activity scores. For the 80%/20% division used to predict sgRNAs for the hCRISPRi-v2.1 library, predicted scores for the 20% test set were plotted against the empirical activity score. Activity score percentiles are from all sgRNAs within 0.25 of the indicated activity score. Predicted activity was highly correlated with activity, with a Pearson R of 0.56 (p<10–296). (Bottom) Distribution of predicted activity scores for CRISPRi v1, hCRISPRi-v2, and hCRISPRi-v2.1, as calculated by the hCRISPRi-v2.1 regression model. (E) Composition of hCRISPRi-v2 and mCRISPRi-v2 sublibraries.
Figure 1—figure supplement 1
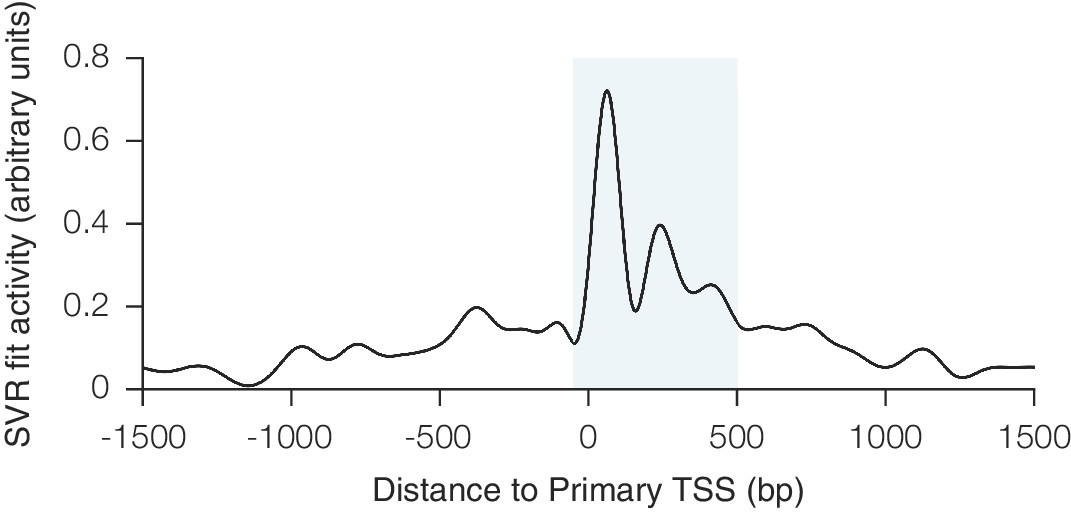
Relationship between CRISPRi activity and sgRNA position relative to the TSS as predicted by SVR.
An SVR model with radial basis function kernel was trained on an 80% division of the CRISPRi activity score dataset, using the position of the sgRNA relative to the upstream end of the primary FANTOM TSS for each gene as the sole feature. Hyperparameter values for SVR were selected automatically using cross-validation within the training set. To display the relationship between sgRNA position and CRISPRi activity fit by this model, predicted scores were generated for each position within a 3 kb window around the TSS. The resulting curve recapitulated the previously observed periodic relationship shown to be out-of-phase with nucleosome positioning (Horlbeck et al., 2016), and use of this SVR model within the general machine learning approach enabled regression against this highly complex relationship. The shaded area indicates the region relative to the TSS where predicted activity scores for all sgRNAs were calculated for potential inclusion in the construction of the hCRISPRi-v2(.1) and mCRISPRi-v2 library designs.
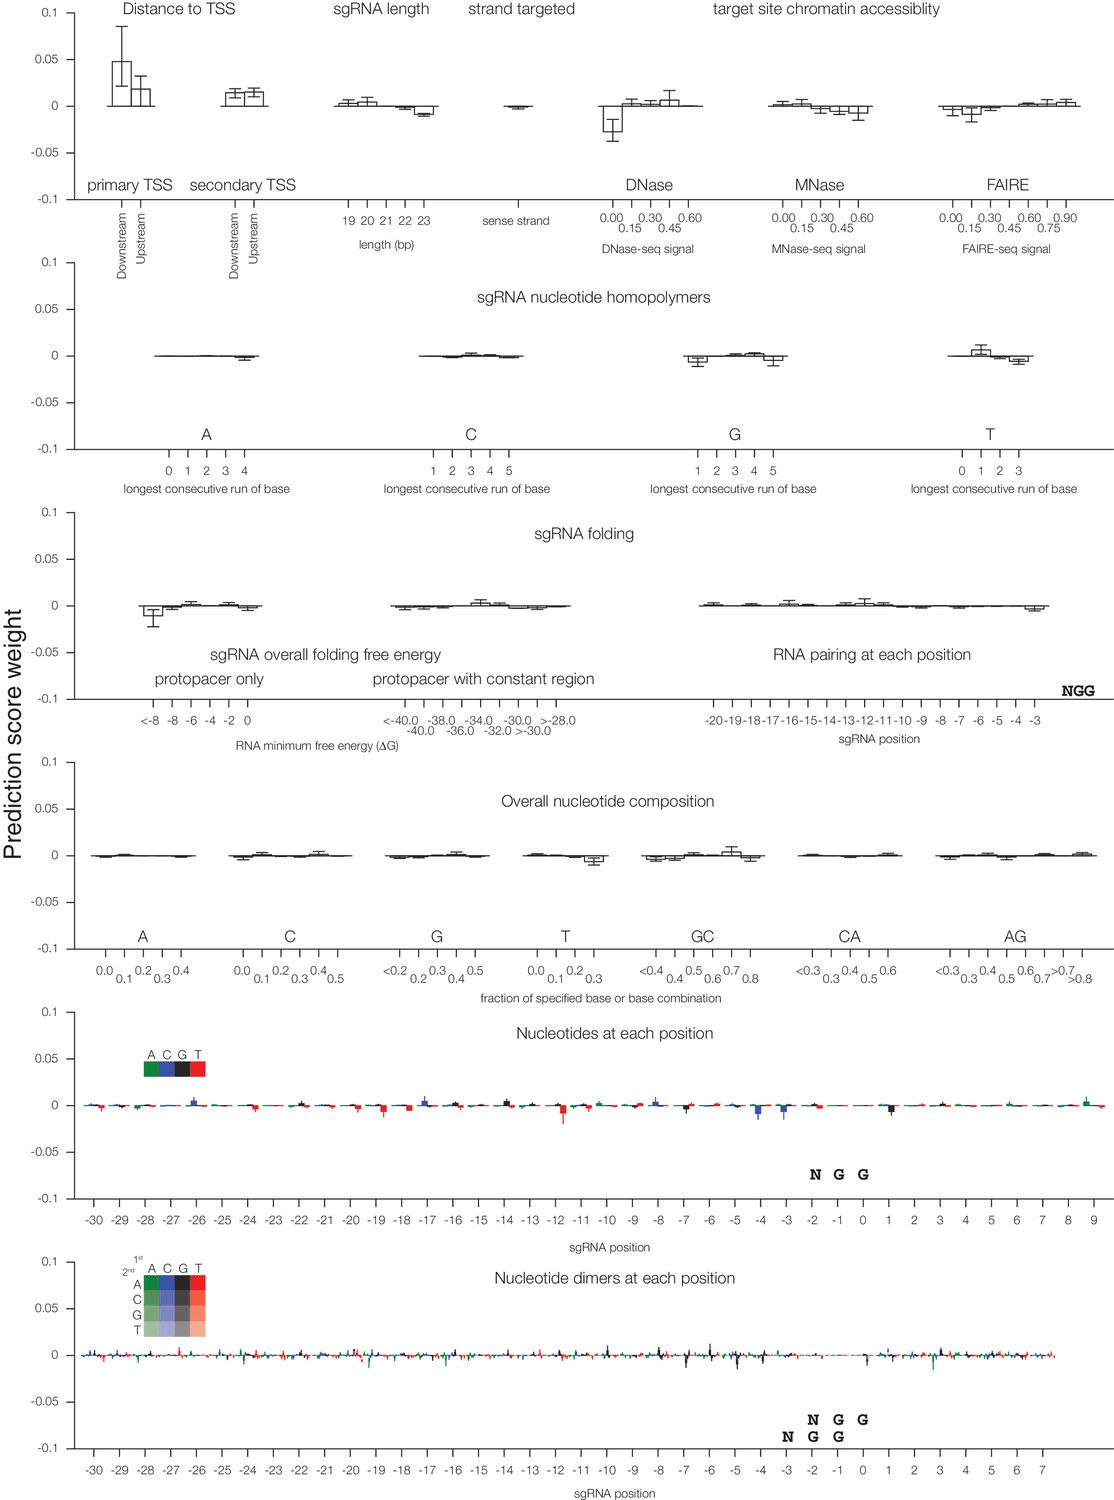
Figure 1—figure supplement 2
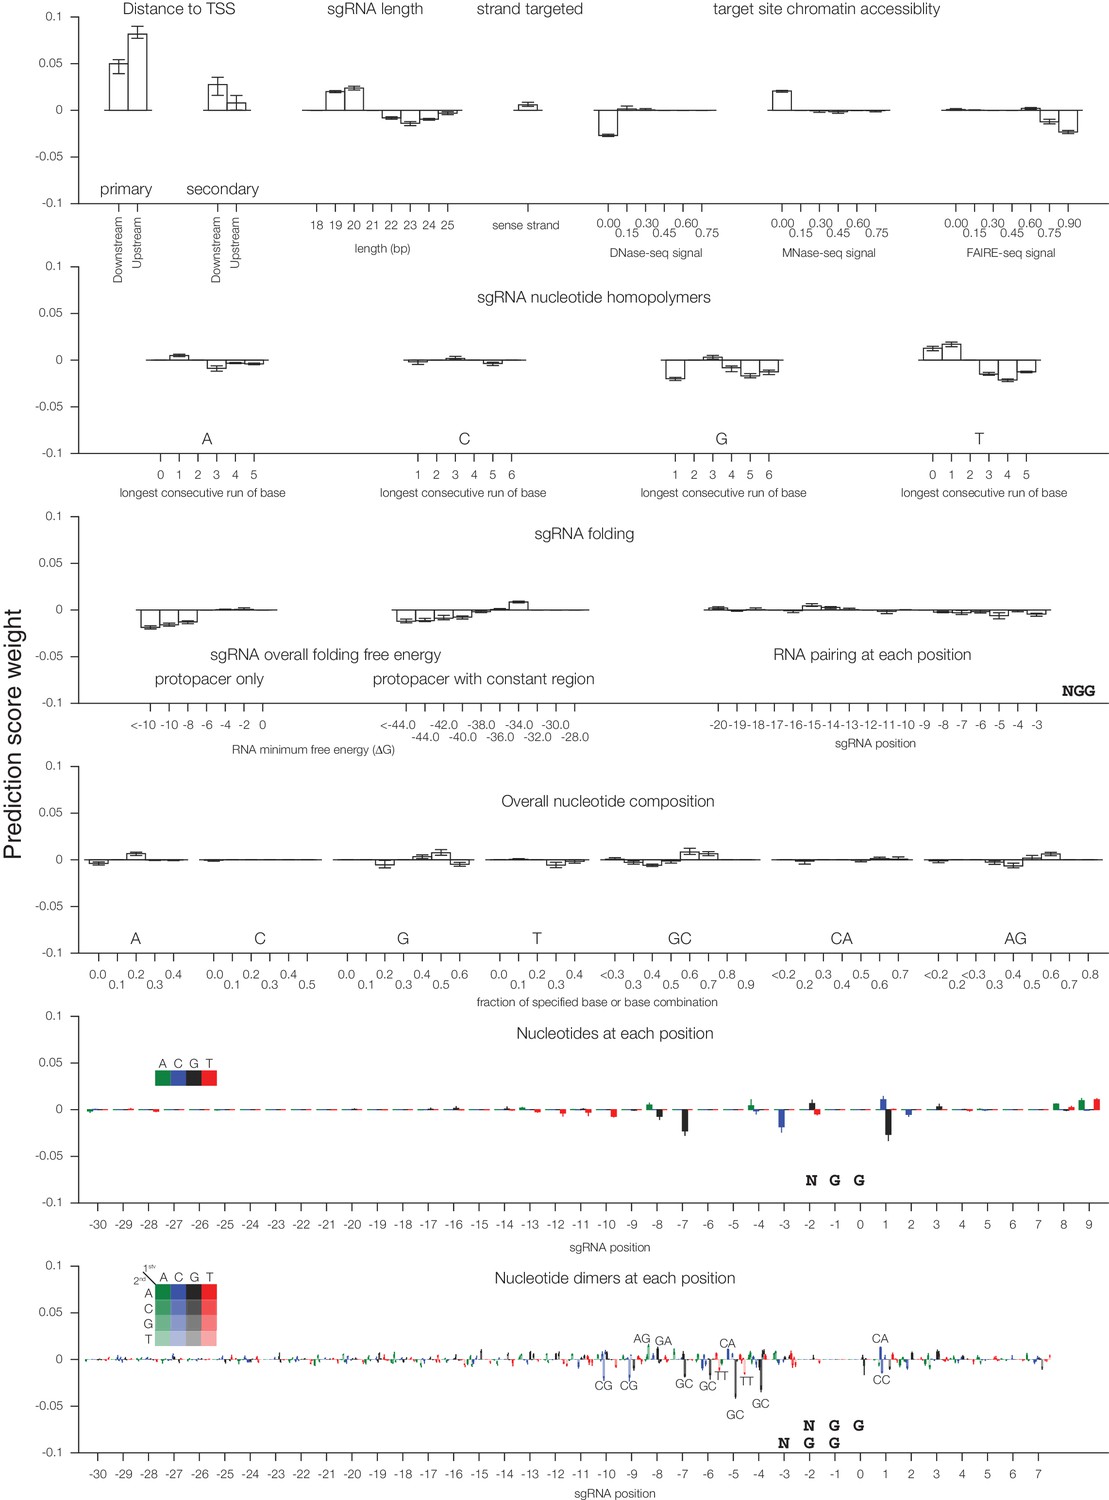
Individual sgRNA feature contributions to predicted CRISPRi activity.
Linear regression coefficients for each model trained according to the 80%/20% divisions displayed in Figure 1 are displayed, with bars indicating the mean of the five divisions and error bars indicating minimum and maximum feature coefficients. As each feature was z-standardized before linear regression, coefficients are directly comparable. For binned feature categories, x-axis values represent the minimum value of the bin (inclusive) unless otherwise indicated.
Figure 2 with 2 supplements
A machine learning approach for identifying highly active sgRNAs for CRISPRa.
(A) Schematic of CRISPRa datasets. CRISPRa activity scores were generated from screen data and subjected to 3-fold cross-validation due to the smaller sample size. Ricin tiling data was limited to 21 genes that were previously shown to modulate sensitivity to ricin upon CRISPRa overexpression (Gilbert et al., 2014). (B) ROC analysis of machine learning approach using CRISPRa datasets, conducted as in Figure 1B. (C) Relative contribution of feature categories for CRISPRa, calculated as in Figure 1C. (D) Distribution of predicted activity scores in next-generation CRISPRa libraries. (Top) Predicted CRISPRa activity correlates with empirical activity scores. For the 67%/33% division used to predict sgRNAs for the hCRISPRa-v2 library, predicted scores for the 33% test set were plotted against the empirical activity score. Activity score percentiles are from all sgRNAs within 0.25 of the indicated activity score. Predicted activity was highly correlated with activity, with a Pearson R of 0.41 (p<10–38). (Bottom) Distribution of predicted activity scores for CRISPRa v1 and hCRISPRa-v2 as calculated by the hCRISPRa-v2 regression model. (E) Composition of hCRISPRa-v2 and mCRISPRa-v2 sublibraries.
Figure 2—figure supplement 1
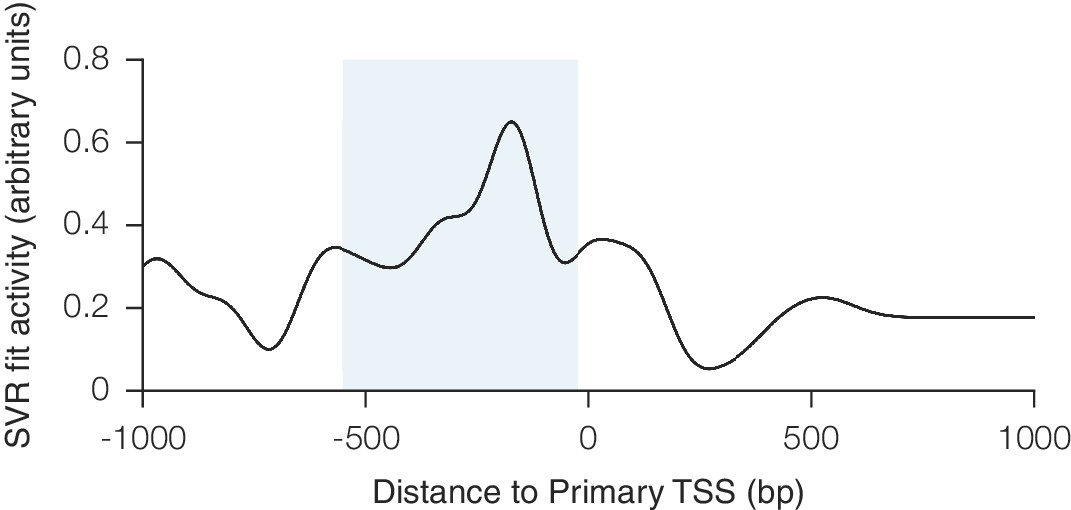
Relationship between CRISPRa activity and sgRNA position relative to the TSS as predicted by SVR.
An SVR model was trained on a 67% division of the CRISPRa dataset using sgRNA position relative to the downstream end of the primary FANTOM TSS for each gene. Analysis was conducted as described for Figure 1—figure supplement 1. The shaded area indicates the region relative to the TSS where predicted activity scores for all sgRNAs were calculated for potential inclusion in the construction of the hCRISPRa-v2 and mCRISPRa-v2 library designs.
Figure 2—figure supplement 2
Individual sgRNA feature contributions to predicted CRISPRa activity.
Linear regression coefficients for each model trained according to the 67%/33% divisions displayed in Figure 2 are displayed, with bars indicating the mean of the three divisions and error bars indicating minimum and maximum feature coefficients. As each feature was z-standardized before linear regression, coefficients are directly comparable. For binned feature categories, x-axis values represent the minimum value of the bin (inclusive) unless otherwise indicated.
Figure 3 with 2 supplements

hCRISPRi-v2 outperforms CRISPRi v1 in screens for essential genes in K562.
(A) Distribution and predicted scores for sgRNAs targeting essential genes. (Top) Predicted activity scores for sgRNAs from Evers et al., 2016 or hCRISPRi-v2 targeting essential genes as defined by Evers et al. (Evers et al., 2016), binned in increments of 0.1. (Bottom) sgRNA growth phenotypes of the sgRNAs in the above bins, z-standardized to the distribution of sgRNAs targeting Evers et al. non-essential genes. (B) ROC analysis of sgRNAs from CRISPRi v1 or hCRISPRi-v2 targeting essential and non-essential genes. sgRNAs were ranked by γ, and considered true or false positives if they targeted essential or non-essential genes, respectively, as defined by Evers et al. (C) Volcano plots of gene phenotypes and p-values for growth screens performed with CRISPRi v1 (Gilbert et al., 2014) and hCRISPRi-v2. For each screen, genes phenotypes were calculated by averaging the growth phenotype (γ) of the 3 sgRNAs with the strongest γ by absolute value, and gene p-values were calculated by performing the Mann-Whitney test comparing all sgRNAs targeting the gene to the full set of negative control sgRNAs. For genes with multiple TSSs targeted, sgRNAs were grouped by TSS and the TSS with the lowest p-value was used for downstream analysis. A comparable number of negative control (NC) genes were generated by randomly sampling 10 non-targeting sgRNAs (with replacement) and analyzed as true genes. Empirically derived thresholds (dashed lines) were calculated as shown, using the NC gene distribution to derive the background standard deviation for z-score. (D) Precision-recall analysis of essential gene screens performed in K562. Statistical precision and recall of essential and non-essential gene sets (Hart et al., 2014) were calculated for genes ranked by growth phenotype in K562. For both CRISPRi and CRISPR nuclease screens (Wang et al., 2015), gene-level phenotypes were calculated as the average log2 fold-change of all sgRNAs targeting the gene (termed CRISPR Scores in ref. [Wang et al., 2015]). (E) Boxplots of CRISPRi and CRISPR nuclease sgRNA phenotypes for several gene sets. sgRNA γ scores (CRISPRi) or log2 enrichments (nuclease) were z-standardized to the corresponding negative control set. Boxplots display the distribution of the negative control sgRNAs or sgRNAs targeting genes on Y chromosome (excluding pseudo-autosomal genes), within the BCR amplicon, or in the gold standard essential sets used in (D). Individual phenotypes for sgRNAs targeting BCR are overlaid with the corresponding boxplot.
Figure 3—figure supplement 1

sgRNA phenotypes from CRISPRi v1 and hCRISPRi-v2 growth screens.
(A) hCRISPRi-v2 sgRNA phenotypes correlate between screen replicates. sgRNA γ scores were calculated by computing log2 enrichments of read counts between screen start and endpoint samples and normalizing by estimated cell doublings over the course of the screen. Phenotypes for non-targeting sgRNAs and sgRNAs targeting the Y chromosome generally do not correlate between screen replicates; Spearman R = 0.08 (p<10–7) and R = 0.05 (p=0.5), respectively. (B) Histograms of growth phenotypes (γ) for sgRNAs used in the analysis in Figure 3B. Percentages indicate number of essential-targeting sgRNAs with negative γ more than two standard deviations from the mean of the non-essential-targeting sgRNAs. (C) UCSC Genome Browser tracks depicting Ensembl and FANTOM annotations for example gene VCP. CRISPRi v1 sgRNAs were chosen to be −50 bp to 300 bp relative to the 5’ end of the VCP transcript model. hCRISPRi-v2 sgRNAs were the top predicted sgRNAs chosen from all sites −25 bp to 500 bp relative to the 'p1@VCP' and 'p2@VCP' FANTOM TSS annotation. FANTOM annotations were generated from CAGE sequencing of over 800 human cell types and tissues, summarized by the maximum CAGE sequencing counts track.
Figure 3—figure supplement 2
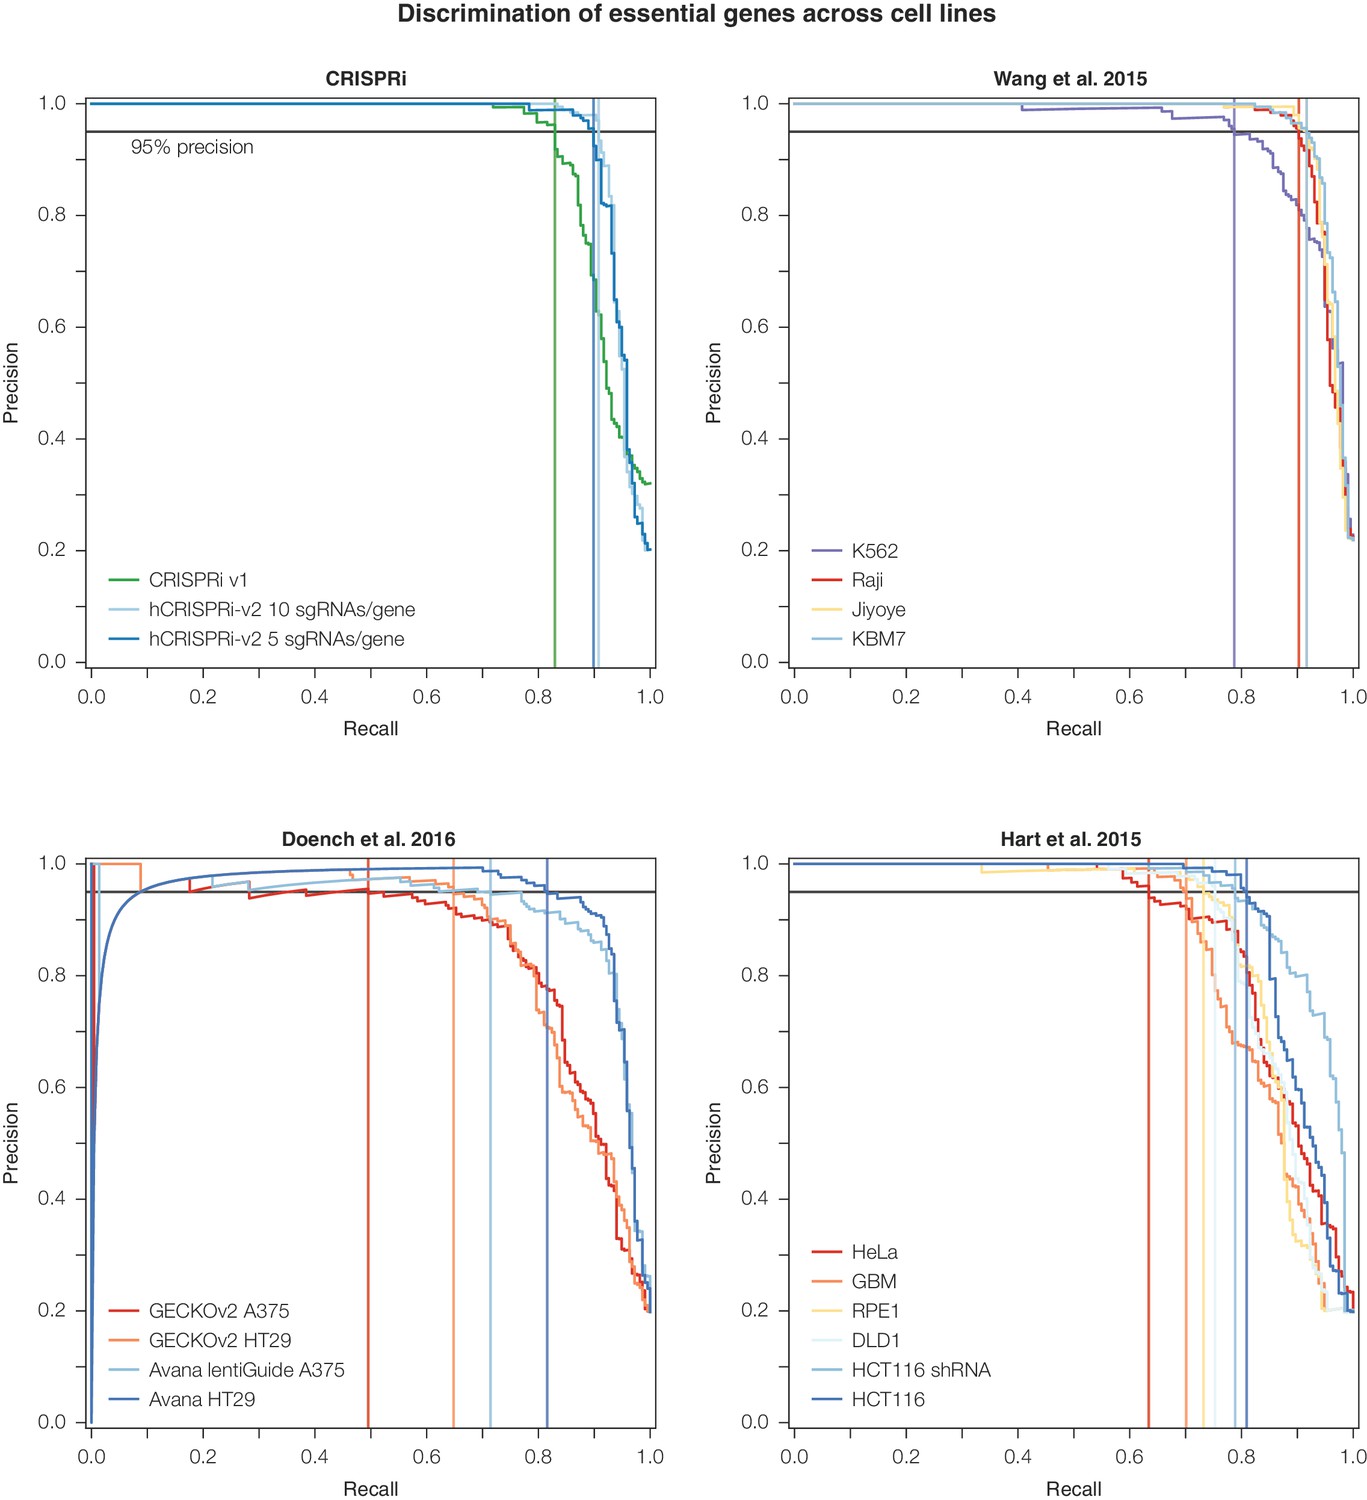
Precision-recall analysis of second-generation CRISPR nuclease essential gene screens.
Analysis was conducted as in Figure 3D. CRISPRi, Wang et al., and Doench et al. datasets were ranked according to the average log2 fold-change of all sgRNAs targeting a given gene. For Hart et al., genes were ranked according to their published Bayes Factor scores as sgRNA-level data was unavailable (Doench et al., 2016; Hart et al., 2015; Wang et al., 2015).
Figure 4 with 1 supplement
hCRISPRa-v2 outperforms CRISPRa v1 in screens for genes that modify growth rates upon overexpression.
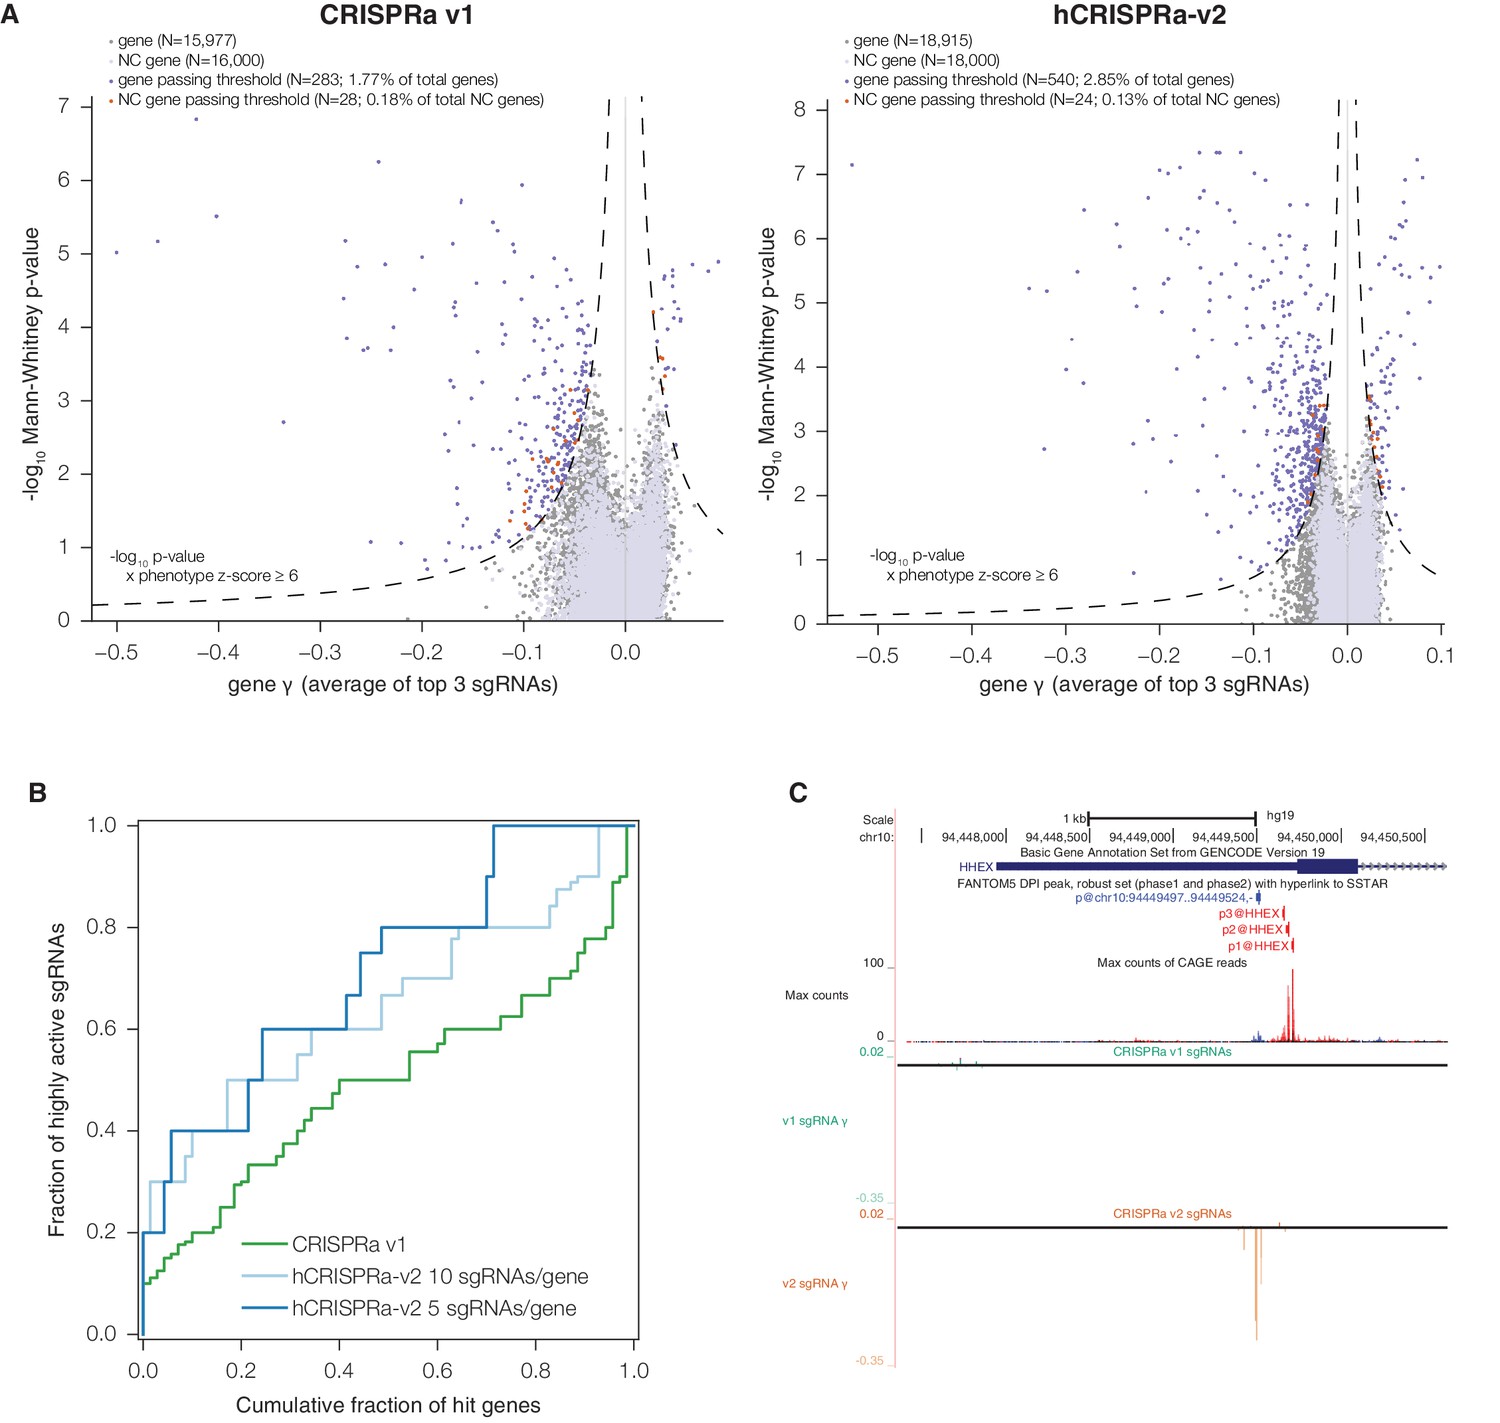
(A) Volcano plots of gene phenotypes and p-values for growth screens performed with CRISPRa v1 (Gilbert et al., 2014) and hCRISPRa-v2, presented as in Figure 3C. (B) Cumulative distributions of fraction of highly active sgRNAs targeting strong hit genes shared between CRISPRa v1 and hCRISPRa-v2 screens. Highly active sgRNAs for CRISPRa were defined as those with negative γ scores more than two standard deviations from the mean of non-targeting control sgRNAs (see Figure 4—figure supplement 1D). (C) UCSC Genome Browser tracks depicting TSS annotations and CRISPRa growth phenotypes for example gene HHEX.
Figure 4—figure supplement 1
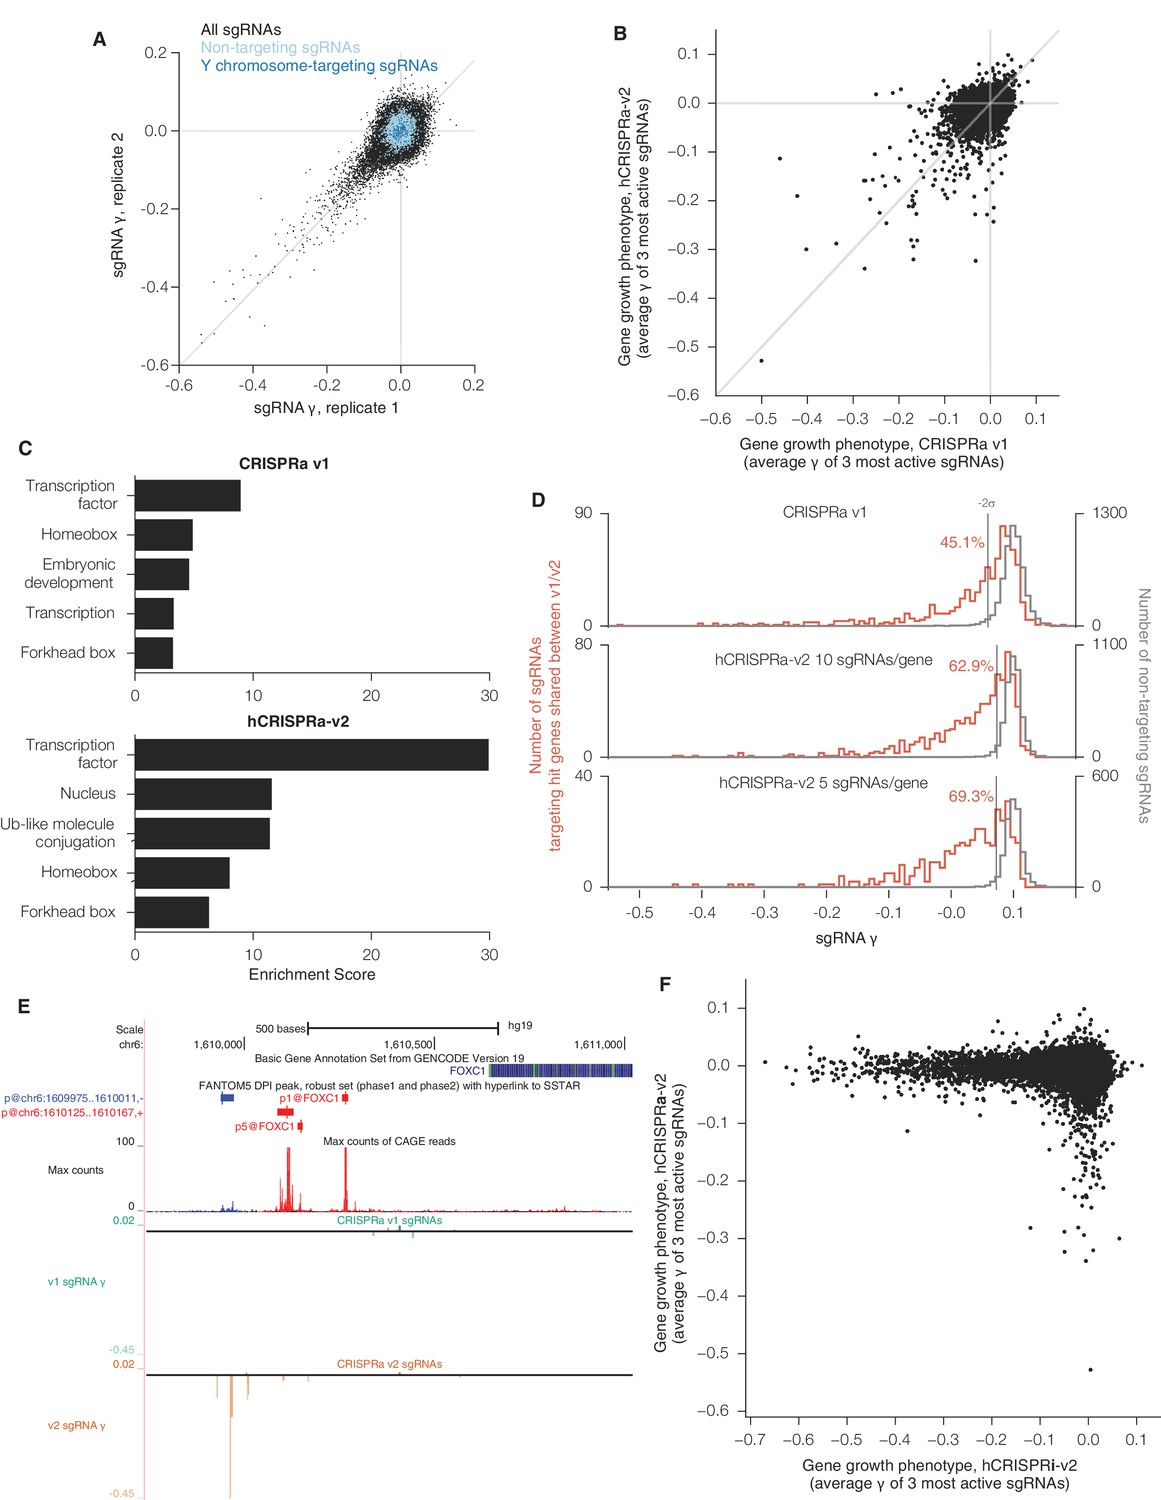
sgRNA phenotypes and gene category enrichment scores from CRISPRa v1 and hCRISPRa-v2 growth screens.
(A) hCRISPRa-v2 sgRNA phenotypes correlate between screen replicates, presented as in Figure 3—figure supplement 1A. Phenotypes for non-targeting sgRNAs and sgRNAs targeting the Y chromosome correlate poorly between screen replicates; Spearman R = 0.10 (p<10–8) and R = 0.15 (p=0.05), respectively. (B) Comparison of CRISPRa v1 and hCRISPRa-v2 gene growth phentoypes (γ). (C) DAVID enrichment scores for hit gene categories from CRISPRa v1 and hCRISPRa-v2 screens. CRISPRa v1 categories represent the top 5 categories identified. hCRISPRa-v2 categories include the top 3 identified along with homeobox and forkhead box categories. (D) Histograms of growth phenotypes (γ) for sgRNAs used in the analysis in Figure 4B. Percentages indicate number of sgRNAs targeting v1 and v2 shared hit genes with negative γ more than two standard deviations from the mean of the non-targeting control sgRNAs. (E) UCSC Genome Browser tracks depicting TSS annotations and CRISPRa growth phenotypes for example gene FOXC1. (F) Comparison of hCRISPRi-v2 and hCRISPRa-v2 gene growth phenotypes (γ).
Additional files
-
Supplementary file 1
CRISPRi and CRISPRa activity score datasets.
- https://doi.org/10.7554/eLife.19760.013
-
Supplementary file 2
TSS annotations for hg19 and mm10 genomes.
- https://doi.org/10.7554/eLife.19760.014
-
Supplementary file 3
Library composition of hCRISPRi-v2 and hCRISPRi-v2.1.
- https://doi.org/10.7554/eLife.19760.015
-
Supplementary file 4
Library composition of mCRISPRi-v2.
- https://doi.org/10.7554/eLife.19760.016
-
Supplementary file 5
Library composition of hCRISPRa-v2.
- https://doi.org/10.7554/eLife.19760.017
-
Supplementary file 6
Library composition of mCRISPRa-v2.
- https://doi.org/10.7554/eLife.19760.018
-
Supplementary file 7
sgRNA read counts and growth phenotypes for hCRISPRi-v2 screens performed in K562.
- https://doi.org/10.7554/eLife.19760.019
-
Supplementary file 8
Gene growth phenotypes and p-values for hCRISPRi-v2 screens performed in K562.
- https://doi.org/10.7554/eLife.19760.020
-
Supplementary file 9
sgRNA read counts and growth phenotypes for hCRISPRa-v2 screens performed in K562.
- https://doi.org/10.7554/eLife.19760.021
-
Supplementary file 10
Gene growth phenotypes and p-values for hCRISPRa-v2 screens performed in K562.
- https://doi.org/10.7554/eLife.19760.022
Download links
A two-part list of links to download the article, or parts of the article, in various formats.
Downloads (link to download the article as PDF)
Open citations (links to open the citations from this article in various online reference manager services)
Cite this article (links to download the citations from this article in formats compatible with various reference manager tools)
Compact and highly active next-generation libraries for CRISPR-mediated gene repression and activation
eLife 5:e19760.
https://doi.org/10.7554/eLife.19760


