An essential cell-autonomous role for hepcidin in cardiac iron homeostasis
- University of Oxford, United Kingdom
Figures
Figure 1 with 6 supplements
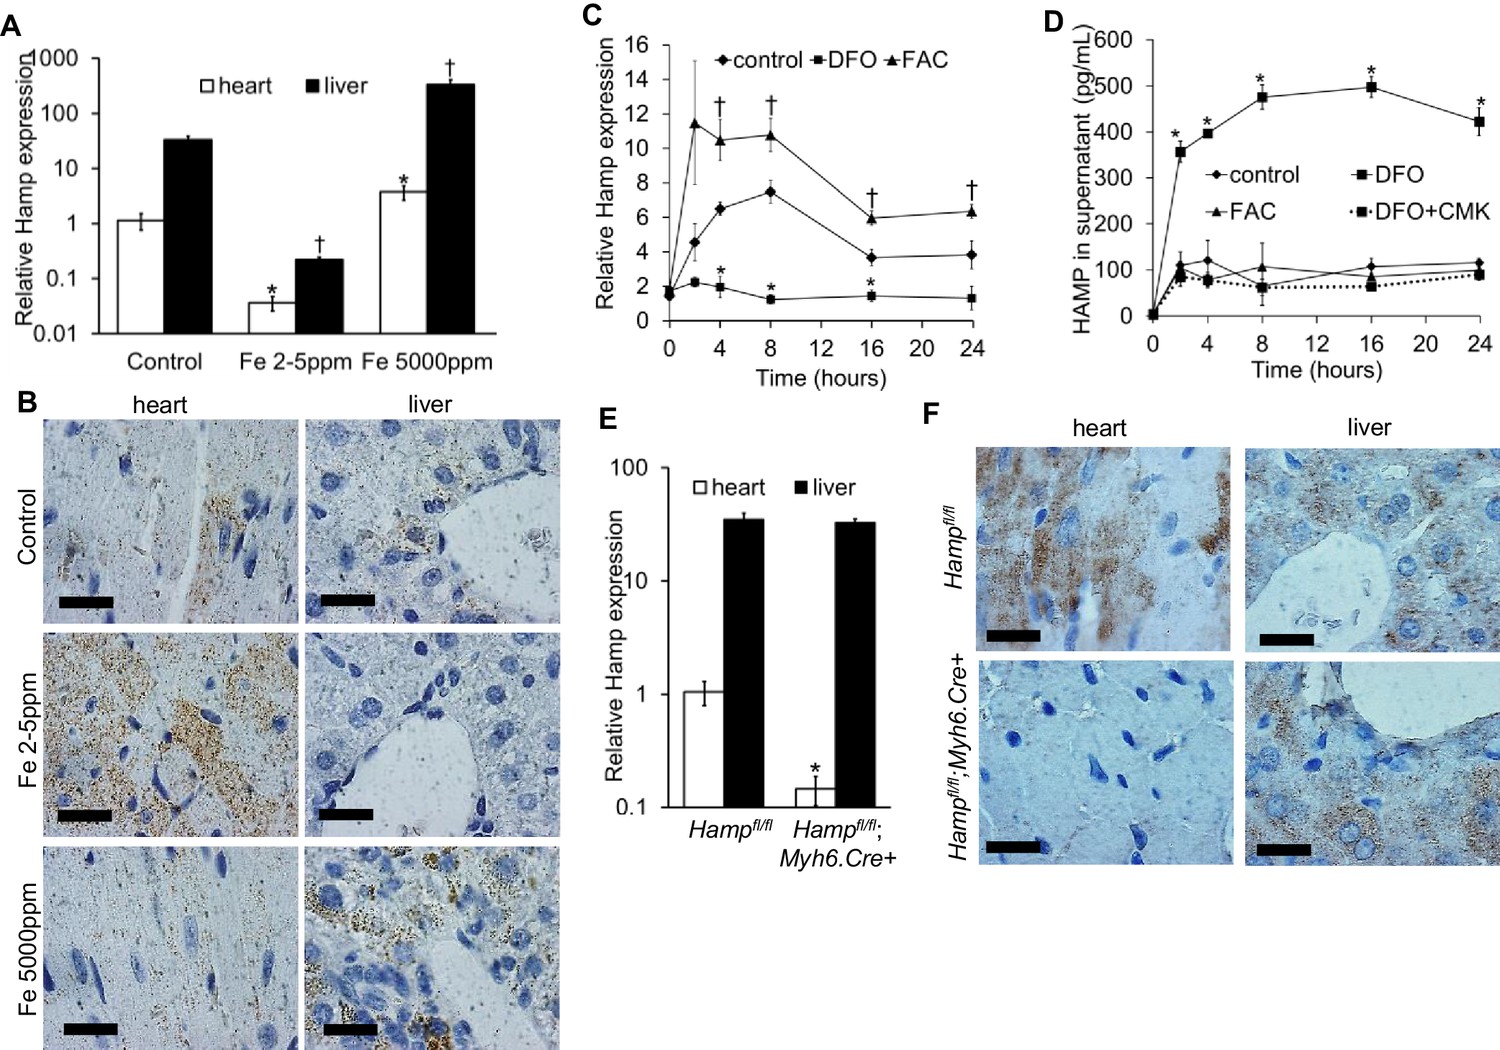
Hepcidin expression and regulation in the heart.
(A) Relative Hamp mRNA expression in heart and liver of adult C57BL/6 mice, under control conditions and after provision of low or high iron diets. *p=0.047, 0.001 respectively relative to control hearts, †p = 0.006, 0.019 respectively relative to control livers. (B) Corresponding immunohistochemical staining for HAMP in heart and liver. (C) Relative Hamp mRNA expression in primary adult mouse cardiomyocytes cultured under control conditions or in presence of FAC or DFO. *p=0.023, 0.001 and 0.014 respectively relative to control. †p = 0.024, 0.037, 0.016 and 0.037 respectively relative to control at the same timepoint. (D) Corresponding HAMP protein levels in supernatants of primary cardiomyocytes. DFO treatment was carried alone (DFO) or presence of Furin inhibitor (DFO+CMK). *p=0.002, 0.020, 0.028, 0.014, 0.015 respectively relative to control at the same timepoint. (E) Relative Hamp expression in heart and liver of 3 month old Hampfl/fl and Hampfl/fl;Myh6.Cre+ mice. *p=0.018 relative to cardiac Hamp in Hampfl/fl controls. (F) Corresponding immunohistochemical staining for HAMP in heart and liver. All values are plotted as mean ± SEM. Scale bar = 20 µm. n = 3 per group unless otherwise stated.
Figure 1—figure supplement 1
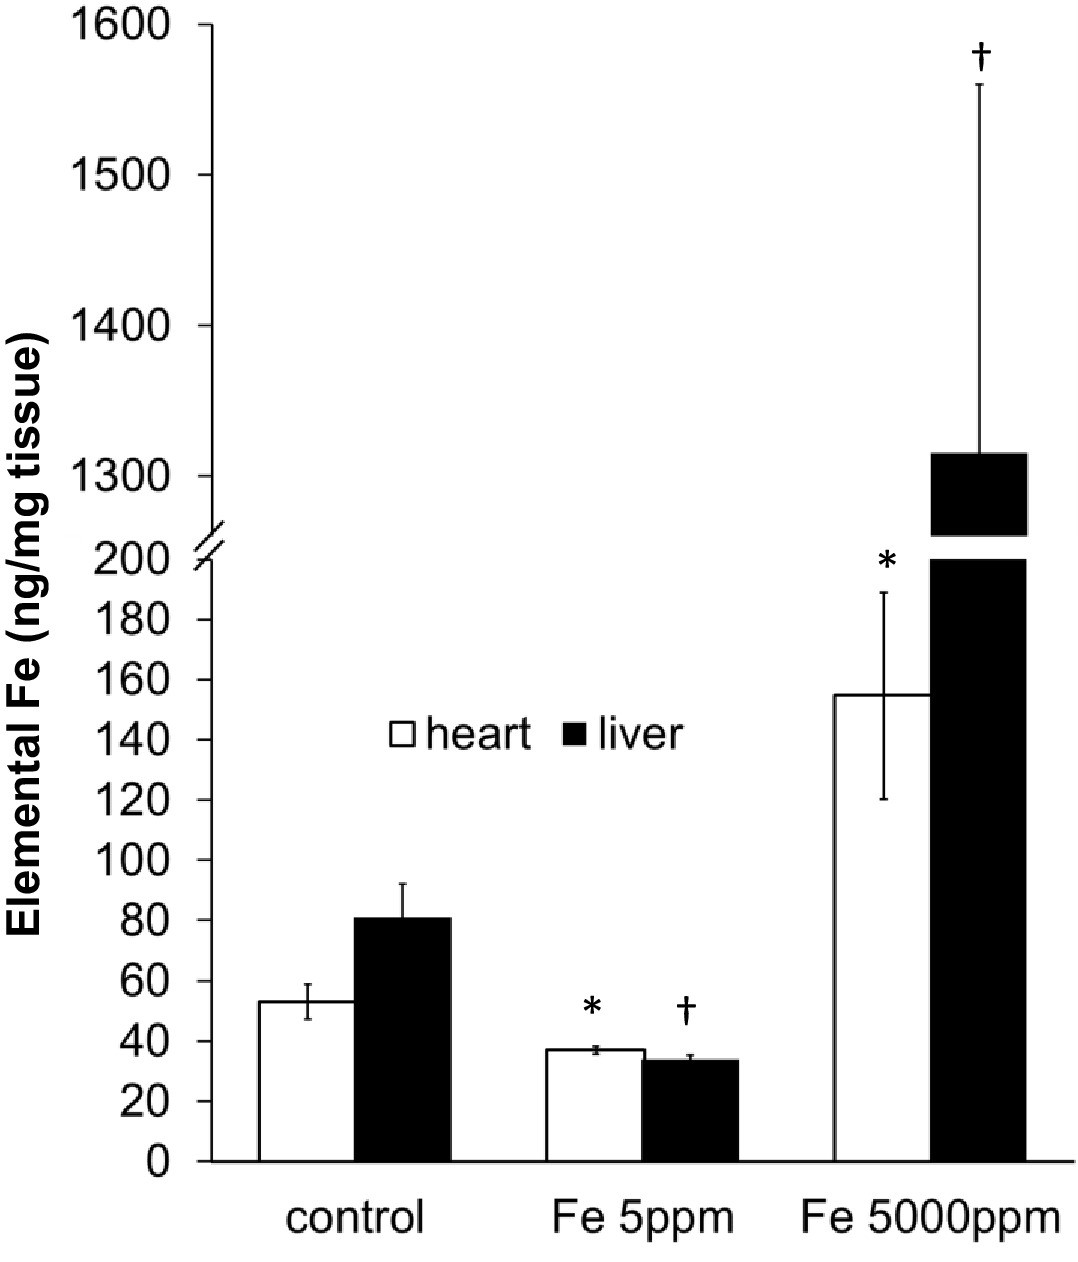
Cardiac and liver iron following dietary iron manipulation.
Total elemental iron levels in heart and liver of C57BL/6 mice, under control conditions and after provision of low (Fe 5 ppm) or high iron (Fe 5000 ppm) diets from weaning for six weeks. *p=0.037 and 0.033 respectively relative to control heart, †p = 0.010 and 0.005 relative to control liver. n = 3. Data are represented as mean ± SEM.
Figure 1—figure supplement 2
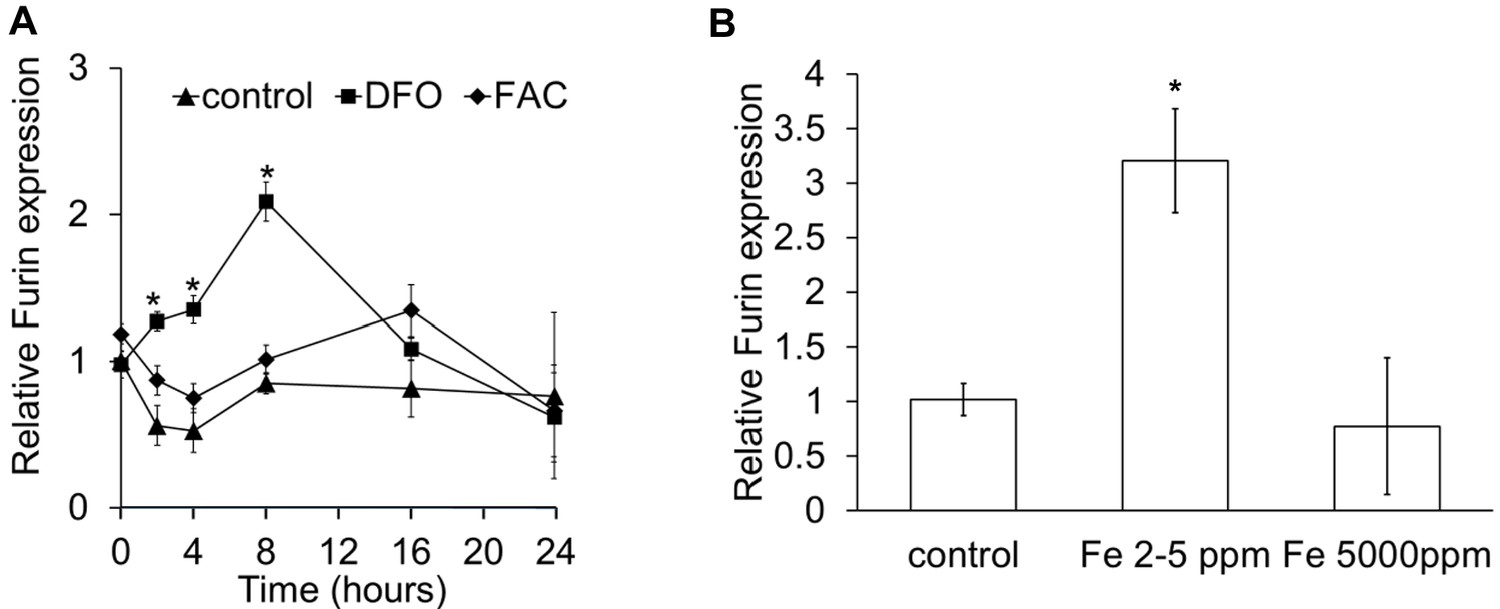
Furin regulation by iron.
(A) Relative Furin mRNA in primary adult mouse cardiomyocytes under control conditions and following treatment with DFO or FAC. *p=0.004, 0.001 and 0.001 respectively relative to control at the respective timepoint. (B) Relative Furin mRNA in hearts of mice provided control diet or iron-deficient diet (2–5 ppm) or iron-loaded diet (5000 ppm) from weaning for six weeks. *p=0.015 relative to control diet. n = 3. Data are plotted as mean ± SEM.
Figure 1—figure supplement 3

Relative Hamp mRNA expression in cardiomyocytes following treatment with Furin inhibitor CMK.
Relative Hamp mRNA expression in primary adult mouse cardiomyocytes under control conditions and following treatment with DFO or FAC, in presence or absence of Furin inhibitor CMK. n = 3. Data are plotted as mean ± SEM.
Figure 1—figure supplement 4
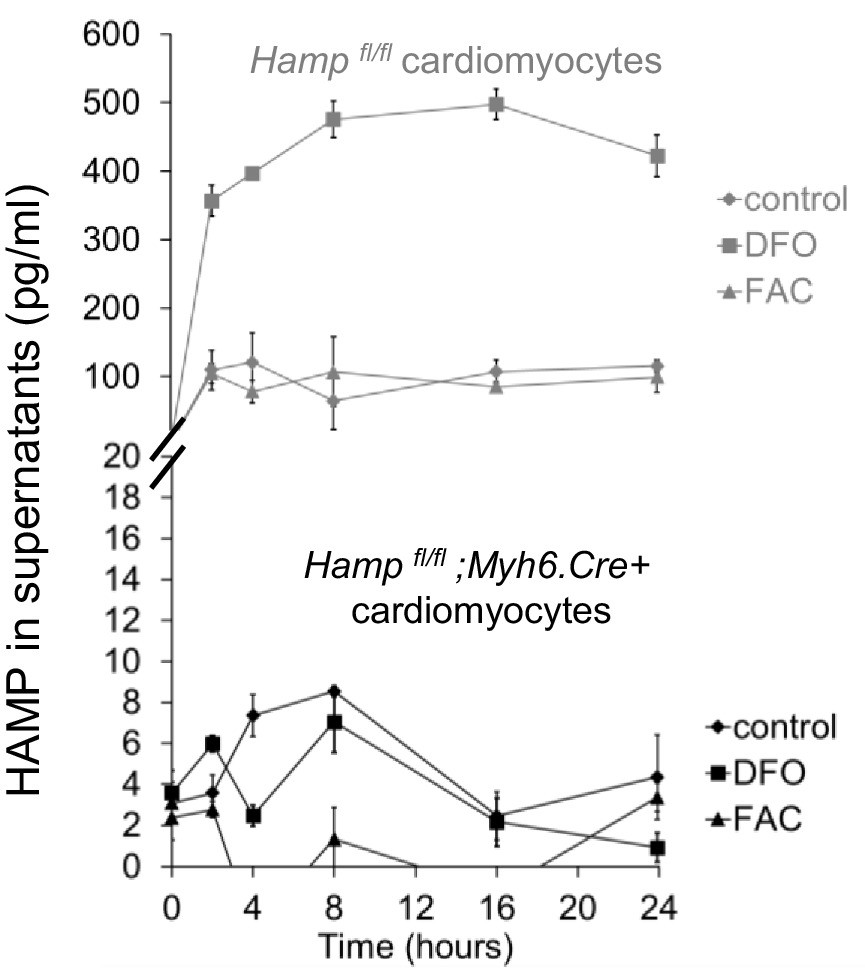
HAMP in supernatants of primary cardiomyocytes.
HAMP protein was measured by ELISA in supernatants of primary adult cardiomyocytes, derived from Hamp fl/fl or Hamp fl/fl;Myh6.Cre+ mice and cultured under control conditions or in presence of FAC or DFO. n = 3. Data are plotted as mean ± SEM.
Figure 1—figure supplement 5
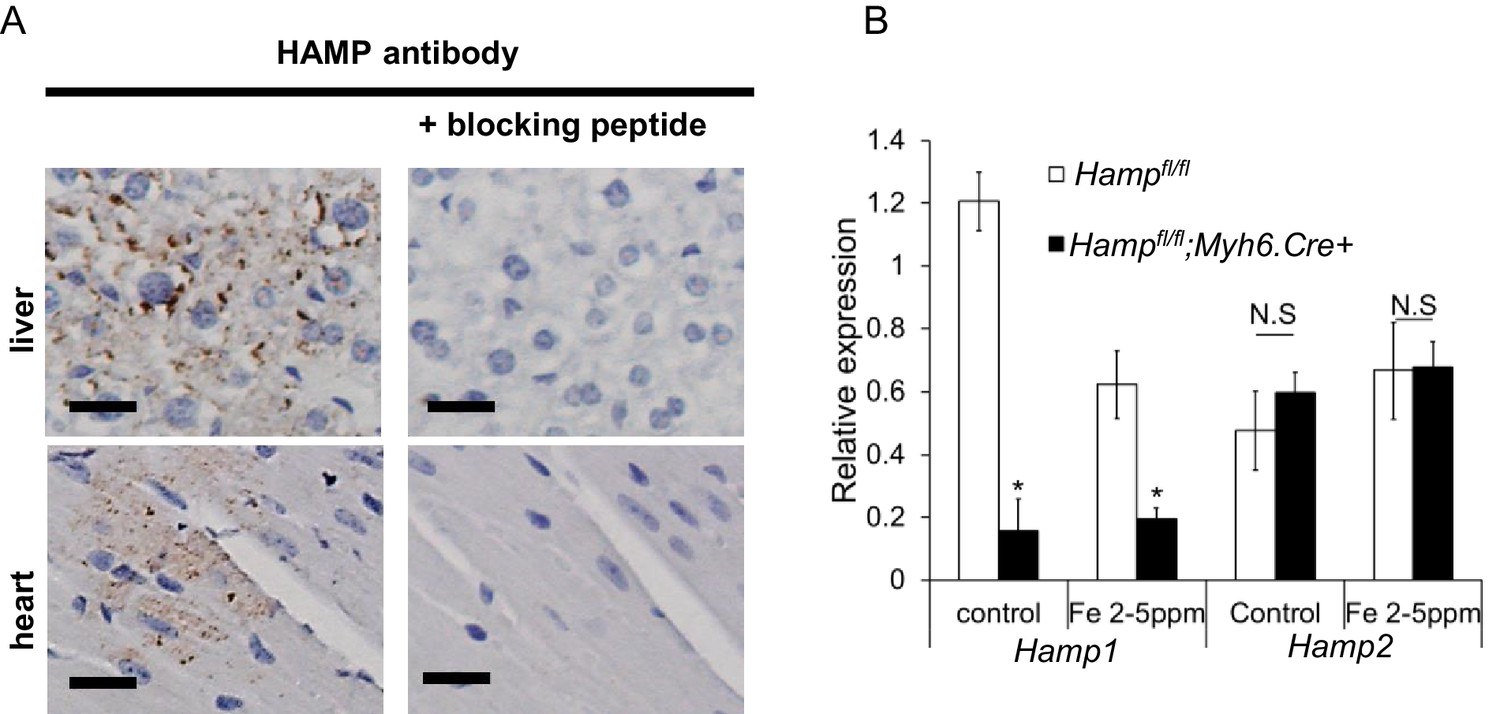
Confirmation of HAMP antibody specificity.
(A) Staining with HAMP antibody (Abcam ab30760) in liver and heart of C57BL/6 mice is completely abrogated by co-incubation with hepcidin-25 blocking peptide (Abcam ab31875). Scale bar = 20 µm. (B) Loss of HAMP staining in Hampfl/fl;;Myh6.Cre+ hearts (Figure 1F) is consistent with the antibody detecting HAMP1 and not HAMP2, because Hamp2 mRNA expression is not altered in Hampfl/fl;Myh6.Cre+ mice relative to Hampfl/fl controls, either with control diet or iron-deficient diet (six weeks from weaning). *p=0.007 and 0.047 relative to Hampfl/fl control under respective diet. n = 3 per group. Values are plotted as mean ± SEM. N.S=not significant.
Figure 1—figure supplement 6
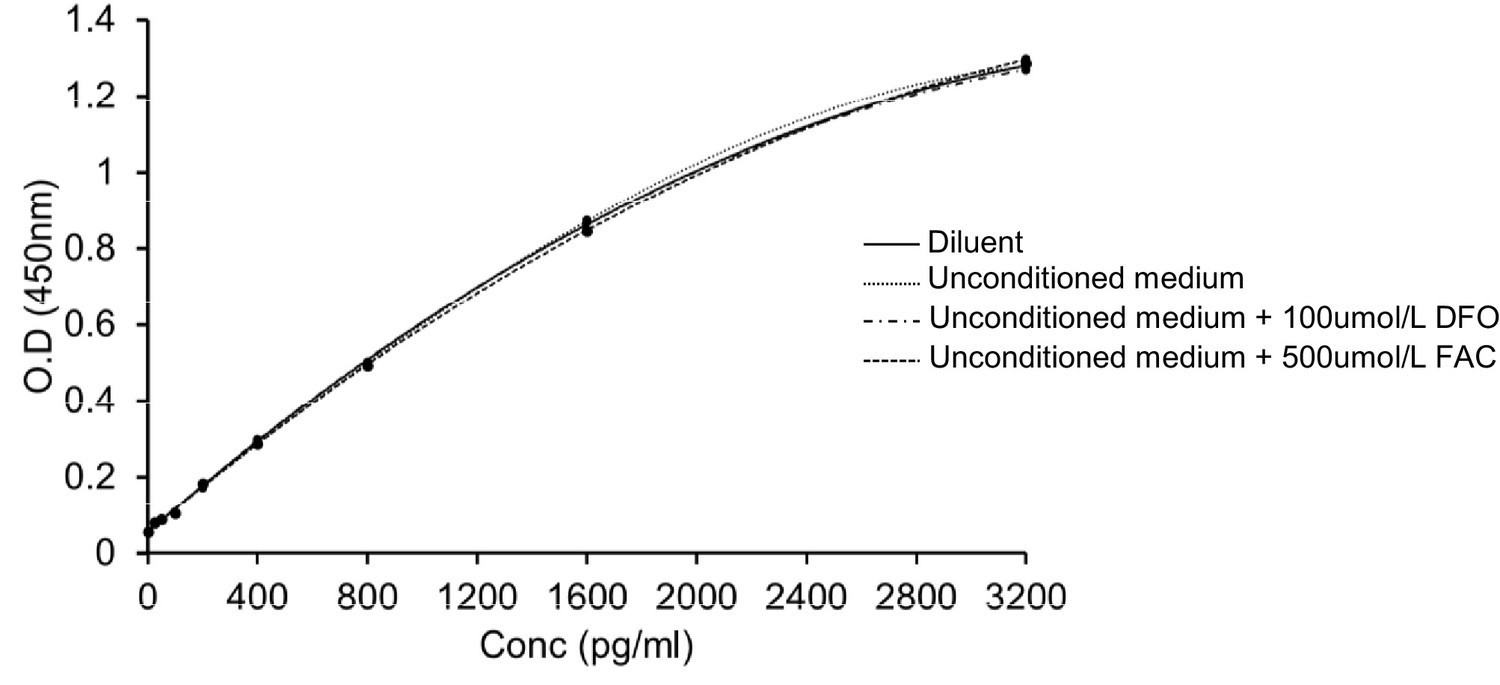
HAMP detection by ELISA unaffected by FAC and DFO.
HAMP standard from mouse hepcidin ELISA (E91979Mu, Uscn) was diluted either in the kit’s own standard diluent, or in unconditioned growth medium alone, or containing 100 µmol/L DFO or 500 µmol/L FAC. ELISA was performed as per manufacturer’s instructions.
Figure 2
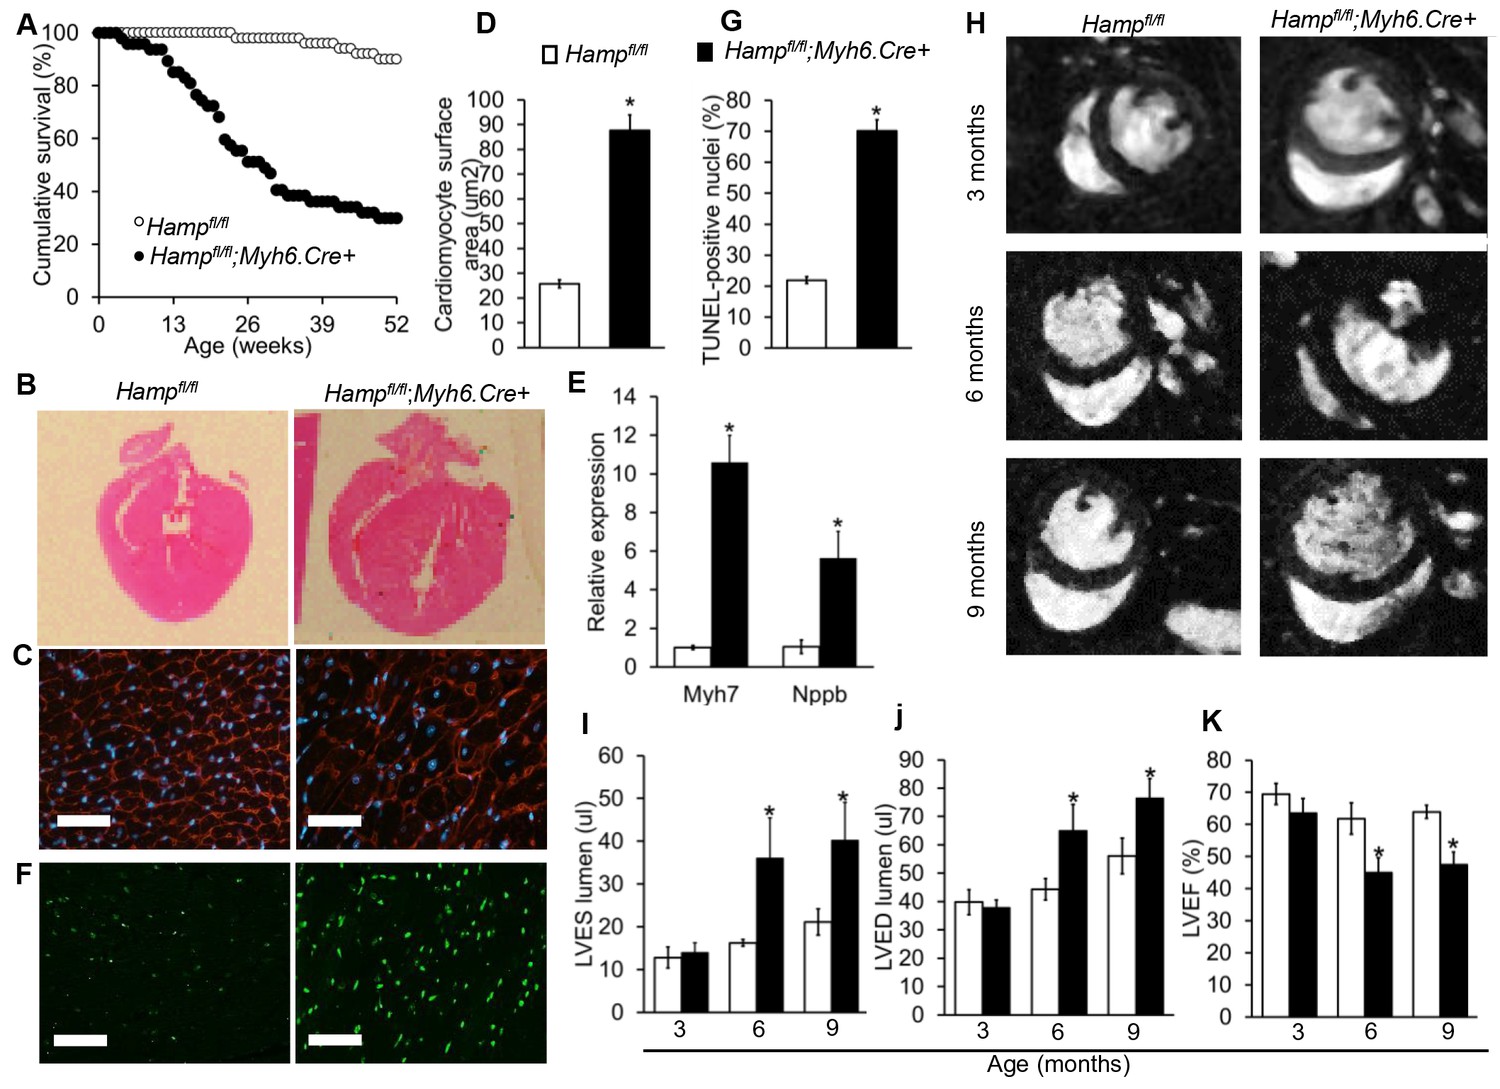
Fatal cardiac abnormalities in Hampfl/fl;Myh6.Cre+ mice.
(A) Cumulative survival of Hampfl/fl;Myh6.Cre+ mice (n = 50) and Hampfl/fl littermate controls (n = 47) over 52 weeks. (B) Representative H and E longitudinal heart sections from a six month old Hampfl/fl;Myh6.Cre+ mouse and Hampfl/fl littermate control. (C) Representative WGA cardiac staining from a six month old Hampfl/fl;Myh6.Cre+ mouse and Hampfl/fl littermate control. (D) Quantitation of cardiomyocyte size based on WGA staining in six month old Hampfl/fl;Myh6.Cre+ mice and Hampfl/fl littermate controls. *p=0.001 relative to Hampfl/fl littermate controls. (E) Relative expression of the hypertrophic gene markers Myh7 and Nppb in hearts of 6 month old Hampfl/fl;Myh6.Cre+ mice and Hampfl/fl littermate controls. *p=0.001, 0.047 for the respective gene relative to Hampfl/fl littermate controls. (F) Representative cardiac in-situ TUNEL staining from a six month old Hampfl/fl;Myh6.Cre+ mouse and Hampfl/fl littermate control. (G) Quantitation of percentage of apoptotic cardiomyocytes based on in-situ TUNEL staining in six month old Hampfl/fl;Myh6.Cre+ mice and Hampfl/fl littermate controls *p=0.001 relative to Hampfl/fl littermate controls. (H) Representative midventricular Cine MR images of hearts from Hampfl/fl;Myh6.Cre+ mice and Hampfl/fl controls at 3, 6 and 9 months of age. (I–K) Cine MRI measurements of LV lumen, at end-systole (LVES), end-diastole (LVED), and of ejection fraction (LVEF) in Hampfl/fl;Myh6.Cre+ mice and Hampfl/fl littermate controls at three months (n = 8 per group), six months (n = 11 per group, *p=0.043 for LVES, 0.047 for LVED and 0.020 for LVEF) and nine months (n = 5 per group, *p=0.044 for LVES, 0.042 for LVED and 0.034 for LVEF). p values are relative to Hampfl/fl controls of the respective age. All Values are plotted as mean ± SEM. n = 3 per group unless otherwise stated. Scale bar = 50 µm.
-
Figure 2—source data 1
Source data file for Figure 2I,J and K.
- https://doi.org/10.7554/eLife.19804.012
Figure 3 with 2 supplements
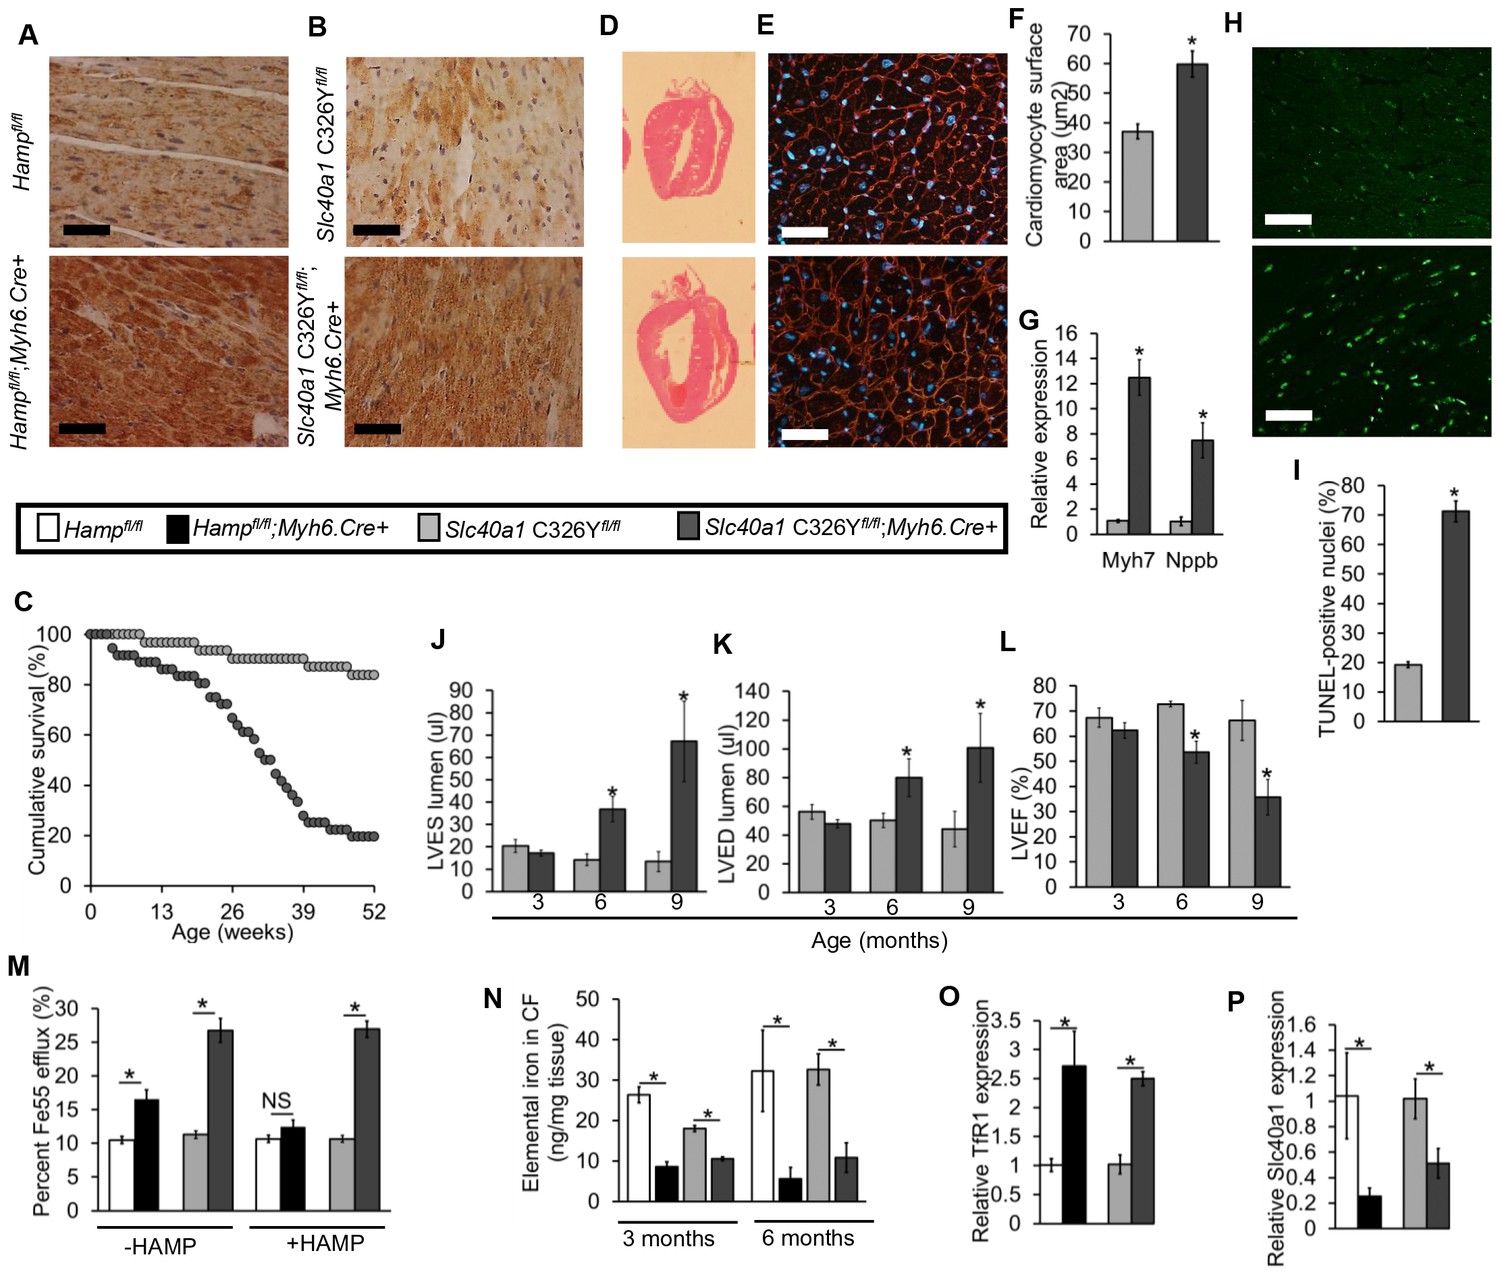
The role of cardiomyocyte FPN.
(A–B) Immunohistochemical staining for FPN in the hearts of three month old Hampfl/fl;Myh6.Cre+, Slc40a1 C326Yfl/fl;Myh6.Cre+ mice and respective controls. (C) Cumulative survival of Slc40a1 C326Yfl/fl;Myh6.Cre+ mice (n = 36) and Slc40a1 C326Yfl/fl littermate controls (n = 31) over 52 weeks. (D) Representative H and E-stained longitudinal heart sections from a six month old Slc40a1 C326Yfl/fl;Myh6.Cre+ mouse and a Slc40a1 C326Yfl/fl control. (E) Representative WGA cardiac staining from a six month old Slc40a1 C326Yfl/fl;Myh6.Cre+ mouse and Slc40a1 C326Yfl/fl control. (F) Quantitation of cardiomyocyte size based on WGA staining. n = 3 per group. *p=0.001 relative to Slc40a1 C326Yfl/fl controls. (G) Relative expression of Myh7 and Nppb in hearts of 6 month old Slc40a1 C326Yfl/fl;Myh6.Cre+ mice and Slc40a1 C326Yfl/fl controls. n = 3 per group. *p=0.032, 0.044 for the respective gene relative to Slc40a1 C326Yfl/fl controls. (H) Representative cardiac TUNEL staining from a six month old Slc40a1 C326Yfl/fl;Myh6.Cre+ mouse and Slc40a1 C326Yfl/fl control. (I) Quantitation of percentage of apoptotic cardiomyocytes based on TUNEL staining, n = 3 per group. *p=0.0003 relative to Slc40a1 C326Yfl/fl controls. (J–L) Cine MRI measurements of LVES, LVED and LVEF in Slc40a1 C326Yfl/fl;Myh6.Cre+ mice and Slc40a1 C326Yfl/fl controls at three months (n = 6 per group), six months (n = 6 per group, *p=0.003 for LVES, 0.043 for LVED and 0.001 for LVEF) and nine months (n = 5 per group, *p=0.033 for LVES, 0.047 for LVED and 0.023 for LVEF). P values are relative to Slc40a1 C326Yfl/fl controls of the same age. (M) Percentage Fe55 efflux in cardiomyocytes from Hampfl/fl;Myh6.Cre+ mice, Slc40a1 C326Yfl/fl;Myh6.Cre+ mice and respective controls, in presence or absence of HAMP peptide. *p=0.018, 0.006 and 0.007 respectively (N) Elemental iron levels in cardiomyocyte fractions (CF) from the hearts of Hampfl/fl;Myh6.Cre+ mice, Slc40a1 C326Yfl/fl;Myh6.Cre+ mice and their respective controls. n = 4 per group. *p=0.032, 0.044, 0.047 and 0.031 respectively. (O–P) Relative TfR1 (*p=0.038, 0.001) and Fpn (*p=0.039, 0.047) expression in hearts of 3 month old Hampfl/fl;Myh6.Cre+ mice, Slc40a1 C326Yfl/fl;Myh6.Cre+ mice and their respective controls. All values are plotted as mean ± SEM. Scale bar = 50 µm.
-
Figure 3—source data 1
Source data file for Figure 3JK and L.
- https://doi.org/10.7554/eLife.19804.015
Figure 3—figure supplement 1
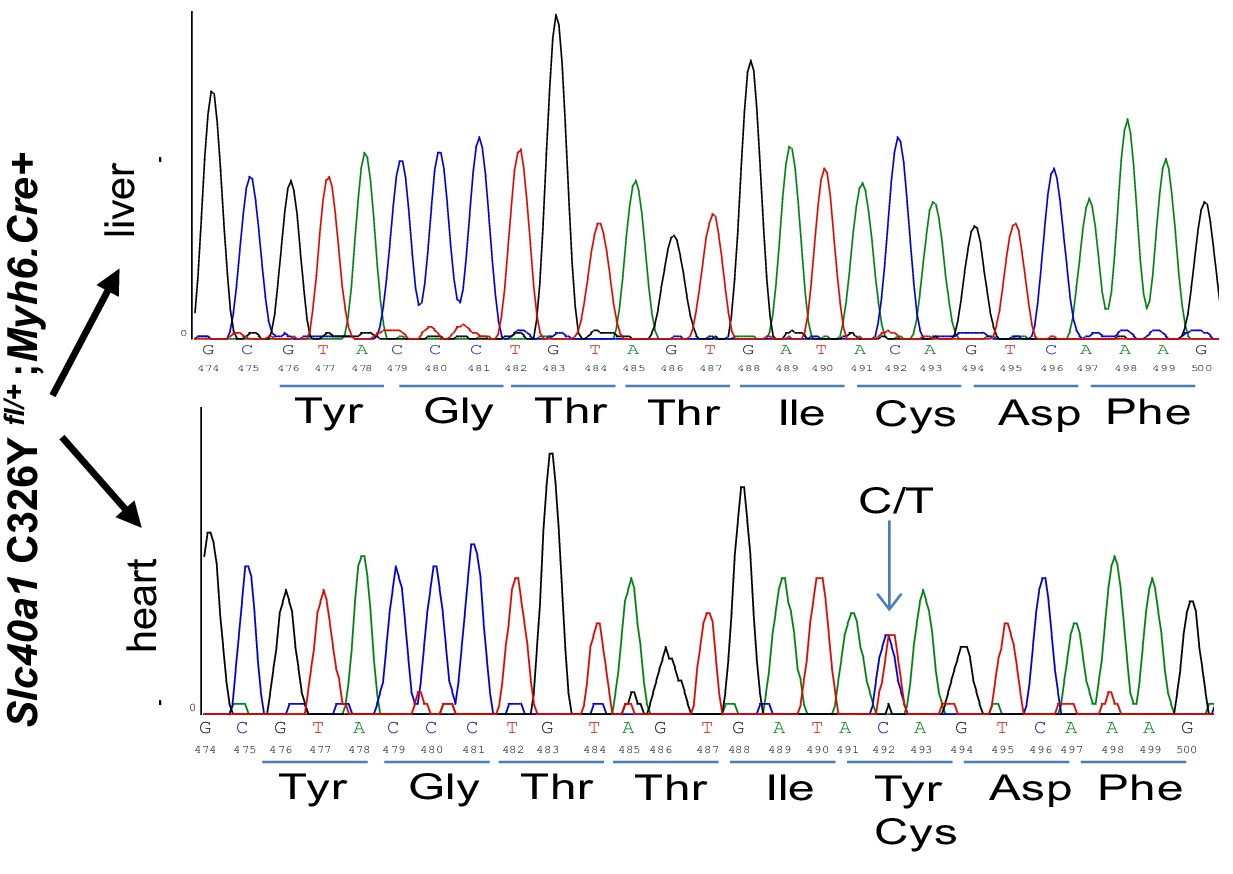
Characterisation of Slc40a1 C326Yfl/fl;Myh6.Cre+ mice.
Total mRNA was extracted from the liver and heart of an adult a Slc40a1 C326Yfl/+;Myh6.Cre+ mouse, reverse transcribed using primers for exon 7 of the Slc40a1 mRNA transcript. Products were sequenced to confirm successful heterozygous expression of the C326Y transcript in the heart but not in the liver.
Figure 3—figure supplement 2
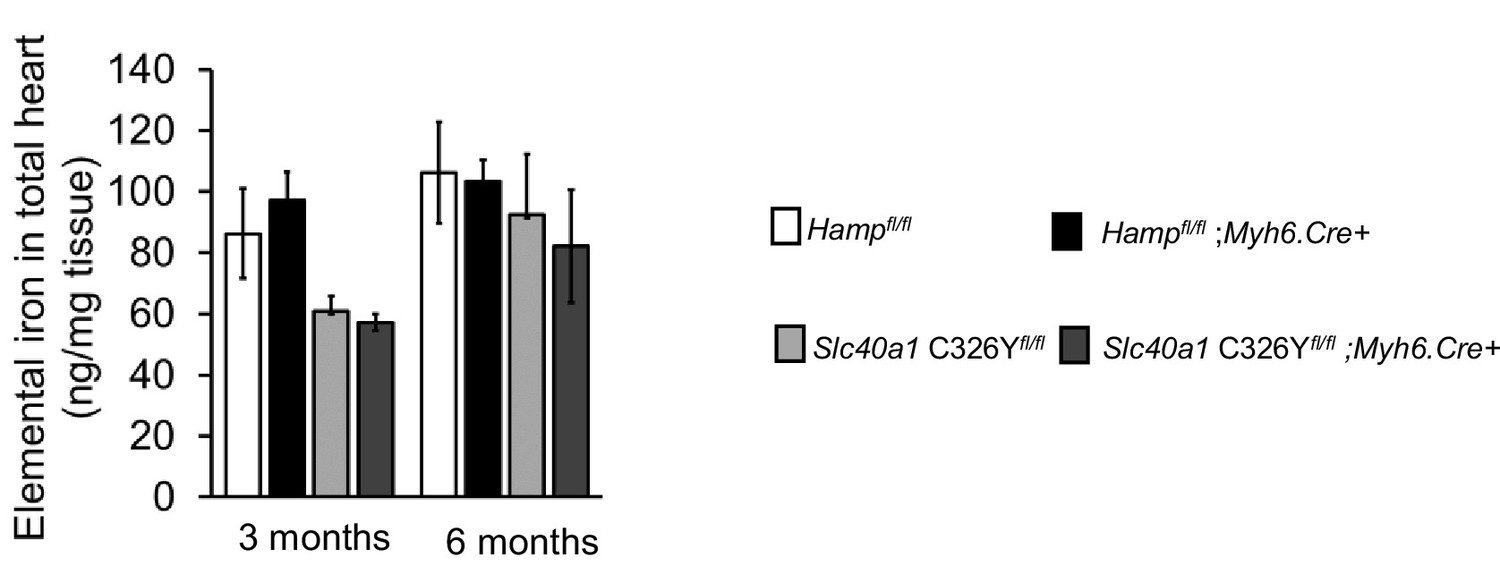
Elemental iron levels in total hearts of Hampfl/fl;Myh6.
Cre+ mice, Slc40a1 C326Yfl/fl;Myh6.Cre+ mice and their respective controls at three months and 6 months of age. n = 4 per group. Data are plotted as mean ± SEM.
Figure 4
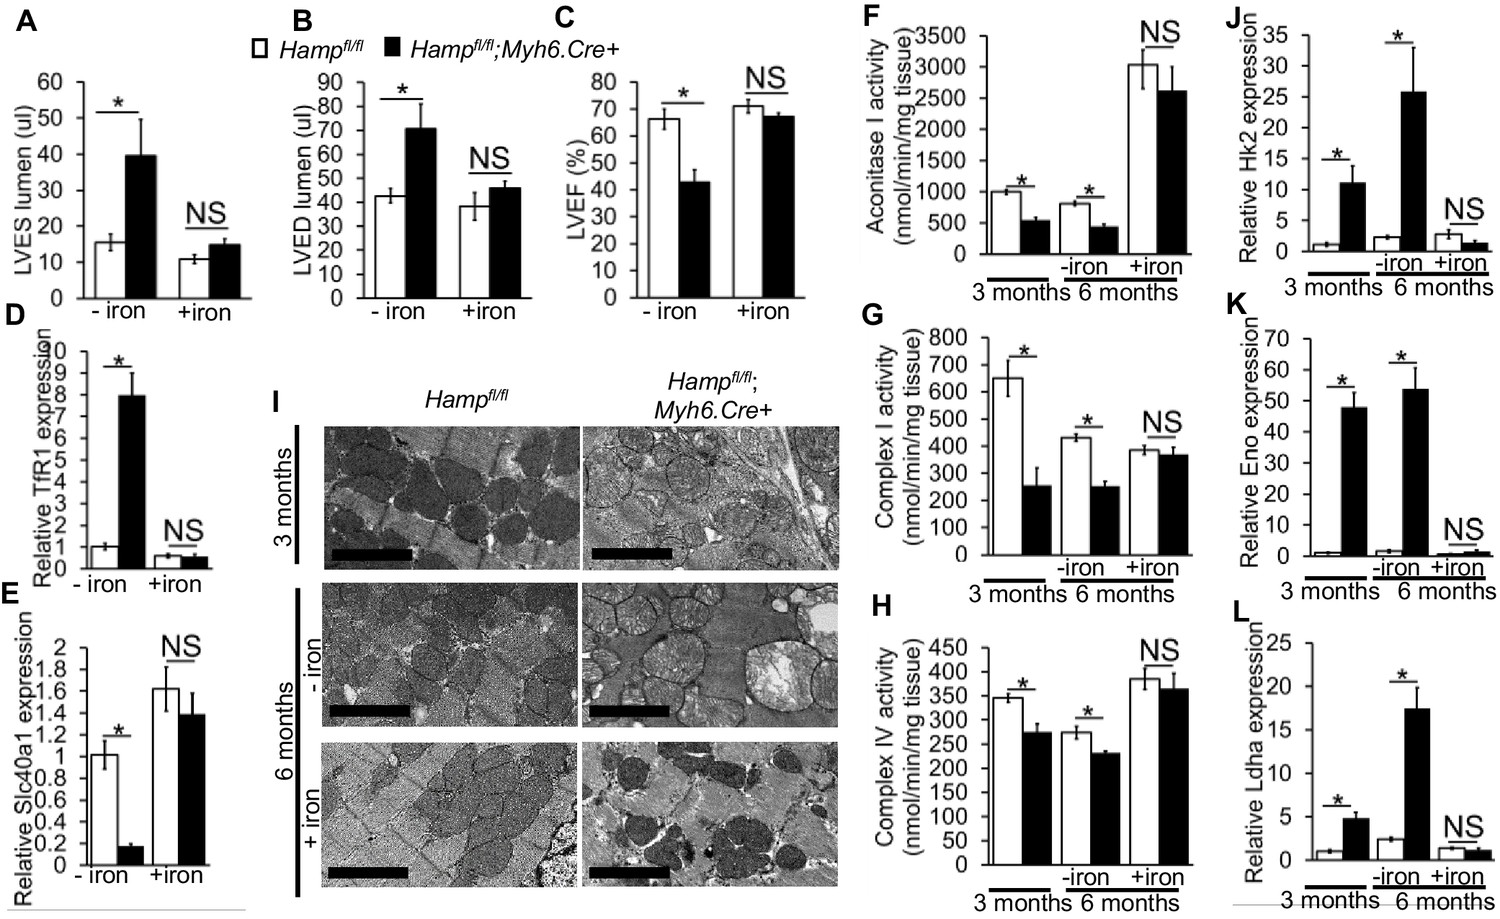
The role of cardiomyocyte iron deficiency and metabolic derangement in cardiac dysfunction.
(A–C) Cine MRI measurements of LV lumen, at end-systole (LVES, *p=0.048), end-diastole (LVED, *p=0.031), and of ejection fraction (LVEF, *p=0.004) in 6-month old untreated (-iron) and I.V iron-treated (+iron) Hampfl/fl;Myh6.Cre+ mice and Hampfl/fl littermate controls. n = 5 per group. (D–E) Relative TfR1 (*p=0.001) and Fpn (*p=0.002) expression in hearts of 6-month old untreated (-iron) and I.V iron-treated (+iron) Hampfl/fl;Myh6.Cre+ mice and Hampfl/fl littermate controls. n = 4 per group. (F–H) Enzymatic activities of Aconitase I (*p=0.035, 0.041), Complex I (*p=0.004, 0.030) and Complex IV (*p=0.003, 0.026) in untreated (-iron) 3-month and 6-month old and in I.V iron-treated (+iron) 6-month old Hampfl/fl;Myh6.Cre+ mice and Hampfl/fl littermate controls. n = 4 per group. (I) Representative EM micrographs of hearts from untreated (-iron) 3-month and 6-month old and I.V iron-treated (+iron) 6-month old Hampfl/fl;Myh6.Cre+ mice and Hampfl/fl littermate controls. Scale bar = 2 µm. (J–L) Relative Hk2 (*p=0.010, 0.002), Eno (*p=0.014, 0.021) and Ldha (*p=0.003, 0.001) expression levels in hearts of untreated (-iron) 3-month and 6-month old and in I.V iron-treated (+iron) 6-month old Hampfl/fl;Myh6.Cre+ mice and Hampfl/fl littermate controls. n = 4 per group. NS=not significant. All values are plotted as mean ± SEM.
-
Figure 4—source data 1
Source data file for Figure 4A,B and C.
- https://doi.org/10.7554/eLife.19804.020
Figure 5
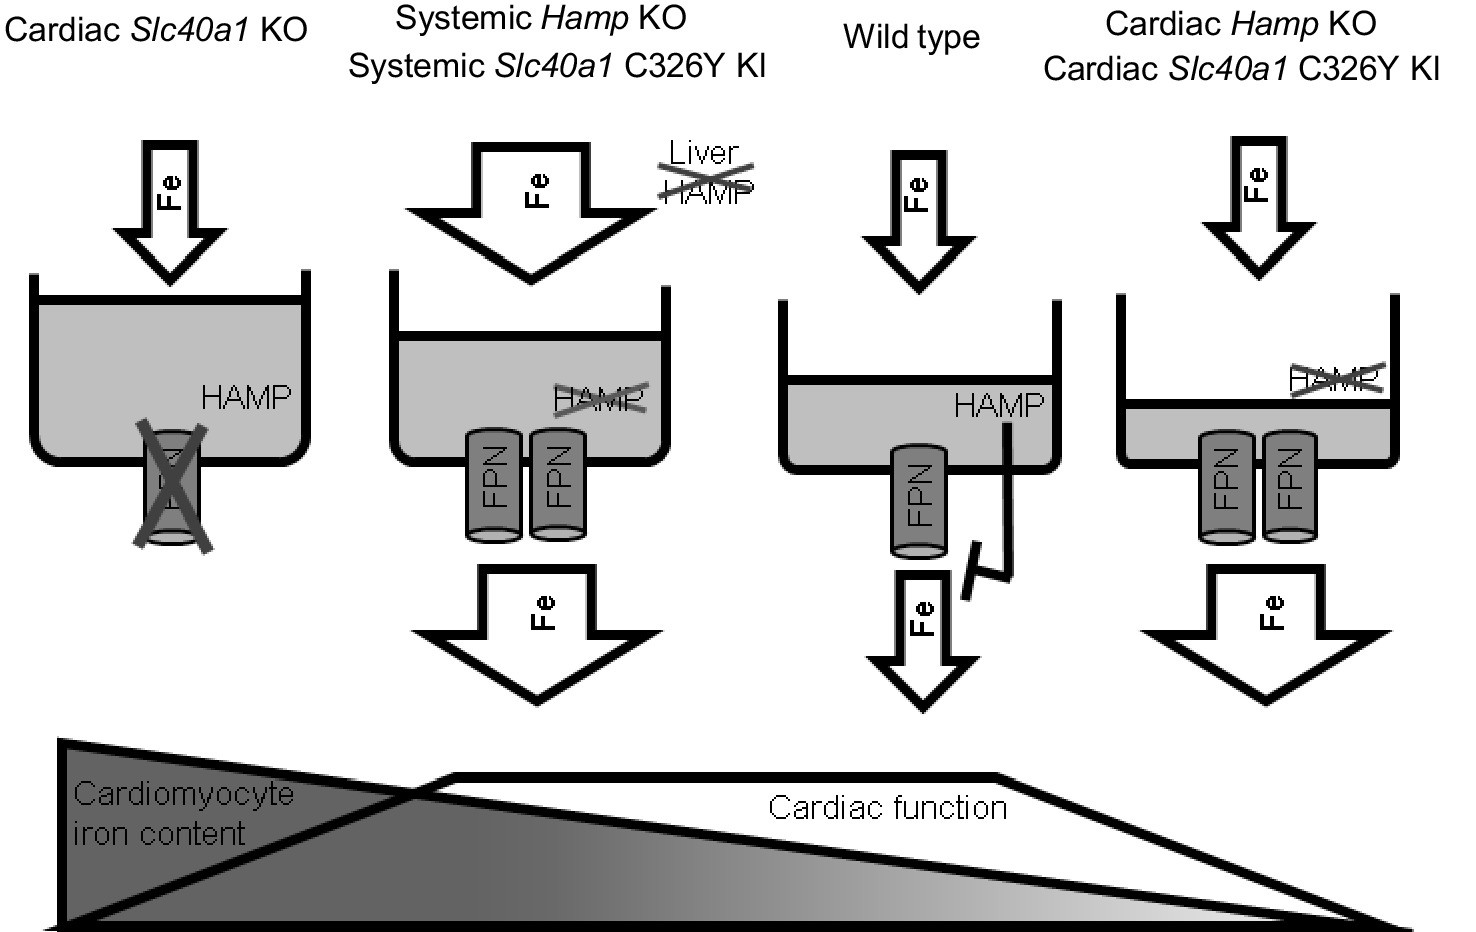
Interplay between systemic and cardiac iron HAMP/FPN axes.
Cardiomyocyte iron content is determined by both systemic iron availability, which is regulated by liver HAMP, and by the cardiac HAMP/FPN axis, which regulates cardiomyocyte iron efflux. In the wild type heart, cardiac HAMP regulates the levels of cardiac FPN and iron release from cardiomyocytes. In this study, we have demonstrated that loss of cardiac HAMP (cardiac Hamp KO) or loss of cardiac HAMP responsiveness (cardiac Slc40a1 C326Y KI) result in cardiomyocyte iron deficiency due to increased cardiomyocyte FPN and iron release. Previously, we also demonstrated that loss of cardiomyocyte FPN caused cardiomyocyte iron overload. In these two sets of conditions, cardiomyocyte iron deficiency and cardiomyocyte iron overload cause cardiac dysfunction. We have also shown that upregulation of cardiac FPN occurs as a result of loss of either systemic HAMP or systemic HAMP responsiveness, and is protective against the otherwise detrimental effects of systemic iron overload.
Appendix 1—figure 1
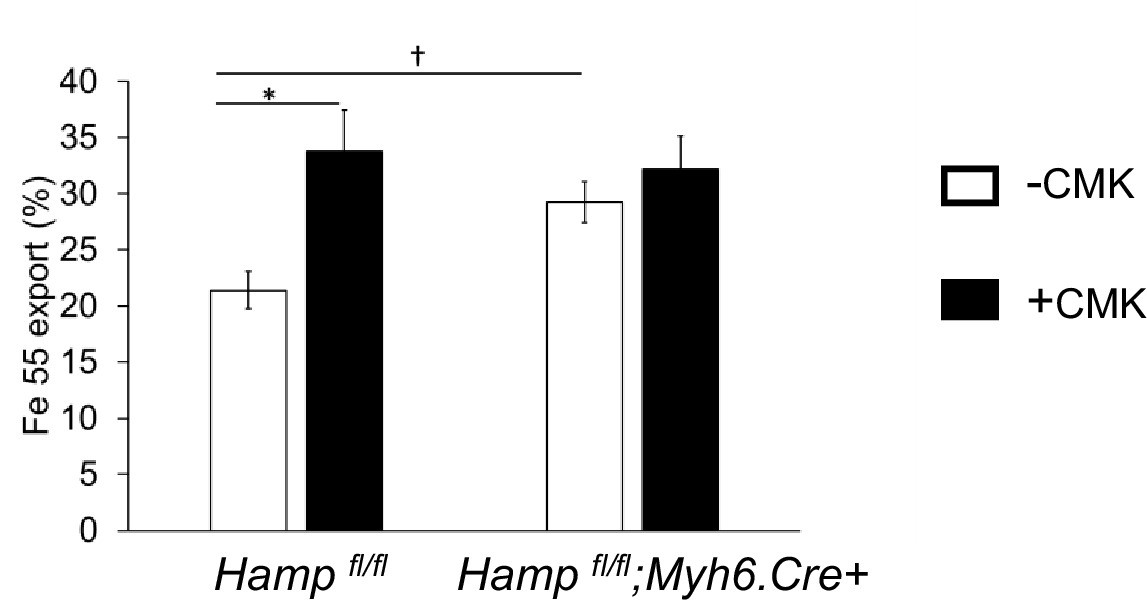
Effect of Furin inhibitor on iron export in cardiomyocytes.
Fe55 efflux measured in primary adult cardiomyocytes from Hamp fl/fl and Hamp fl/fl;Myh6.Cre+ mice following culture in control medium (-CMK) or medium containing Furin inhibitor (+CMK) for 2 hr. n = 3. values are plotted as mean ± SEM. *p=0.027. †p = 0.024.
Appendix 1—figure 2
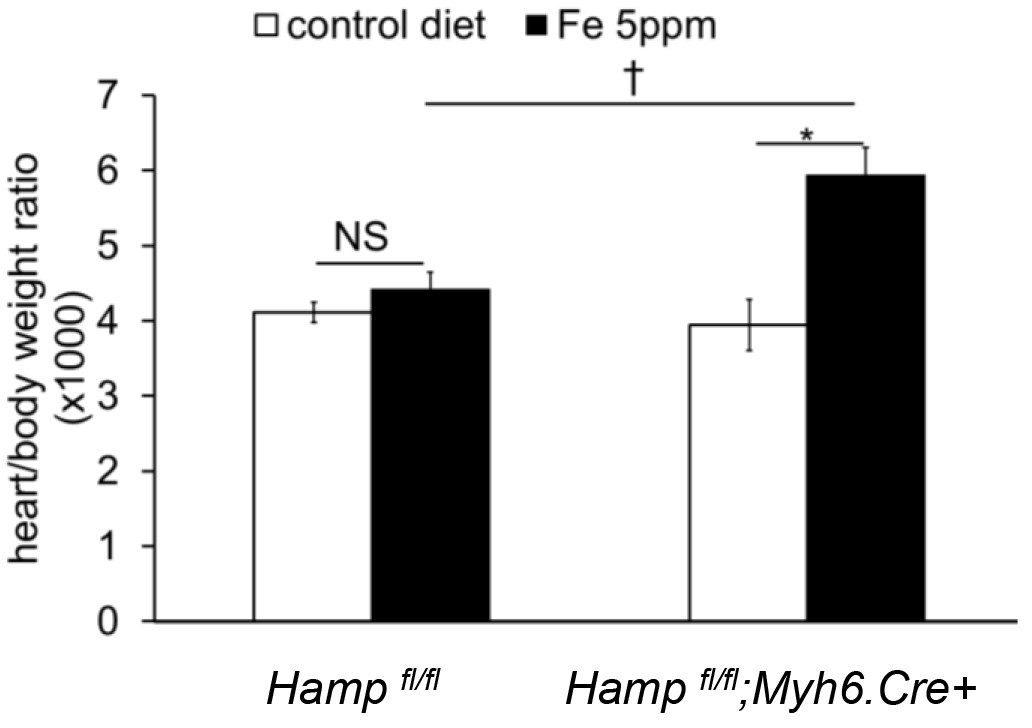
Effect of genotype on hypertrophic response to iron-deficient diet.
Heart/body weight ratio in Hampfl/fl;Myh6.Cre+ mice and littermate Hampfl/fl controls provided a control diet (Fe 200 ppm) or an iron-deficient diet (Fe 2–5 ppm) from weaning for six weeks. n = 5 per group, NS=not significant. *p=0.013, †p = 0.04. Values are shown as mean ± SEM.
Appendix 1—figure 3
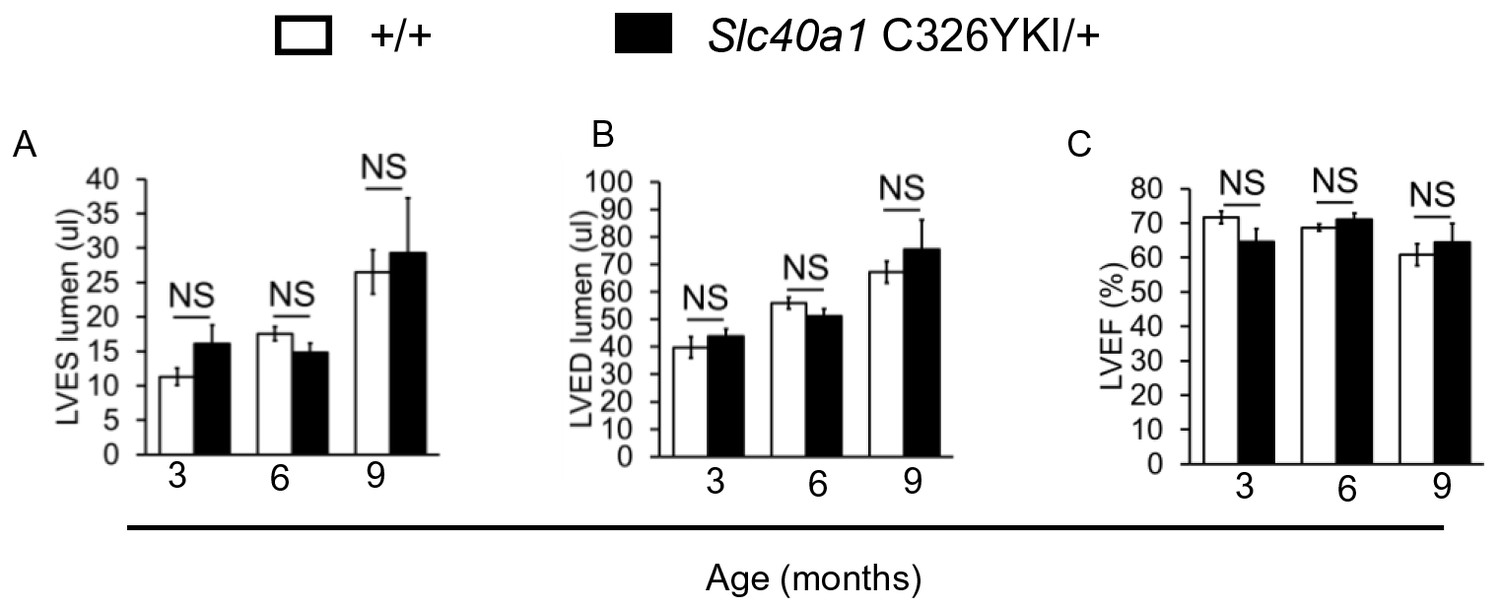
Normal cardiac function in ubiquitous Slc40a1 C326Y KI mice.
(A–C) Cine MRI measurements of LV lumen, at end-systole (LVES), end-diastole (LVED), and of ejection fraction (LVEF) in Slc40a1 C326YKI/+ mice and +/+ littermate controls at three months (n = 7 per group), six months (n = 7 per group) and nine months (n = 7 per group) of age. Values are plotted as mean ± SEM.
Appendix 1—figure 4
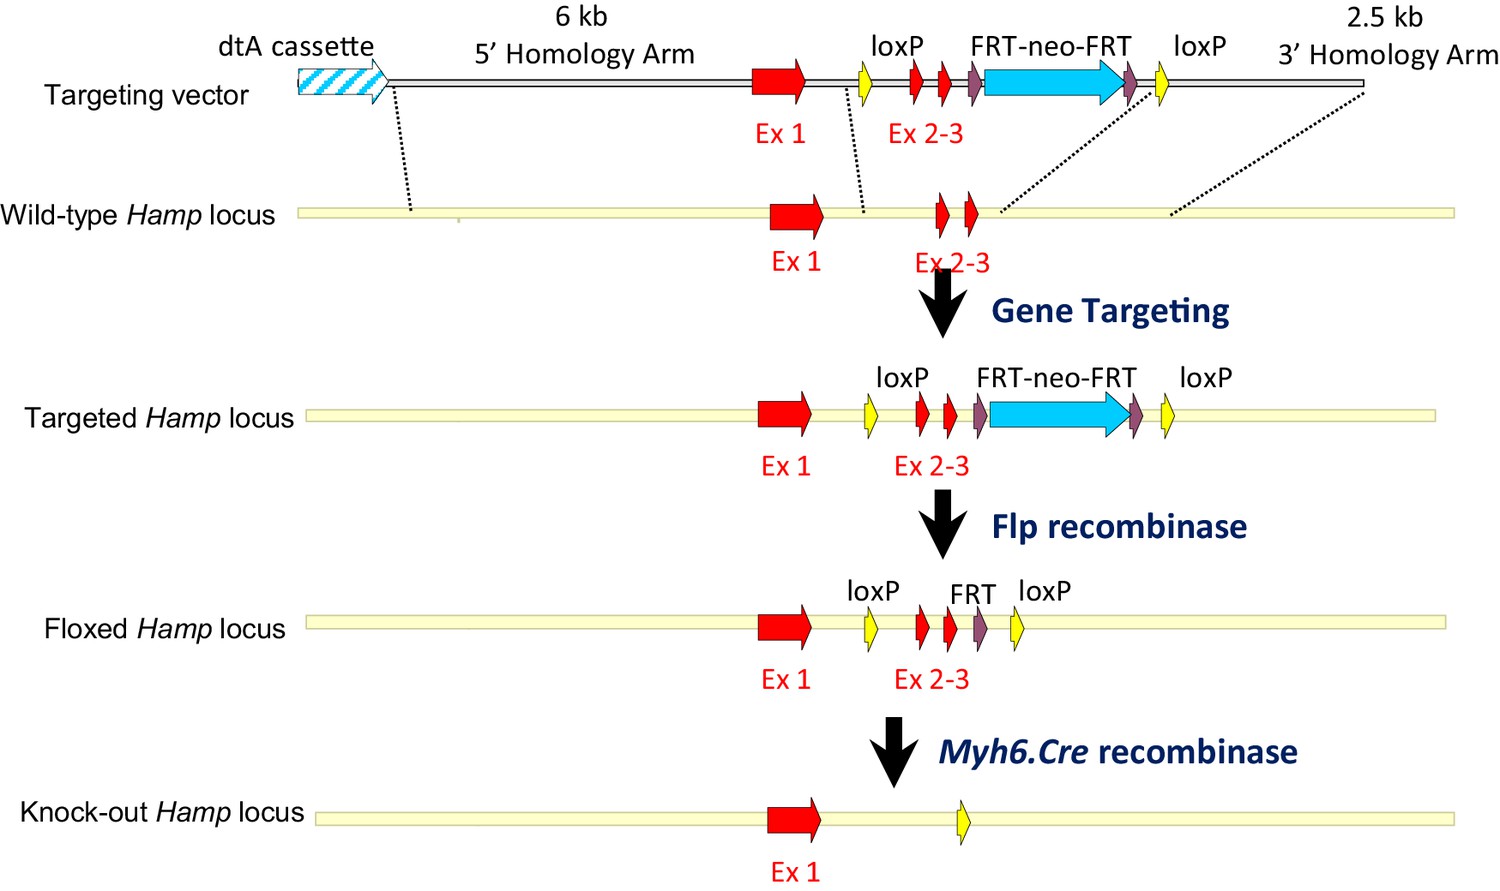
Strategy for generation of Hampfl/fl;Myh6.Cre+ mice.
A targeting vector was designed to introduce a floxed Hamp allele into mouse ES cells, with exons 2 and 3, which encode the majority of the peptide, flanked by LoxP sites. Further breeding with a C57BL/6 Flp recombinase deleter mouse allowed removal of the Neo cassette. Cardiac Hamp knockouts were then generated by crossing homozygous Hampfl/fl animals with mice transgenic for Myh6-Cre recombinase, which is under the control of cardiomyocyte-specific Myosin Alpha Heavy chain six promoter.
Appendix 1—figure 5
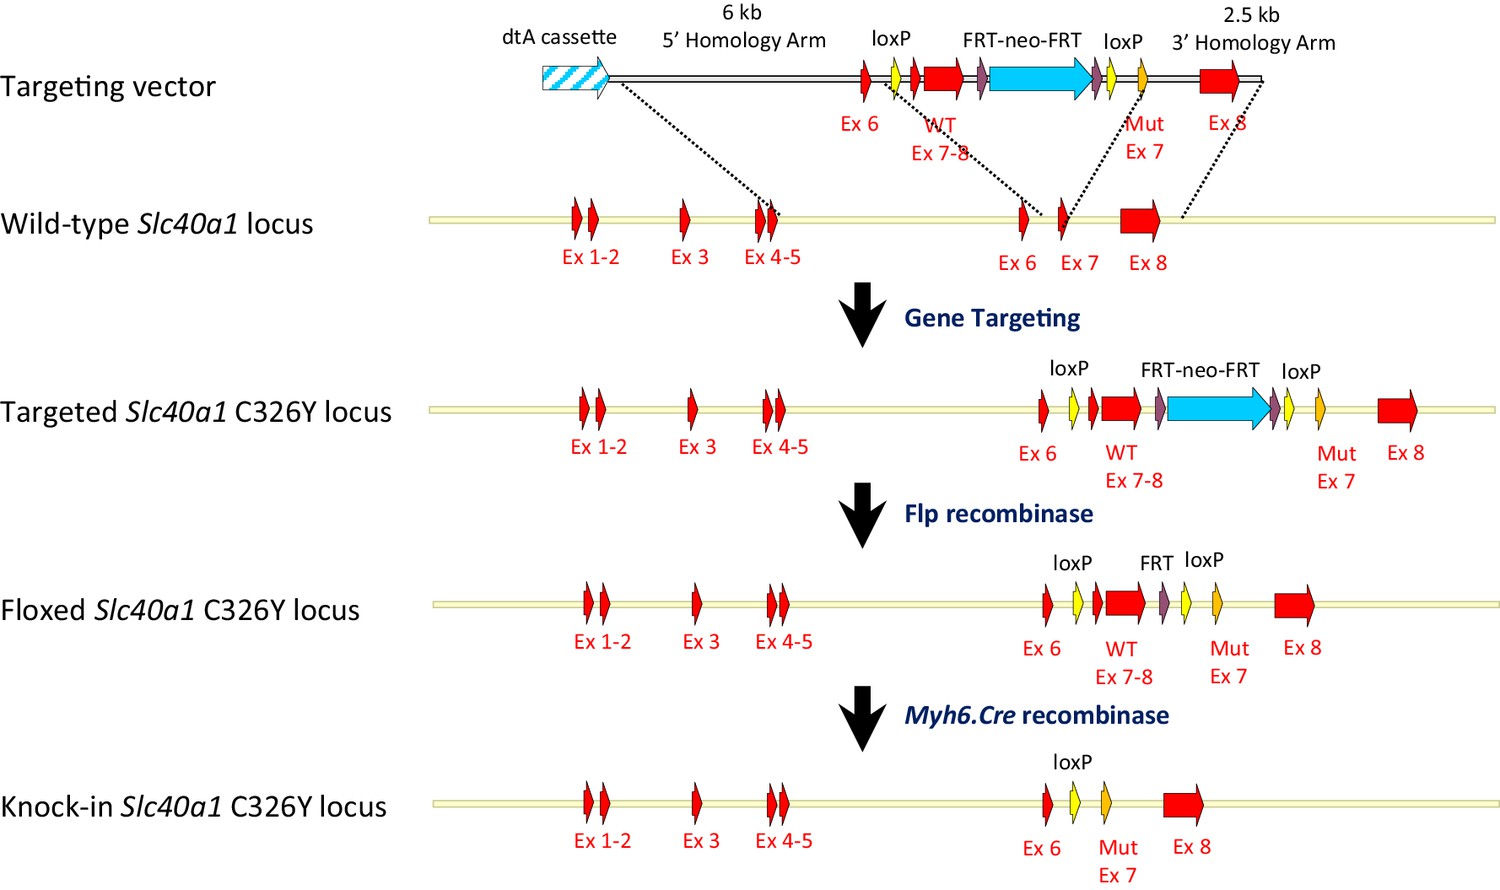
Strategy for generation of Slc40a1 C326Yfl/fl;Myh6.Cre+ mice.
A targeting vector was designed to introduce a floxed Slc40a1 C326Y allele into mouse ES cells, containing mutant exon seven and wild type and to delete simultaneously endogenous exons 7 and 8. Further breeding with a C57BL/6 Flp recombinase deleter mouse allowed removal of the Neo cassette. Cardiac Slc40a1 C326Y knock-ins were then generated by crossing homozygous Slc40a1 C326Yfl/fl animals with mice transgenic for Myh6-Cre recombinase, which is under the control of cardiomyocyte-specific Myosin Alpha Heavy chain six promoter.
Appendix 1—figure 6
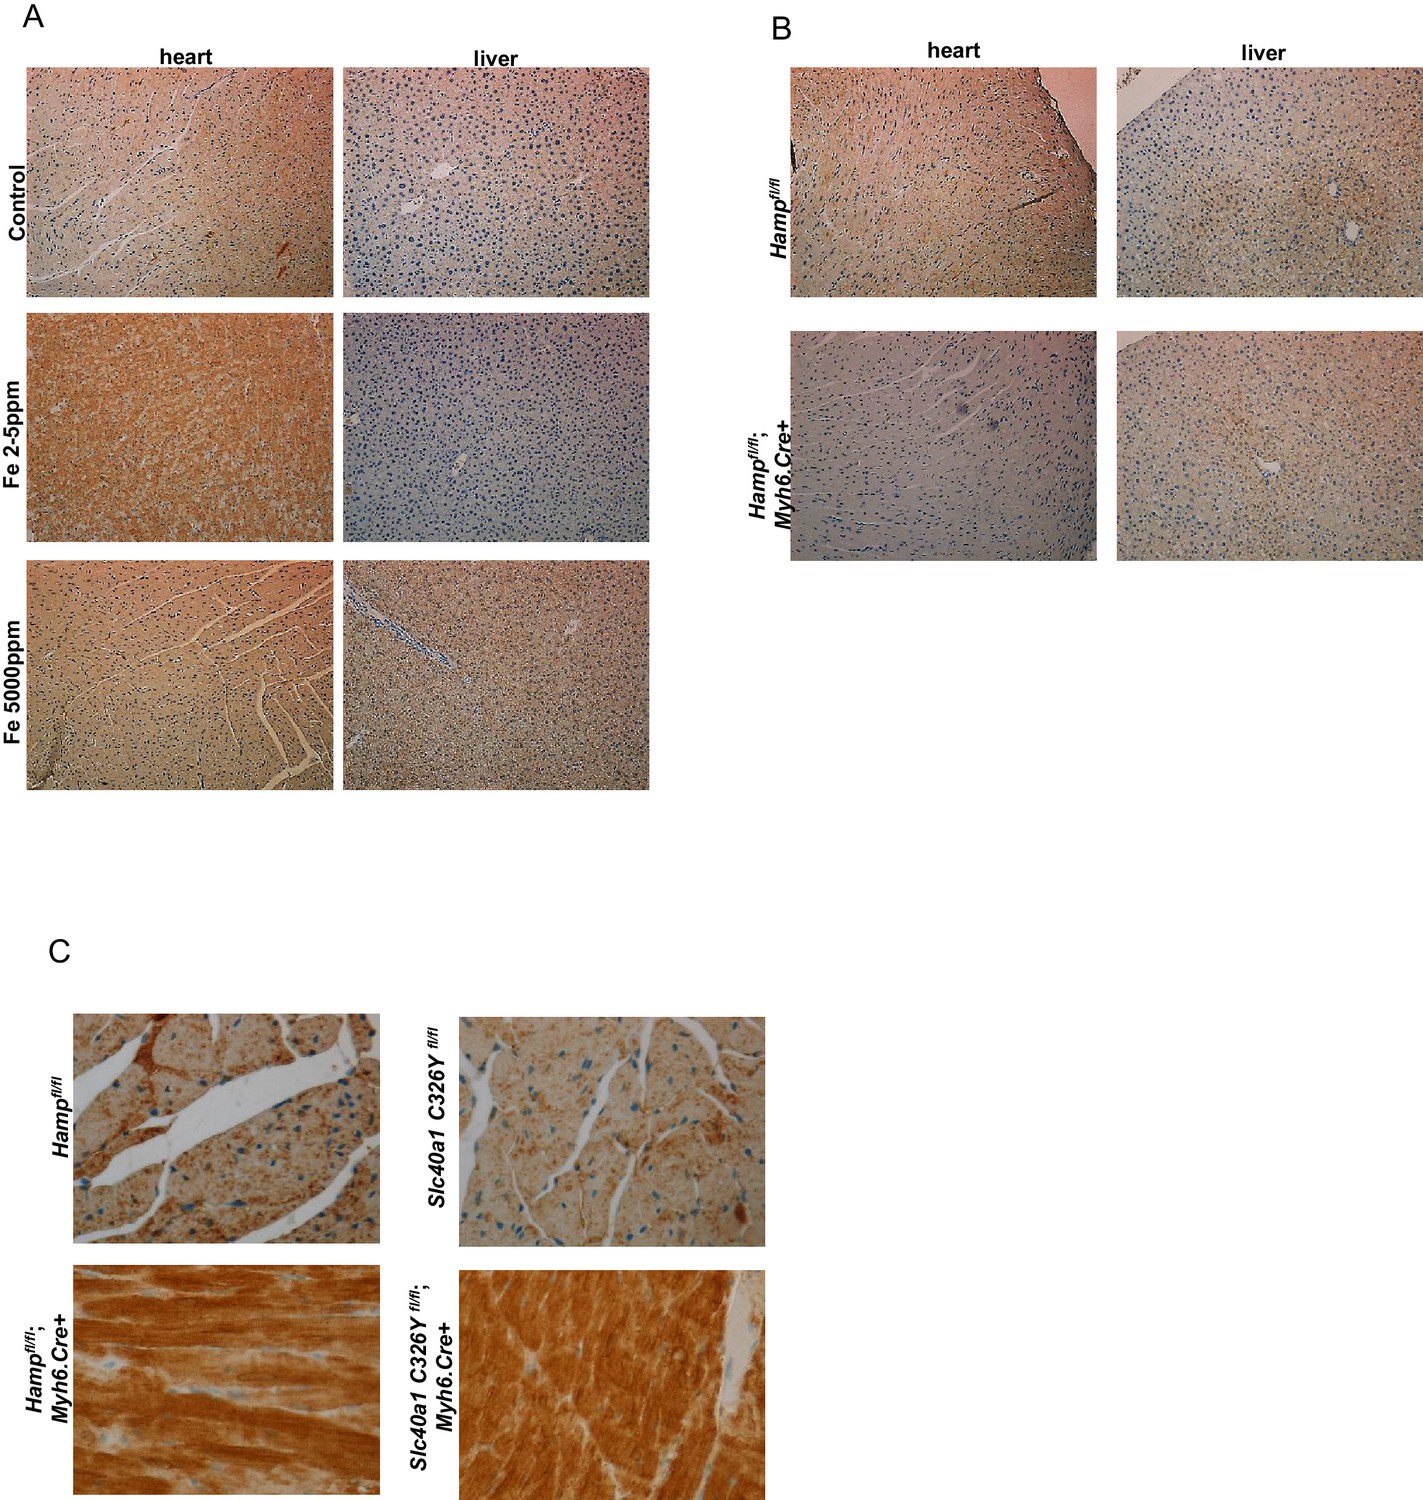
Additional images for HAMP and FPN staining.
(A) Lower magnifications images (X10) for Figure 1B. (B) Lower magnification images (X10) for Figure 1F. (C) Higher magnification images (X40) for Figure 3A and C.
Tables
Table 1
Indices of systemic iron in six month old Hampfl/fl and Hampfl/fl;Myh6.Cre+ mice.
n = 6 per group. All values are shown as mean ± SEM.
Hampfl/fl | Hampfl/fl;Myh6.Cre+ | |
|---|---|---|
liver total elemental iron (ng/mg tissue) | 96.3 ± 12.2 | 88.7 ± 19.2 |
liver ferritin (µg/mg total protein) | 0.65 ± 0.04 | 0.64 ± 0.05 |
serum iron (µmol/L) | 28.60 ± 7.20 | 31.50 ± 8.40 |
serum ferritin (mg/L) | 1.81 ± 0.04 | 1.88 ± 0.29 |
hemoglobin (g/L) | 122.7 ± 11.5 | 116.0 ± 11.9 |
serum hepcidin (µg/L) | 23.5 ± 7.6 | 23.9 ± 10.40 |
Table 2
Non-LV parameters of cardiac function are not altered between Hampfl/fl and Hampfl/fl;;Myh6.Cre+ mice.
Cine MRI measurements of cardiac function in Hampfl/fl;Myh6.Cre+ mice and Hampfl/fl controls at three months (n = 8 per group), six months (n = 11 per group) and nine months (n = 5 per group) of age. Values are shown as mean ± SEM.
| 3 months | 6 months | 9 months | |||
|---|---|---|---|---|---|---|
Hamp fl/fl | Hamp fl/fl; Myh6.Cre+ | Hamp fl/fl | Hamp fl/fl; Myh6.Cre+ | Hamp fl/fl | Hamp fl/fl; Myh6.Cre+ | |
Average mass (mg) | 70.51 ± 7.47 | 70.38 ± 5.33 | 72.59 ± 5.38 | 82.54 ± 11.32 | 78.30 ± 4.92 | 83.07 ± 5.44 |
RVED lumen (µl) | 31.37 ± 2.55 | 26.81 ± 2.30 | 33.12 ± 3.19 | 30.63 ± 2.35 | 38.39 ± 3.88 | 39.95 ± 3.00 |
RVES lumen (µl) | 7.43 ± 0.79 | 5.23 ± 0.67 | 8.70 ± 1.22 | 8.34 ± 1.06 | 13.36 ± 2.21 | 15.51 ± 2.47 |
RVEF (%) | 76.42 ± 1.32 | 79.88 ± 2.80 | 73.66 ± 2.50 | 73.42 ± 2.22 | 65.20 ± 4.36 | 61.95 ± 3.53 |
Stroke volume (µl) | 25.47 ± 1.99 | 22.73 ± 2.11 | 25.70 ± 2.70 | 23.76 ± 1.85 | 29.79 ± 2.30 | 29.84 ± 1.59 |
Cardiac output (ml/min) | 10.34 ± 1.06 | 9.62 ± 0.90 | 10.72 ± 1.07 | 10.53 ± 1.05 | 11.46 ± 1.15 | 11.99 ± 1.38 |
Heart Rate (bpm) | 404.07 ± 18.69 | 426.90 ± 17.94 | 419.64 ± 19.05 | 436.14 ± 14.30 | 384.84 ± 28.55 | 400.97 ± 41.20 |
Heart/body weight ratio x1000 | 2.80 ± 0.18 | 3.09 ± 0.26 | 2.51 ± 0.23 | 2.98 ± 0.37 | 2.36 ± 0.28 | 2.88 ± 0.27 |
Table 3
Characterisation of Slc40a1 C326Yfl/fl;Myh6.Cre+ mice.
Indices of iron status in Slc40a1 C326Yfl/fl and Slc40a1 C326Yfl/fl;Myh6.Cre+ mice at six months of age (n = 4 per group). Values are shown as mean ± SEM.
| Slc40a1 C326Yfl/fl | Slc40a1 C326Y fl/fl; Myh6.Cre+ |
|---|---|---|
liver total elemental iron (ng/mg tissue) | 92.77 ± 21.30 | 84.00 ± 26.00 |
liver ferritin (µg/mg total protein) | 0.87 ± 0.06 | 0.92 ± 0.05 |
serum iron (µmol/L) | 27.30 ± 5.20 | 29.60 ± 7.20 |
serum ferritin (mg/L) | 2.10 ± 0.04 | 2.20 ± 0.15 |
hemoglobin (g/L) | 125.70 ± 8.80 | 126.00 ± 12.30 |
serum hepcidin (µg/L) | 25.90 ± 11.60 | 27.50 ± 8.40 |
Table 4
Effect of intravenous iron treatment on iron indices.
Total cardiac and liver elemental iron, serum iron and circulating HAMP in 6-month old untreated and I.V iron-treated Hampfl/fl;Myh6.Cre+ mice and Hampfl/fl littermate controls. Treated mice were injected with 0.5 mg iron fortnighly from the age of 3 months. Tissues and serum were harvested 12 hr after the final injection. n = 5 per group. *p<0.05 relative to untreated Hampfl/fl mice. †p < 0.05 relative to untreated Hampfl/fl;Myh6.Cre+. Values are shown as mean ± SEM.
Hampfl/fl | Hamp fl/fl;Myh6.Cre+ | |||
|---|---|---|---|---|
untreated | treated with I.V iron | untreated | treated with I.V iron | |
cardiac total elemental iron (ng/mg tissue) | 82.2 ± 16.9 | 331.3 ± 21.5* | 74.9 ± 7 | 399.8 ± 68.5† |
liver total elemental iron (ng/mg tissue) | 100.4 ± 11 | 2527.6 ± 27.63* | 96.3 ± 14 | 2258.2 ± 239.9† |
serum iron (µmol/L) | 30.09 ± 6.37 | 74.48 ± 17.96* | 31.5 ± 6.9 | 80.12 ± 24.9† |
serum hepcidin (µg/L) | 27.41 ± 6.7 | 237.3 ± 16.7* | 28.9 ± 9.4 | 209.8 ± 38.8† |
Download links
A two-part list of links to download the article, or parts of the article, in various formats.
Downloads (link to download the article as PDF)
Open citations (links to open the citations from this article in various online reference manager services)
Cite this article (links to download the citations from this article in formats compatible with various reference manager tools)
An essential cell-autonomous role for hepcidin in cardiac iron homeostasis
eLife 5:e19804.
https://doi.org/10.7554/eLife.19804


