The RFamide receptor DMSR-1 regulates stress-induced sleep in C. elegans
- Perelman School of Medicine, University of Pennsylvania, United States
- Katholieke Universiteit Leuven, Belgium
- University of Pennsylvania, United States
- Saint Joseph’s University, United States
Figures
Figure 1 with 1 supplement

Mutations in the seven-transmembrane domain protein DMSR-1 suppress flp-13 induced quiescence.
(A) Mutagenesis approach to identify the downstream signaling mechanism for FLP-13 peptides. The grand-daughters of Phsp-16.2:flp-13 worms that were mutagenized with the chemical ethyl methanesulfonate (EMS) were screened for rare animals that continued to feed and move after induction flp-13 overexpression. Moving animals were selected using a microfluidics automated assay (Yuan et al., 2015) and feeding animals were identified by direct observation of pharyngeal pumping movements. (B) The DMSR-1 protein is predicted to have seven transmembrane domains with a C-terminus tail of either 145 amino acids (isoform A) or 87 amino acids (isoform B). Five mutations in DMSR-1 result in premature stop codons, one mutation results in an alanine to valine change in the second extracellular loop, and one mutation results in the removal of the C-terminal half of the protein. (C) Phylogenetic tree relationship between 30 C. elegans proteins previously demonstrated or predicted to be RFamide receptors, three Drosophila melanogaster RFamide receptors (NM_139501; NP_647713; NP_647711), and one receptor from each Anopheles gambiae (XP_314133) and Rhodnius prolixus (Lee et al., 2015). Unless indicated otherwise, all proteins are from Caenorhabditis elegans. We drew a box to highlight DMSR-1 (isoform A). The evolutionary history was inferred by using the Maximum Likelihood method based on the JTT matrix-based model (Jones et al., 1992). The bootstrap consensus tree inferred from 1000 replicates is taken to represent the evolutionary history of the taxa analyzed. The percentage of replicate trees in which the associated taxa clustered together in the bootstrap test (1000 replicates) is shown next to the branches. Initial tree(s) for the heuristic search were obtained automatically by applying Neighbor-Join and BioNJ algorithms to a matrix of pairwise distances estimated using a JTT model, and then selecting the topology with superior log likelihood value. The analysis involved 35 amino acid sequences. All positions containing gaps and missing data were eliminated. There were a total of 181 positions in the final dataset. Evolutionary analyses were conducted in MEGA7 (Kumar et al., 2016).
Figure 1—figure supplement 1
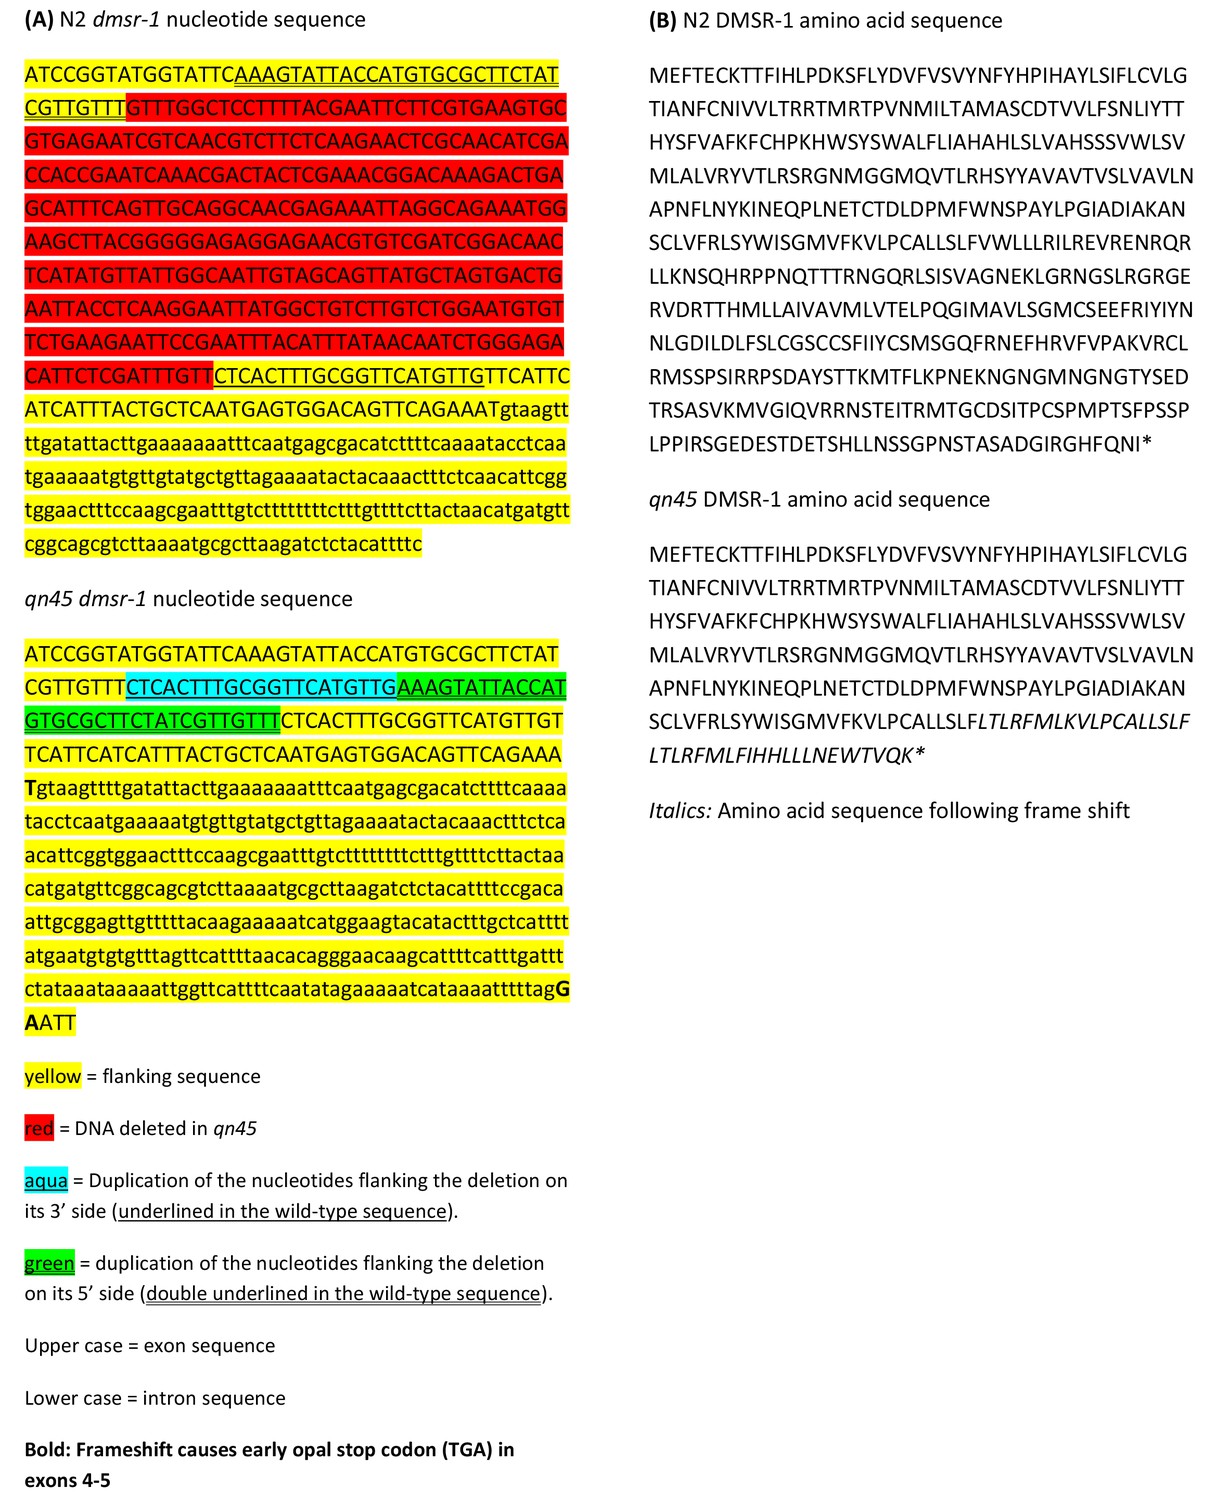
DNA rearrangement of dmsr-1 exon 4 in the qn45 allele.
(A) The qn45 mutant allele involved a deletion of 332 nucleotides and a duplication of 54 nucleotides flanking the deletion, with a net loss of 278 nucleotides. This insertion/deletion (indel) is predicted to cause a frameshift resulting in an early stop codon. This indel was identified using Sanger sequencing. (B) Predicted amino acid sequence of wild type (N2) DMSR-1 and qn45 DMSR-1 proteins. * indicates STOP codon.
Figure 2
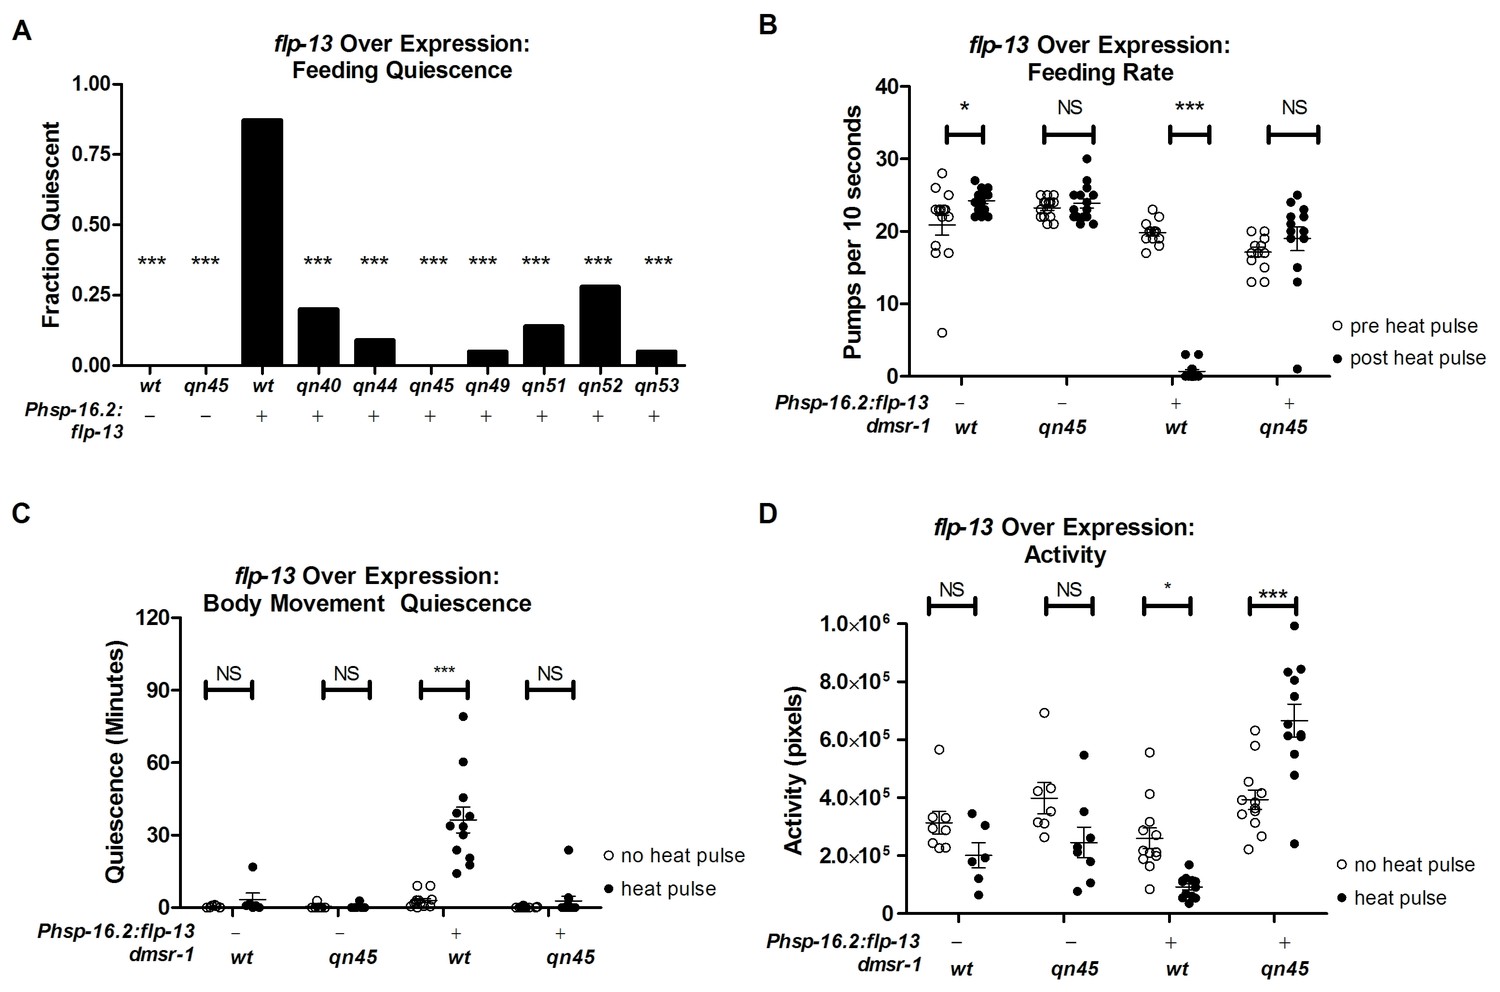
dmsr-1 mutations suppress flp-13 induced quiescence.
(A) Fraction of animals quiescent for pharyngeal pumping two hours after induction of flp-13 overexpression by exposure to a 30 min 33°C heat pulse. Statistical significance was assessed using a Fisher’s exact test. N = 15–20 for each genotype. Asterisks indicate significant difference (p<0.0001) compared to wild type animals two hours after heat pulse. (B) Rate of pharyngeal pumping in wild type or dmsr-1(qn45) mutants with or without the Phsp16.2:flp-13 transgene comparing the behavior pre-heat pulse to two hours post-heat pulse. (C) Body movement quiescence in a two hour period starting two hours after induction of flp-13 overexpression. (D) Total body movement activity in the same two-hour period as (C). Activity is the sum of pixels changed between sequential images. Statistical significance in panels B-D was assessed using a 2-Way ANOVA with post-hoc pairwise comparisons made using Bonferroni correction method. Error bars denote Mean ± SEM. *p<0.05, **p<0.01, ***p<0.001.
Figure 3 with 1 supplement
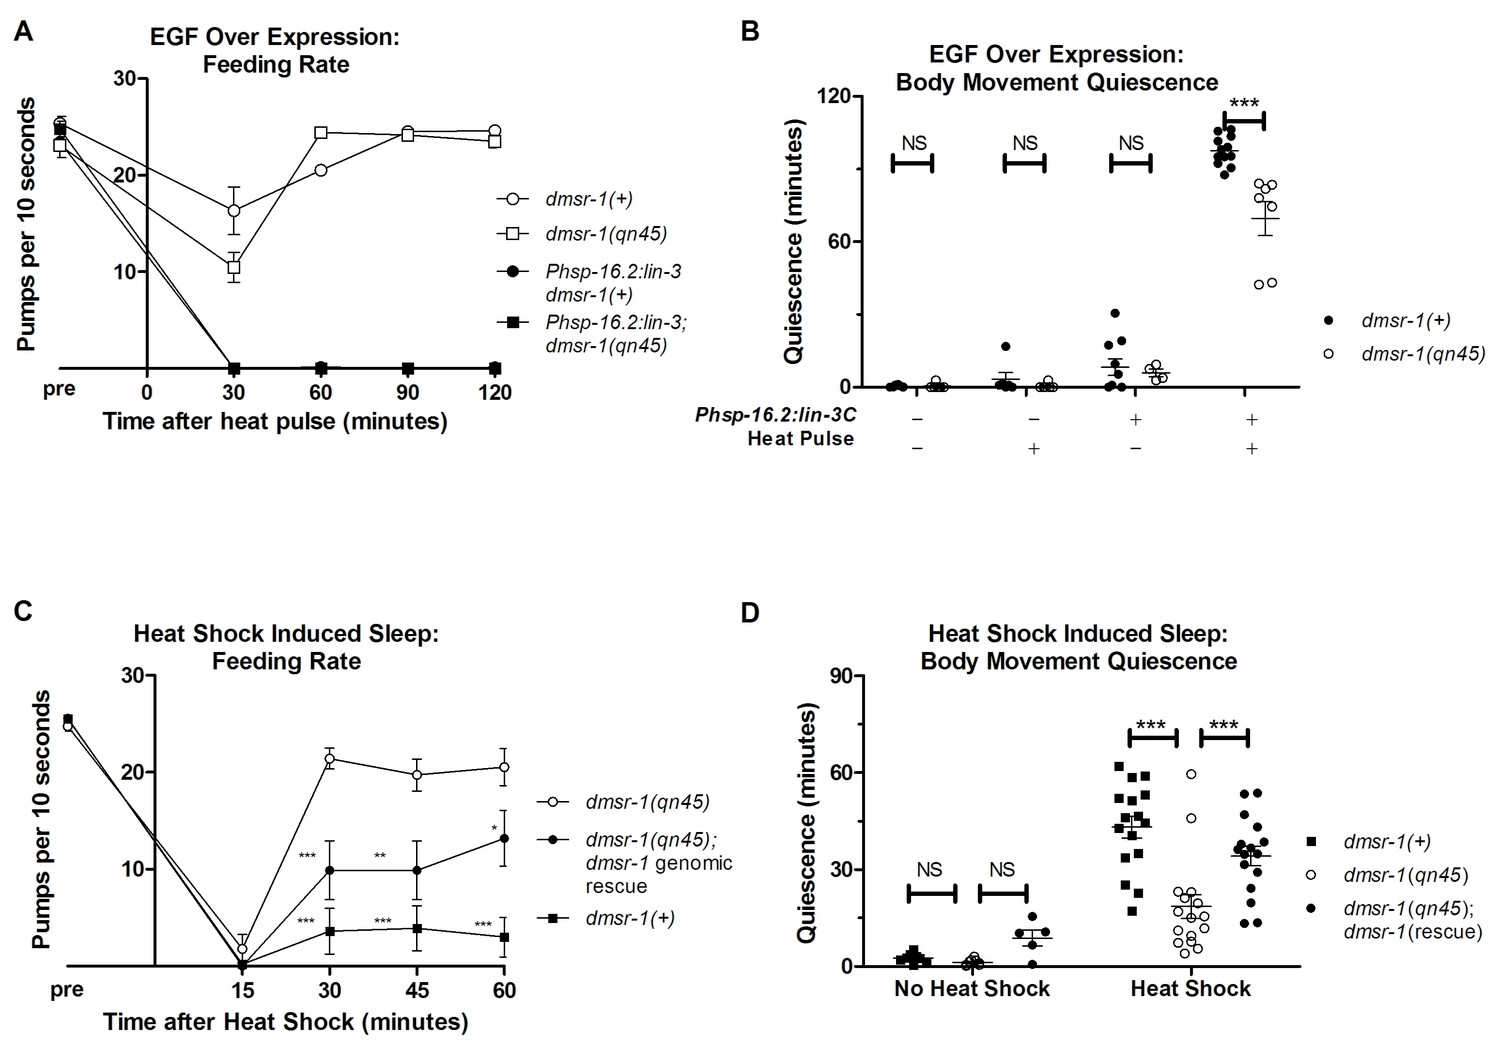
dmsr-1 mutants are defective in quiescence associated with stress-induced sleep.
(A) Rate of pharyngeal pumping before and up to two hours following heat pulse induction of EGF/LIN-3C overexpression. dmsr-1 does not suppress EGF induced feeding quiescence. (B) dmsr-1(qn45) partially suppresses body movement quiescence induced by EGF overexpression (Phsp-16.2:lin-3). Body movements were measured for two hours starting one hour after induction of EGF overexpression. (C) Rate of pharyngeal pumping in dmsr-1(qn45) mutants and dmsr-1 genomic rescue during the first hour following 35°C heat shock to induce SIS. Rescue construct is the operon-based reporter shown in Figure 5. Asterisks denote significant difference compared to dmsr-1(qn45). (D) Body movement quiescence during 90 min after a 35°C heat shock. The dmsr-1(qn45) mutation suppresses body movement quiescence in response to heat shock. This defect in quiescence is rescued by a genomic fragment containing dmsr-1. Statistical significance was assessed using a 2-Way ANOVA with post-hoc pairwise comparisons made using Bonferroni correction method. Error bars denote Mean ± SEM. *p<0.05, **p<0.01, ***p<0.001.
Figure 3—figure supplement 1
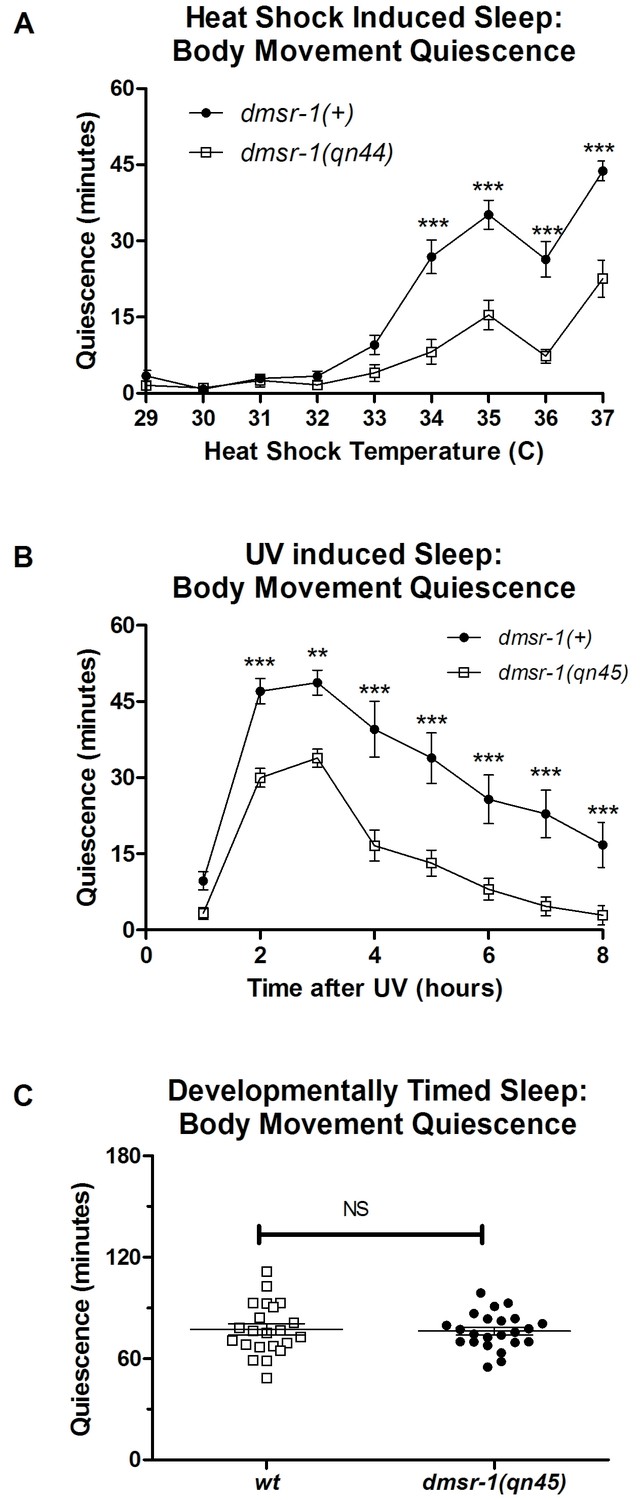
dmsr-1 mutants are defective in SIS triggered by different stressors but are not defective in developmentally timed sleep during lethargus.
(A) Total body movement quiescence during the first hour after exposure to the indicated temperature for 30 min. Error bars denote SEM. ***p<0.001. (B) Total body movement quiescence each hour after exposure to ultraviolet C (UVC) light. Error bars denote SEM. ***p<0.001. (C) Total body movement quiescence in the three hours after the start of L4 lethargus. NS denotes p>0.05.In panels A and B, statistical significance was assessed 2-Way ANOVA with post-hoc pairwise comparisons made using Bonferroni correction method, and in C with a two-tailed Student’s t test.
Figure 4
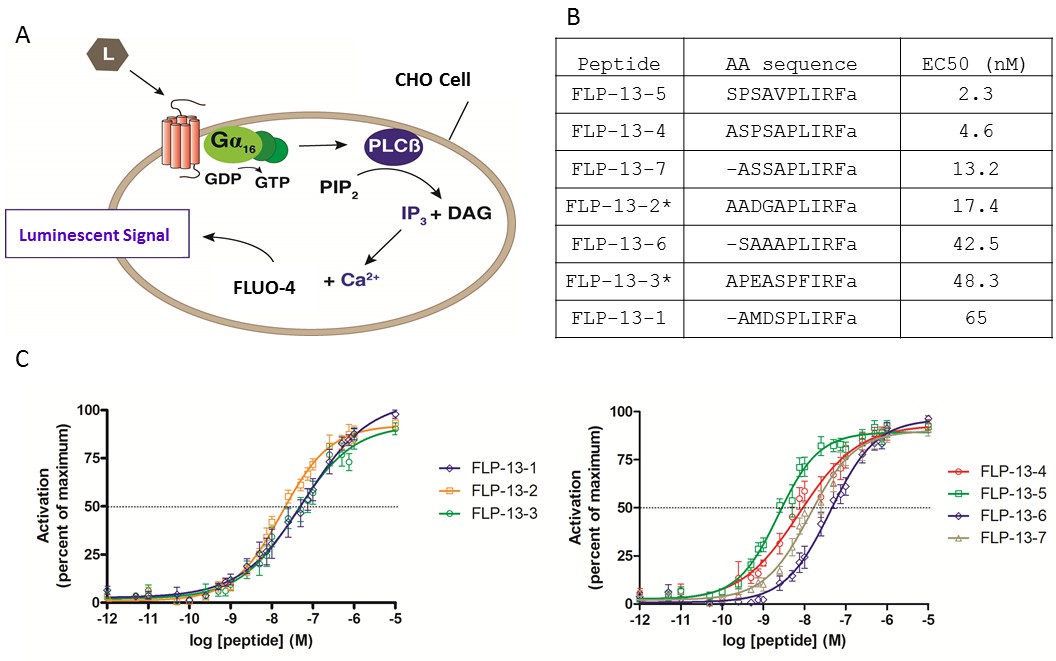
FLP-13 peptides activate DMSR-1 in a cell-based system.
(A) Signal transduction components in a cell system used to test for receptor activation by peptide ligands (L). DMSR-1A was expressed in CHO cells along with the calcium sensitive bioluminescent protein aequorin. The receptor was paired with the promiscuous human Gα16 protein, which causes calcium release from intracellular storage sites upon receptor activation. The calcium response elicits a luminescent signal from aequorin, a calcium-activated protein. (B) FLP-13 peptide sequences. flp-13 encodes seven distinct peptides (* indicates that this peptide is encoded by the gene sequence twice). EC50 indicates the concentration of neuropeptide required to elicit 50% of the maximum luminescent response from the aequorin protein (as shown in C). (C) Dose response curves for the seven FLP-13 peptides. Error bars represent SEM from 8–12 trials of neuropeptide treatment. Line represents non-linear regression fit of a variable slope line using four parameters. The x-axis is shown on a logarithmic scale.
Figure 5 with 2 supplements
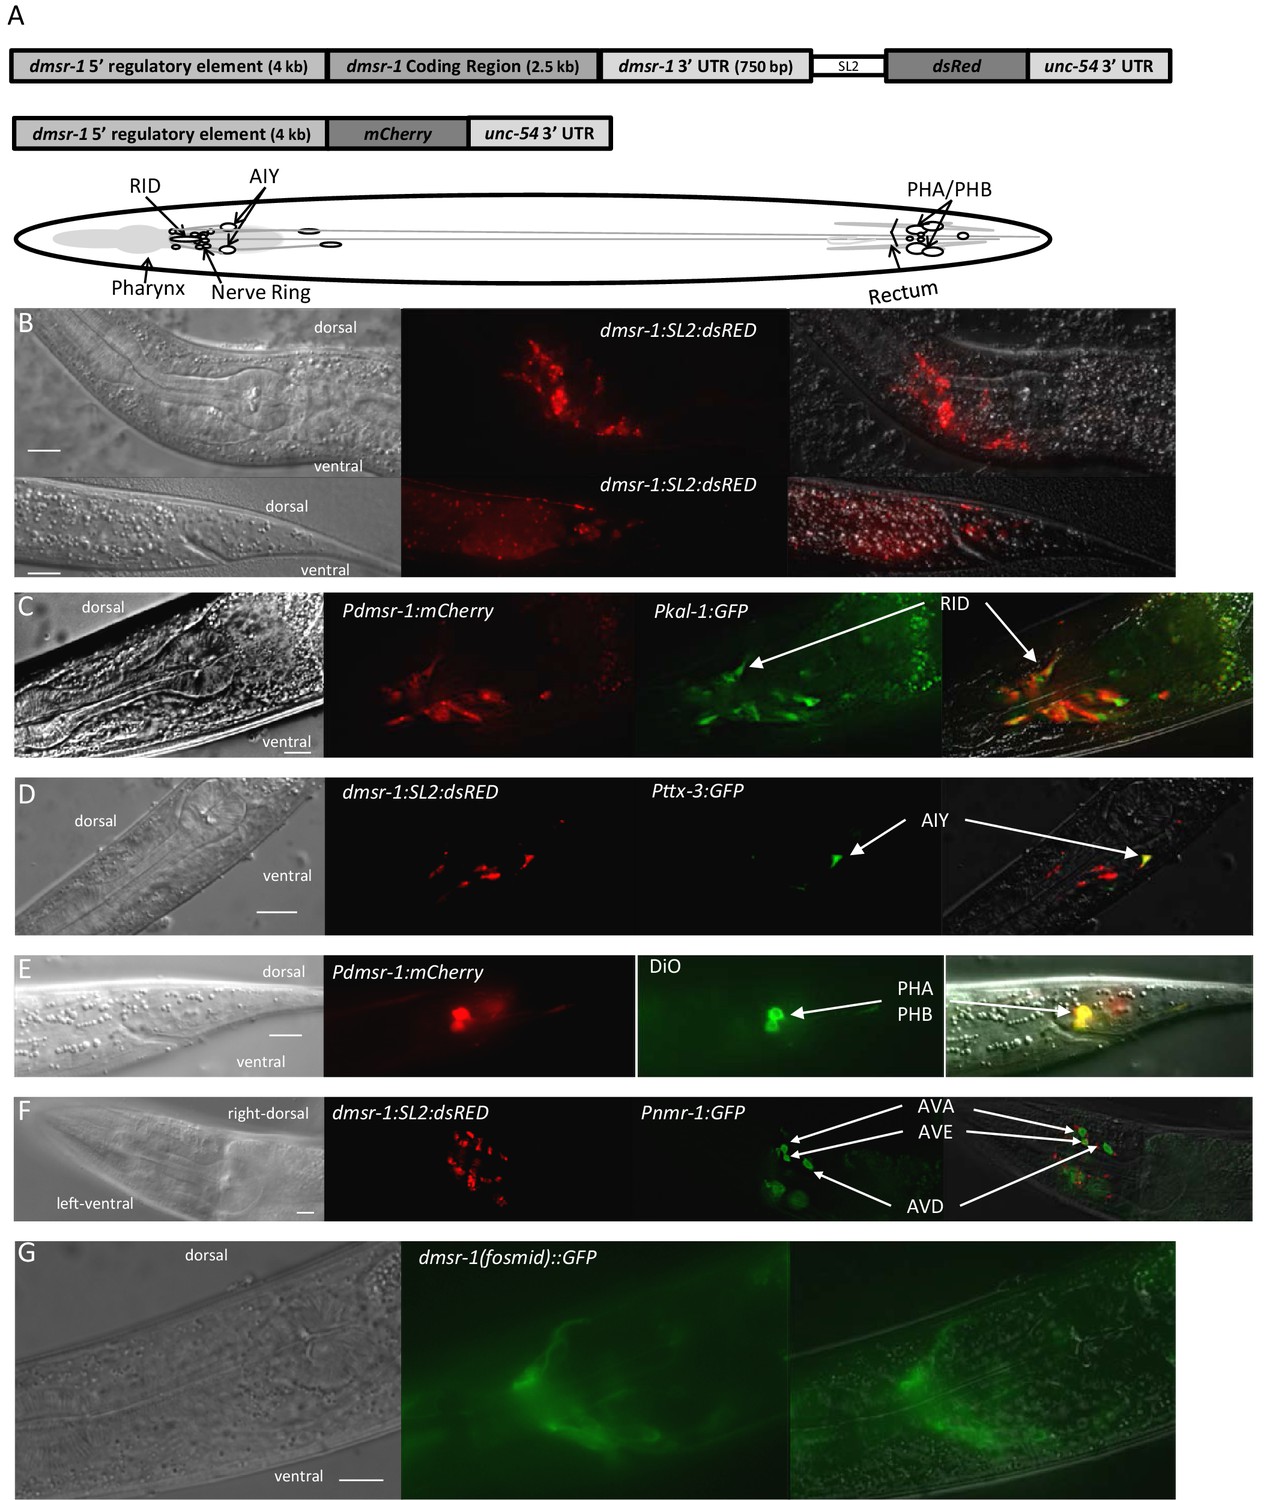
DMSR-1 is expressed non-synaptically in the nervous system.
(A) Schematic of operon (top) and promoter fusion (middle) transcriptional reporters used to determine expression pattern of dmsr-1. Schematic overview of dmsr-1 expression pattern, with identified neurons labelled. (B) Example images of dmsr-1 expression in head and tail. The images were processed by 3D deconvolution (Leica Application Suite X, Leica), and presented as a maximum projection of a Z-stack. In this and subsequent images, anterior is to the left. (C) Colocalization of dmsr-1 promoter reporter with kal-1 (Wenick and Hobert, 2004) in the RID neuron. The dmsr-1 promoter:mCherry reporter gave the same expression pattern as the operon-based transcriptional reporter shown in panel A. (D) Colocalization of dmsr-1 mCherry reporter with ttx-3 (Hobert et al., 1997) in an AIY neuron. Images were captured as a z-stack and processed by 3D deconvolution. One individual slice is shown. (E) DiO staining of tail phasmid neurons PHA and PHB, which colocalizes with the dmsr-1 red reporter. (F) Lack of colocalization of dmsr-1 promoter reporter with nmr-1 (Brockie et al., 2001) in command interneurons. Images were captured as a z-stack and processed by 3D deconvolution. One deconvolved slice, which shows all three neuron types, is shown. There is a red neuron that partially overlaps the green AVE neuron but our close evaluation of multiple worms shows that these neurons are distinct. (G) Membrane localization of GFP attached to the C-terminus of DMSR-1 using a fosmid construct (TransgeneOme project).
Figure 5—figure supplement 1
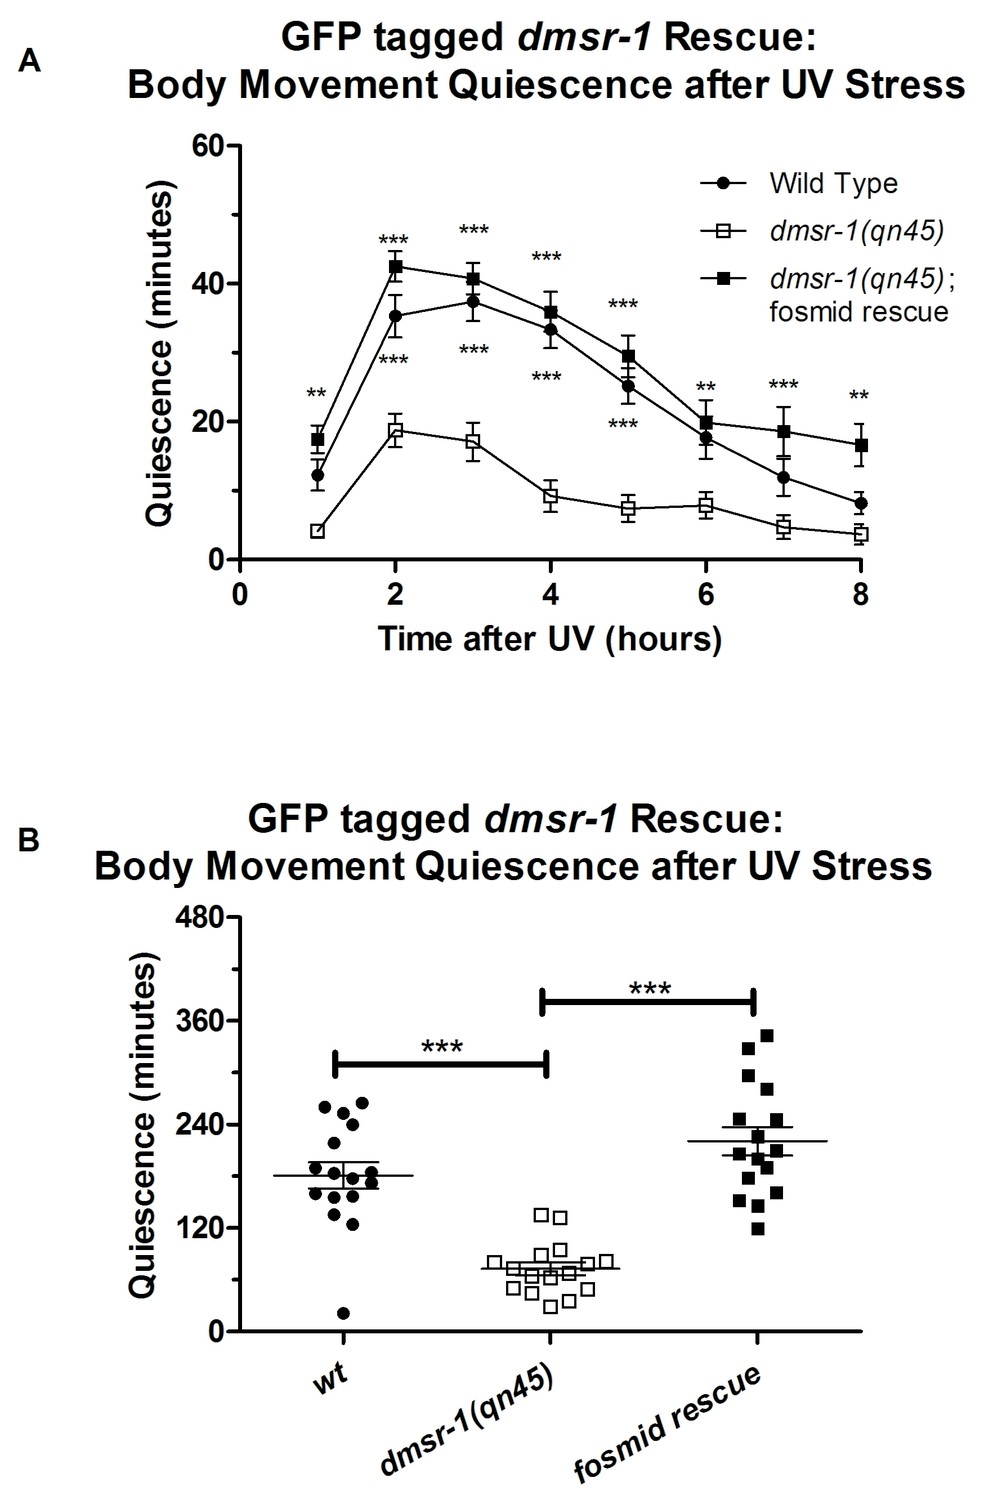
Rescue of the dmsr-1 mutant quiescence-defective phenotype with a fosmid that encodes a GFP tag at the c-terminus of DMSR-1.
(A) Body movement quiescence following UV exposure calculated in one hour intervals. Two-way repeated measures ANOVA with Bonferroni corrected comparisons for post-test. Comparisons are displayed as differences between the indicated line and dmsr-1(qn45) without the rescue construct. *p<0.05; **p<0.01; ***p<0.001. (B) Body movement quiescence during the 8-hr period following UV exposure. One-way ANOVA with Tukey HSD post-test.*p<0.05; **p<0.01; ***p<0.001.
Figure 5—figure supplement 2
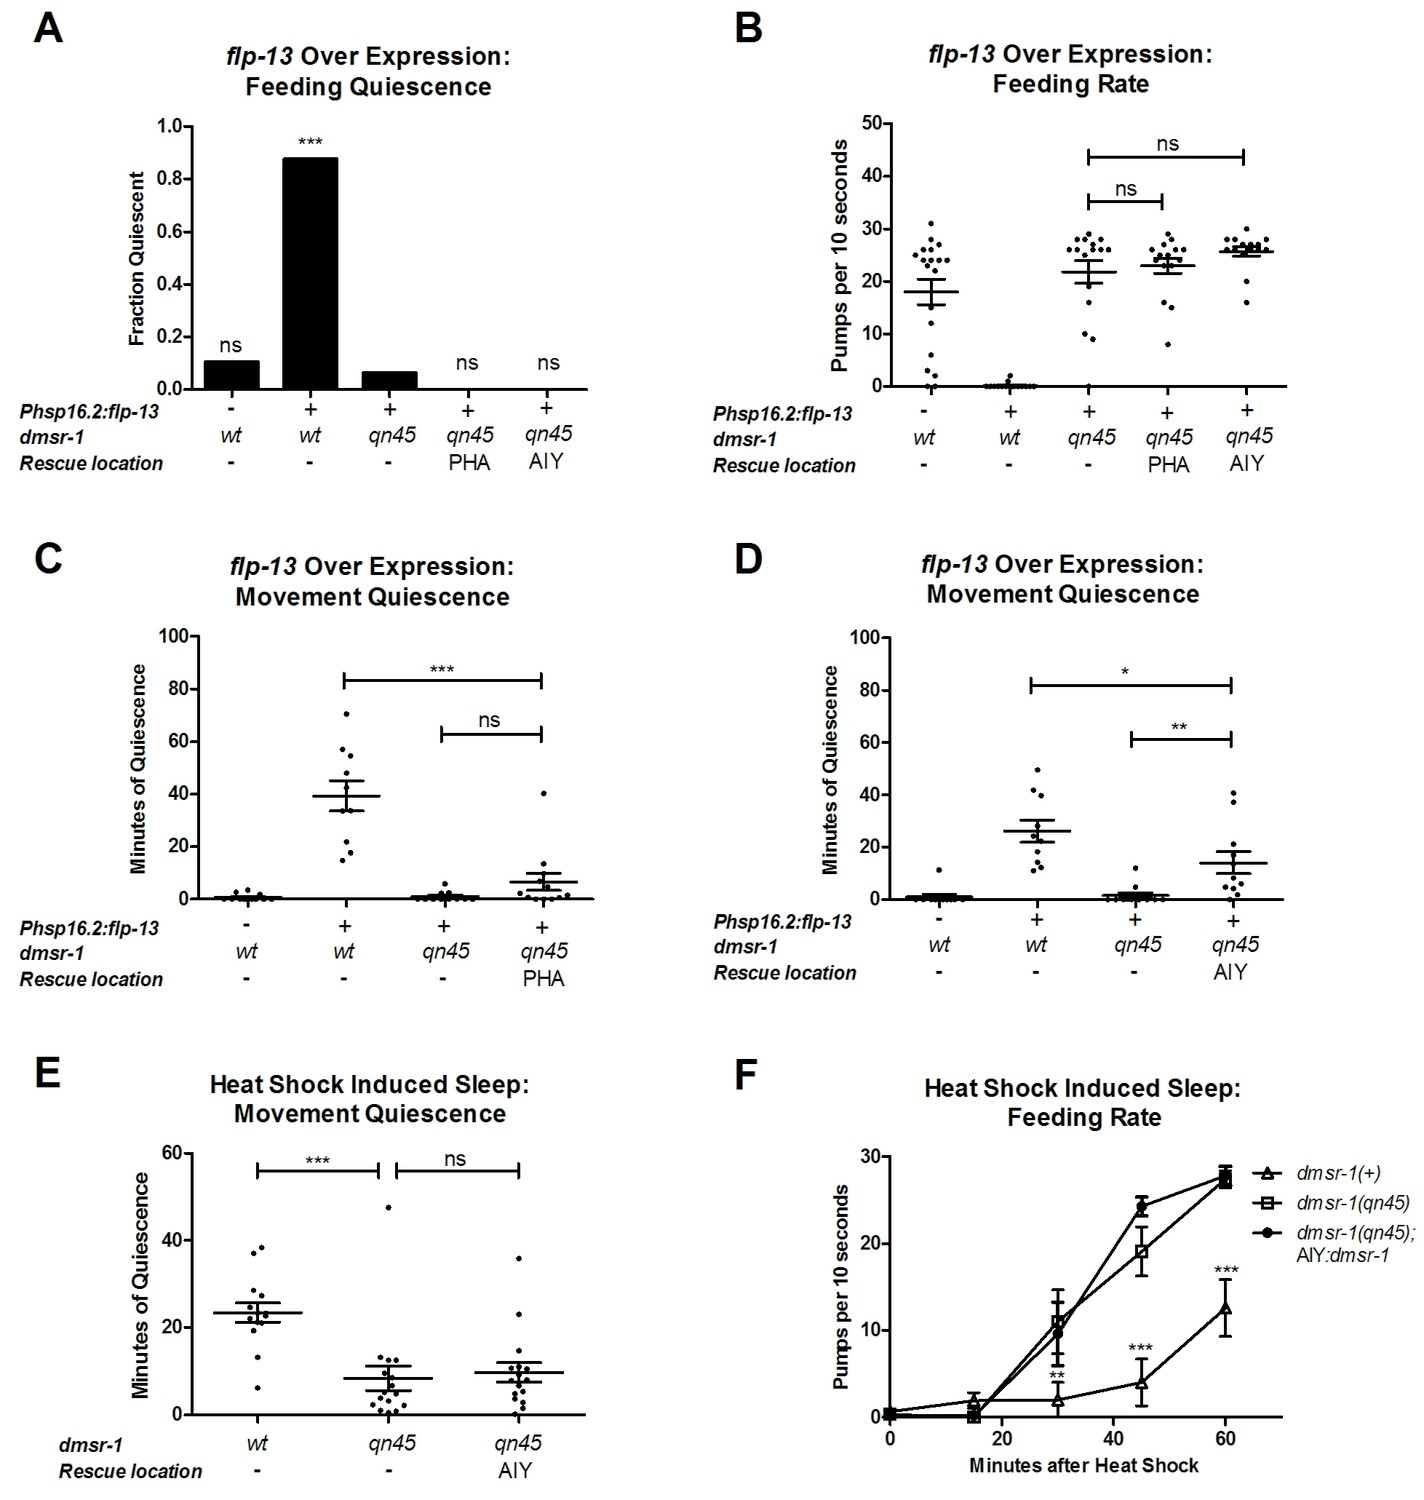
Effects of selective expression of dmsr-1 in the paired AIY head neurons or in the paired PHA tail neurons.
(A) Fraction of animals quiescent for pharyngeal pumping two hours after induction of flp-13 overexpression using a 30 min 33°C heat pulse of hsp16.2:flp-13 or control animals. Statistical significance was assessed using a Fisher’s exact test. N = 15–20 for each genotype. (B) Pharyngeal pumping rates two hours after induction of flp-13 overexpression using a 30 min 33°C heat pulse of hsp16.2:flp-13 or control animals. Statistical significance was assessed using a 1-way ANOVA with Dunnett’s post-hoc pairwise comparisons with hsp16.2:flp-13; dmsr-1(qn45) animals. (C) and (D) Body movement quiescence in a two-hour period starting at two hours after induction of flp-13 overexpression. Statistical comparisons were made using 1-way ANOVA with Tukey HSD post-test. (E) Body movement quiescence for 60 min following a 30 min 35°C exposure to induce SIS. Statistical comparisons were made using 1-way ANOVA with Dunnett’s post-hoc pairwise comparisons with dmsr-1(qn45) animals. (F) Pharyngeal pumping rate following a 30 min 35°C exposure to induce SIS. Two-way repeated measures ANOVA with Bonferroni corrected comparisons for post-test. Comparisons are displayed as differences between the indicated line and dmsr-1(qn45).In all panels, bars denote the mean and SEM, ns denotes not significant, * denotes p<0.05, **p<0.01, and ***p<0.001.
Figure 6
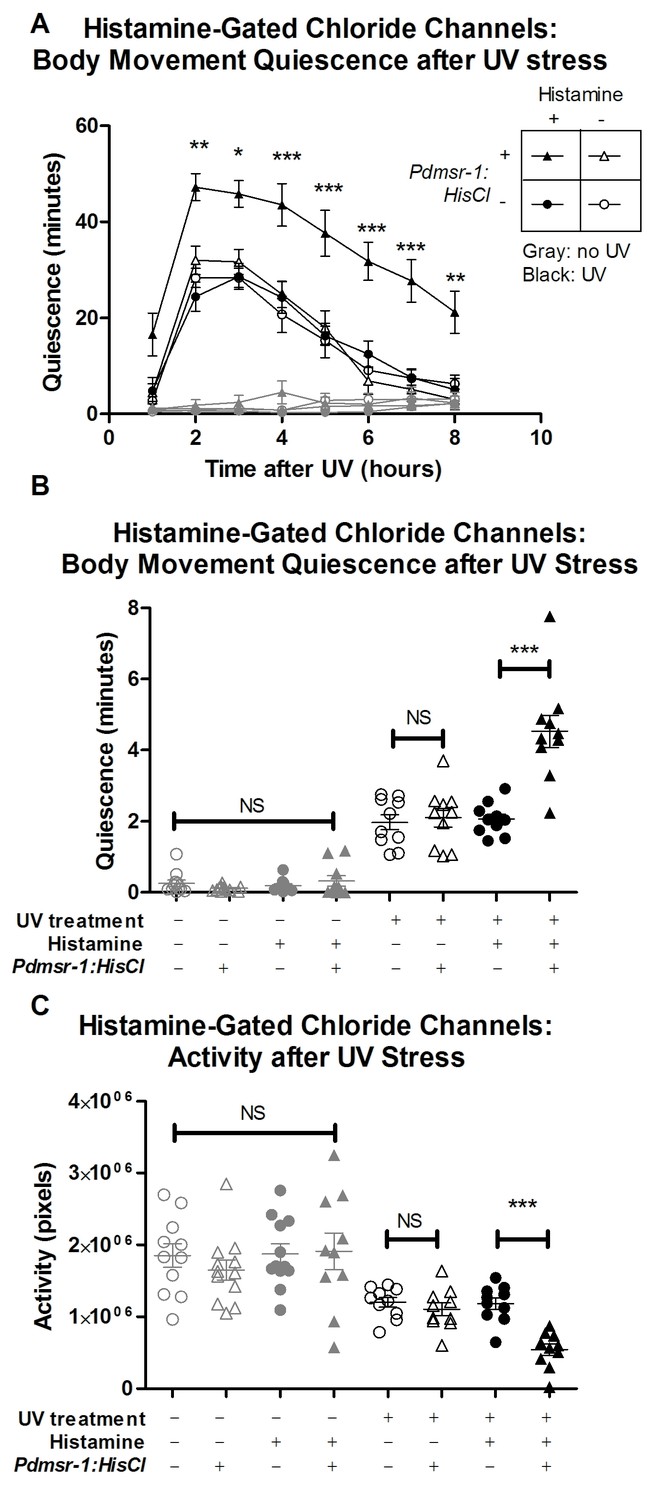
DMSR-1 has an inhibitory effect on neurons.
(A) Pdmsr-1:HisCl worms were placed on histamine-containing agar, and sleep was induced by ultraviolet C (UVC) light irradiation. Worms were compared to the wild type strain (N2) on histamine, as well as to worms not exposed to histamine. Gray lines indicate control worms that were not exposed to UVC light, whose quiescence was not affected by activation of HisCl channels. Statistical comparisons were performed using a 2-way repeated measures ANOVA using time and experimental group as factors. Asterisks indicate lowest level of significance in comparisons between Pdmsr-1:HisCl on histamine with each of the other groups in pairwise comparison using Bonferroni correction. *p<0.05, **p<0.005, ***p<0.0005. (B) Total amount of sleep over eight hours from Figure 6A for each individual worm. There was a significant interaction between histamine and HisCl channels such that HisCl channels only increased sleep in the presence of histamine. ***p<0.0005. There were no significant effects found for worms that were not irradiated with UV. NS denotes not significant. (C) Total activity analysis across an eight-hour period. HisCl channels reduced activity only in animals exposed to histamine, and there were no significant effects for worms that were not irradiated with UV. ***p<0.0005. NS denotes not significant. In all three panels, triangles represent animals that expressed Pdmsr-1:HisCl, circles represent animals that do not express Pdmsr-1:HisCl, filled symbols represent animals that have been exposed to histamine, empty symbols represent animals that have not been exposed to histamine, black symbols represent animals that have been exposed to UV irradiation, and gray symbols represent animals that were not exposed to UV irradiation. In panels B and C, statistical significance was assessed with a 2×2 Factorial ANOVA with Bonferroni post-hoc correction.
Figure 7
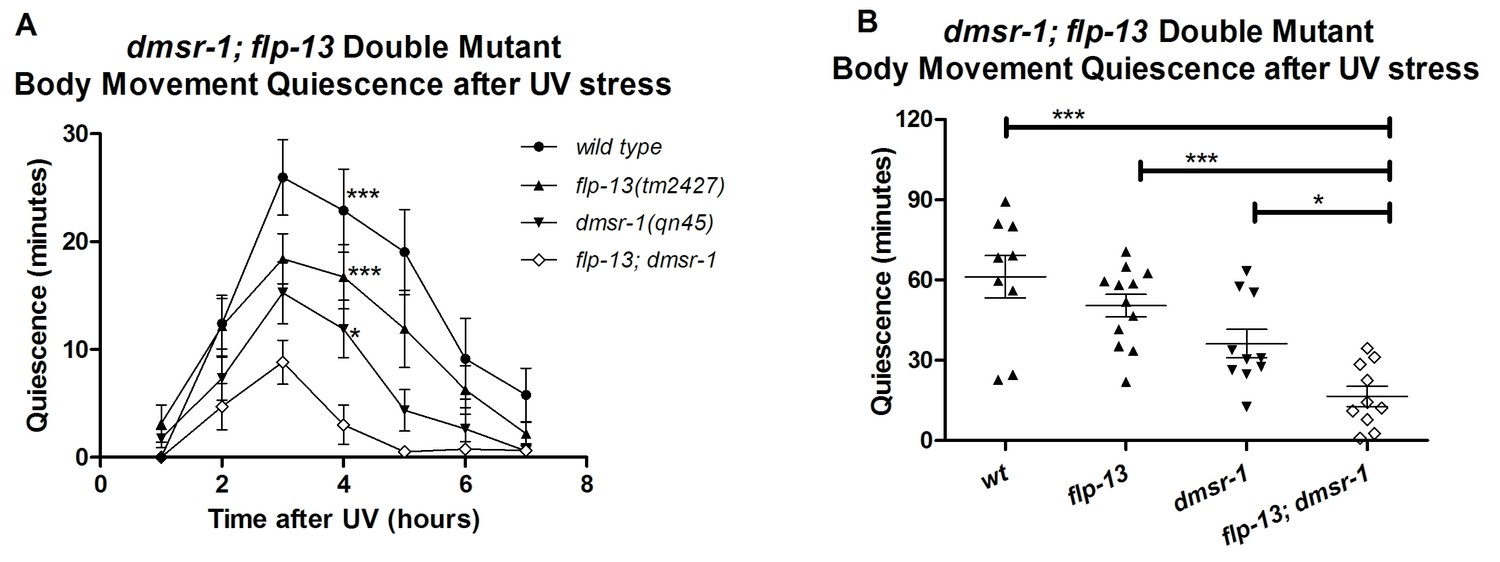
DMSR-1 and FLP-13 neuropeptides have parallel activity.
(A) Double mutant analysis between flp-13 and dmsr-1. Total amount of body movement quiescence was measured following UV irradiation. Statistical comparisons were made using 2-way repeated measures ANOVA with post-hoc pairwise Bonferroni correction method and restricted to comparisons made with the double mutant. (B) Total quiescence during first four hour period following UV irradiation shown in Figure 7A. Statistical comparisons were made using 1-way ANOVA with Dunnett’s post-hoc pairwise comparisons with the double mutant.
Figure 8

Model for the regulation of stress-induced sleep.
Cellular stress leads to the release of EGF (LIN-3) either directly from the stressed cells or indirectly via other cells receiving a signal from the stressed cells. EGF activates the ALA neuron by binding to the EGF receptor (LET-23). ALA depolarizes and releases FLP-13 neuropeptides, among other sleep inducing signals. FLP-13 peptides signal in a non-synaptic fashion via the seven-transmembrane domain receptor DMSR-1 and the G protein alpha subunit Gi/o to inhibit several wake-promoting neurons. These neurons include AIY, PHA, PHB, RID, and other neurons.
Additional files
-
Supplementary file 1
List of neurons in which dsmr-1 is either expressed or not expressed.
- https://doi.org/10.7554/eLife.19837.015
-
Supplementary file 2
Sequences of oligonucleotides used for sequencing and cloning.
- https://doi.org/10.7554/eLife.19837.016
Download links
A two-part list of links to download the article, or parts of the article, in various formats.
Downloads (link to download the article as PDF)
Open citations (links to open the citations from this article in various online reference manager services)
Cite this article (links to download the citations from this article in formats compatible with various reference manager tools)
The RFamide receptor DMSR-1 regulates stress-induced sleep in C. elegans
eLife 6:e19837.
https://doi.org/10.7554/eLife.19837


