Neuroendocrine modulation sustains the C. elegans forward motor state
- Lunenfeld-Tanenbaum Research Institute, Mount Sinai Hospital, Canada
- Institute of Medical Science, University of Toronto, Canada
- University of Toronto, Canada
- Technische Universität Braunschweig Carolo Wilhelmina, Germany
- Nanjing University, China
- Harvard University, United States
- Vanderbilt University, United States
Figures
Figure 1
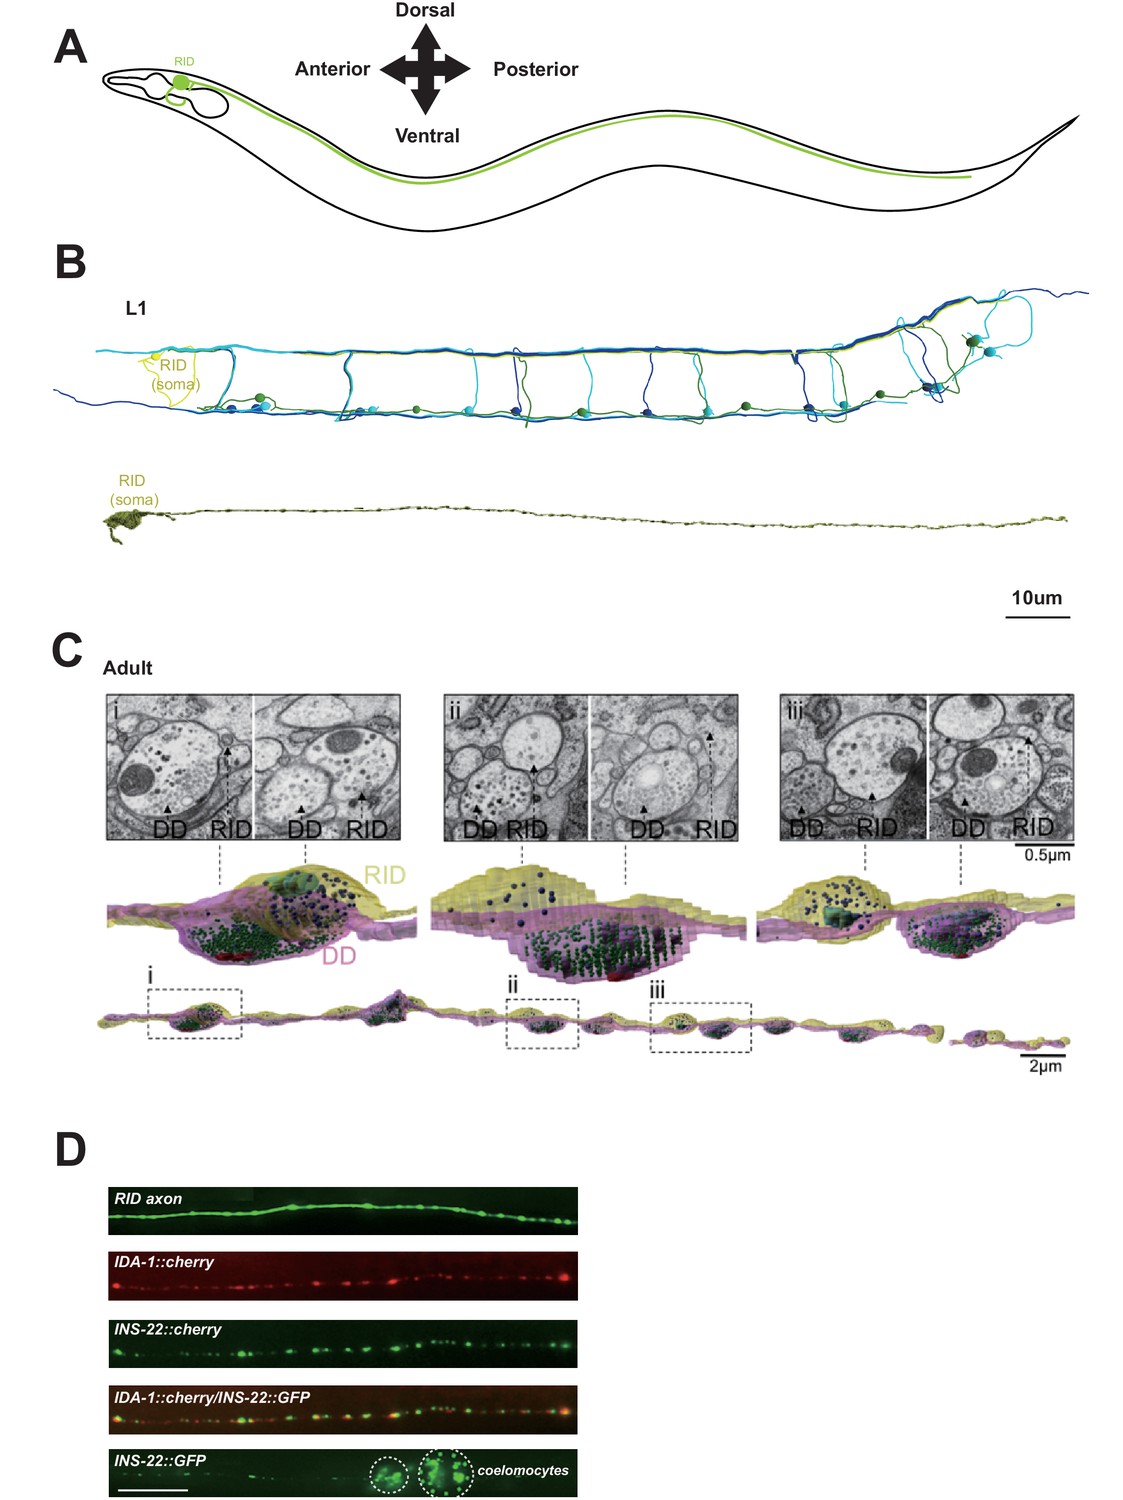
RID is a peptidergic neuron.
(A) Schematic of the RID neuron. (B) sTEM reconstruction of RID and motor neurons in a L1 animal. Top panel, Skeletal reconstruction of motor neurons and respective processes in dorsal nerve cord (DNC). Yellow, RID; Green, DD; Light blue, DA; Dark blue, DB. Bottom panel, Volumetric reconstruction of the L1 RID cell body and dorsal cord neurite showed periodic swellings along the RID neurite. (C) Volumetric reconstruction of a portion of the RID axon in a young adult. Bottom, The neurite of RID (yellow), DD (pink). Middle, higher magnification versions of the regions indicated by the dashed boxes i, ii and iii. Top, Representative EM cross-section images of RID and DD boutons in the adult DNC. In the volumetric reconstruction, green spheres indicate synaptic vesicles (SVs), blue spheres dense core vesicles (DCVs), red shading indicates active zones, and light blue shading indicates mitochondria. (D) Top panels, a cytoplasmic GFP reporter illustrates the RID axon, followed by reporters for the DCV membrane protein IDA-1 and the neuropeptide INS-22 along the RID axon. Bottom panel, INS-22::GFP accumulated at coelomocytes (dotted circle), indicating that it was secreted. Scale bar, 5 μm.
Figure 2 with 1 supplement
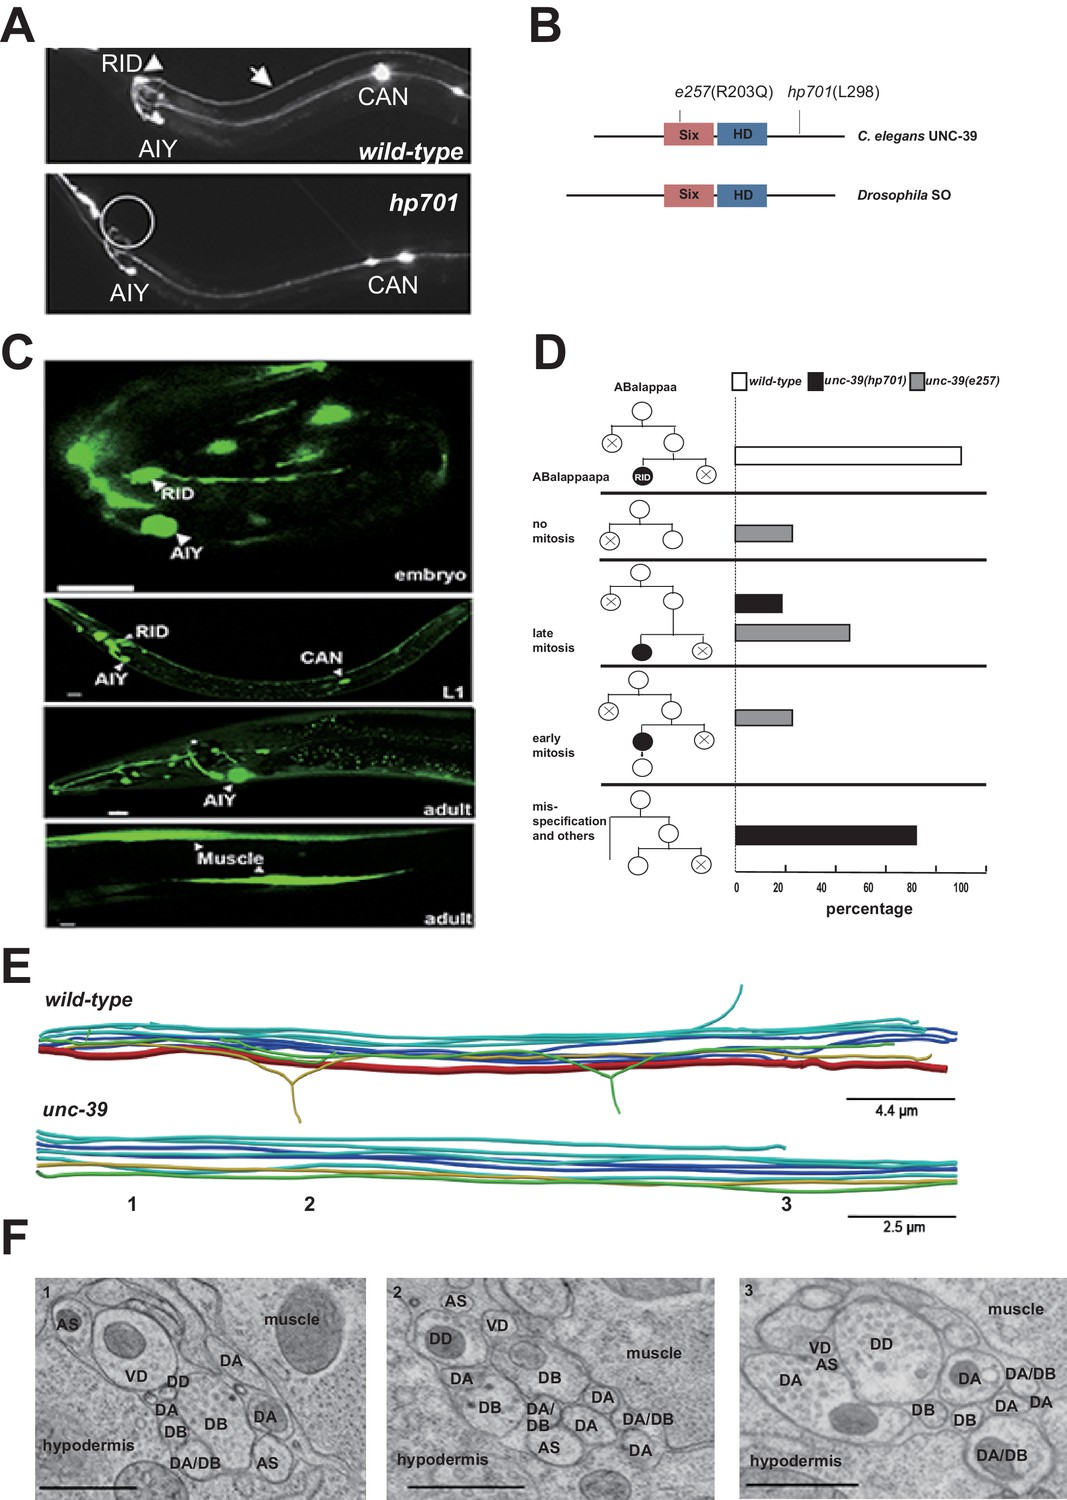
RID fails to differentiate in unc-39 mutants.
(A) In unc-39 mutants, RID soma (circle) and axon could not be detected by the Pceh-10-GFP marker, while other Pceh-10-GFP cells are present. Scale bar, 10 μm. (B) A predicted protein structure of UNC-39 compared with its Drosophila homologue SO, denoted with allelic information of hp701 and e257 mutations. (C) unc-39 expression in the nervous system was observed in embryos (top panel), newly hatched L1 larvae (middle panel), and young adults (lower two panels). Scale bar, 10 μm. (D) Lineage map of ABalappaa, the neuroblast that gives rise to RID (ABalappaapa) in embryos of wild-type animals and unc-39 mutants. unc-39 mutants exhibited a range of mitosis changes. (E) Skeletal sTEM reconstruction of a fragment of the DNC of a wild-type and unc-39 mutant. The RID axon is absent from the unc-39 DNC. Red, RID; Yellow, DD; Green, VD; Light blue, DA/AS; Dark blue, DB. (F) Representative images of the EM cross-section from the DNC of unc-39 mutants. Numbers (1-3) denote their approximate locations in E. RID process is absent in all three sections. The identity of neurons, hypodermis and muscles are labeled accordingly. Scale bar, 500 nm.
Figure 2—figure supplement 1
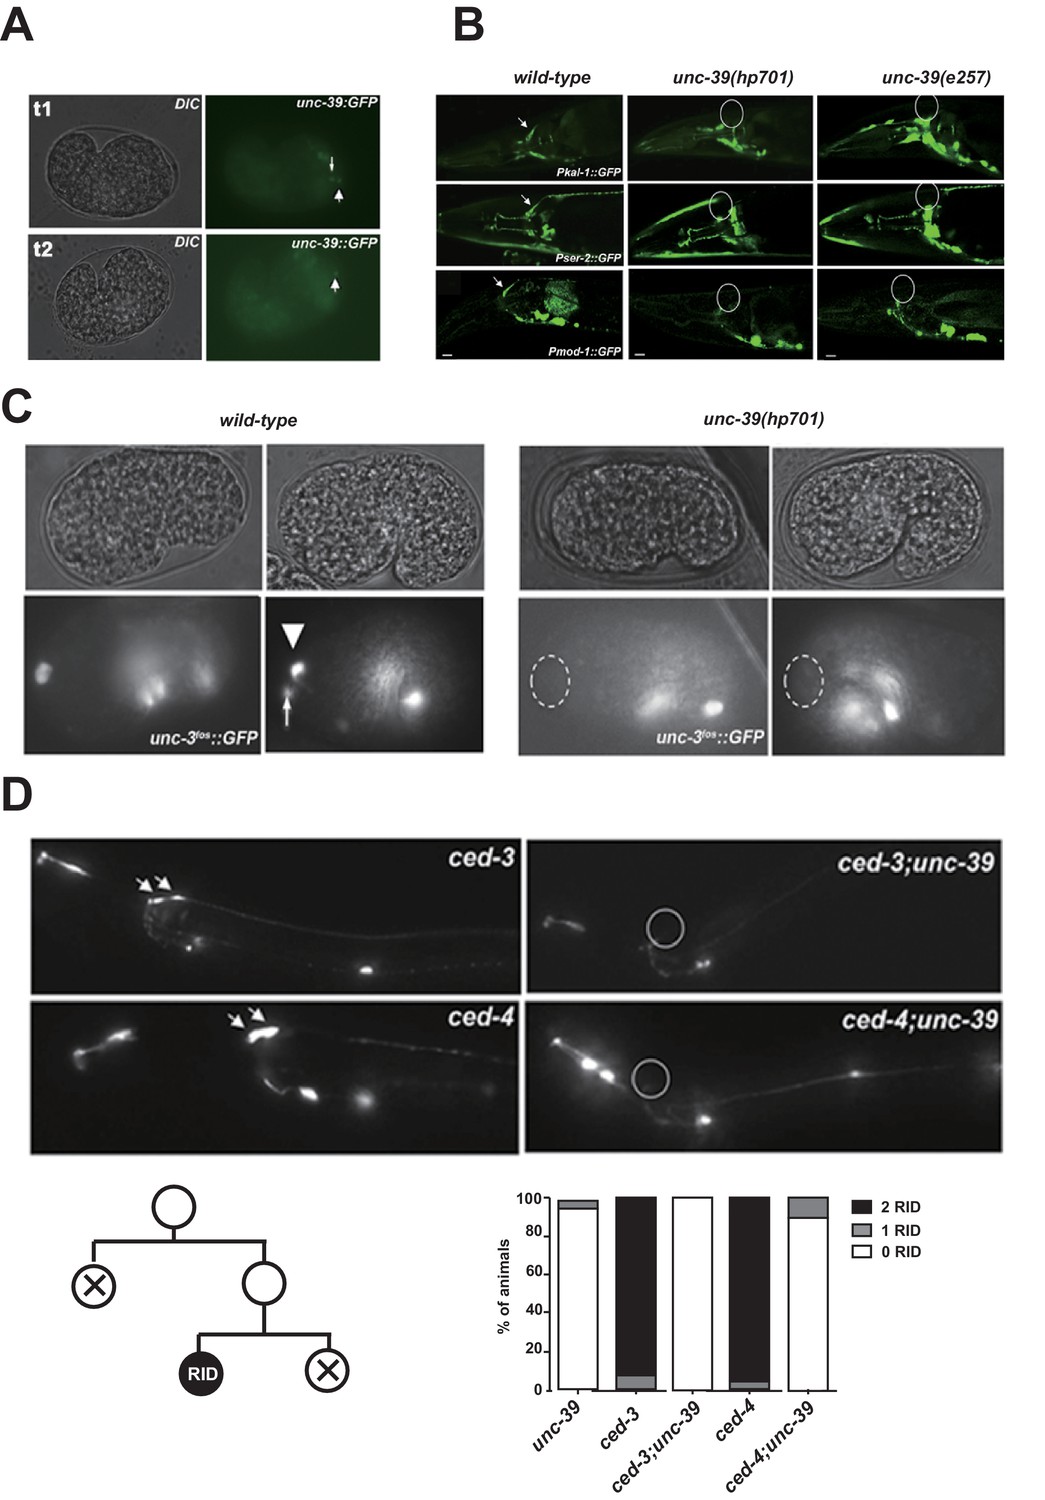
The expression pattern of UNC-39::GFP and phenotypes of unc-39 mutants.
(A) During embryogenesis, unc-39::GFP is expressed in both RID (arrowhead) and the RID sister cell (arrow) (t1), before the latter dies as a result of apoptosis (t2). (B) Known RID cell fate markers, such as kal-1 (top panel), ser-2 (middle panel), and mod-1 (bottom panel) are present in wild type animals (arrow), but not unc-39 mutants hp701 and e257. (C) During early embryogenesis, the RID lineage-specific apoptosis activator UNC-3 is expressed in RID and the RID sister cell, but not in unc-39 mutants. (D) The absence of RID in unc-39 mutants is not due to ectopic apoptosis. Bottom Left, A schematic of the RID cell lineage: the ABalappaa neuroblast undergoes two consecutive rounds of mitosis to give rise to RID. Both the sisters of the RID precursor and RID undergo apoptosis. Top Panel, Apoptotic mutants ced-3 and ced-4 possess two RID neurons resulting from failure to activate apoptosis in the RID sister (arrowheads). However, a majority of unc-39; ced-3 and unc-39; ced-4 mutants still do not possess RID. Bottom Right, Quantification of genetic interaction from top panel. N = 10 animals/genotype. For B, C, and D, the putative position of RID and/or RID sister cell in unc-39 mutants is designated by a circle.
Figure 3
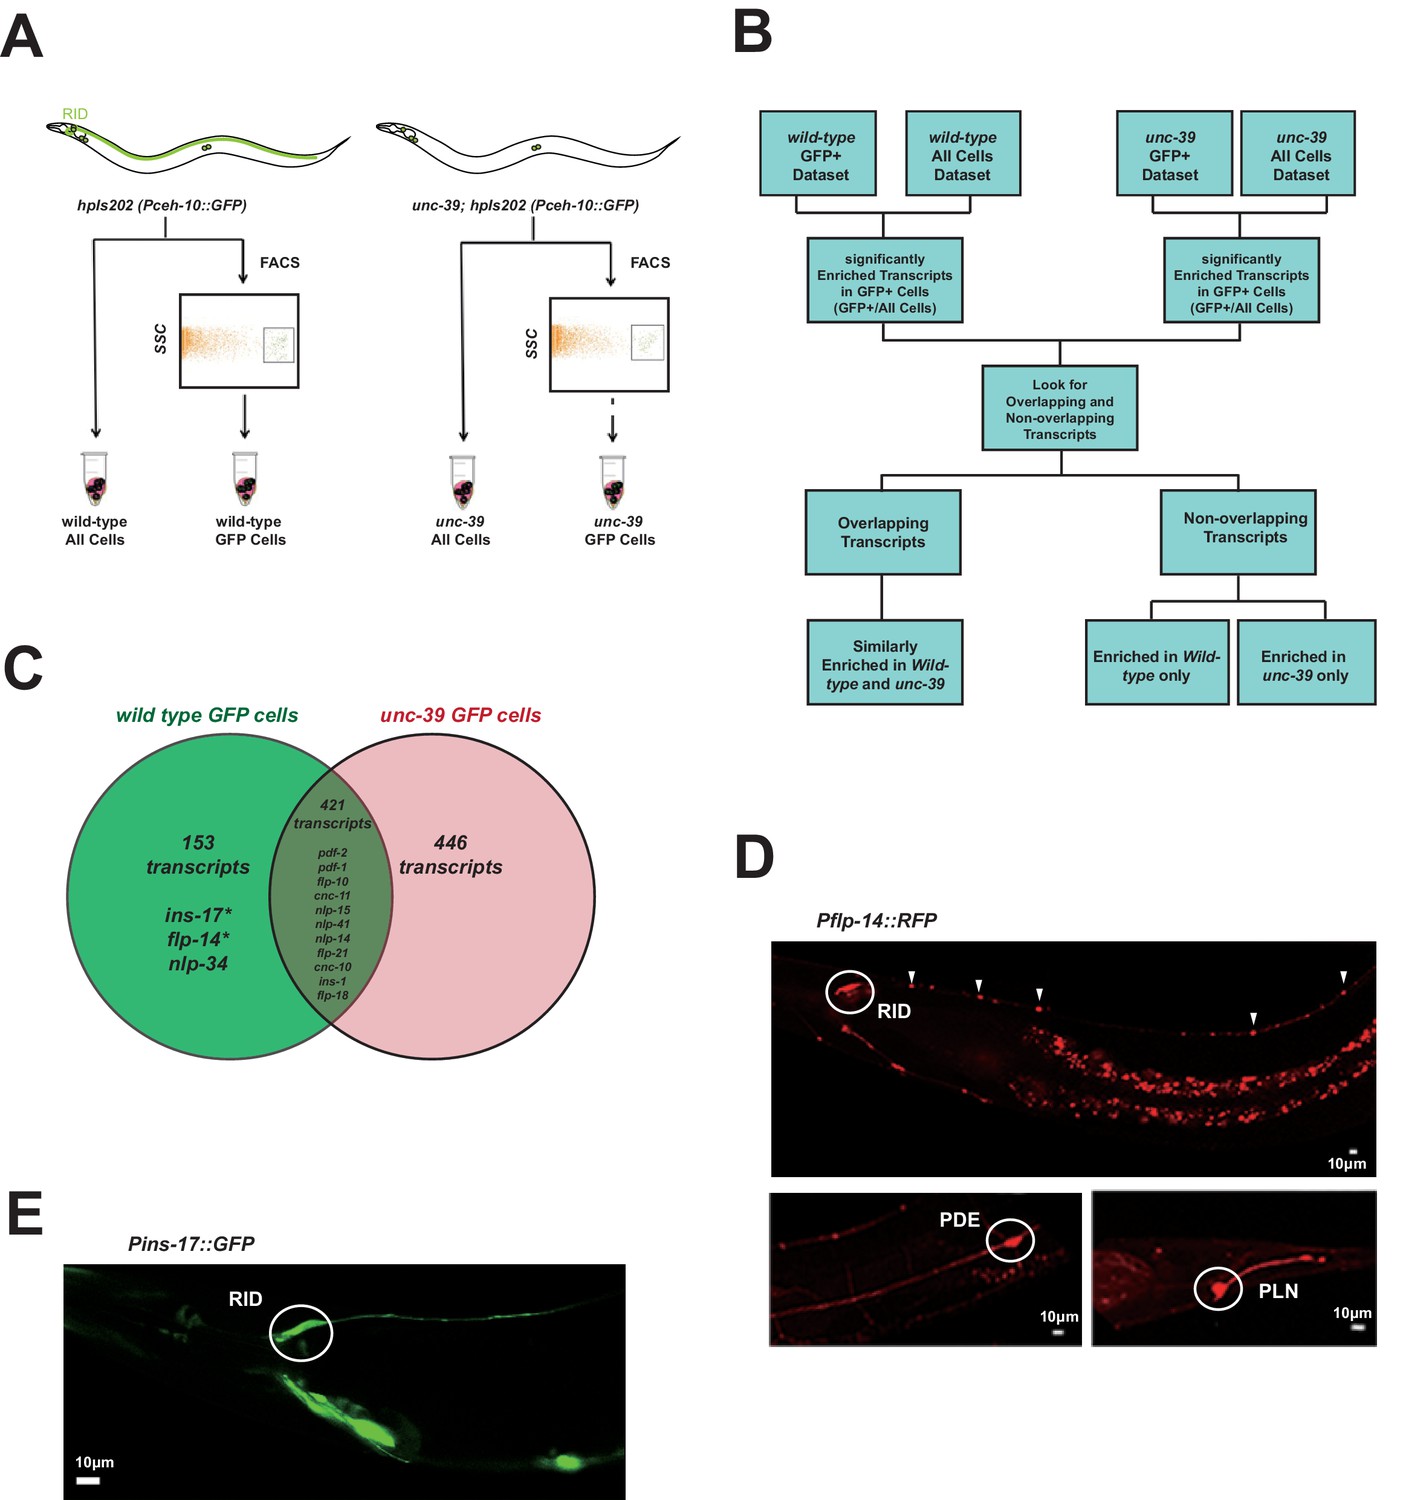
Subtractive transcriptome profiling reveals neuropeptides expressed by RID.
(A) The experimental design and schematic of cell isolation protocol by flow cytometry. SSC, side scatter. (B) The workflow of data analysis. (C) A venn diagram representation of neuropeptide transcripts enriched in wild-type and unc-39 datasets. (D) A transcriptional reporter of Pflp-14 exhibits expression in RID cell body (circle), along the RID axon (arrowheads) and other neurons, including those in the mid-body (PDE, bottom left panel) and tail (PLN, bottom right panel). Scale bar, 10 μm. (E) A transcriptional reporter of Pins-17 exhibits expression in RID (circle) and other unidentified neurons. Scale bar, 10 μm.
Figure 4
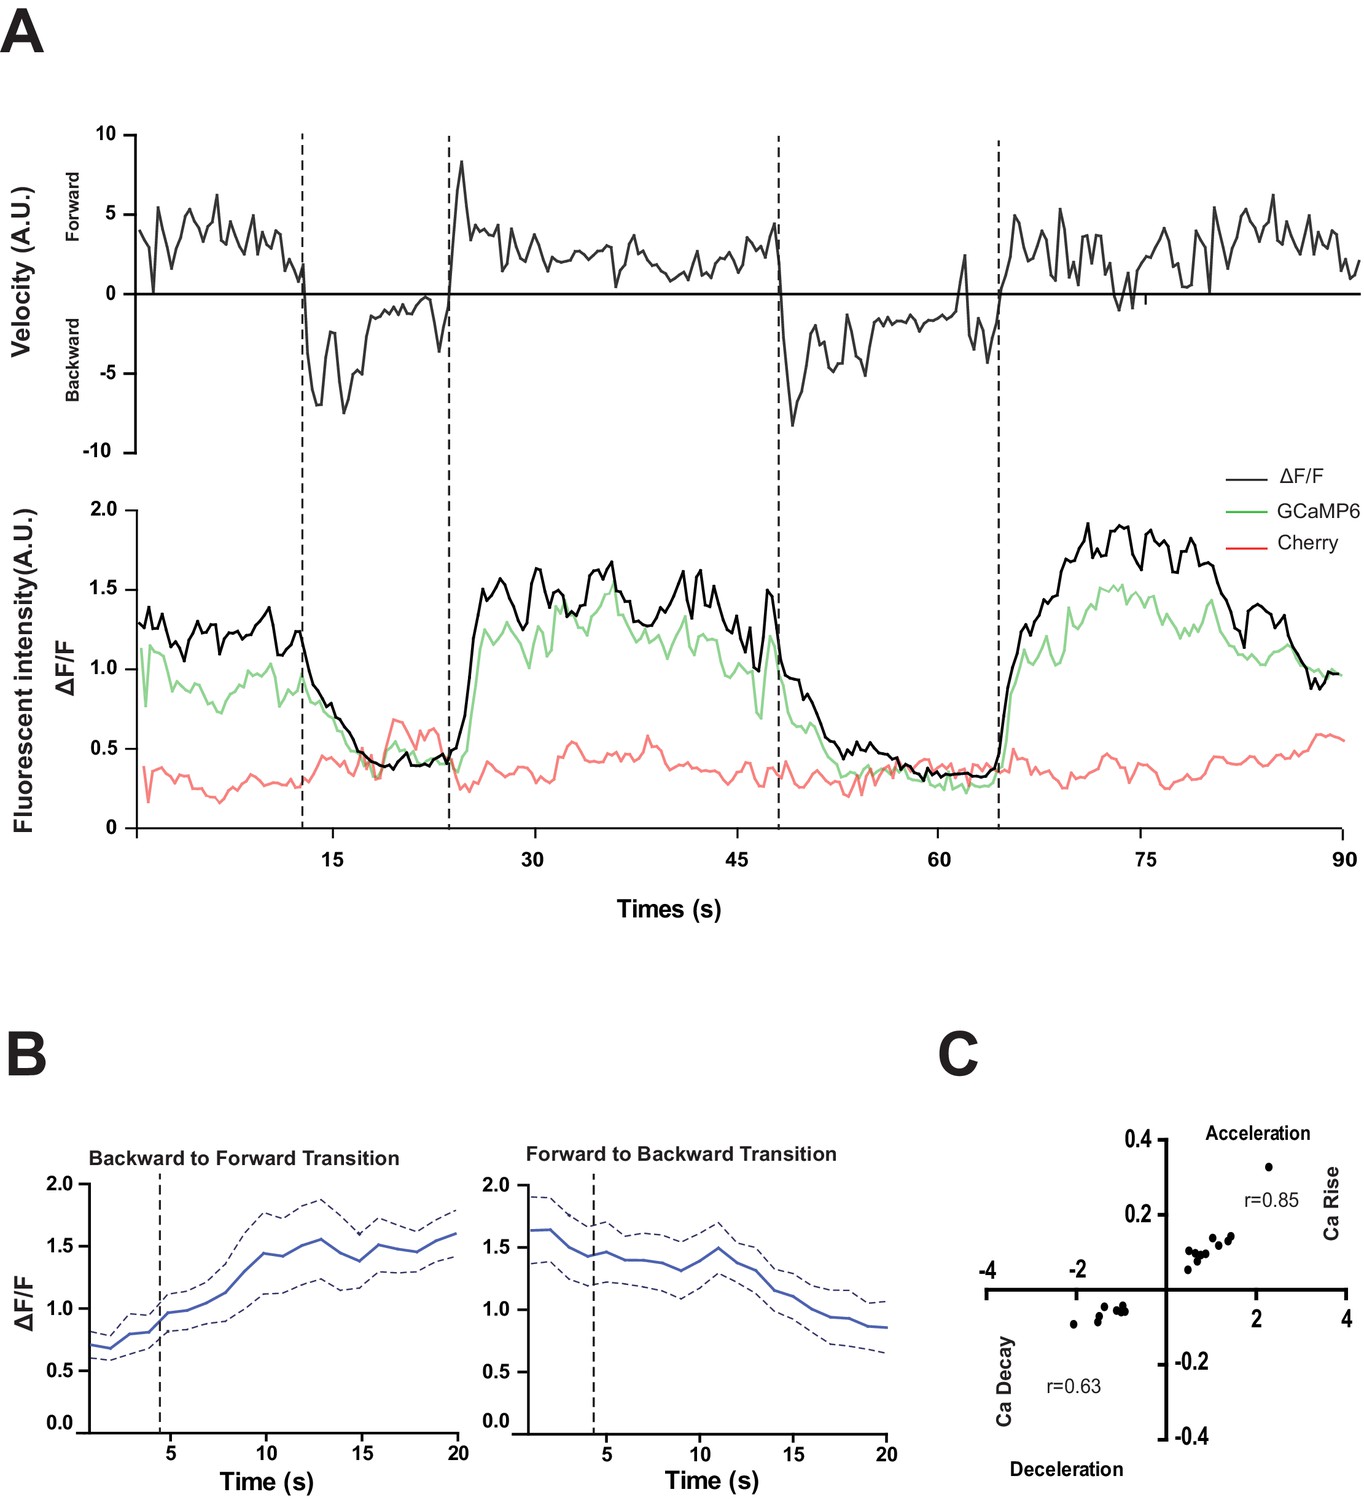
RID activity increase correlates with forward movements.
(A) Representative velocity (top) and corresponding RID calcium activity trace (bottom) from a freely moving animal. Normalized ratiometric signal changes (ΔF/F), as well as the raw fluorescence intensities of GCaMP and cherry are shown. ΔF/F was used to calculate changes in calcium activity for each animal. Changes in positions of fluorescent signals were used to calculate velocity and directionality. (B) RID activity as measured by GCaMP/cherry ratio change (± SEM) during transition periods. Left panel, RID activity increased when animals transition from backward to fast forward locomotion. Right panel, RID activity decreased when animals transition from forward to backward locomotion. For A and B, dotted longitudinal lines indicate transition periods from backward to forward locomotion and vice versa. (C) Cross-correlation analyses between the change in RID activity and the change in velocity. Positive and negative slopes (Y-axis) indicate increase (Ca rise) and decrease (Ca decay) in RID, respectively. Positive and negative values on the X-axis indicate changes in velocity from backward to forward locomotion (acceleration) and from forward to backward locomotion (deceleration), respectively. For B and C, N = 10 animals/genotype. In C, each dot represents a transitional event.
Figure 5 with 2 supplements
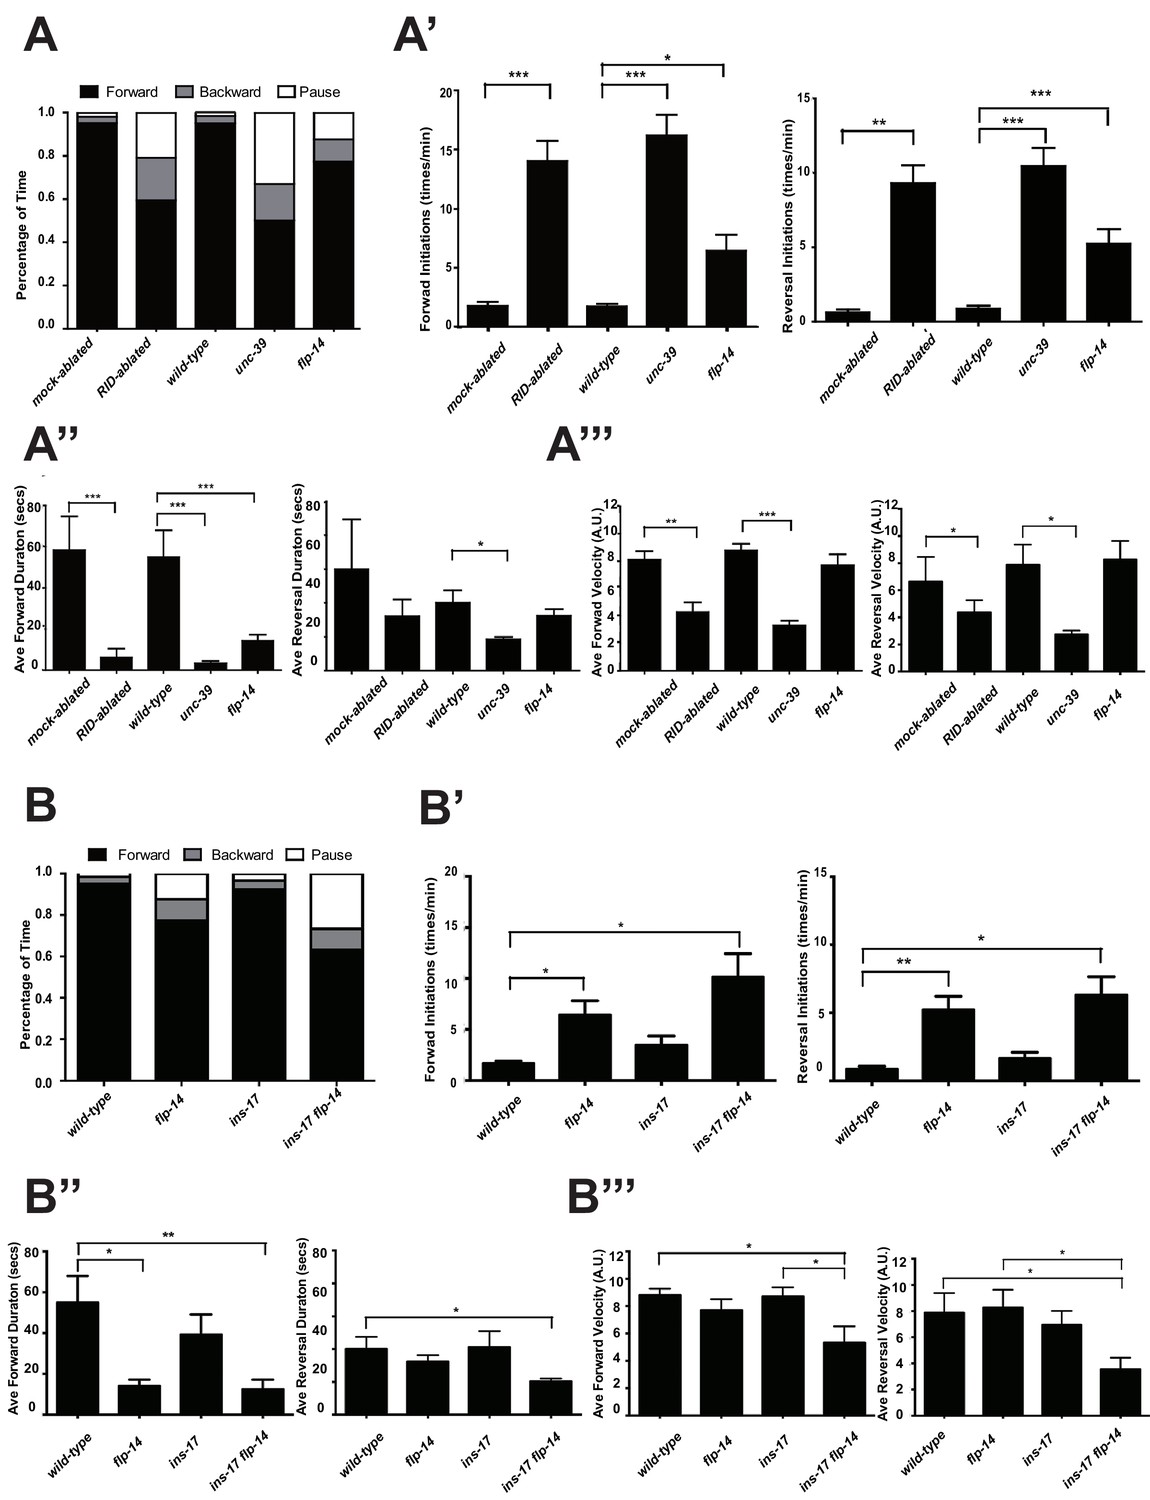
RID and FLP-14 potentiate sustained, long forward movements.
(A-A”’) Spontaneous motor behavioral output, the propensity of directional movement and the interruption of forward movement between wild-type control (mock-ablated Pceh-10-GFP animals), RID-ablated Pceh-10-GFP animals, wild-type (N2), unc-39, and flp-14 mutants. RID-ablated, unc-39, and flp-14 mutants showed decreased propensity for long forward runs, replacing it with more frequent reversals and pauses. (A) Total fractional time animals of each genotype spent in forward, reversal, or pauses. (A’) Frequency of re-initiation of forward runs and reversals. (A’’) Duration of forward and reversal runs. (A”’) Velocity of forward and reversal runs. (B-B”’) Spontaneous motor behavioral output, the propensity of directional movement and the interruption of forward movement between wild-type (N2), ins-17, and ins-17 flp-14 mutants. (B) Total fractional time animals of each genotype spent in forward, reversal, or pauses. (B’) Frequency of re-initiation of forward runs and reversals. (B’’) Duration of forward and reversal runs. (B’’’) Velocity of forward and reversal runs. ins-17 mutants did not show significant changes in motor behavior, while ins-17 flp-14 generally resembled flp-14 in motor behavior. N = 10 animals/genotype. Error bars are ± SEM.
Figure 5—figure supplement 1
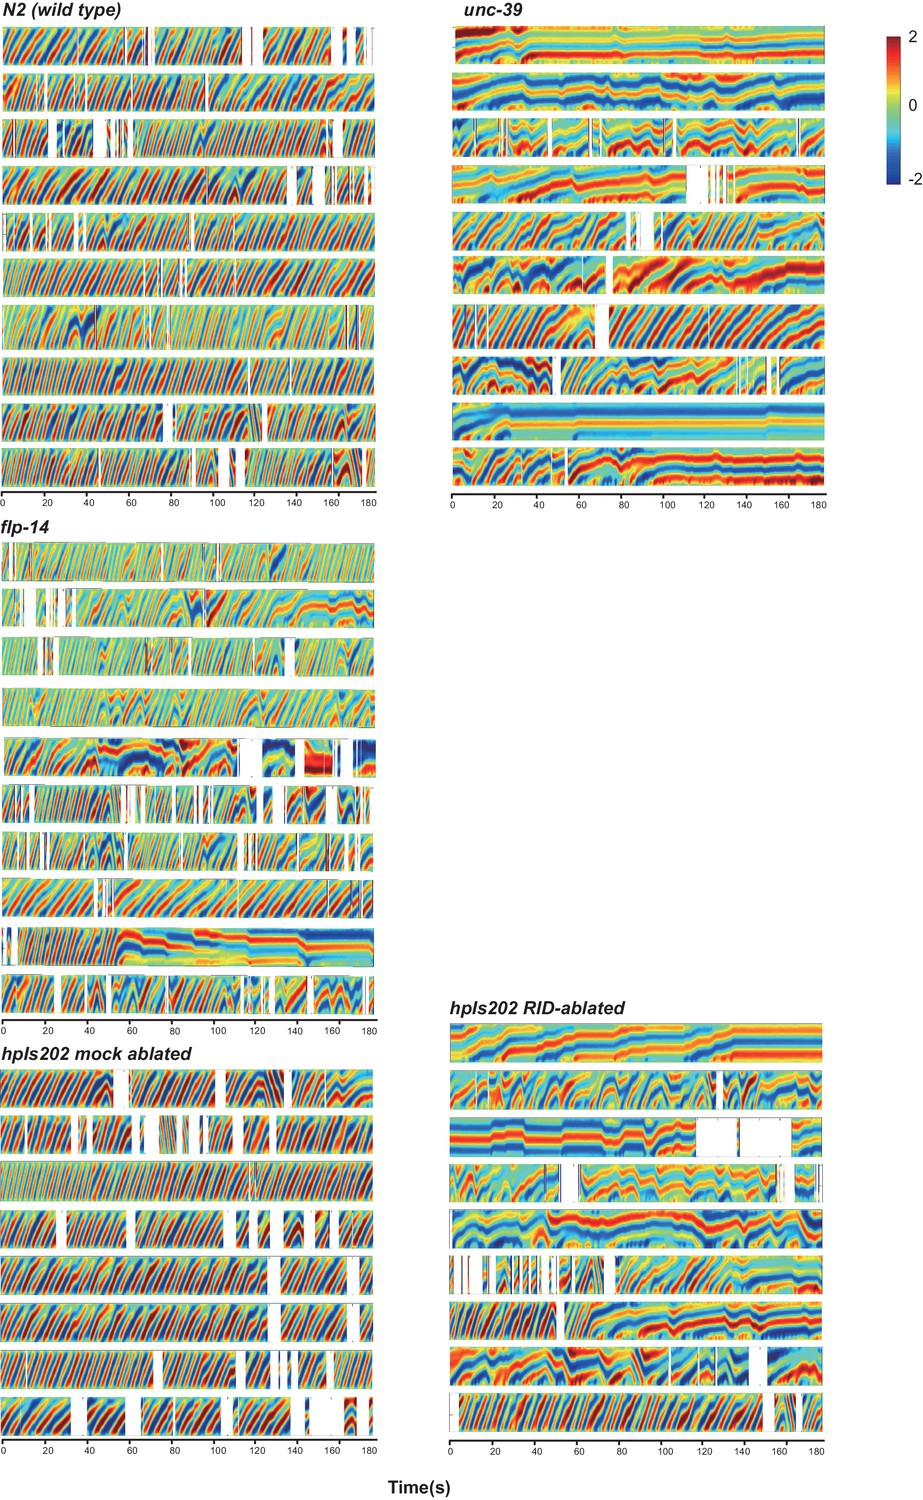
Raw data for spontaneous motor behaviors of animals quantified in Figure 5.
Plots of the body curvature (Y axis, anterior to posterior) over time (X axis) of individual animals of the following genotypes: hpIs202 (Pceh-10-GFP RID marker) mock-ablated, hpIs202 (Pceh-10-GFP RID marker) RID-ablated, wild-type (N2), unc-39, and flp-14. Each heat-map plot represents one animal. N = 8–10/genotype. These recordings were performed on the same day. They were recorded on the same plate, one animal at a time, alternating through animals of each genotype. Forward and reversal movements are viewed by the directionality of the curvature propagation; velocities are viewed by the speed of curvature propagation. White regions represent times when the program lost track of the animal, which typically happened when the animal’s head and tail touched each other during turns. Compared to their respective controls, RID-ablated animals, unc-39, and flp-14 mutants exhibited reduced propensity and continuity of forward movements. Forward velocity of RID-ablated and unc-39 animals was reduced. All defects were less prominent in flp-14 mutants.
Figure 5—figure supplement 2
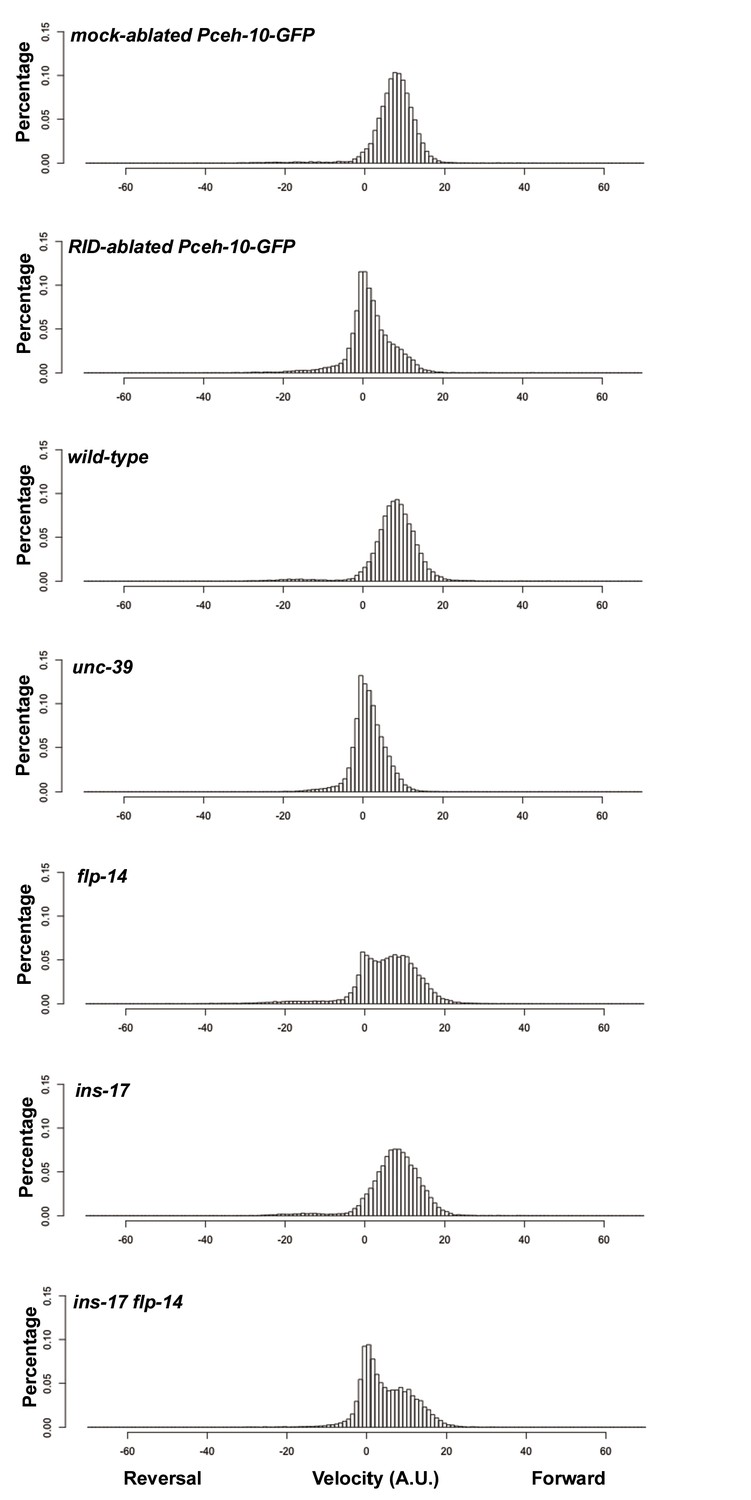
Frequency distribution of forward and reversal velocities quantified in Figure 5.
Percentage distribution of forward and reversal velocities of individual animals of the following genotypes: hpIs202 (Pceh-10-GFP RID marker) mock-ablated, hpIs202 (Pceh-10-GFP RID marker) RID-ablated, wild-type (N2), unc-39, flp-14, ins-17, and ins-17 flp-14. Negative values represent reversal velocity; positive values represent forward velocity; zero value represents pauses. Compared to their respective controls, RID-ablated and unc-39 mutants exhibited reduced velocities, specifically during forward locomotion. flp-14 and ins-17 flp-14 mutants showed a tendency towards reduced velocities, while ins-17 mutants were similar to wild-type (N2). N = 10 animals/genotype.
Figure 6 with 2 supplements
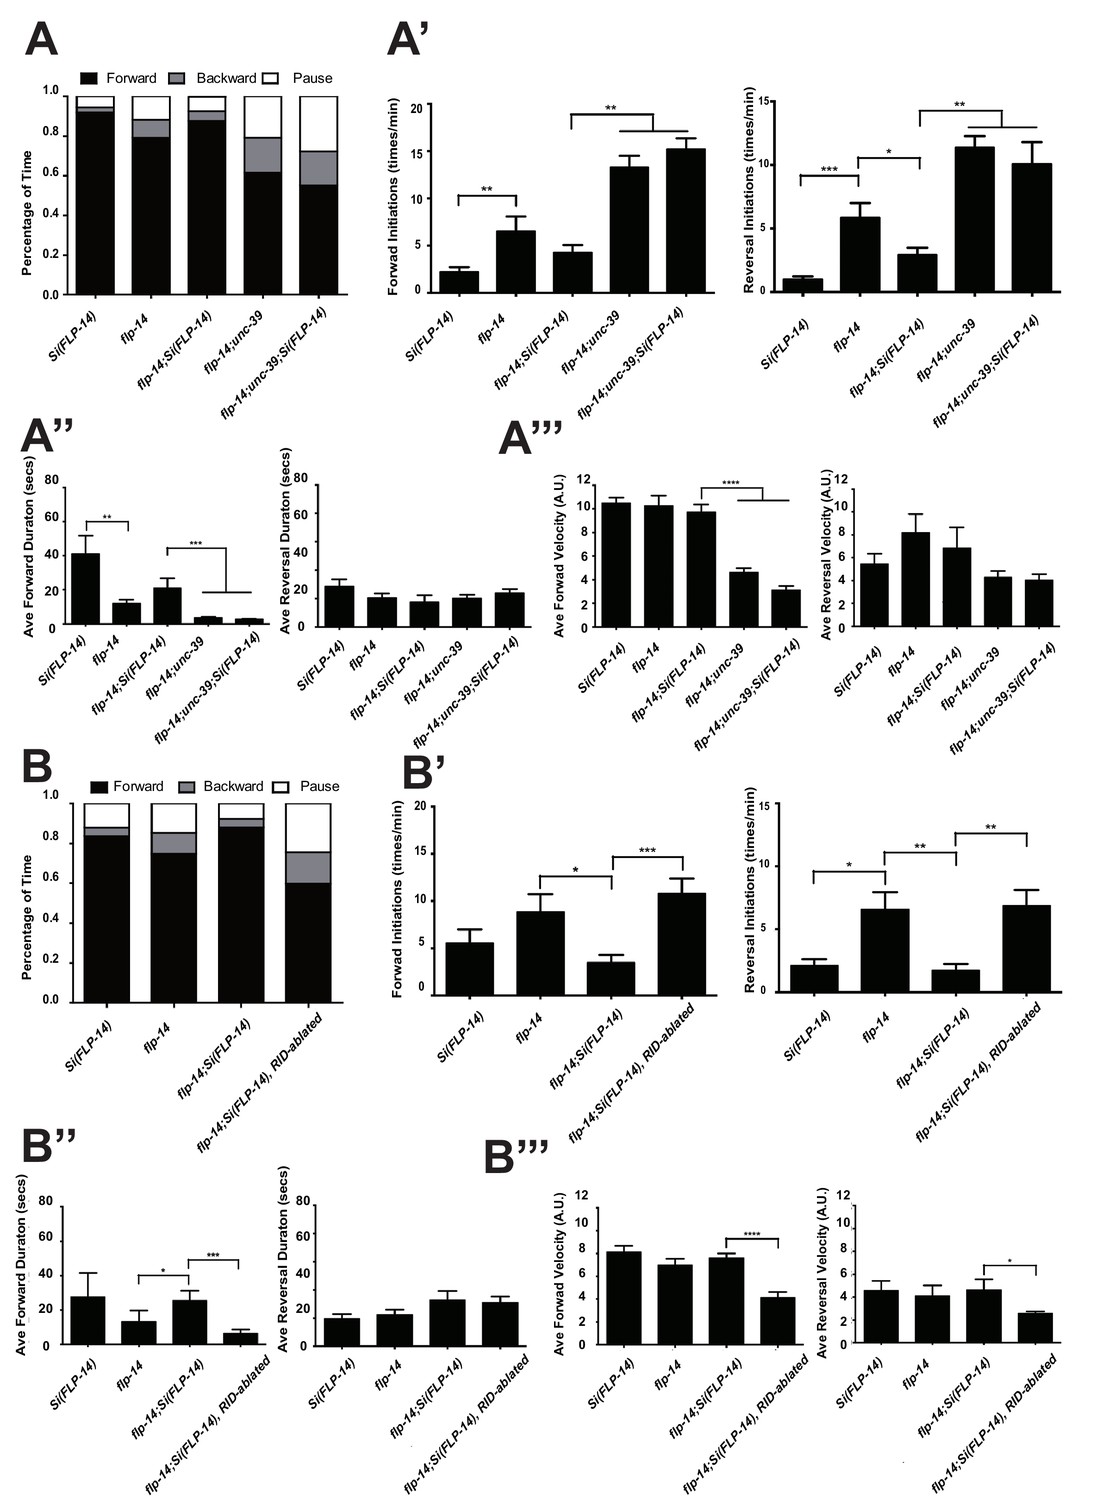
FLP-14 potentiates forward movements through RID.
(A–A’’’) Spontaneous motor behavioral output between wild-type Si(FLP-14), flp-14, flp-14;Si (FLP-14), and flp-14;Si (FLP-14);unc-39 where RID was genetically ablated. We quantified the propensity of directional movement (A), the continuity of forward movements, by the re-initiation frequency of forward and backward movement (A’) and the duration of forward and backward movement (A’’), as well as the mean velocity of forward and backward movement. (B–B’’’) Spontaneous motor behavioral output between wild-type Si(FLP-14), flp-14, flp-14;Si (FLP-14), and flp-14;Si (FLP-14) where RID was ablated by a laser beam. All animals were in the background of the RID marker transgene (Pceh-10-GFP) for this set of experiments. A single copy of FLP-14 reversed flp-14 mutants’ motor defects; this effect was abolished when RID was laser ablated. N = 10 animals/genotype. Error bars are ± SEM.
Figure 6—figure supplement 1
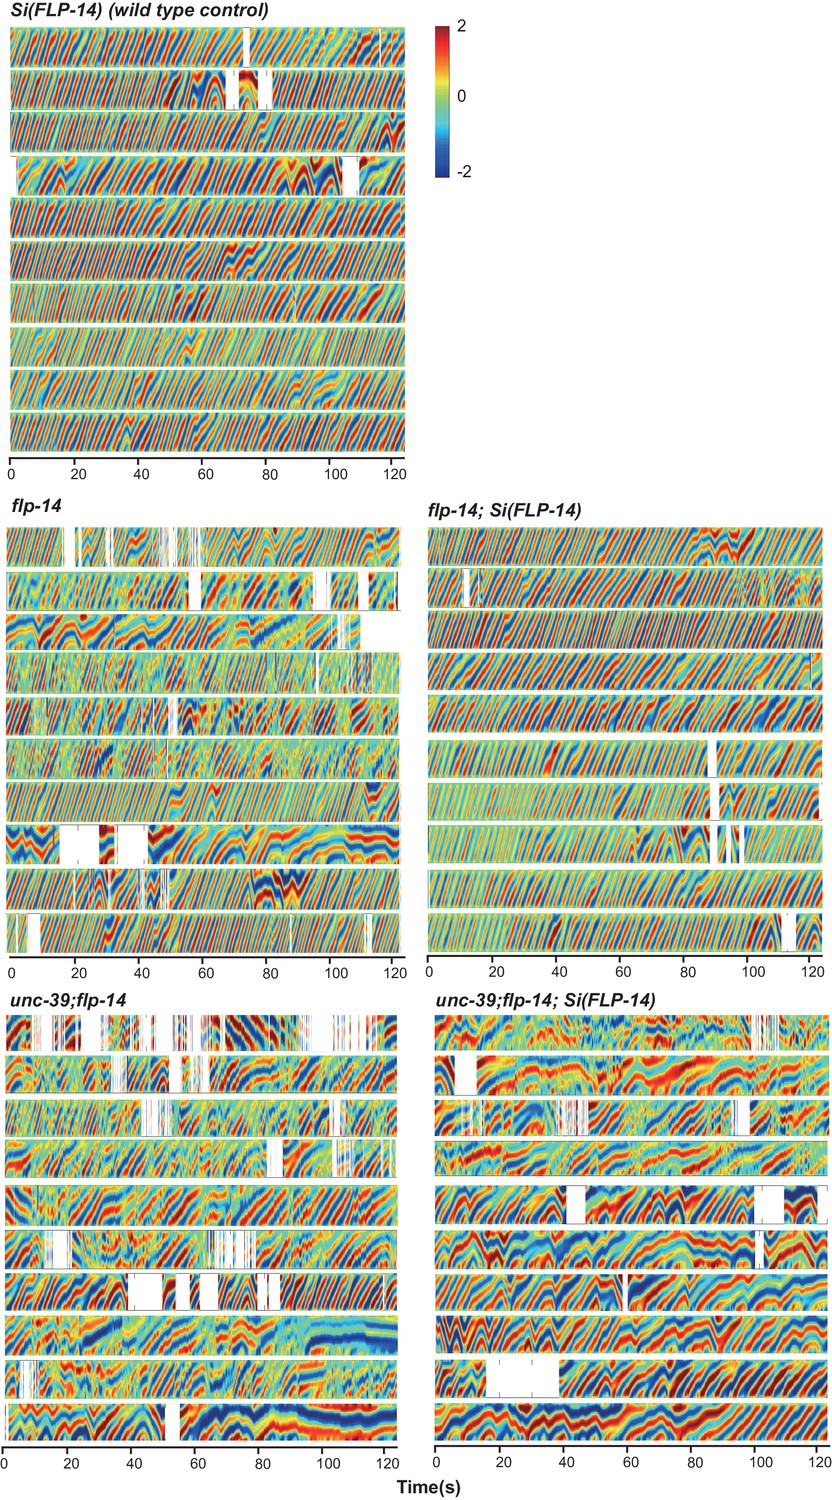
Raw data for spontaneous motor behaviors of animals quantified in Figure 6A.
Plots of the body curvature (Y axis, anterior to posterior) over time (X axis) of individual animals of the following genotypes: the single copy insertion of a fragment of the flp-14 genomic fragment in N2 background Si(FLP-14), flp-14, flp-14;Si(FLP-14), flp-14;unc-39, flp-14;unc-39;Si(FLP-14). Each heat-map plot represents one animal. N = 10 animals/genotype. These recordings were performed on the same day. They were recorded on the same plate, one animal at a time, alternating through animals of each genotype. Forward and reversal movements are viewed by the directionality of the curvature propagation; velocities are viewed by the speed of curvature propagation. White regions represent times when the program lost track of the animal, which typically happened when the animal’s head and tail touched each other during turns, or when the animal crawled to the edge of the plate. Si(FLP-14) restored flp-14 mutants’ defects and was similar to that of Si(FLP-14). flp-14;unc-39;Si(FLP-14) mutants exhibited severely reduced forward propensity, continuity, and velocity.
Figure 6—figure supplement 2
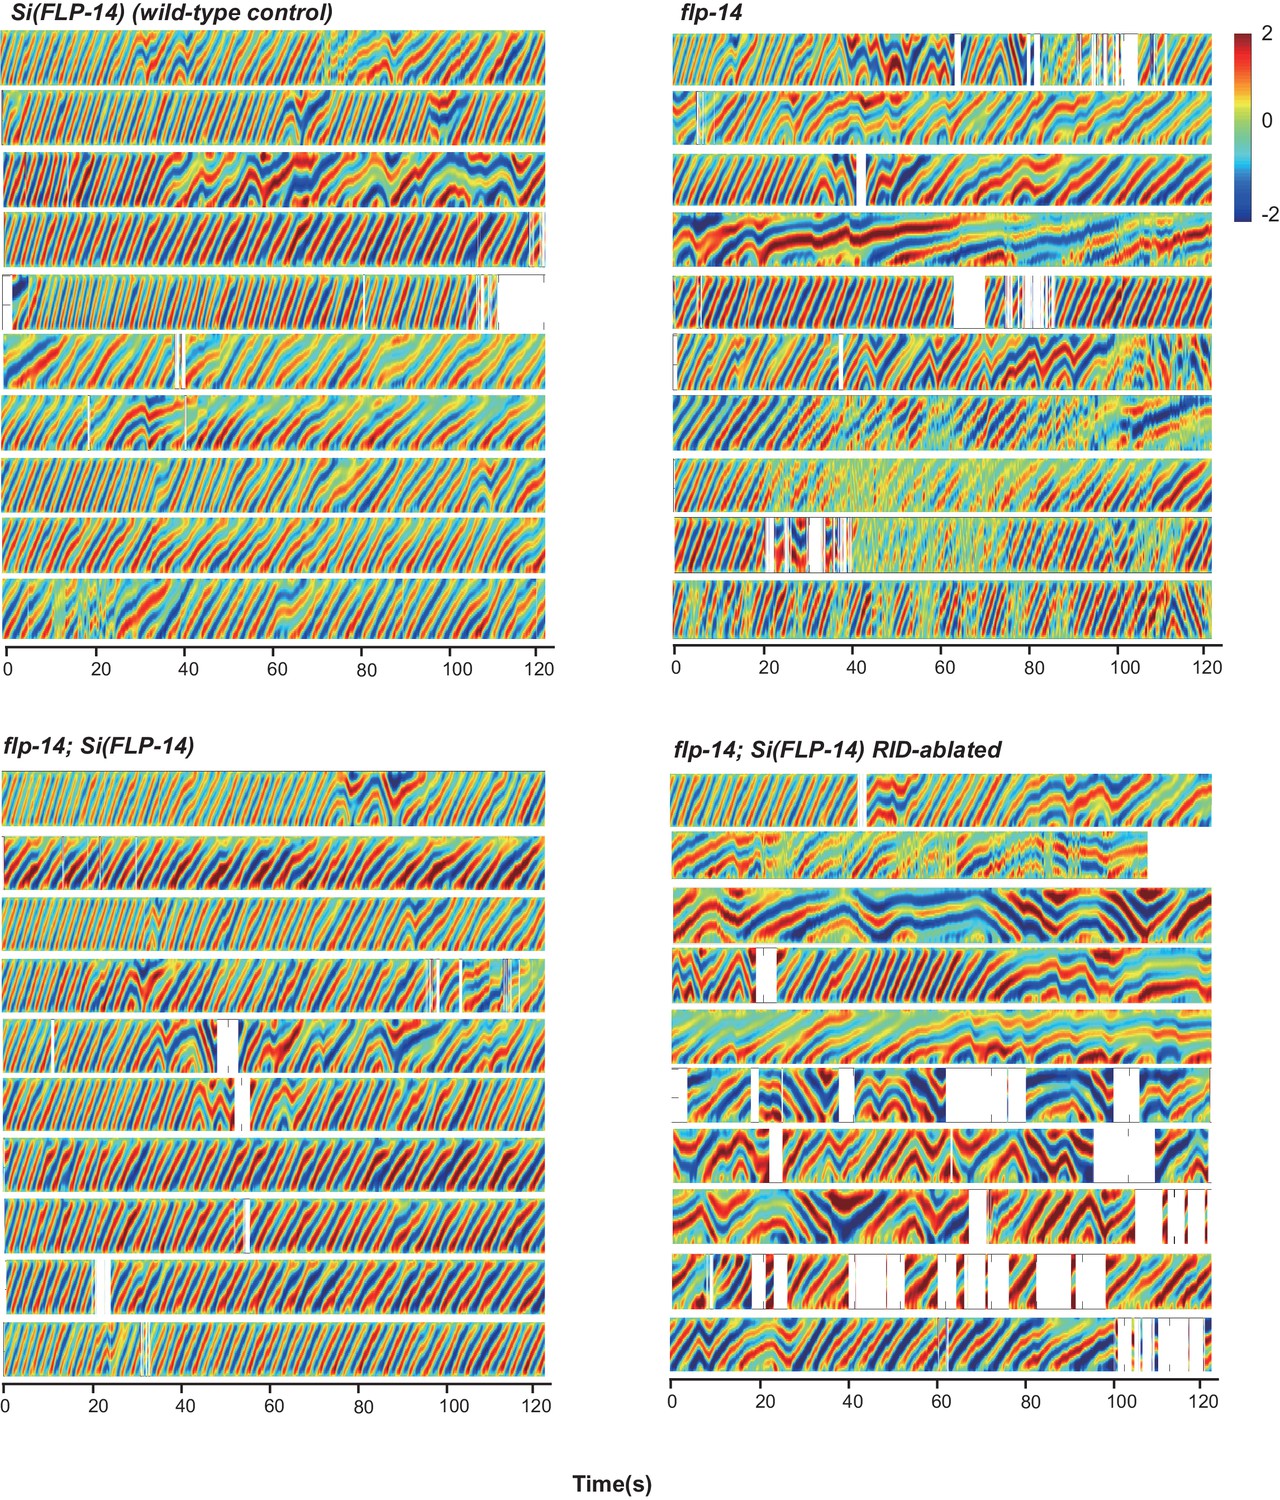
Raw data for spontaneous motor behaviors of animals quantified in Figure 6B.
Plots of the body curvature (Y axis, anterior to posterior) overtime (X axis) of individual animals of the following genotypes: the single copy insertion of a fragment of the flp-14 genomic fragment in the hpIs202 (RID marker) background Si(FLP-14), flp-14, flp-14;Si(FLP-14), and flp-14;Si(FLP-14) with RID ablated by a laser beam. The rescuing effect of Si(FLP-14) in flp-14;Si(FLP-14) was abolished upon RID ablation. All animals have hpIs202, a Pceh-10-GFP RID marker that facilitates RID ablation. N = 10 animals/genotype.
Figure 7 with 1 supplement
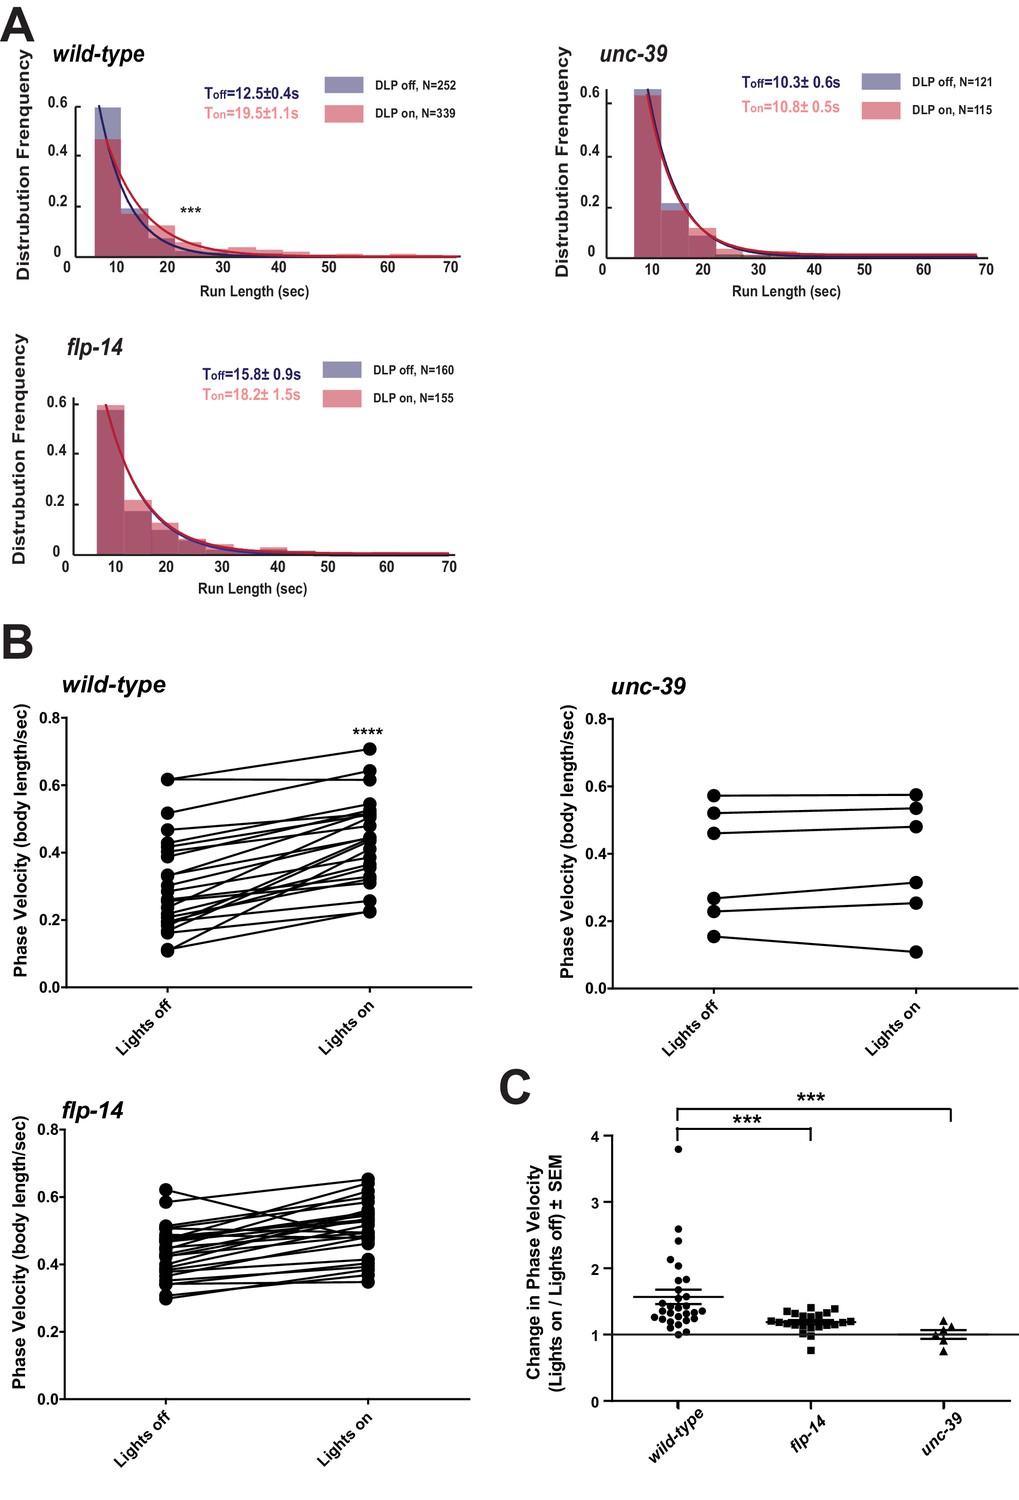
Activation of RID promotes forward movements in part through FLP-14.
(A) The distribution of the mean run length for all light ON (RID stimulation) and light OFF (no RID stimulation) periods. (B–C) A comparison of the motor behavior response before and after RID optogenetic stimulation in wild-type, unc-39, and flp-14 animals. The change of speed (phasic velocity) before and after RID stimulation in wild-type, unc-39 and flp-14 animals, respectively, was quantified in C. In response to RID stimulation, wild-type animals showed increased velocity and run length during a forward run. This response was abolished in unc-39 mutants and reduced in flp-14 mutants. N = 6–26 animals/per genotype.
Figure 7—figure supplement 1
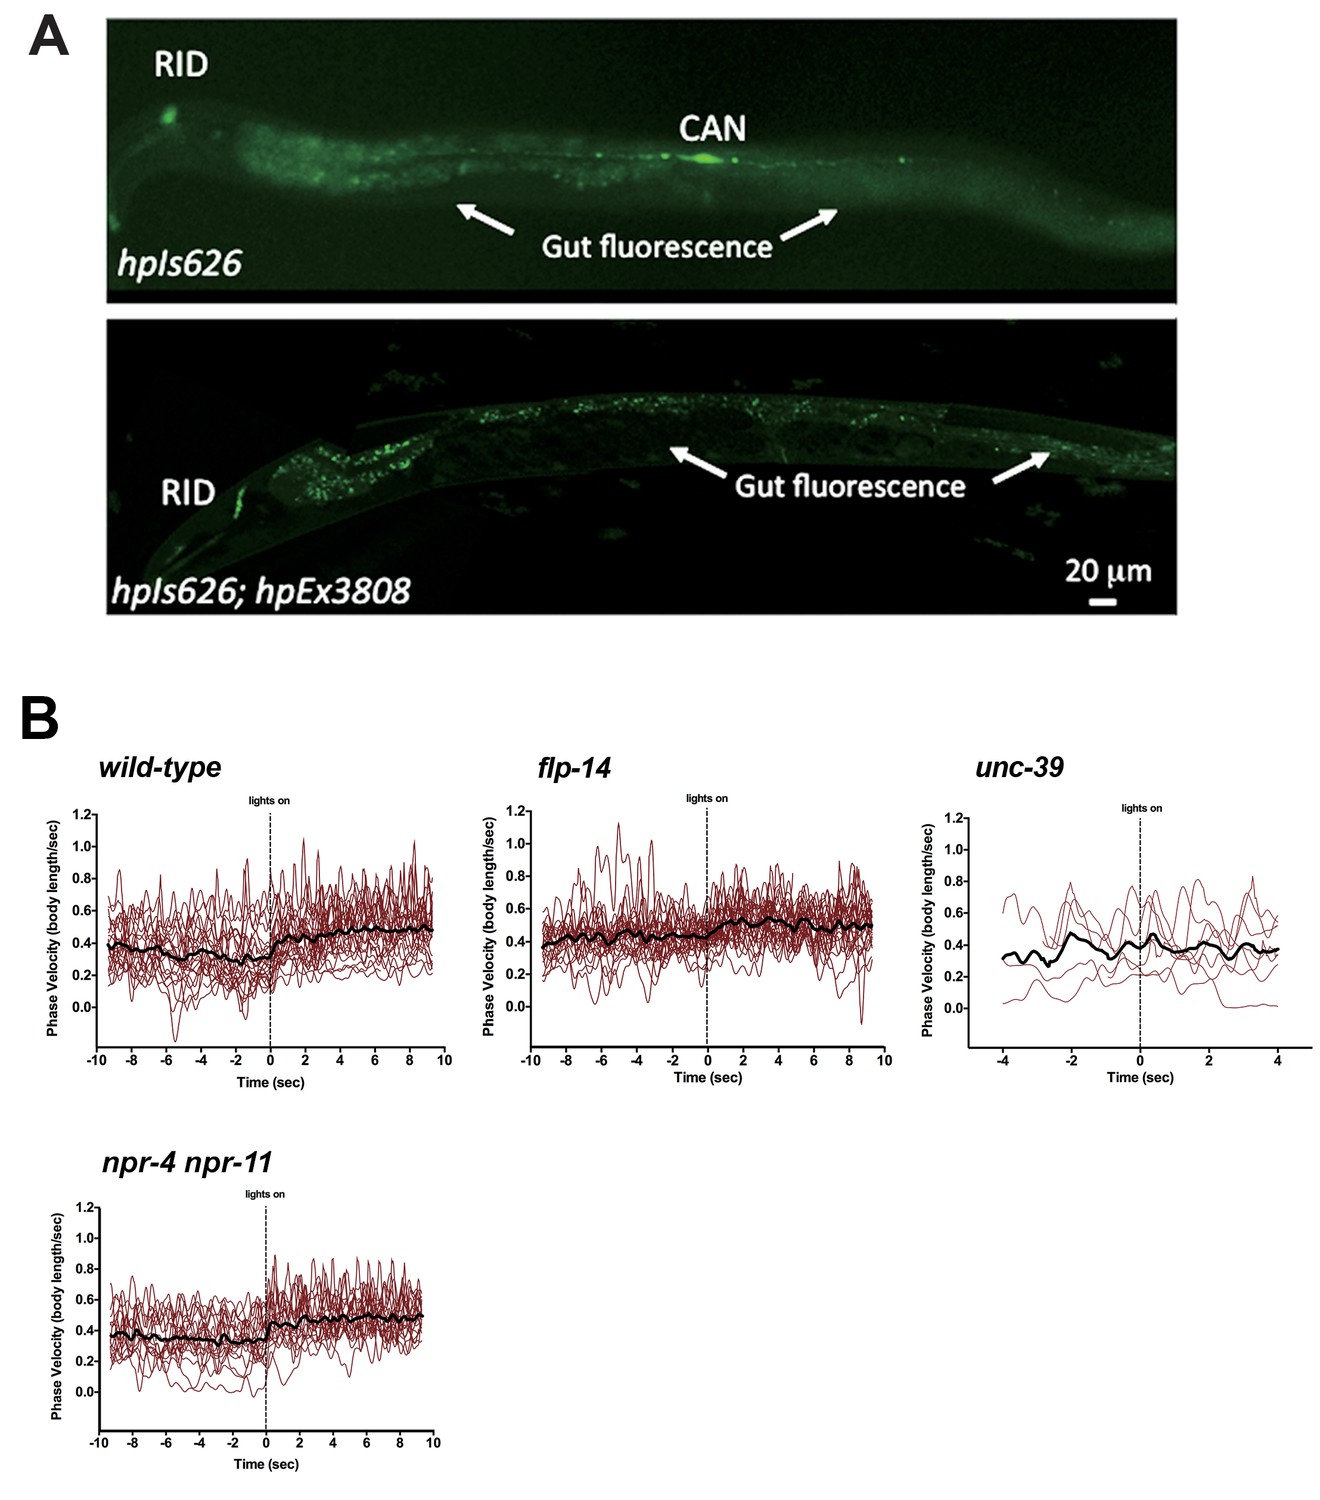
Restricting chrimson expression in RID by repurposing an embryonic E3 ligase.
(A) Top panel, Representative image of an integrated transgenic array with restricted expression of Chrimson::GFP::ZF1 in the RID and CAN neurons. Most animals in the transgenic strain exhibited expression of Chrimson in RID and CAN. Bottom panel, When Chrimson::GFP in the CAN neuron was targeted for degradation using an endogenous C. elegans embryonic ubiquitin-ligase system, 10% of the population had Chrimson expression restricted to the RID neuron. Scale bar, 20 μm. The bottom panel is a representative image of transgenic animals used for optogenetic experiments. (B) Raw speed (phasic velocity) traces of individual wild-type, flp-14, unc-39, and npr-4 npr-11 before (lights off) and after RID stimulation (lights on).
Figure 8 with 1 supplement
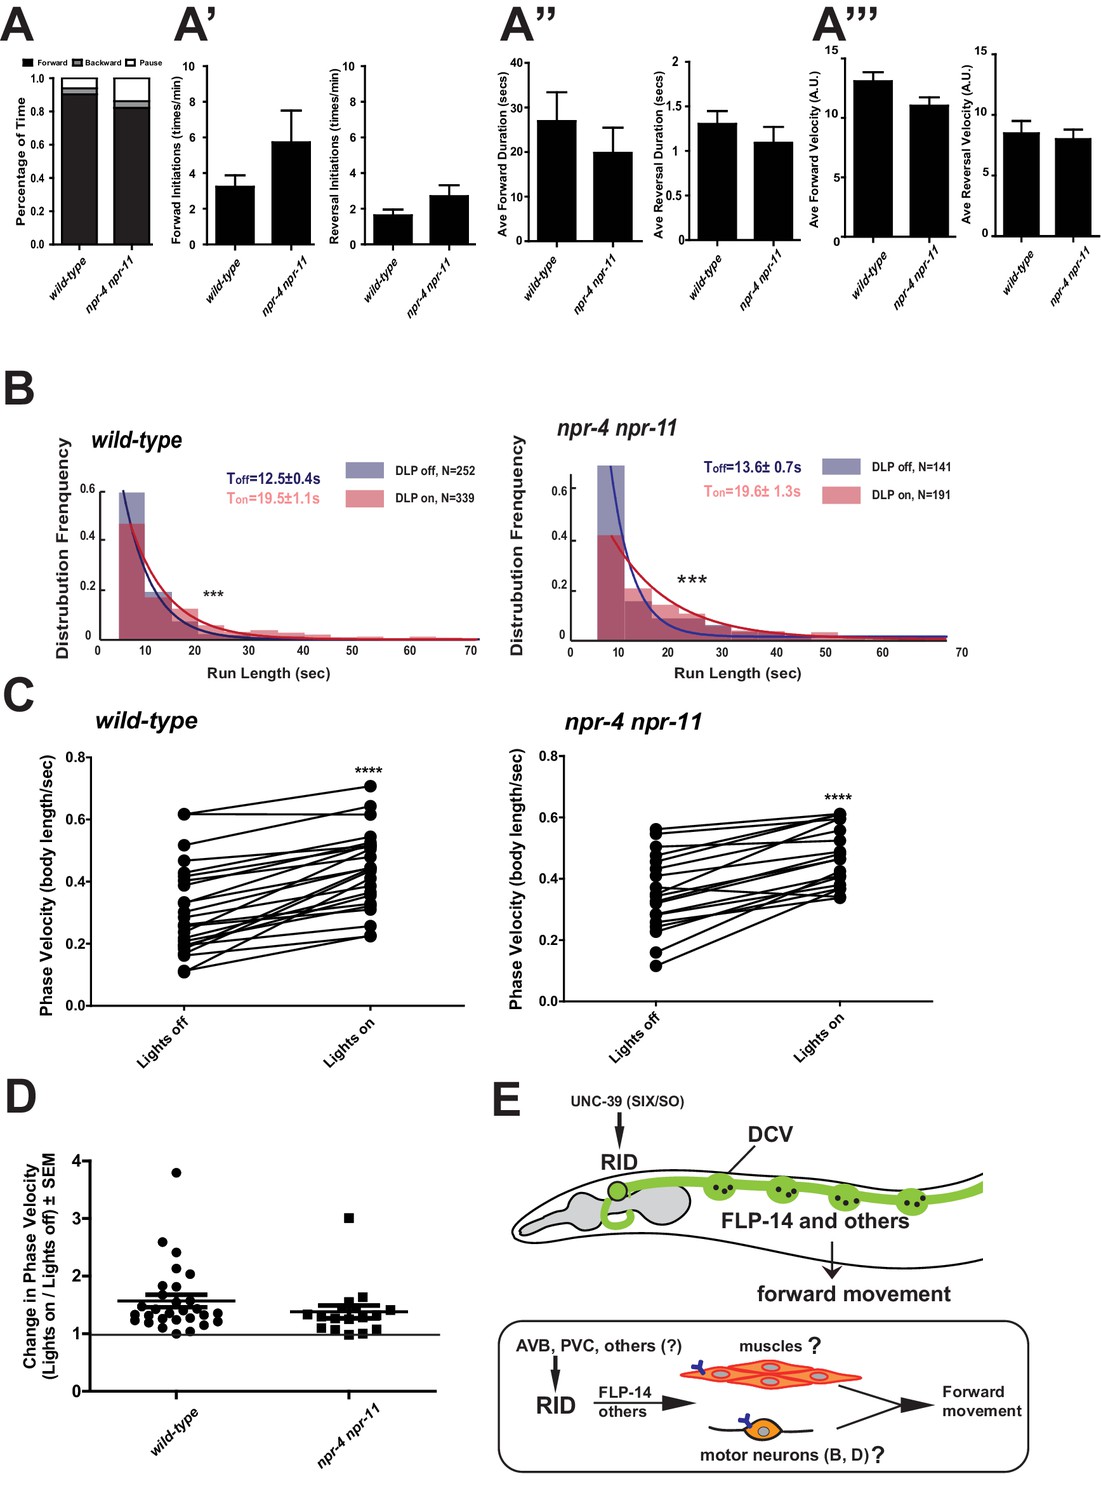
FLP-14 may not function through predicted GPCR receptors.
(A–A’’’) Spontaneous motor output, the propensity of directional movement, and the interruption of forward movement between wild-type (N2) and npr-4 npr-11 animals. Unlike the case for flp-14 and unc-39 mutants, or RID-ablated animals, npr-4 npr-11 double mutants did not exhibit significant motor behavioral changes. N = 10 animals/per genotype. Error bars are ± SEM. (B) The distribution of the mean run length for all light ON (RID stimulation) and light OFF (no RID stimulation) periods. (C, D) A comparison of the motor behavior response before and after RID optogenetic stimulation in npr-4 npr-11 mutants. The change of speed (phasic velocity) before and after RID stimulation in npr-4 npr-11 animals was quantified in D. Wild-type and npr-4 npr-11 double mutants showed a similar increase of run length and velocity in response to RID stimulation. (E) A schematic summary of our findings on RID’s role in sustaining forward locomotion (upper panel), and a speculative model of its currently unknown circuit mechanism (lower panel).
Figure 8—figure supplement 1
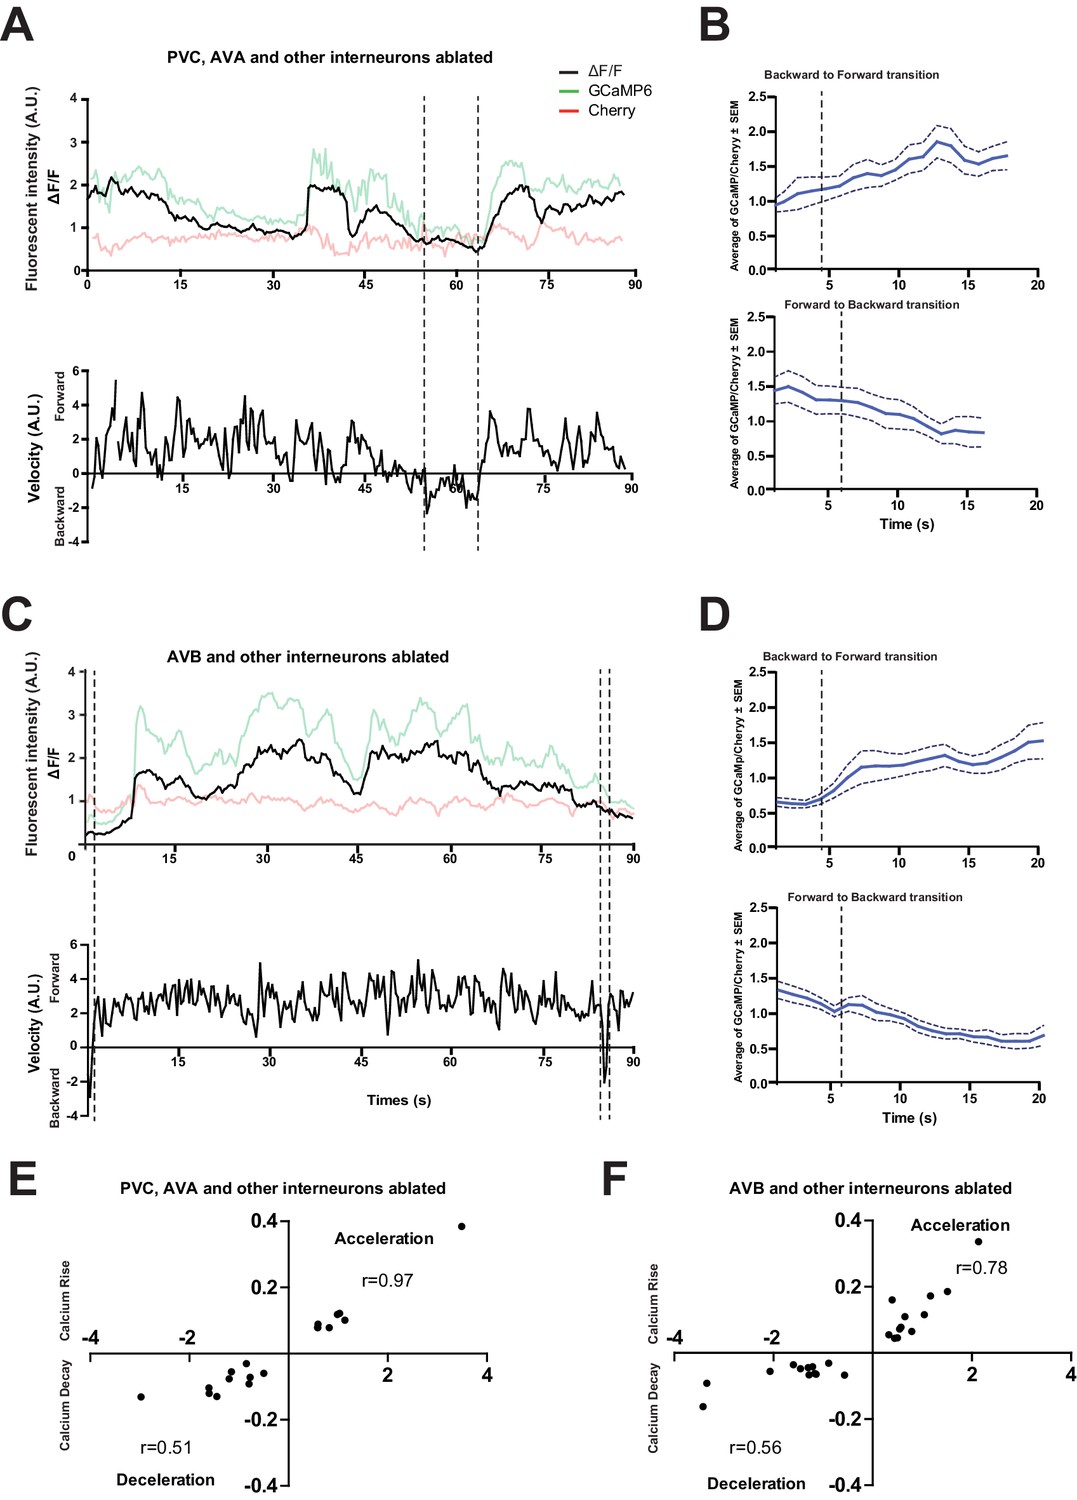
The loss of PVC or AVB alone does not abolish RID activity rise during forward movement.
(A) Representative velocity (top) and corresponding RID calcium activity trace (bottom) from a freely moving animal with PVC (and other neurons) ablated. Normalized ratiometric (GCaMP/Cherry) signal changes (ΔF/F), as well as the raw fluorescence intensities of GCaMP and cherry are shown. ΔF/F was used to calculate changes in calcium activity for each animal. Changes in positions of fluorescent signals were used to calculate velocity and directionality. (B) RID activity in PVC (and other neurons)- ablated animals as measured by GCaMP/cherry ratio change (± SEM) during transition periods. Top panel, RID activity increased when animals transitioned from backward to fast forward locomotion. Bottom panel, RID activity decreased when animals transitioned from forward to backward locomotion. For A and B, dotted longitudinal lines indicate transition period from backward to forward locomotion and vice versa (C, D). The same analyses as in A and B, except that experiments were performed in animals where AVB (and other neurons) were ablated. (E, F) Cross-correlation analyses between the change in RID activity, and the change in velocity in PVC (and other neurons)- (E) and AVB (and other neurons)-ablated animals (F). Positive and negative slopes (Y-axis) indicate increase (Calcium Rise) and decrease (Calcium Decay) in RID activity, respectively. Positive and negative values on the X-axis indicate changes in velocity from backward to forward locomotion (acceleration) and from forward to backward locomotion (deceleration), respectively. For B, D, E and F, N = 9–10 animals/genotype. In E and F, each dot represents a transitional event.
Videos
Video 1
Thirty-two consecutive serial sections of a part of the dorsal nerve cord in an adult wild-type animal.
The RID process is outlined in pink, and the DD axon is outlined in green.
Video 2
Changes in the RID calcium transients in moving animals.
RID activity increased during a period of acceleration in a forward bout, or during transitions from reversal to fast forward locomotion. Left panel: RFP; Right panel: GCaMP6. Note that multiple neurons expressed GCaMP6::RFP, but only RID (soma and axon) exhibited signal increase that was correlated with increased forward locomotion.
Video 3
Representative video of a L4 stage wild-type (N2) animal on an NGM plate with a thin-layer of OP50 bacteria food. Head is at the top at the beginning of the video.
https://doi.org/10.7554/eLife.19887.013
Video 4
Representative video of a L4 stage unc-39(hp701) animal on an NGM plate with a thin-layer of OP50 bacteria food. Head is at the bottom at the beginning of the video.
https://doi.org/10.7554/eLife.19887.014
Video 5
Representative video of a L4 stage flp-14(gk1055) animal on an NGM plate with a thin-layer of OP50 bacteria food. Head is at the bottom at the beginning of the video.
https://doi.org/10.7554/eLife.19887.018
Video 6
Representative video of a young adult ZM9315 (RID-specific Chrimson) animal on a thin NGM plate without food, upon RID optogenetic stimulation while the animal was executing forward movement. Head is labeled by the circle on the top right at the beginning of the video.
https://doi.org/10.7554/eLife.19887.021
Video 7
Representative video of a young adult ZM9315 (RID-specific Chrimson) animal on a thin NGM plate without food, upon RID optogenetic stimulation during reversals. Head is labelled by the circle at the left side at the beginning of the video.
https://doi.org/10.7554/eLife.19887.022Tables
Table 1
Identification of significantly enriched neuropeptide transcripts in RID by subtractive transcriptome profiling.
Gene | Transcript counts (Mean±SD) | Transcript counts (Mean±SD) | Enrichment in GFP+ Cells (Fold change) | P values for the enrichment (FDR-corrected; n >= 3 replica) | |||||
|---|---|---|---|---|---|---|---|---|---|
Class | Sequence ID (Gene Name) | GFP+ cells (wt) | All cells (wt) | GFP+ cells (unc-39 mutants) | All cells (unc-39 mutants) | wild-type | unc-39 mutants | wild-type | unc-39 mutants |
Insulin-family peptide | F56F3.6 (ins-17) | 265.6 ± 37.8 | 34.4 ± 10.5 | 101.7 ± 68.7 | 56.0 ± 17.8 | 7.7 | 1.8 | 2.37E-06 | 0.72 |
FLP-family peptide | Y37D8A.15 (flp-14) | 19547.2 ± 586.8 | 2917.5 ± 368.0 | 8562.1 ± 6291.9 | 3427.3 ± 1069.2 | 6.7 | 2.5 | 7.55E-08 | 0.53 |
NLP-family peptide | B0213.17 (nlp-34) | 67.0 ± 23.2 | 9.8 ± 6.5 | 37.8 ± 35.3 | 13.3 ± 6.5 | 6.8 | 2.8 | 0.01 | 0.67 |
Appendix 1—table 1
A list of genetic mutant strains generated and/or used.
Gene | Allele | Strain |
|---|---|---|
unc-39 V | hp701 | ZM6539 |
unc-39 V | e257 | CB257 |
ced-3 IV | n717 | ZM6097 |
ced-4 III | n1162 | ZM6098 |
unc-3 X | xd86 | ZM9343 |
flp-14 III | gk1055 | ZM8969 |
ins-17 III | tm790 | ZM2860 |
Ins-17 flp-14 III | tm790 gk1055 | ZM9030 |
snf-11 V | ok156 | RM2710 |
flp-14III; snf-11V | gk1055; ok156 | ZM9215 |
npr-4 X | tm1782 | ZM9455 |
npr-11 X | ok594 | ZM9454 |
npr-4 npr-11 X | tm1782 ok594 | ZM9455 |
Appendix 1—table 2
A list of constructs and transgenic strains generated and used (LIN-15 was used as an injection marker if not specified).
Experiment | Plasmid | Description (injection marker) | Background | Transgene | Strain |
|---|---|---|---|---|---|
RID Reporters | pJH2103 | Pceh-10::GFP | lin-15(n765) | hpIs202 | ZM5488 |
hpIs201 | ZM5489 | ||||
pJH1647 | Pceh-10::Cherry | lin-15(n765) | hpIs292 | ZM6905 | |
pJH1647 | Pceh-10::Cherry (pRF4) | juIs1 | hpIs162 | ZM8000 | |
pJH2160pJH2247 | Pceh-10::IDA-1::CherryPceh-10::ins-22::GFP | lin-15(n765) | hpEx3669 | ZM8823 | |
pJH2247pJH2160 | Pceh-10::ins-22::GFPPceh-10::IDA-1::Cherry | lin-15(n765) | hpEx3669 | ZM8823 | |
Hobert lab | Pkal-1::GFP | unknown | otIs33 | OH904 | |
Hobert lab | Pser-2::GFP | unknown | otIs107 | OH2246 | |
pJH2715 | Pmod-1::mito::GFP | lin-15(n765) | hpIs274 | ZM6658 | |
Huang lab | unc-3 fosmid::SL2::GFP (sur-5::RFP) | unc-3(xd86); hpIs162 | xdEx1091 | XD2319 | |
unc-39 Related | pJH2765 | Plim-4::lim-4::GFP | lin-15(n765) | hpEx3035 | ZM7100 |
pJH2839 | Punc-39::GFP | lin-15(n765) | hpIs328 | ZM7150 | |
pJH2798 | Genomic unc-39 minimal rescuing clone | unc-39(hp701); | not maintained | not maintained | |
pJH3138 | unc-39fosmid::GFP (Pmyo-3::RFP) | unc-39(e257) | hpEx3186 | ZM7572 | |
pJH2811 | Punc-39::UNC-39::GFP (RF4) | unc-39(hp701); hpIs292 | hpEx3034 | ZM7482 | |
pJH2839 | Punc-39::GFP | lin-15(n765) | hpIs328 | ZM7150 | |
pJH3366 | Punc-39::unc-3 cDNA (RF4) | unc-39(hp701); hpIs202 | hpEx3498 | ZM8312 | |
pJH3084pJH3366 | Punc-39::LIM-4 cDNA::GFPPunc-39::UNC-3 cDNA | unc-39(hp701); hpIs292 | not maintained | not maintained | |
flp-14 Related | pJH3884 | flp-14 genomic miniMos (NeoR) | N2 (wt) | hpSi38 | ZM9518 |
flp-14(gk1055) | hpSi38 | ZM9474 | |||
flp-14(gk1055);unc-39(hp701) | hpSi38 | ZM9468 | |||
hpIs201 | hpSi38 | ZM9473 | |||
flp-14(gk1055);hpIs201 | hpSi38 | ZM9519 | |||
pJH2103 | Pceh-10::GFP | flp-14(gk1055) | hpIs201 | ZM9502 | |
flp-14 and ins-17 Reporters | pJH3608 | Pflp-14::GFP | lin-15(n765) | hpEx3695 | ZM8935 |
Hutter lab | Pins-17::GFP (unc-119) | unc-119(ed3) | wwEx73 | HT1734 | |
Calcium Imaging | pJH3644 | Pflp-14::GCaMP6::Cherry | lin-15(n765) | hpIs587 | ZM9078 |
hpIs321 | hpIs587 | ZM9312 | |||
juIs440 | hpIs587 | ZM9404 | |||
Optogenetic Stimulation | pJH3790pJH3796pJH3774 | Pceh10::Chrimson::GFP::ZFPttx-3::ZIF-1::SL2::RFPPgpa-14::ZIF-1::SL2::RFP | lin-15(n765) | hpIs626 | ZM9331(RID/CAN) |
pJH3835 | Parr-1-ZIF-1::SL2::RFP | hpIs626 | hpEx3808 | ZM9351(RID only) | |
unc-39(hp701);hpIs626 | hpEx3808 | ZM9472(RID only) | |||
flp-14(gk1055);hpIs626 | hpEx3808 | ZM9476(RID only) | |||
npr-4(tm1782) npr-11(ok594); hpIs626 | hpEx3808 | ZM9529(RID only) |
Additional files
-
Supplementary file 1
Table of control transcripts.
- https://doi.org/10.7554/eLife.19887.025
-
Supplementary file 2
Table of enriched transcripts in wild-type and unc-39 cells.
- https://doi.org/10.7554/eLife.19887.026
Download links
A two-part list of links to download the article, or parts of the article, in various formats.
Downloads (link to download the article as PDF)
Open citations (links to open the citations from this article in various online reference manager services)
Cite this article (links to download the citations from this article in formats compatible with various reference manager tools)
Neuroendocrine modulation sustains the C. elegans forward motor state
eLife 5:e19887.
https://doi.org/10.7554/eLife.19887


