Internal states drive nutrient homeostasis by modulating exploration-exploitation trade-off
- Champalimaud Centre for the Unknown, Portugal
- Imperial College London, United Kingdom
- MRC Clinical Sciences Centre, United Kingdom
Figures
Figure 1 with 1 supplement
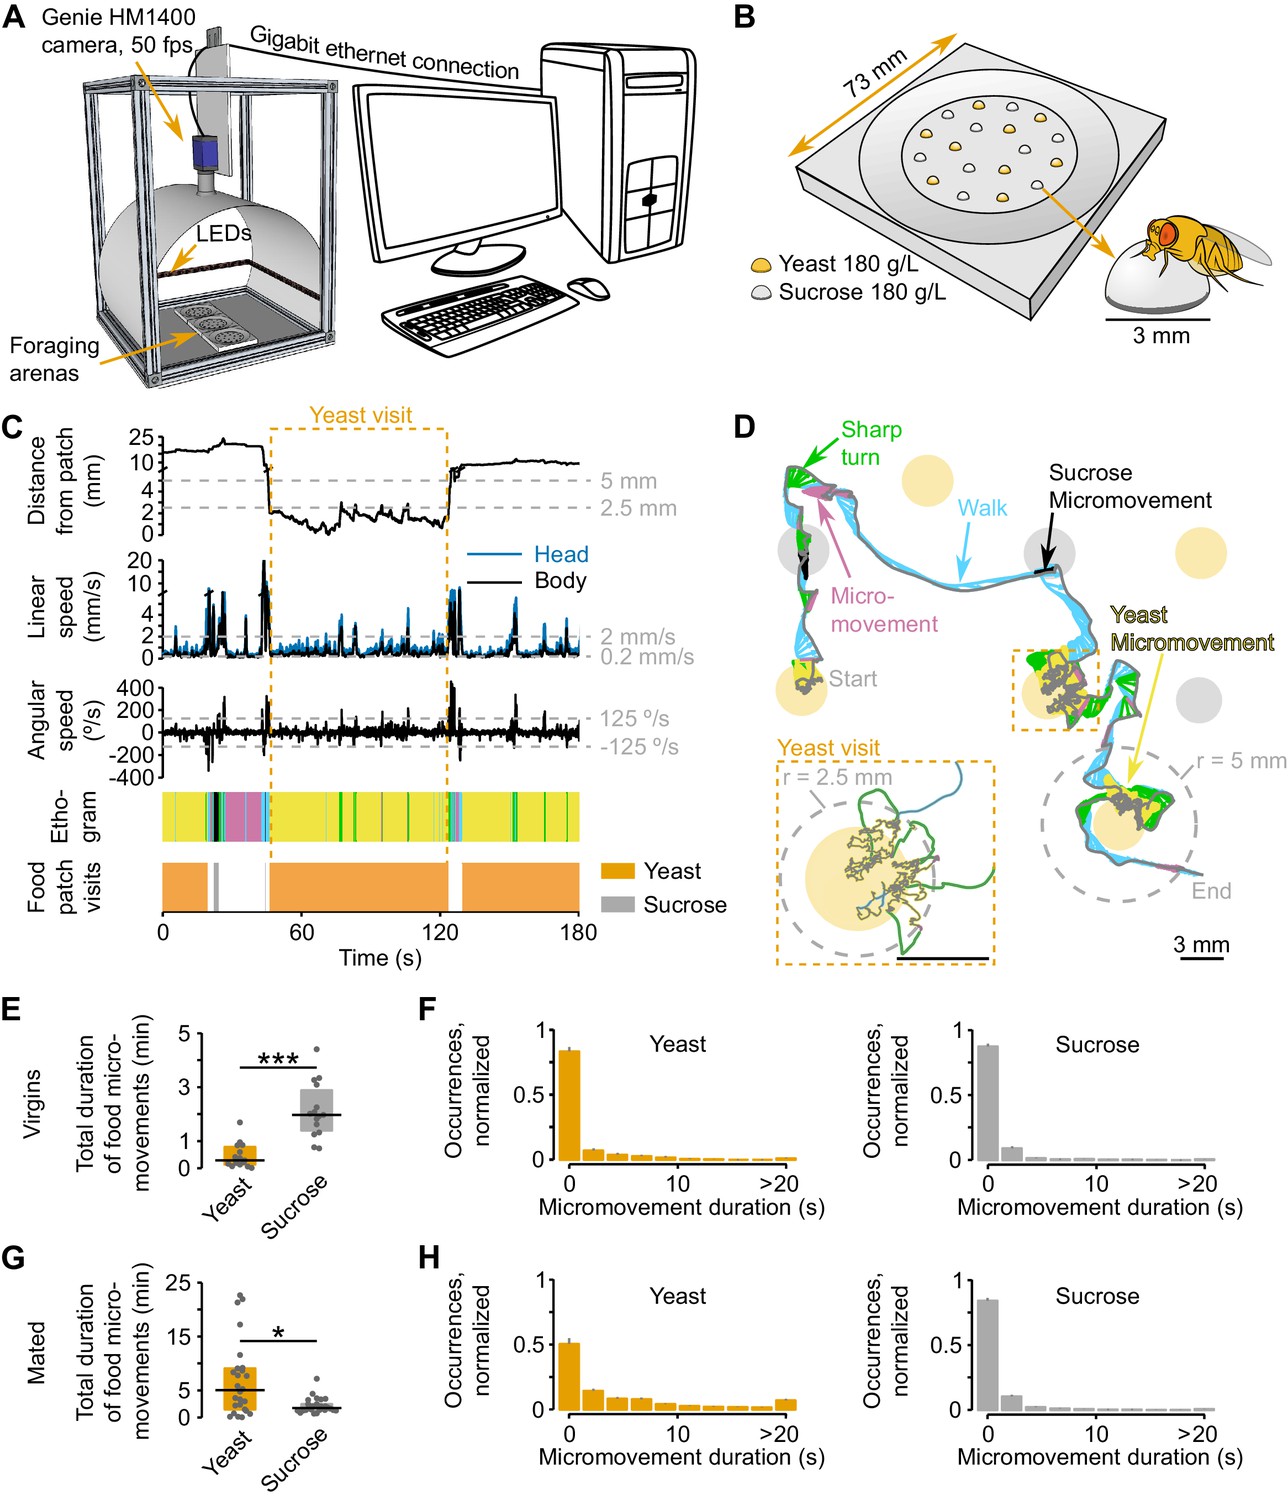
Automated monitoring of nutrient choices using image-based tracking.
(A) Schematic of the image-based tracking setup. (B) Schematic of the foraging arena, containing an inner flat circular area with 9 sucrose (carbohydrate source) and 9 yeast (amino acid source) patches. All patches had a concentration of 180 g/L of the corresponding substrate. Each food patch has an approximate diameter of 3 mm which is approximately the body length of the experimental flies. (C) Example of the kinematic parameters and behavior classification associated to the representative trajectory shown in (D). Dashed gray horizontal lines indicate the thresholds used for behavior classification, definition of yeast and sucrose micromovements and food patch visits (see materials and methods). Dashed orange rectangle marks the beginning and end of the yeast visit (see inset in D). The different colors in the ethogram correspond to the behaviors labeled with the same color in (D). (D) Representative trajectory of a fly walking in the arena. Filled circles represent food patches. Gray and colored trajectories correspond to head and body centroid position, respectively. Small arrows in between both trajectories indicate body orientation. The color code for the different behaviors is indicated by the colored labels. Inset: a yeast visit is defined as a group of consecutive yeast micromovements, in which the head distance to the center of the food patch was never >5 mm (gray dashed line in the main trajectory). (E,G) Total duration of yeast and sucrose micromovements for virgin, n = 15 (E) and mated, n = 26 (G) female flies fed with the AA+ rich diet. (F,H) Distribution of yeast and sucrose micromovement durations for virgin (F) and mated (H) female flies fed with the rich diet. Bin size: 2.2 s. *p<0.05, ***p<0.001, significance was tested by Wilcoxon rank-sum test. In panels E and G and in the following figures in which boxplots are used, the black line represents the median, colored boxes represent inter-quartile range (IQR) and gray dots represent the value of the y-axis parameter for single flies.
Figure 1—figure supplement 1

Ground-truthing of behavior.
(A) Normalized histogram of head speed of amino acid-deprived mated females (AA- diet) from two independent video tracking experiments: orange lines represent data obtained from an assay in which the arena contained 9 yeast and 9 sucrose patches; black lines represent data obtained from an assay in which the arena contained 18 agarose patches (no food). For each experiment, the speed was calculated for periods inside and outside food patches. Vertical dashed gray lines in main panel and insets indicate the speed thresholds used to classify resting (0–0.2 mm/s), micromovement (0.2–2 mm/s) and walking (>2 mm/s). Insets are a zoom-in of the indicated regions of the main histogram. Black and orange lines indicate mean and shaded area s.e.m. (B) Normalized histogram of the head speed displayed during manually annotated behaviors. Time indicates the total length of the scored behaviors. (C) Proportion of manually annotated behaviors observed during yeast (left) or sucrose (right) micromovements. (D) Cumulative histogram of head positions during the first annotated proboscis extension in a yeast patch.
Figure 2 with 3 supplements
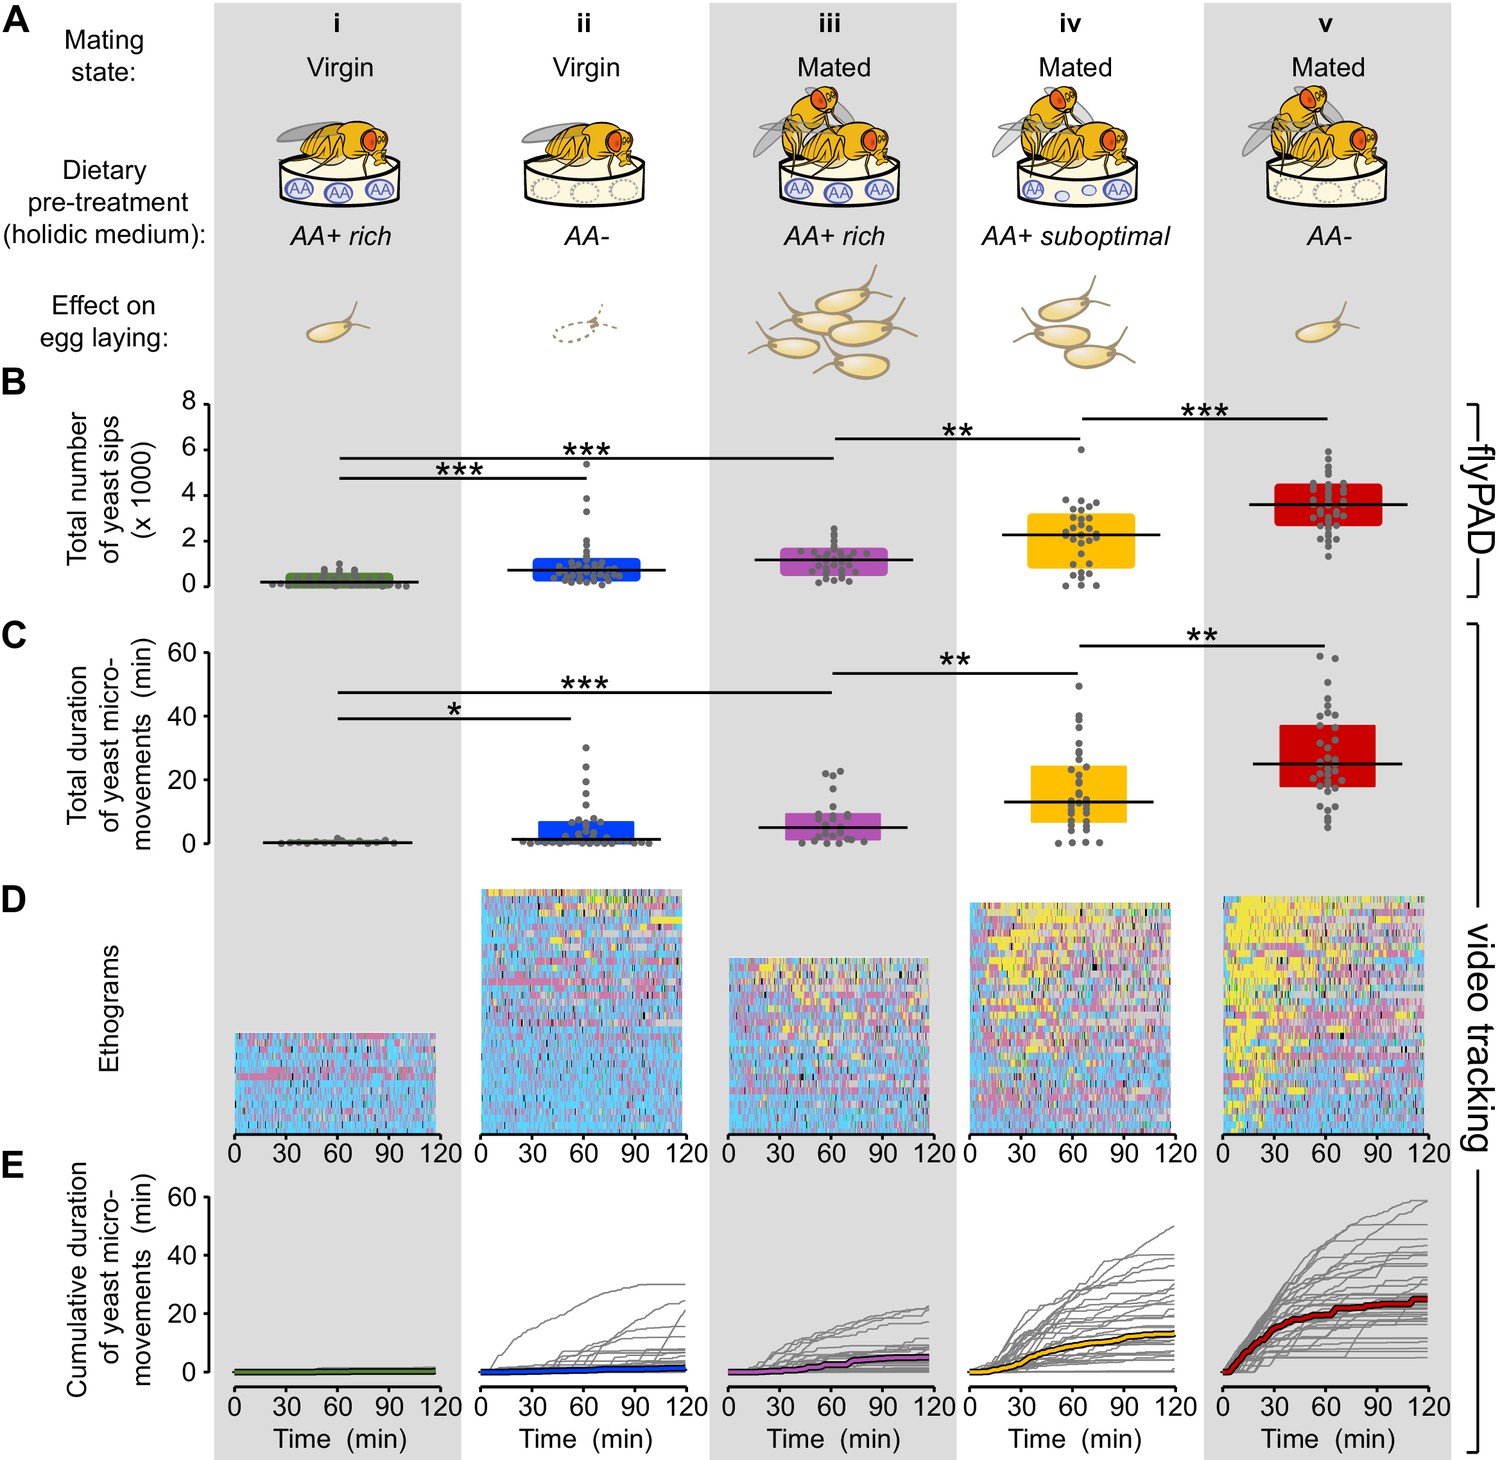
Flies increase yeast feeding and micromovements in response to amino acid challenges and mating.
(A) Graphical representation of the five internal states tested and the resulting reproductive output as reported by Piper et al. (2013), all flies were pre-fed during three days with the indicated holidic medium: (i) Virgin AA+ rich, (ii) Virgin AA+, (iii) Mated AA+ rich, (iv) Mated AA+ suboptimal, (v) Mated AA−. (B) Effect of internal states on the total number of yeast sips obtained using flyPAD assay (n = 32–43). (C) Effect of internal states on the total duration of yeast micromovements obtained from the video tracking assay (n = 15–35). (D) Behaviors displayed by single flies in the five internal states indicated in (A), during the video tracking assay. Each row represents the ethogram of a single fly, following the same color code used in Figure 1D. Yellow: yeast micromovements. Black: sucrose micromovements. Pink: micromovements outside the food patches. Blue: walking bouts. Gray: resting bouts. Green: sharp turns. (E) Dynamics of yeast micromovements quantified as the cumulative duration of yeast micromovements. Gray lines correspond to single flies. Thick colored lines indicate median. *p<0.05, **p<0.01, ***p<0.001, significance was tested by Wilcoxon rank-sum test with Bonferroni correction.
Figure 2—figure supplement 1
flyPAD setup, sucrose sips and yeast sips dynamics.
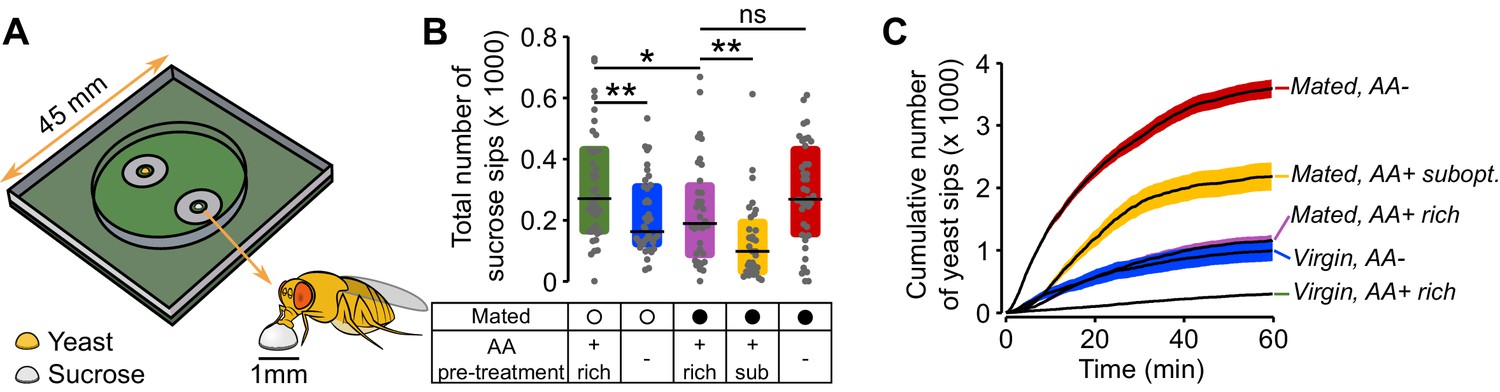
(A) Schematic of flyPAD arena, adapted from (Itskov et al., 2014). (B) Effect of internal states on the number of sucrose sips. Experimental groups are: Virgin (open circles) and mated (closed circles) females pre-fed three types of holidic media: AA+ rich, AA+ suboptimal and AA−. The concentration of yeast and sucrose in the food patches was the same used in the video tracking assay. (C) Cumulative number of yeast sips of flies in the five internal state conditions indicated. Line represents the mean and the shading the s.e.m.
Figure 2—figure supplement 2
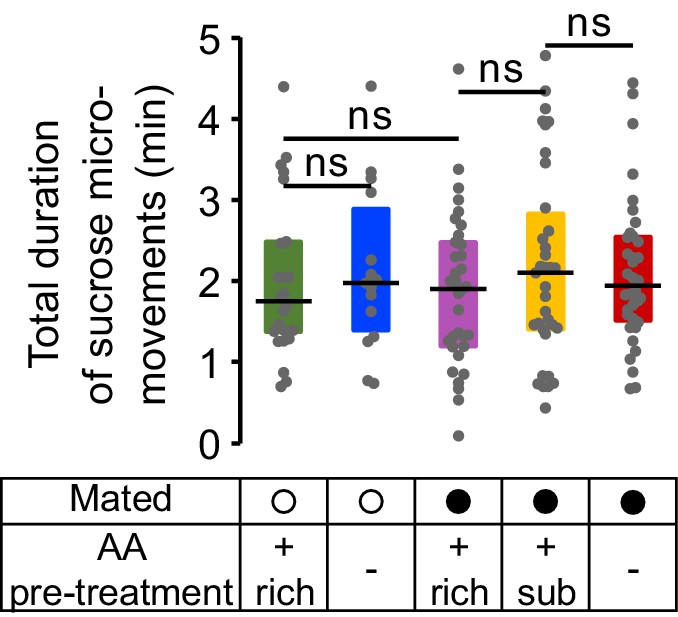
Sucrose micromovements.
Effect of internal states on the total duration of sucrose micromovements obtained from the video tracking assay.
Figure 2—figure supplement 3

Fraction of yeast non-eaters and coefficient of variation for yeast micromovements.
(A) Effect of internal states on the proportion of yeast non-eaters. A yeast non-eater is a fly for which the total duration of yeast visits was lower than 1 min. Significance was tested by a 2 x 2 Fischer’s exact test using the modified Wald method (Agresti and Coull, 1998) with Bonferroni correction. (B) Effect of internal states on the coefficient of variation (CV) for yeast micromovements (CV = SD/mean).
Figure 3 with 1 supplement
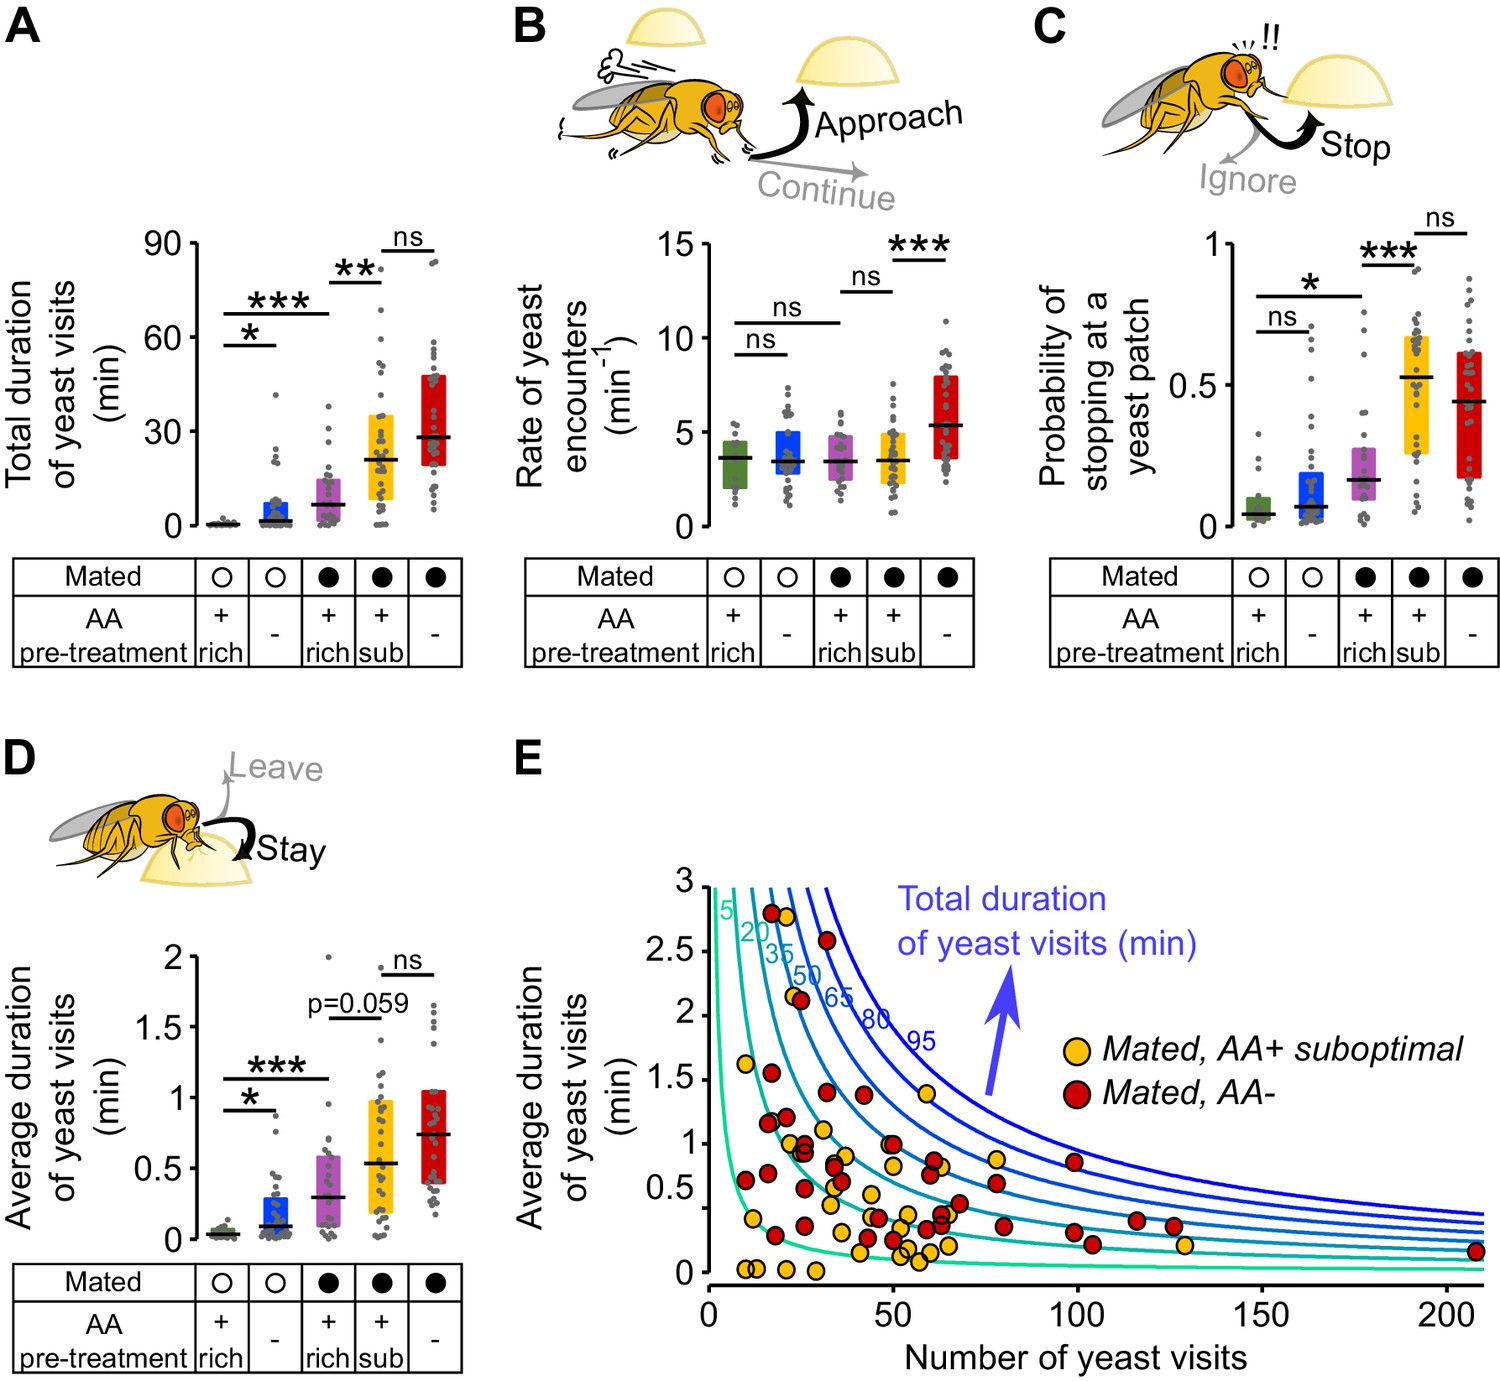
Metabolic state and mating modulate the probability of stopping at a yeast patch and leaving it.
(A) Effect of internal states on the total duration of yeast visits. Experimental groups are the ones shown in Figure 2: Mated (filled circles) and virgin (open circles) females pre-fed three types of holidic media: AA+ rich, AA+ suboptimal and AA−. (B) Effect of internal states on the decision to approach a yeast patch quantified as the number of yeast encounters per minute of walking outside the food patches (rate of yeast encounters). (C) Effect of internal states on the decision to stop at a yeast patch quantified as the fraction of yeast encounters in which the fly stopped at the yeast patch. (D) Effect of internal states in the decision to leave a yeast patch quantified as the average duration of yeast visits. (E) Combination of foraging strategies (total number of visits in x-axis and average duration of those visits in y-axis) to reach different total durations of yeast visits (green to blue lines), for individual AA-challenged mated flies: pre-fed either a suboptimal diet (yellow circles) or an AA- diet (red circles). ns, not significant (p≥0.05), *p<0.05, **p<0.01, ***p<0.001, significance was tested by Wilcoxon rank-sum test with Bonferroni correction.
Figure 3—figure supplement 1

Yeast encounters and probability of leaving.
(A) Effect of internal states on the absolute number of yeast encounters. (B) Complementary cumulative distribution function for yeast visit durations. Single dots represent one yeast visit. All yeast visits belonging to all animals of the same internal state condition were pooled, ranked and plotted in the same color as indicated in (Clauset et al., 2009).
Figure 4 with 3 supplements
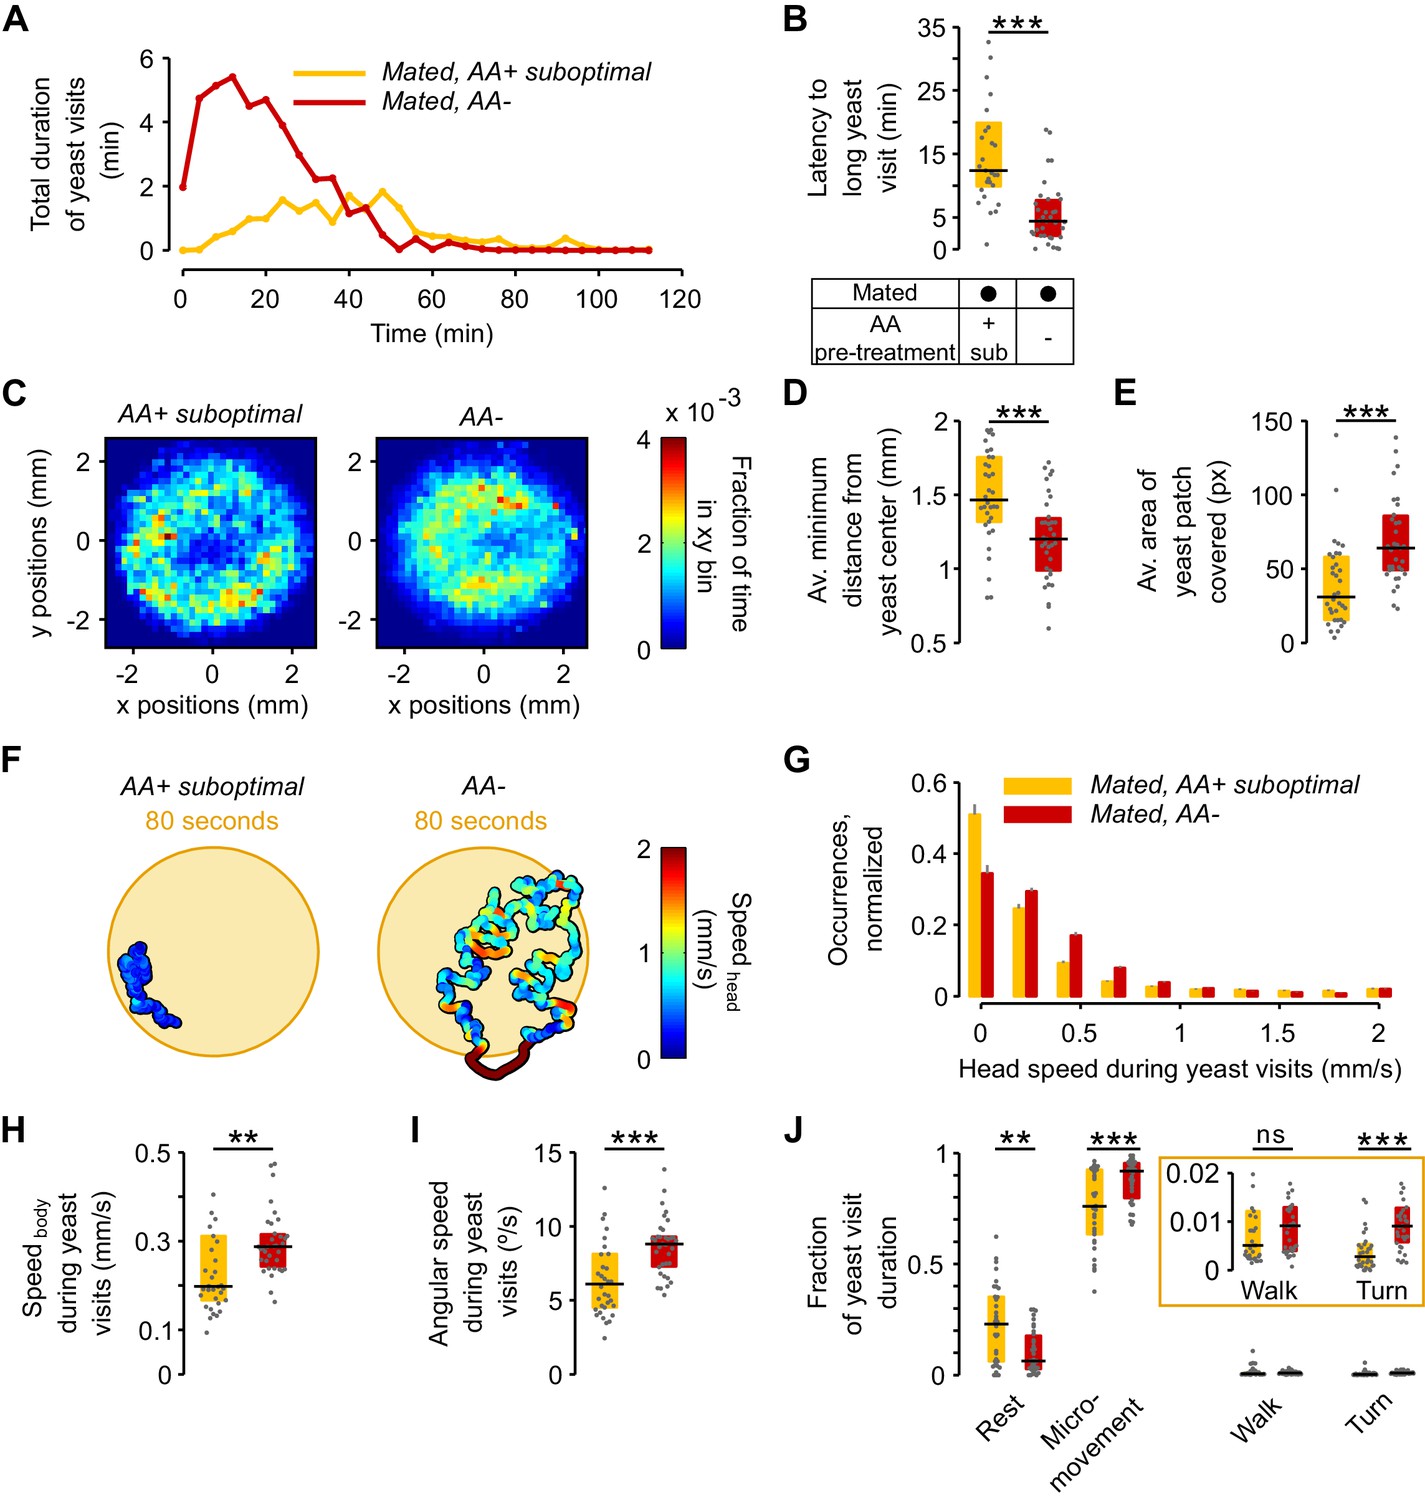
The lack of dietary AAs increases exploitation and local exploration of yeast patches.
(A) Rolling median of the total duration of yeast visits using a 5 min window and a step of 4 min for flies pre-fed a suboptimal diet (yellow) or AA− diet (red). (B) Effect of AA deprivation on the time elapsed until the fly engages in the first 'long' (≥30 s) yeast visit. (C) Histogram of the x-y relative position of all mated flies pre-fed a suboptimal diet (left) or a AA− diet (right) with respect to the center of the yeast patch (0,0). The pixel color indicates the fraction of time that flies in the indicated condition spent in the corresponding location bin. (D) Effect of AA deprivation on the average minimum distance to the center of the yeast patch, during a yeast visit. (E) Effect of AA deprivation on the average area covered during a yeast visit. (F) Example trajectories of head position during a yeast visit for a fly of the indicated condition. Hot colors indicate higher head speeds. (G–J) Effect of AA deprivation on the locomotor activity of mated flies during yeast visits: (G) average histogram of head speeds, (H) body centroid speed, (I) angular speed and (J) proportion of the indicted behaviors during yeast visits. ns, not significant (p≥0.05), **p<0.01, ***p<0.001, significance was tested by Wilcoxon rank-sum test with Bonferroni correction. Panels B, D, E, H–J compare the indicated parameters between mated flies pre-fed a suboptimal diet (yellow) and mated flies pre-fed an AA− diet (red).
Figure 4—figure supplement 1
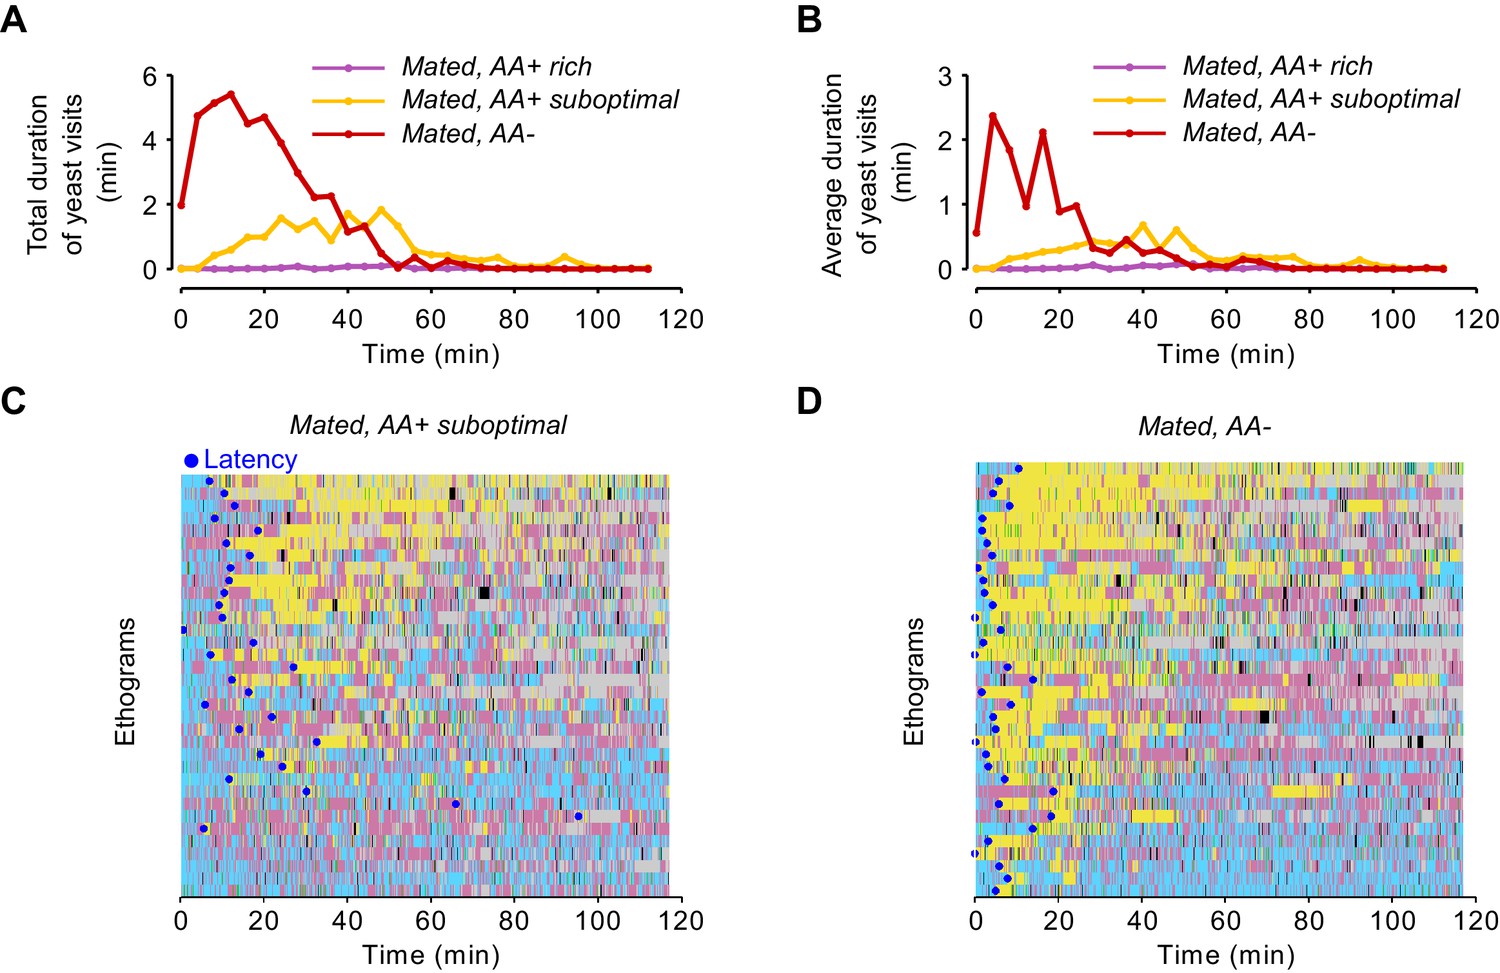
Yeast visits dynamics and latency.
(A,B) Rolling median of the total duration of yeast visits (A) and average duration of yeast visits (B) using a 5 min window and a step of 4 min for flies fed a AA+ rich diet (purple), AA+ suboptimal diet (yellow), and AA-deprived flies (red). (C,D) Ethograms from Figure 2D showing the latency to engage in the first 'long' (≥30 s) yeast visit for each fly of the indicated condition as a blue dot.
Figure 4—figure supplement 2

No effect in local exploration of yeast patches for flies pre-fed a suboptimal diet.
(A) Effect of AA challenges on the average minimum distance to the center of yeast patches, during a yeast visit. (B) Effect of AA challenges on the body centroid speed, during a yeast visit. (C) Effect of AA challenges on the angular speed, during a yeast visit.
Figure 4—figure supplement 3
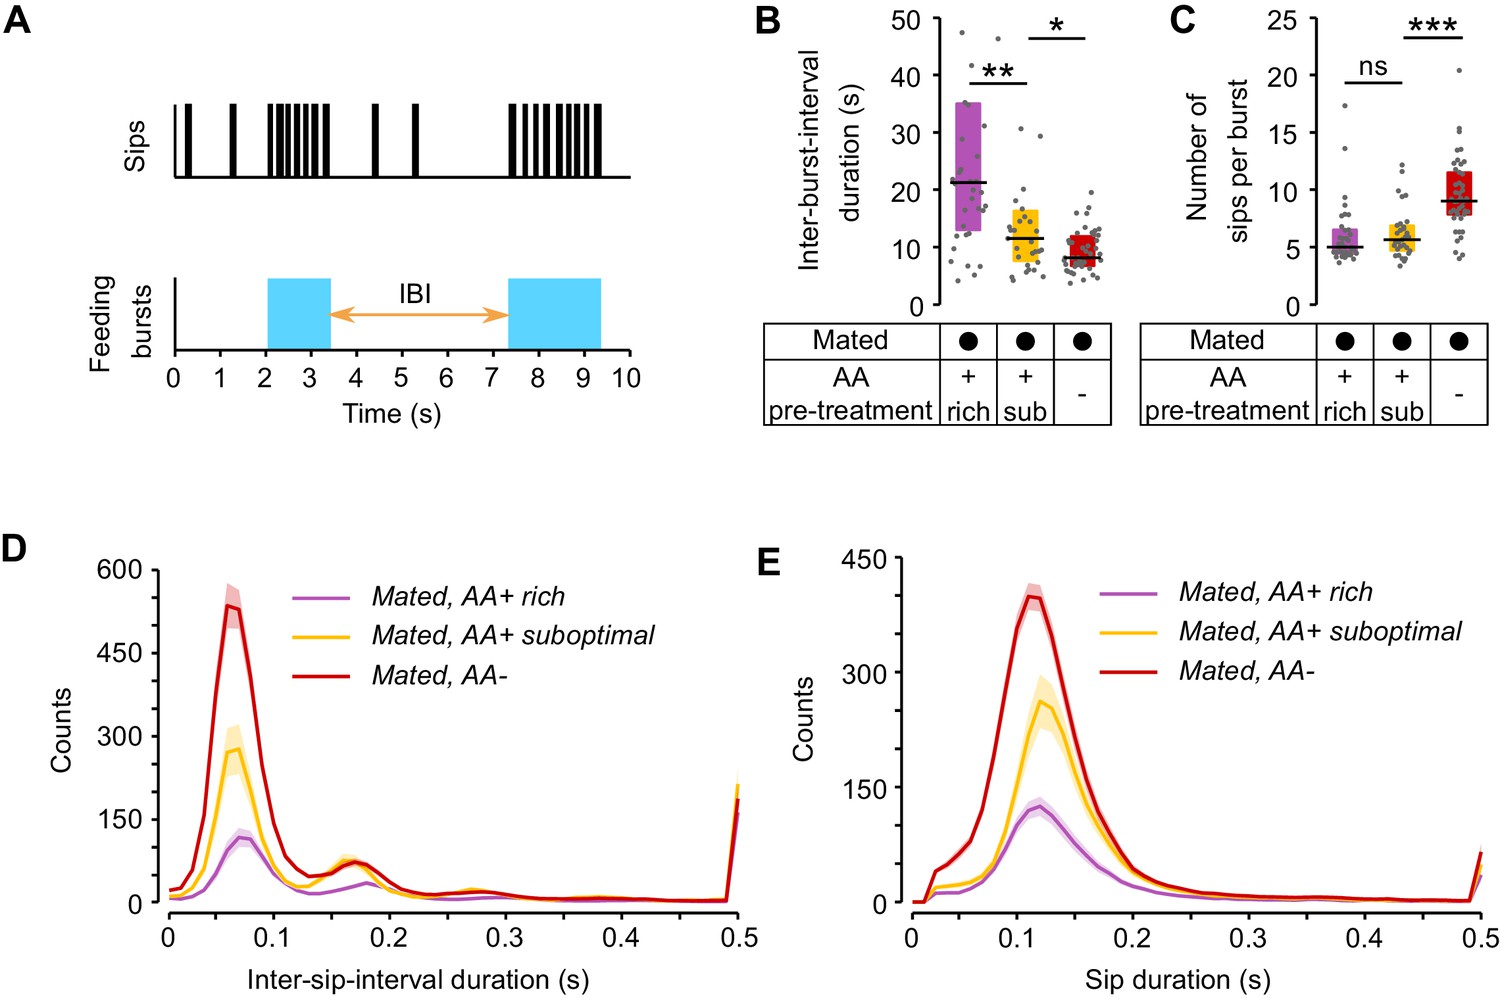
Modulation of yeast feeding program microstructure by AA challenges.
(A) Schematic of feeding program microstructure. Two components of the feeding microstructure can be modulated to reach protein homeostasis: the number of sips inside each feeding burst (blue shading) and the inter-burst interval (IBI). (B) Mean inter-burst-interval duration. (C) Mean number of yeast sips inside a feeding burst. (D) Histogram of the inter-sip-interval durations for the indicated internal states. (E) Histogram of the sip durations for the indicated internal states. In D and E the lines represent the mean and the shaded areas the s.e.m.
Figure 5 with 1 supplement
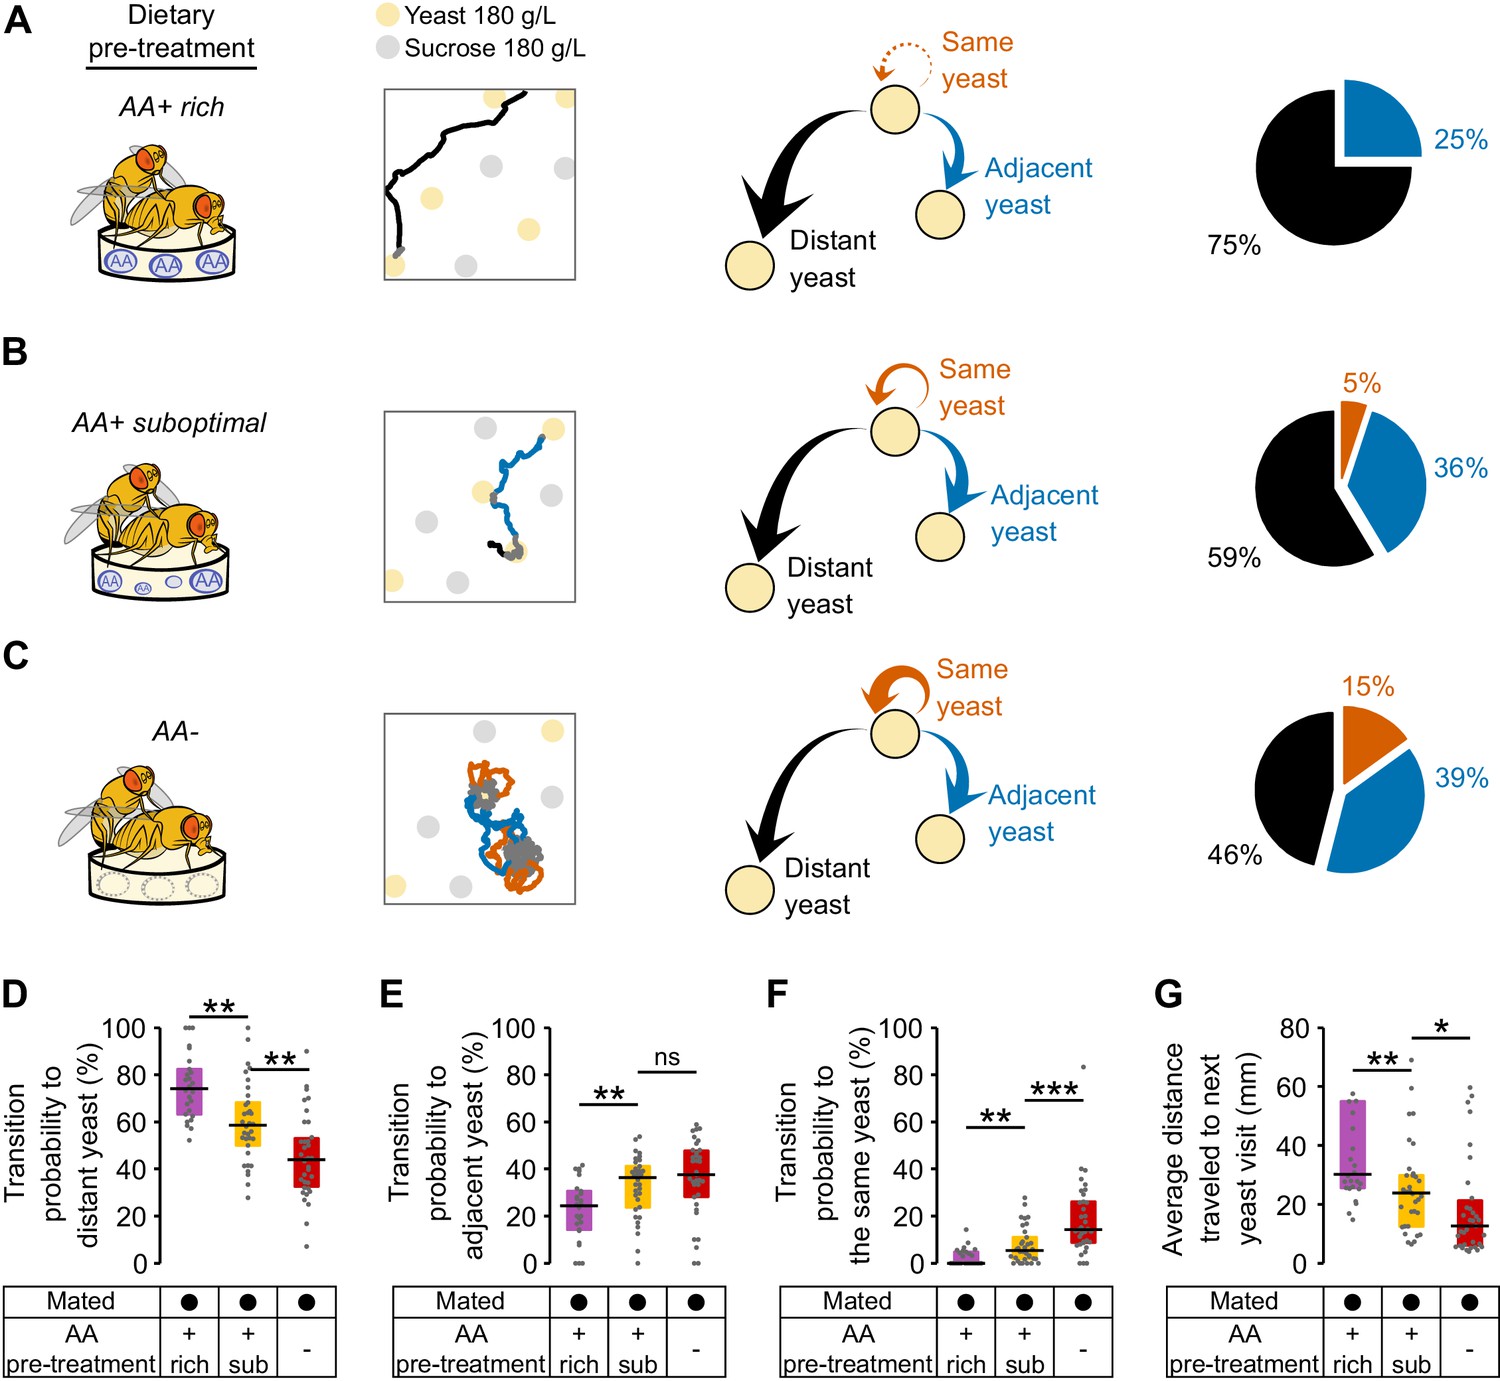
Amino acid challenges reduce global exploration and increases revisits to same yeast patch.
(A–C) Effect of internal states on exploratory behavior of mated females pre-fed with an AA rich diet (A), an AA suboptimal diet (B) or an AA− diet (C). Example trajectories show head position during a yeast-yeast transition. Arrows and pie charts indicate the transition probabilities to visit three types of yeast patches: the same (orange), an adjacent one (blue) or a distant one (black). (D–F) Comparison of the transition probabilities described in (A–C) across the different diet treatments in mated females. (G) Average distance covered during transitions to yeast visits. ns, not significant (p≥0.05), *p<0.05, **p<0.01, ***p<0.001, significance was tested by Wilcoxon rank-sum test with Bonferroni correction.
Figure 5—figure supplement 1
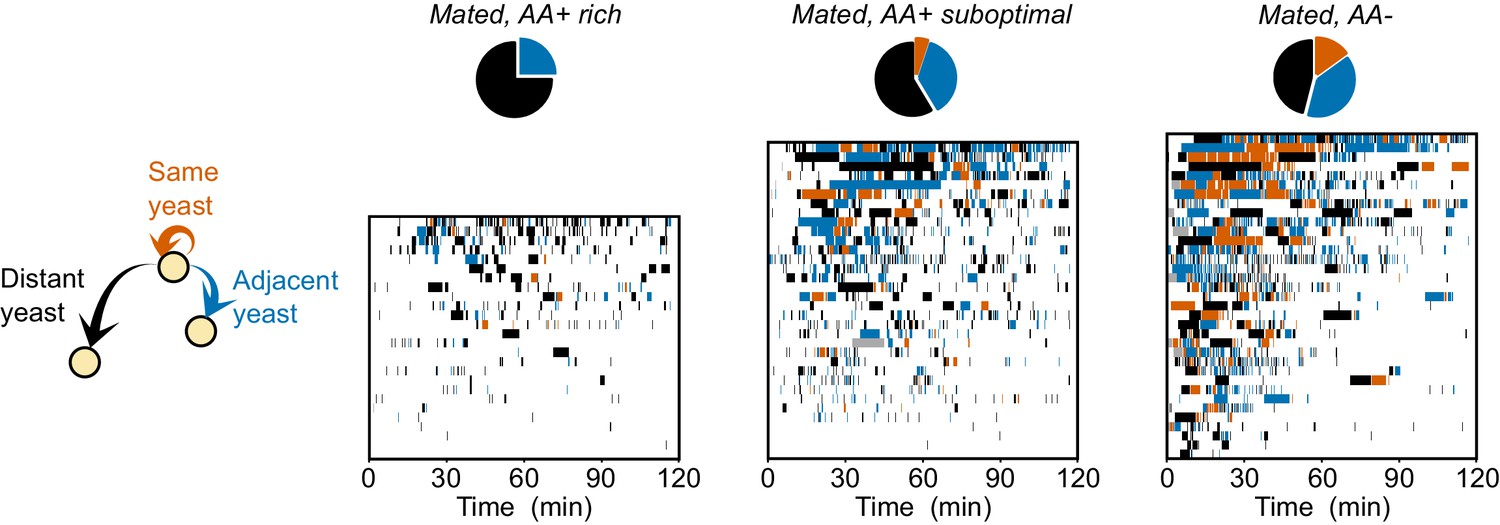
Dynamics of yeast-yeast transitions in single flies.
Ethograms showing the yeast visits for each fly (each row is a single fly) along the 120 min of the video tracking assay, for the indicated condition. Colors indicate if the food patch visited previous to every yeast visit was the same (orange), an adjacent (blue) or a distant one (black). Pie charts indicate the accumulated median transition probabilities by the end of the assay, for the indicated condition (same as Figure 5A–C).
Figure 6 with 1 supplement
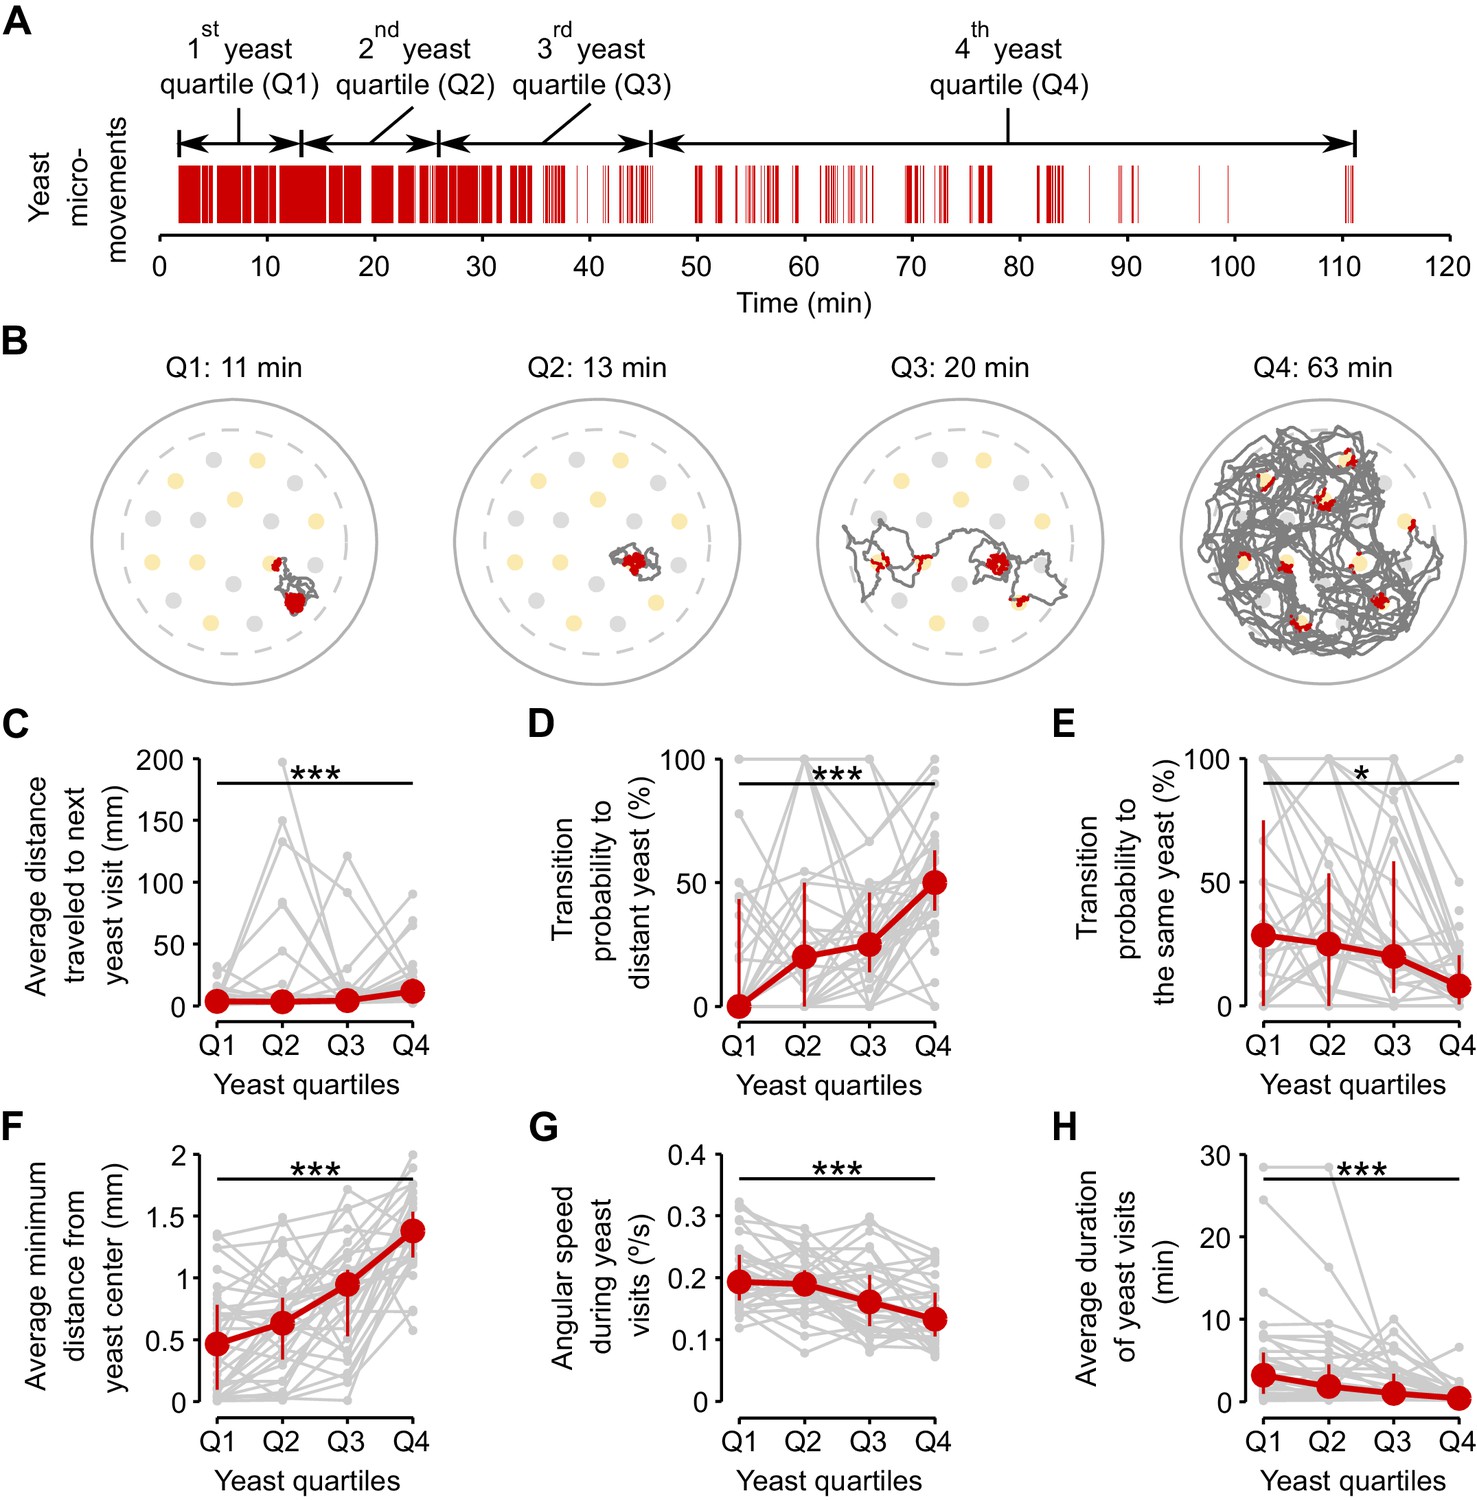
Flies dynamically adapt their exploitatory and exploratory behavior as their internal AA satiation changes.
(A) Definition of yeast quartiles based on the total duration of yeast micromovements along the two hours of the video tracking assay for an example fly. Arrows indicate start and end points of each yeast quartile. Each yeast quartile consists of 25% of the time that the fly spent in yeast micromovements, but covers a different amount of absolute time in the assay for each fly, as shown in (B). (B) Example trajectories of head positions during each yeast quartile defined in (A). Red indicates the occurrence of a yeast micromovement. (C–H) Effect of yeast satiation on exploration (C–E) and exploitation (F–H) parameters, for mated AA-deprived flies, quantified during the four yeast quartiles of each fly. As the flies spend more time on yeast, the values of these parameters change towards the values of flies fed with a rich diet. *p<0.05, ***p<0.001, significance was tested by Wilcoxon rank-sum test.
Figure 6—figure supplement 1

Exploitation parameters in AA-deprived flies revert back to fully-fed values.
(A–C) Exploitation parameters from first yeast quartile (Q1) and fourth yeast quartile (Q4) of AA-deprived mated females compared to the values observed in flies pre-fed a rich and a suboptimal diet along the 2 hr of the video tracking assay. (A) Average minimum distance of the head to the center of the yeast patch, (B) angular speed during yeast visits. (C) Average duration of yeast visits. ns, not significant (p≥0.05), ***p<0.001, significance was tested by Wilcoxon rank-sum test with Bonferroni correction.
Figure 7 with 1 supplement
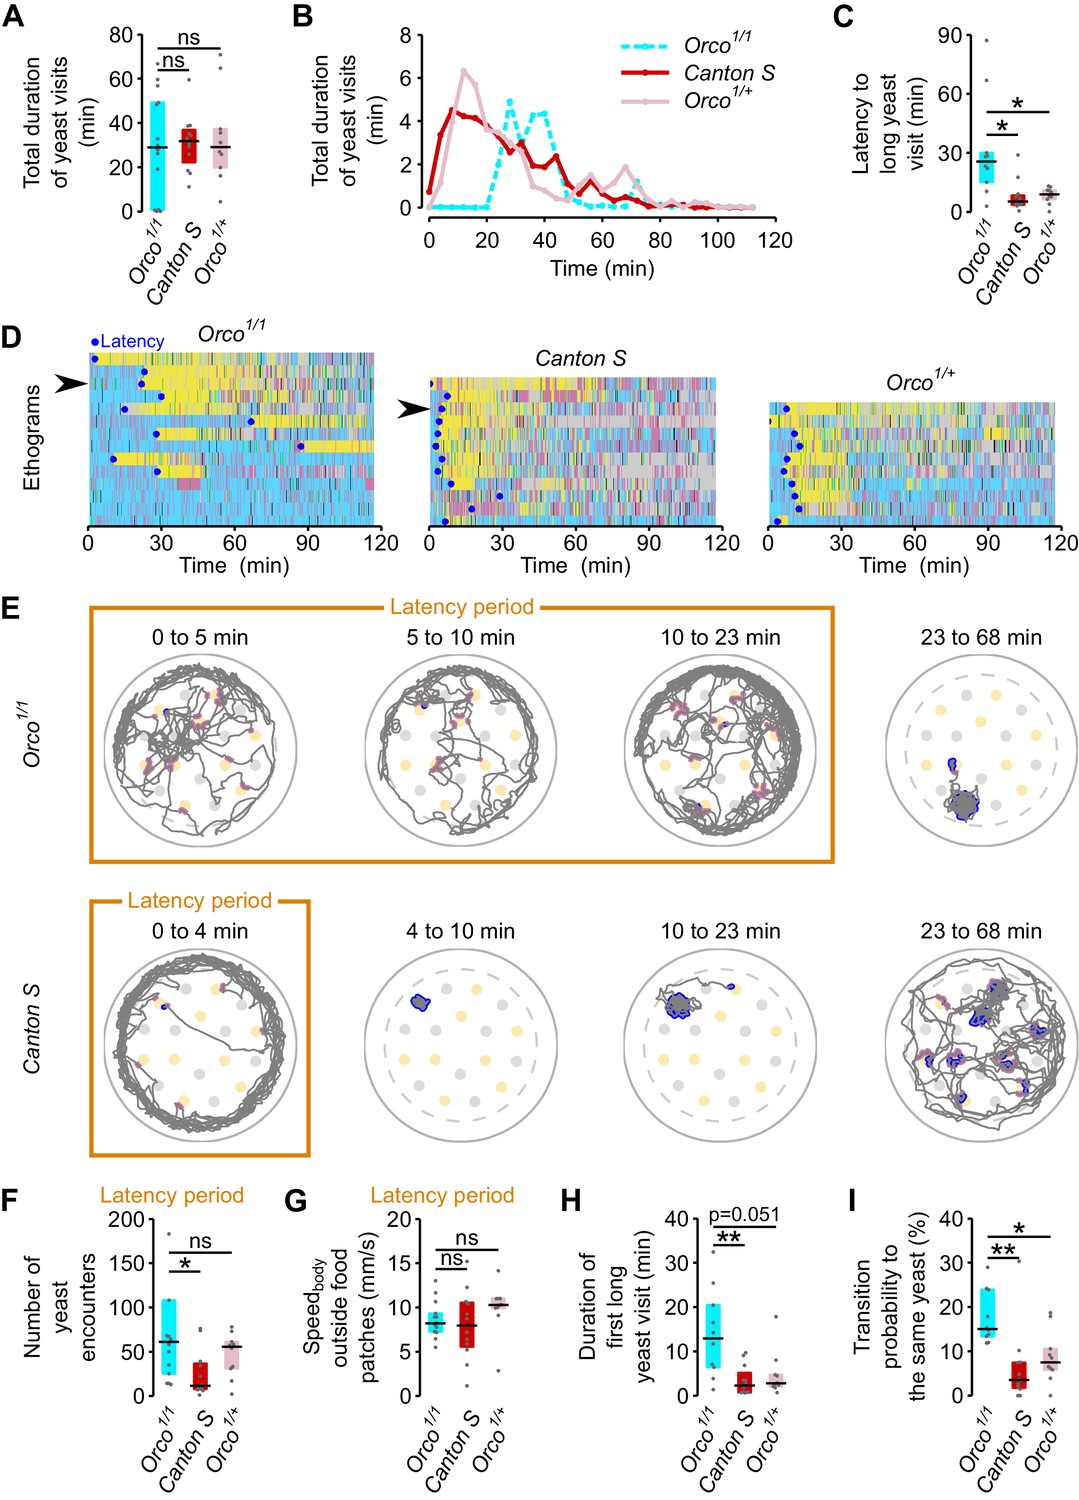
ORs mediate efficient recognition of yeast as an appropriate food source.
(A) Orco1/1 AA-deprived flies spend as much total time visiting yeast as AA-deprived control flies (n = 10–14). (B) Rolling median of the total duration of yeast visits using a 5 min window and a step of 4 min. (C) Effect of Orco mutation on the latency to engage in the first 'long' (≥30 s) yeast visit. (D) Behaviors displayed by Orco1/1and control flies, along the 120 min of the assay. Each row represents the ethogram of a single fly, following the same color code used in Figure 1D. Yellow: yeast micromovements. Black: sucrose micromovements. Pink: micromovements outside the food patches. Blue: walking bouts. Gray: resting bouts. Green: sharp turns. Blue circles indicate the latency (see C) of each fly. Arrows indicate example flies shown in (E). (E) Top: Example trajectory of head positions of an Orco1/1 AA-deprived fly during the 23-min-long latency period (first three panels on the left) and during 45 min after the latency period (fourth panel). Bottom: Example trajectory of head positions of a Canton S AA-deprived fly during the 4-min-long latency period (first panel on the left) and from the latency point up to minute 68 (three panels on the right). Highlighted trajectory segments represent yeast encounters (pink) and yeast visits (blue). (F–G) Exploration and locomotor activity during latency period is not affected in Orco1/1 flies as indicated by the number of yeast encounters (F) and the body centroid speed outside food patches (G). (H) The first long yeast visit is longer in Orco1/1 flies than in control flies. (I) Probability of transition to same yeast patch is higher in Orco1/1 flies than in control flies. ns, not significant (p≥0.05), *p<0.05, **p<0.01, significance was tested by Wilcoxon rank-sum test with Bonferroni correction.
Figure 7—figure supplement 1
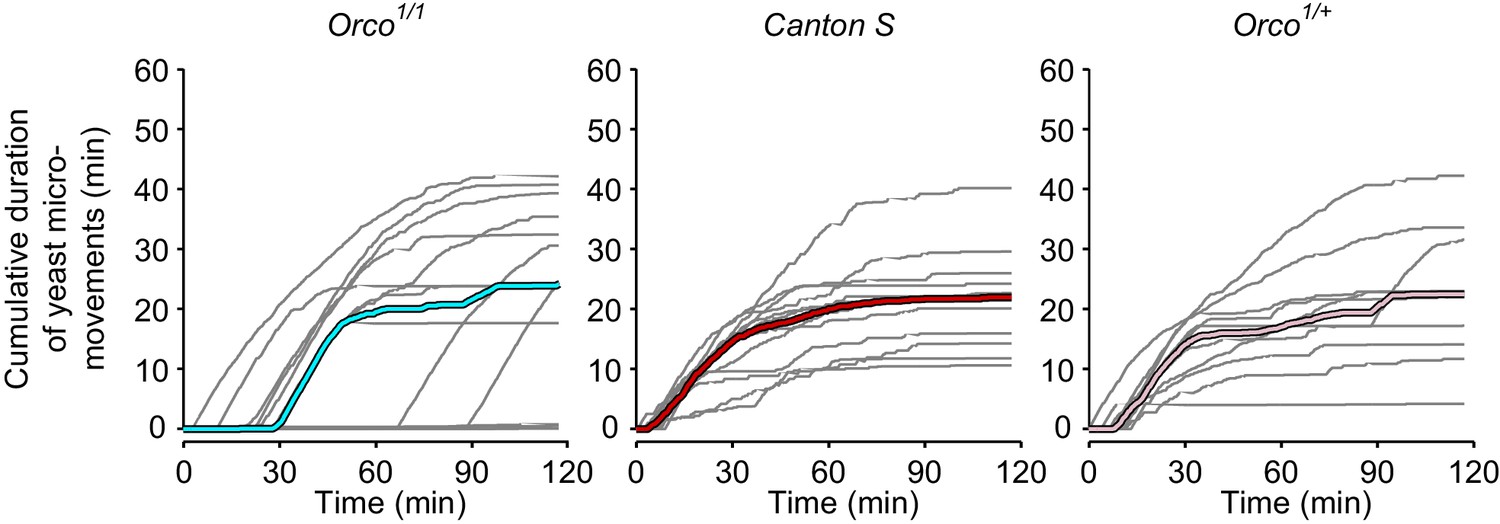
Yeast dynamics of Orco mutant flies.
Cumulative duration of yeast micromovements. Gray lines correspond to single flies. Thick colored lines indicate median.
Figure 8 with 1 supplement
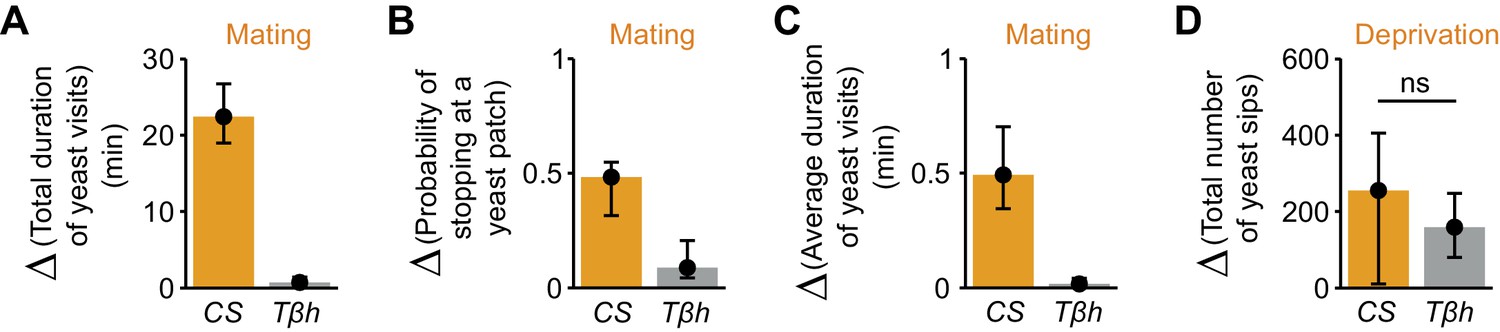
Octopamine mediates postmating response towards yeast but not internal sensing of AA deprivation state.
(A–C) Effect of the TβhnM18 mutation on the postmating change in foraging parameters, obtained from the video tracking assay after 1 hr: total duration of yeast visits (A), probability of stopping at a yeast patch (B) and average duration of yeast visits (C) for Canton S and TβhnM18 females, both AA-deprived. Bars depict difference between median value of mated minus virgin groups for the correspondent parameter. Error bars show 5% and 95% bootstrap confidence intervals (n = 25–33). (D) Effect of Tβh mutation on the increase of yeast sips after AA deprivation in virgin females, quantified using the flyPAD setup. Bars depict difference between median values of AA+ (suboptimal) minus AA−deprived groups. Error bars show 5% and 95% bootstrap confidence intervals (n = 26–34). ns, not significant. (A–C) Show statistically significant differences between Canton S and TβhnM18 females, as the confidence intervals don’t overlap.
Figure 8—figure supplement 1
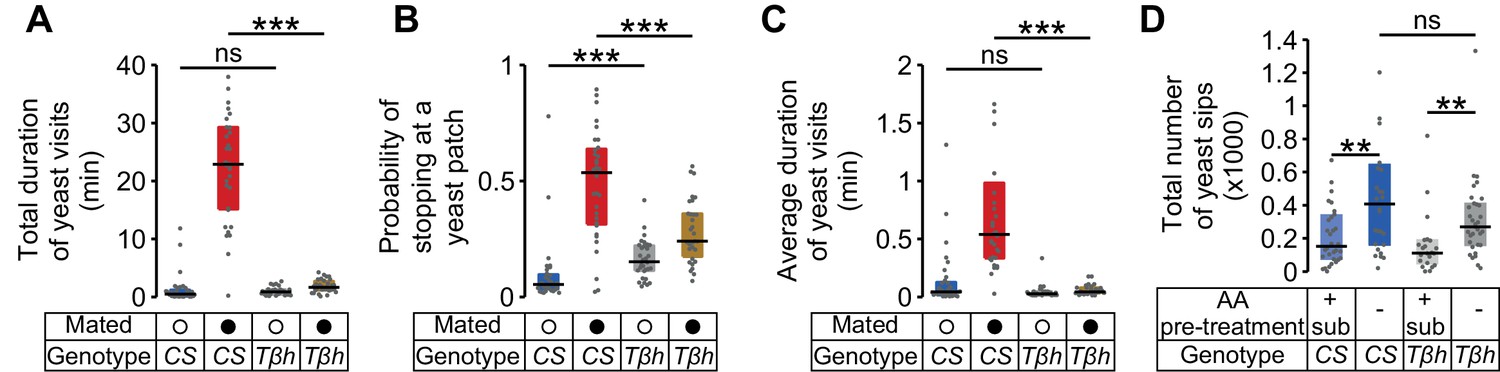
Octopamine mediates postmating response to yeast.
(A–C) Effect of the TβhnM18mutation on the postmating change in foraging parameters, obtained using the video tracking setup: (A) total duration of yeast visits, (B) probability of stopping at a yeast patch and (C) average duration of yeast visits for AA-deprived Canton S and TβhnM18 virgin (open circles) and mated (closed circles) females. (D) Effect of TβhnM18mutation on the increase of yeast sips after AA deprivation in virgin females, using the flyPAD assay. ns, not significant (p≥0.05), *p<0.05, **p<0.01, ***p<0.001, significance was tested by Wilcoxon rank-sum test with Bonferroni correction.
Figure 9
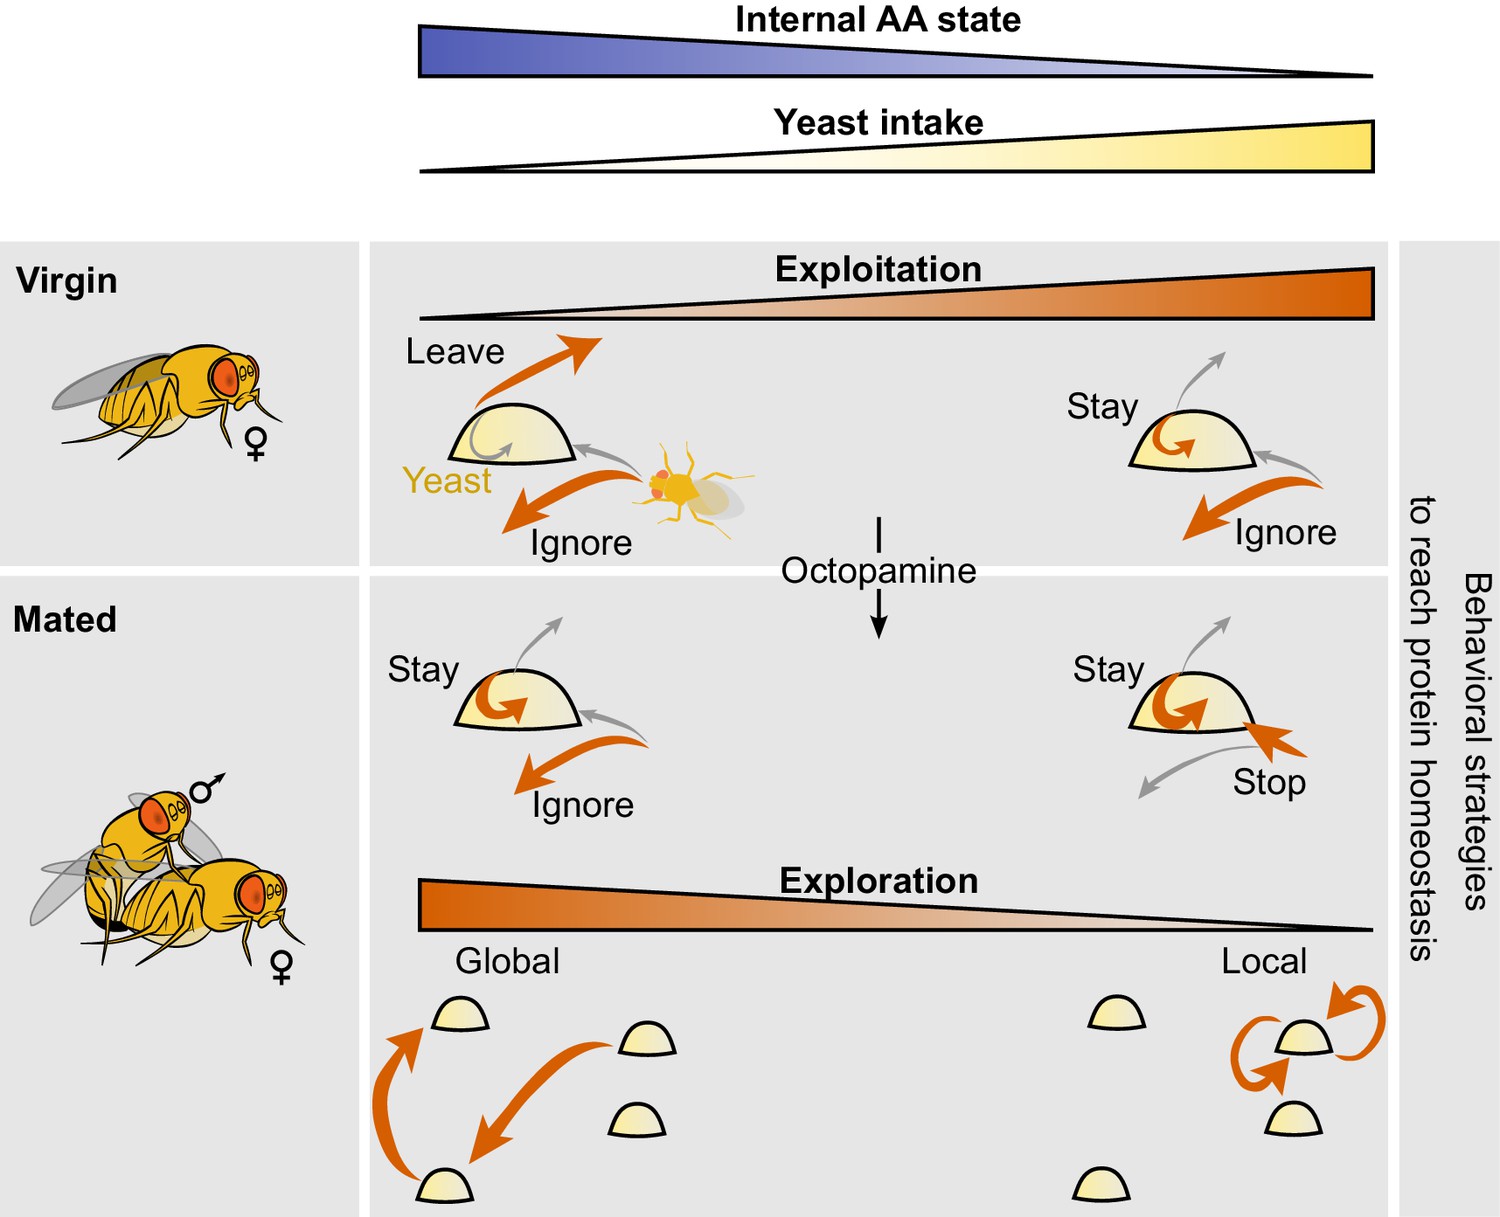
Model of behavioral strategies modulated by internal AA state.
We propose a model in which virgin flies with high internal levels of AAs display low intake mostly ignore yeast patches upon encounter and have a high probability of leaving the yeast patch upon stopping at it. Internal AA levels decrease as a consequence of poor diets which induce a change in the leaving decision, inducing increased yeast intake. Octopamine mediates the postmating changes in the foraging decisions of stopping at the yeast patch and leaving it upon encounter. As the internal AA levels decrease in mated females, their exploration patterns switch from global exploration to local exploration and multiple returns to the same yeast patch.
Videos
Video 1
Behavior classification during nutrient decisions.
A 20-s-segment of the trajectory depicted in Figure 1C–D, starting on second 40 and following the same color code. The first 7 s of the video are slowed-down 0.5 x, as indicated by the white label at the top right corner of the video frame with the fly.
Tables
Table 1
Composition of holidic medium.
| Ingredient | Stock | Amount per liter | |
|---|---|---|---|
| Gelling agent | Agar | 20 g | |
| Sugar | Sucrose | 17.12 g | |
| Amino acids for 50S200NHUNTaa* | L-isoleucine | 1.82 g | |
| L-leucine | 1.21 g | ||
| L-tyrosine | 0.42 g | ||
| Amino acids for 50S200NYaa* | L-isoleucine | 1.16 g | |
| L-leucine | 1.64 g | ||
| L-tyrosine | 0.84 g | ||
| Metal ions | CaCl2.6H2O | 1000x: 250 g/l | 1 ml |
| CuSO4.5H2O | 1000x: 2.5 g/l | 1 ml | |
| FeSO4.7H2O | 1000x: 25 g/l | 1 ml | |
| MgSO4 (anhydrous) | 1000x: 250 g/l | 1 ml | |
| MnCl2.4H2O | 1000x:1 g/l | 1 ml | |
| ZnSO4.7H2O | 1000x: 25 g/l | 1 ml | |
| Cholesterol | Cholesterol | 20 mg/ml in Ethanol | 15 ml |
| Water | Water (milliQ) | 1 l minus combined volume to be added after autoclaving | |
| Autoclave 15 min at 120ºC. All additions below should be performed using sterile technique | |||
| Amino acids for 50S200NHUNTaa* | Essential amino acid stock solution | 8 g/l L- arginine monohydrochloride 10 g/l L-histidine 19 g/l L- lysine monohydrochloride 8 g/l L-methionine 13 g/l L-phenylalanine 20 g/l L-threonine 5 g/l L-tryptophan 28 g/l L-valine | 60.51 ml |
| Non-essential amino acid stock solution | 35 g/l L-alanine 17 g/l L-asparagine 17 g/l L-aspartic acid sodium salt monohydrate 0.5 g/l L-cysteine hydrochloride 25 g/l L-glutamine 32 g/l glycine 15 g/l L-proline 19 g/l L-serine | 60.51 ml | |
| Sodium glutamate stock solution | 100 g/l L-glutamic acid monosodium salt hydrate | 15.13 ml | |
| Amino acids for 50S200NYaa* | Essential amino acid stock solution | 23.51 g/l L-arginine monohydrochloride 11.21 g/l L-histidine 28.70 g/l L-lysine monohydrochloride 5.62 g/l L-methionine 15.14 g/l L-phenylalanine 21.39 g/l L-threonine 7.27 g/l L-tryptophan 22.12 g/l L-valine | 60.51 ml |
| Non-essential amino acid stock solution | 26.25 g/l L-alanine 13.89 g/l L-asparagine 13.89 g/l L-aspartic acid sodium salt monohydrate 30.09 g/l L-glutamine 17.89 g/l glycine 9.32 g/l L-proline 12.56 g/l L-serine | 60.51 ml | |
| Sodium glutamate stock solution | 100 g/l L-glutamic acid monosodium salt hydrate | 18.21 ml | |
| Cysteine stock solution | 50 g/l L-cysteine hydrochloride | 5.28 ml | |
| Vitamins | Vitamin solution | 125x: 0.1 g/l thiamine hydrochloride 0.05 g/l riboflavin 0.6 g/l nicotinic acid 0.775 g/l Ca pantothenate 0.125 g/l pyridoxine hydrochloride 0.01 g/l biotin | 14 ml |
| Sodium folate | 1000x: 0.5 g/l | 1 ml | |
| Base | Buffer | 10x: 30 ml/l glacial acetic acid 30 g/l KH2PO4 10 g/l NaHCO3 | 100 ml |
| Other nutrients | 125x: 6.25 g/l choline chloride 0.63 g/l myo-inositol 8.13 g/l inosine 7.5 g/l uridine | 8 ml | |
-
* To prepare the 50S200NHUNTaa diet, use the values shaded in blue. To prepare the 50S200NYaa diet, use the values shaded in orange.
Download links
A two-part list of links to download the article, or parts of the article, in various formats.
Downloads (link to download the article as PDF)
Open citations (links to open the citations from this article in various online reference manager services)
Cite this article (links to download the citations from this article in formats compatible with various reference manager tools)
Internal states drive nutrient homeostasis by modulating exploration-exploitation trade-off
eLife 5:e19920.
https://doi.org/10.7554/eLife.19920


