Filamin, a synaptic organizer in Drosophila, determines glutamate receptor composition and membrane growth
- Boston Children’s Hospital, United States
- Harvard Medical School, United States
Figures
Figure 1 with 1 supplement
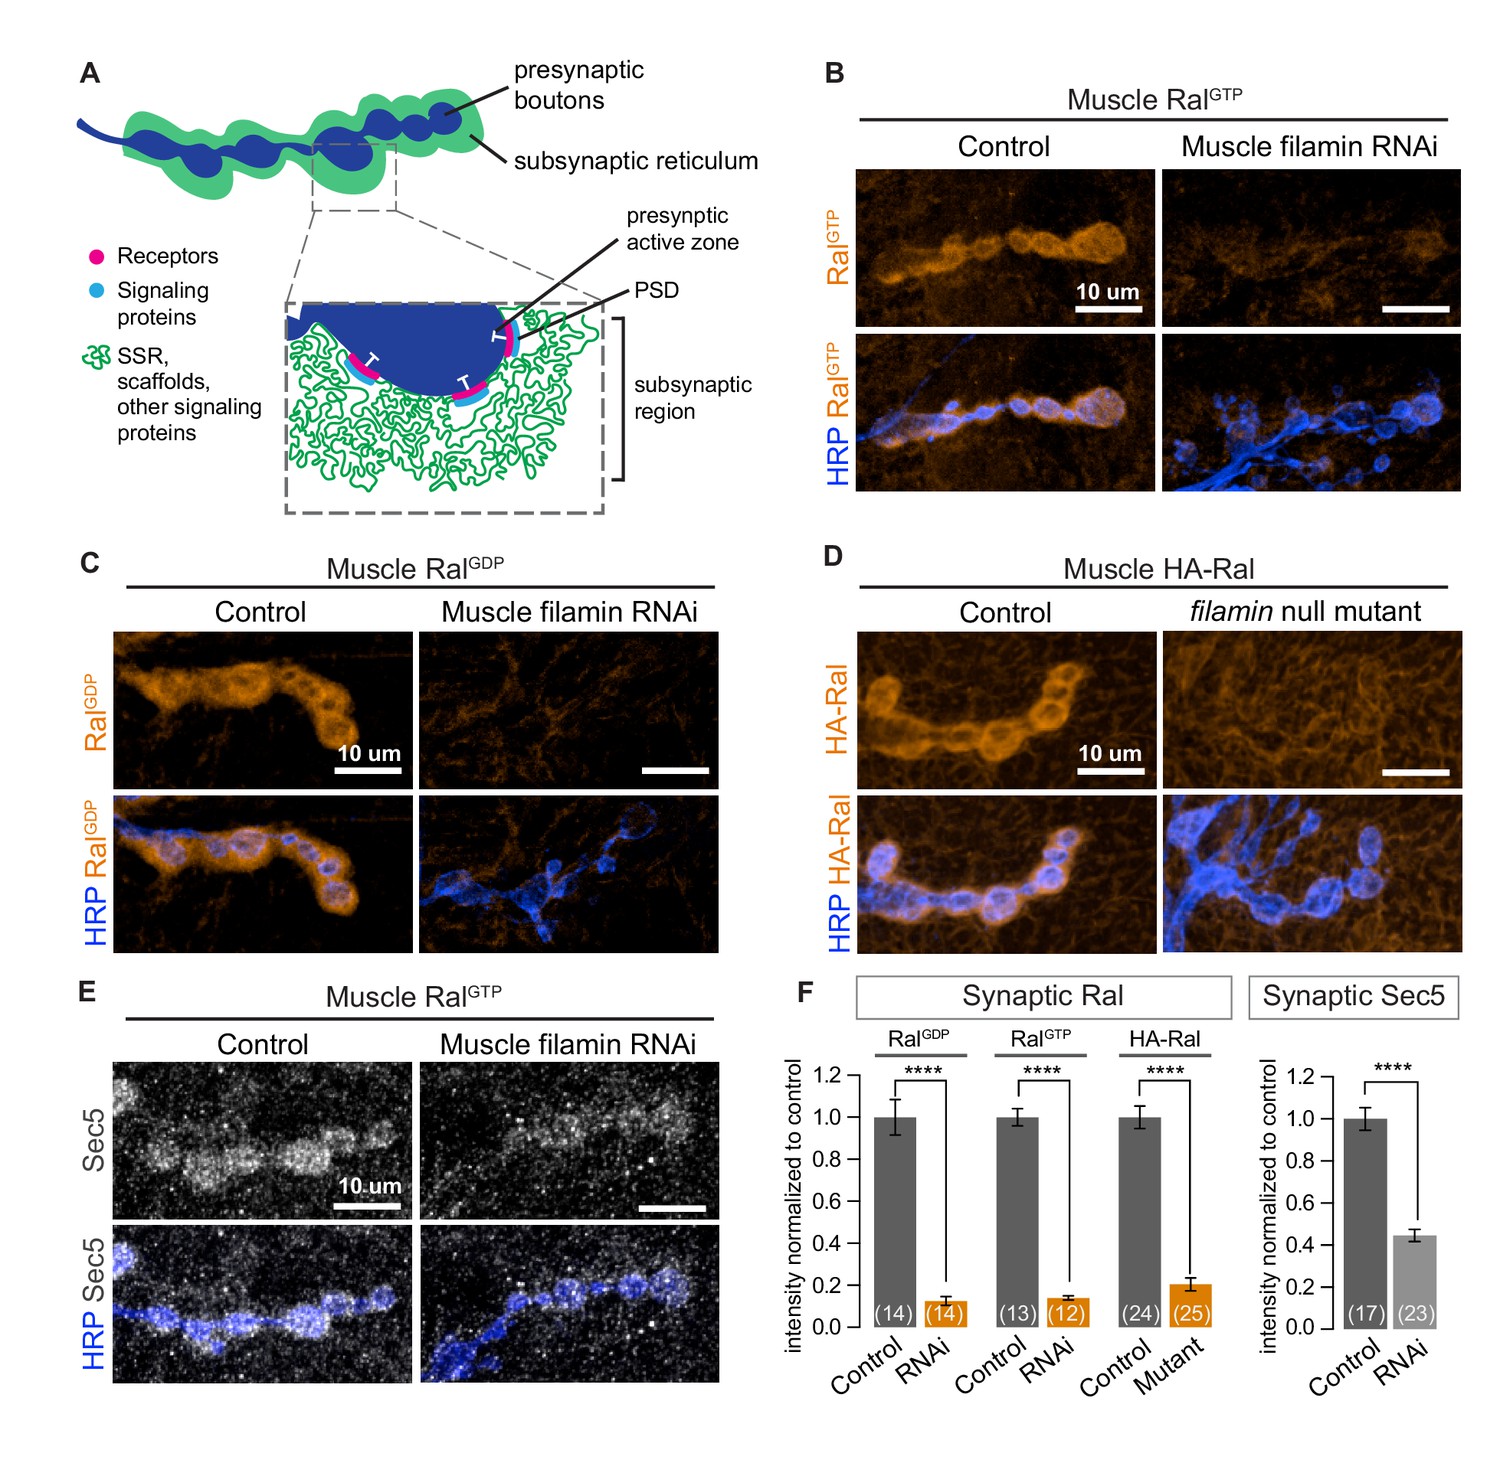
Subsynaptic localization of Ral and Sec5 requires muscle filamin.
(A) Schematic cross-section of a larval neuromuscular junction (NMJ) illustrating the locations of postsynaptic components. The presynaptic active zone, marked by an electron-dense T-bar (white), faces the postsynaptic density (PSD) that contains glutamate receptors (magenta) and associated signaling molecules (blue). The extensively folded postsynaptic membrane, the subsynaptic reticulum (SSR, green), occupies a subsynaptic region that extends into the muscle and surrounds the boutons. The SSR contains membrane curvature proteins, including Syndapin, and signaling molecules, including Ral. Proteins in the SSR are not uniformly distributed throughout; some components, including Dlg, are restricted to the more superficial layers (Koles et al., 2015). (B–C) Confocal images of NMJs immunostained for constitutively-active RalGTP (B) or GDP-locked Ral (C) expressed in muscles of control larvae (G14-Gal4/+;UAS-RalGTP/+ and G14-Gal4/UAS-RalGDP;+/+) and larvae with muscle co-expression of RNAi against filamin (G14-Gal4/+;UAS-RalGTP/UAS-filamin RNAi and G14-Gal4/UAS-RalGDP;UAS-filamin RNAi/+). To detect Ral, an anti-Ral antibody that does not noticeably detect endogenous Ral (Teodoro et al., 2013) is used. In this and all subsequent figures, presynaptic nerve terminals are labeled using an antibody against neuronal membrane marker HRP (horseradish peroxidase). (D) Confocal images of NMJs immunostained for HA-Ral expressed in the postsynaptic muscles of control (UAS-HA-Ral/G14-Gal4;cherΔ12.1/+) and filamin null larvae (UAS-HA-Ral/G14-Gal4; cherΔ12.1/cherQ1415sd). (E) Confocal images of NMJs immunostained for the exocyst component Sec5 which is recruited to the subsynaptic region by muscle expression of RalGTP in control larvae (UAS-RalGTP,MHCGS/+) but not upon coexpression of RNAi against filamin (UAS-RalGTP,MHCGS/UAS-filamin RNAi). (F) Quantification of mean synaptic fluorescence intensities for the genotypes in (B–E), each normalized to their control. The images selected here and in all subsequent figures reflect the mean values for that genotype and, unless otherwise specified, are shown as z-stacks with maximum-intensity projection. For all quantifications, values are background-subtracted and normalized to control. Scale bar: 10 μm. Number of NMJs quantified is indicated in each graph; number of animals quantified in this and subsequent figures are indicated in a table in the Materials and methods section. Statistical significance was determined using two-tailed unpaired t test, ****p<0.0001. All error bars indicate ± SEM.
Figure 1—figure supplement 1
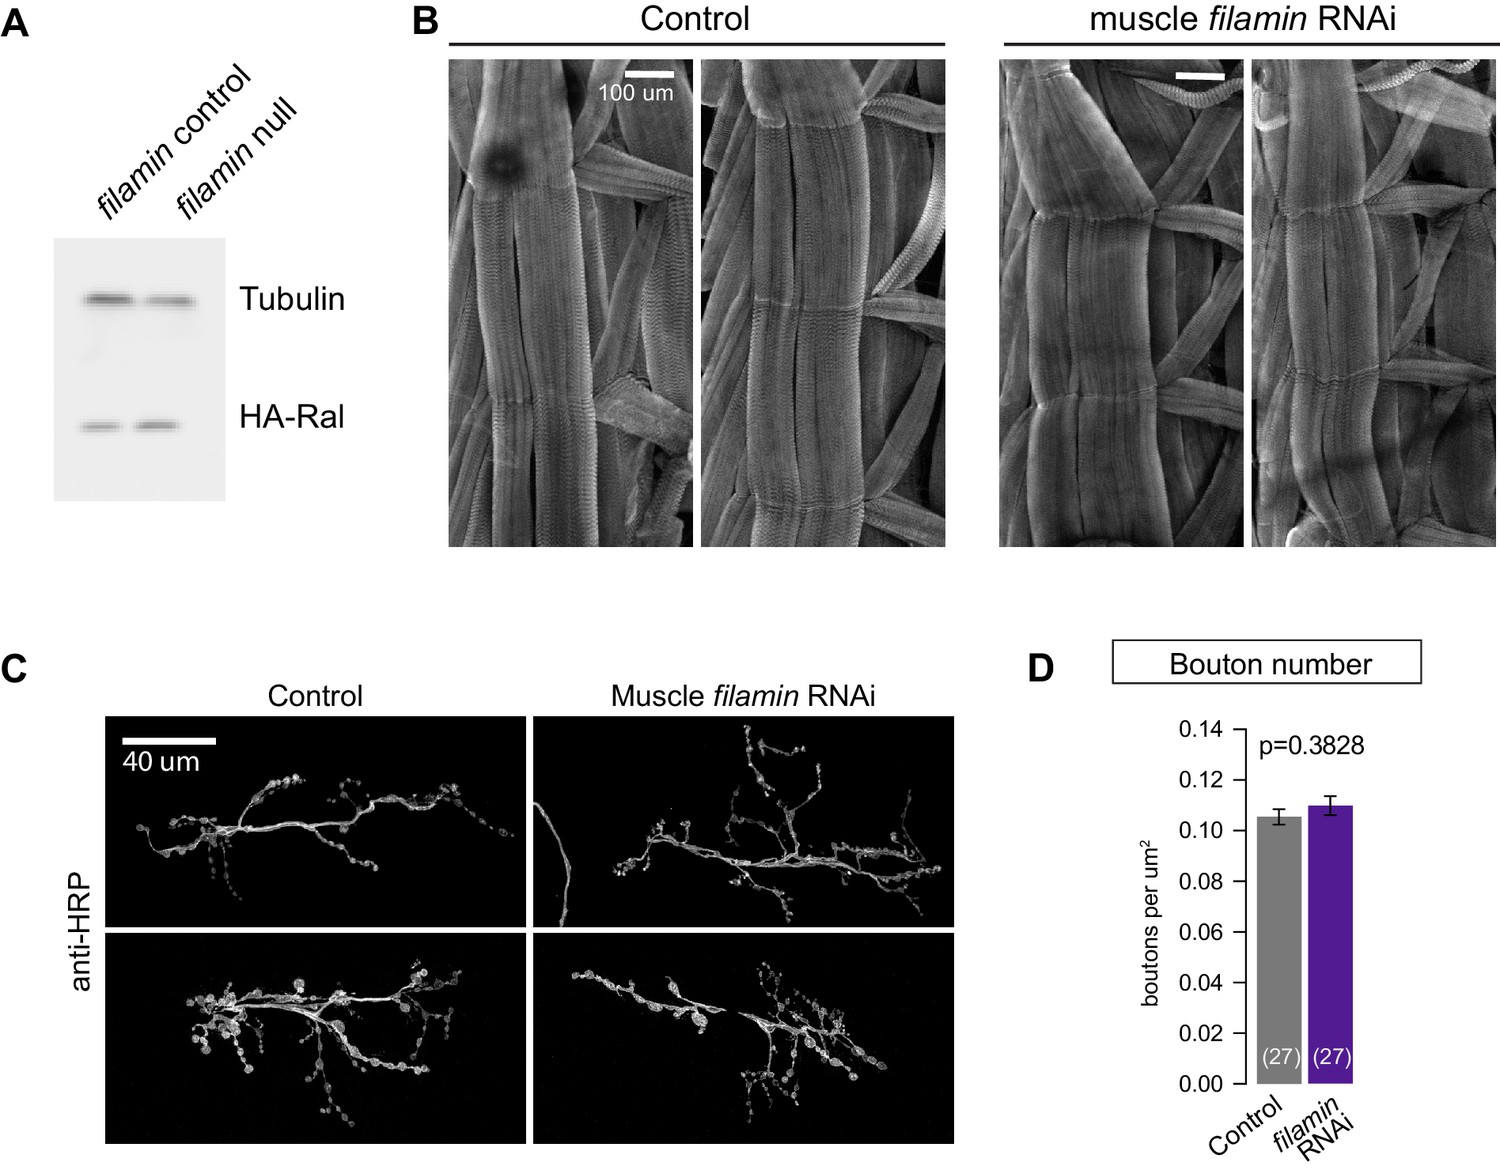
Loss of filamin impairs synaptic localization of Ral independent of Ral protein levels or muscle integrity.
(A) Western blot analysis for HA-Ral expression in third-instar larval lysates. Similar levels of HA-Ral are detected in control (UAS-HA-Ral/G14-Gal4; cherΔ12.1/+) and filamin null larvae (UAS-HA-Ral/G14-Gal4; cherΔ12.1/cherQ1415sd). Tubulin immunoreactivity is shown as a loading control. (B) Two representative immunofluorescence images for muscle actin (labeled with rhodamine-Phalloidin) in control larvae (G14-Gal4/+) and those with muscle-specific knockdown of filamin (G14-Gal4/+;UAS-filamin RNAi/+). (C) Representative confocal images of NMJs at muscle 6/7, immunostained with anti-HRP, to reveal nerve terminal morphology. Left: NMJs of control larvae (G14-Gal4/+); right: NMJs of larvae with muscle-specific knockdown against filamin (G14-Gal4/+;UAS-filamin RNAi). (D) Quantification of bouton number, per HRP-positive area, at the indicated genotypes. Scale bar: 100 μm in (B); 40 μm in (C). Representative images for each experiment reflect the mean values across NMJs examined. Images are shown as z-stacks with maximum-intensity projection.
Figure 2 with 1 supplement
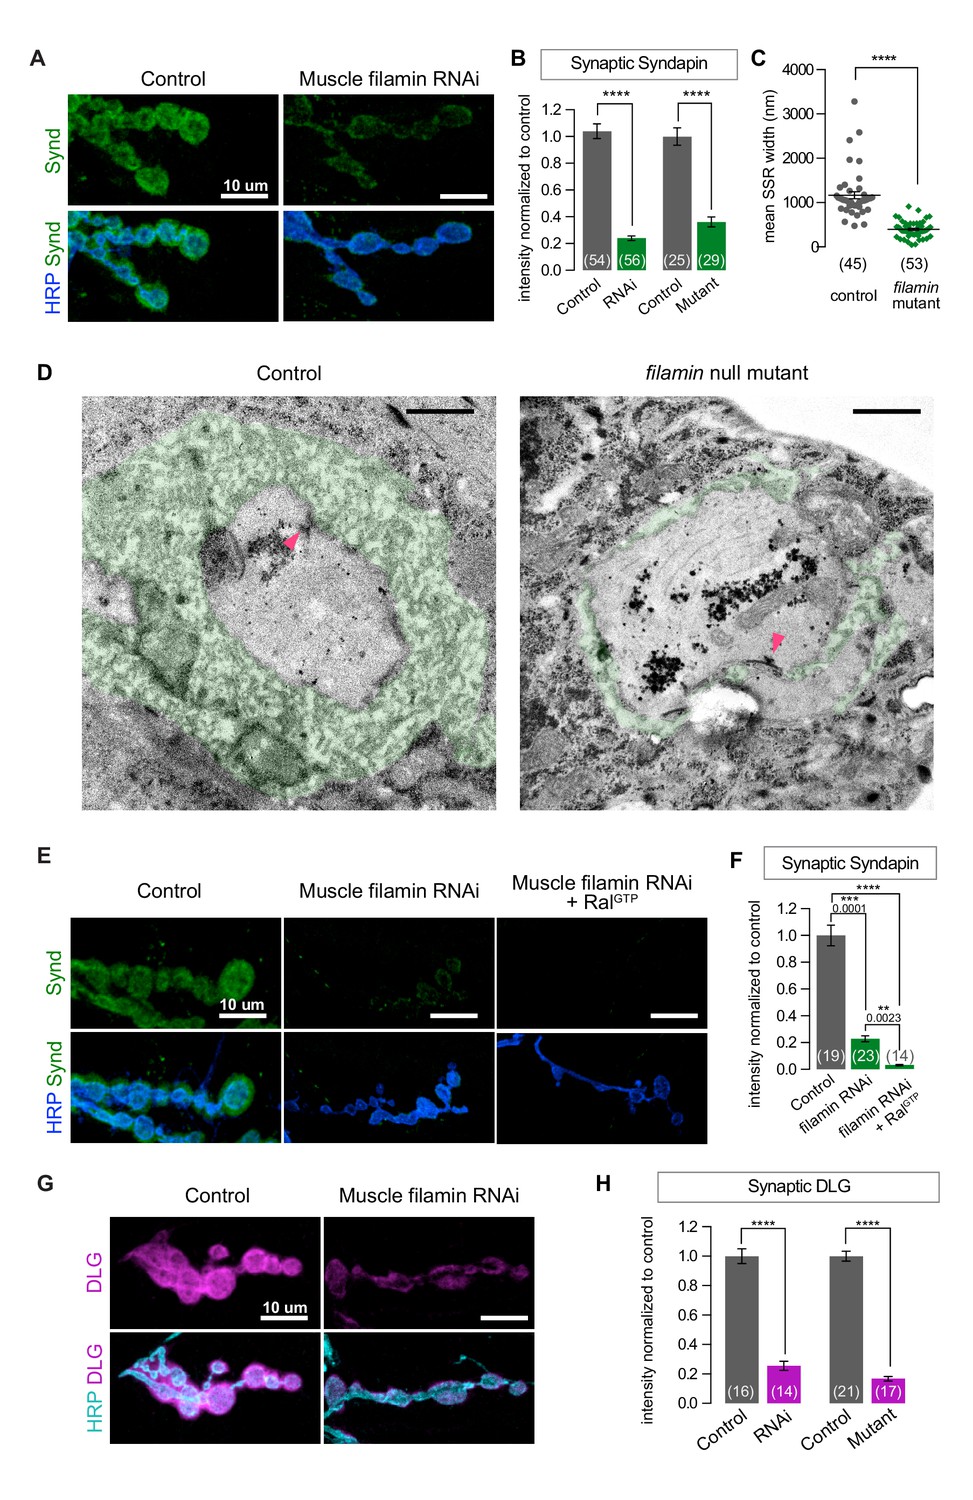
SSR formation depends on filamin.
(A) Confocal images of NMJs immunostained for Syndapin, an SSR marker, at NMJs of a control (G14-Gal4/+) larva and one with muscle-specific knockdown of filamin (G14-Gal4/+;UAS-filamin RNAi/+). (B) Quantification of Syndapin immunofluorescence intensities in the following genotypes: G14-Gal4/+ (RNAi control), G14-Gal4/+;UAS-filamin RNAi/+ (RNAi), cherΔ12.1/+ (control for mutant), cherΔ12.1/cherQ1415sd (mutant). (C,D) Quantification of SSR width and representative electron micrographs in control (cherΔ12.1/+) and filamin mutant (cherΔ12.1/cherQ1415sd). Micrographs show cross-sections of individual boutons and their surrounding SSR, which has been highlighted in green. Note the complex intertwining in control muscles of electron-dense muscle cytoplasm and translucent extracellular space that characterizes the SSR. Arrowheads indicate active zones, with characteristic T-bars. (E,F) Confocal images and quantification of Syndapin immunoreactivity at the NMJ for controls (G14-Gal4/+;+/+) and larvae with muscle-specific filamin knockdown with and without co-expression of RalGTP (G14-Gal4/+;UAS-filamin RNAi and G14-Gal4/+;UAS-filamin RNAi/UAS-RalGTP). (G) Confocal images of Discs-Large (DLG) immunofluorescence at NMJs of controls (G14-Gal4/+;+/+) and larvae with muscle-specific filamin knockdown (G14-Gal4/+;UAS-filamin RNAi). (H) Quantification of mean synaptic DLG immunofluorescence for the genotypes as in (B). Scale bar in (A), (E), and (G): 10 μm; in (D): 1 μm. Number of NMJs quantified is indicated in each graph except (C), where n= number of individual boutons. For all quantifications except in (F), two-tailed unpaired t test was performed for statistical significance. Multiple comparisons in (F) were performed using Kruskal-Wallis test with Dunn’s multiple comparisons test. ****p<0.0001; other p values are indicated on each graph. Error bars indicate ± SEM.
Figure 2—figure supplement 1
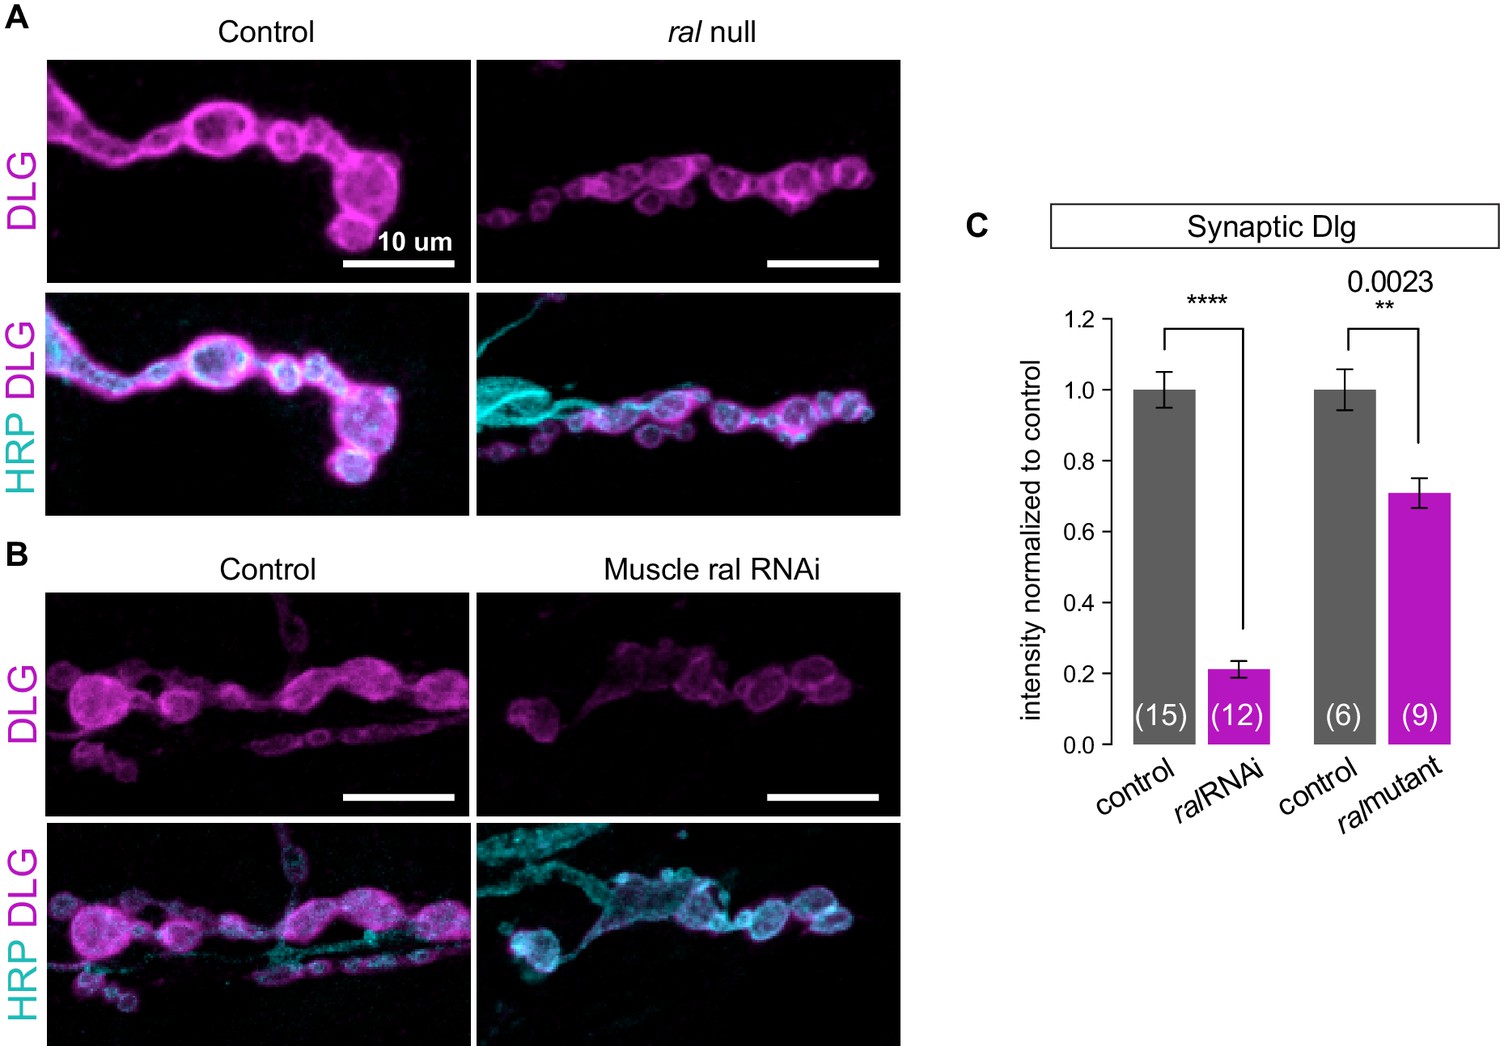
Synaptic DLG localization requires muscle expression of Ral.
(A, B) Representative confocal images of NMJs at muscle 6/7, immunostained for Discs-Large (DLG), a postsynaptic scaffold protein, and anti-HRP to label presynaptic membranes. (A) Control (+/y) versus ral null larva (ralG0501/y). (B) Control larva (G14-Gal4/+;+/+) versus larva with muscle-specific knockdown of ral (G14-Gal4/+;UAS-ral RNAi). Images are shown as z-stacks with maximum-intensity projection. Scale bar: 10 μm. (C) Quantification of mean synaptic DLG immunofluorescence, with background subtraction and normalized to control, at the indicated genotypes. The genetic null phenotype appears to be less potent likely due to the maternal mRNA that persists, which is not the case for RNAi-mediated knockdown. Representative images for each experiment reflect the mean values across NMJs examined. Number of NMJs quantified is indicated in each graph. Statistical significance was determined using two-tailed unpaired t test, ****p<0.0001; other p values indicated on graph. All error bars indicate ± SEM.
Figure 3 with 1 supplement

The short FLN90 isoform recruits Ral and promotes SSR formation.
(A) Confocal images of Syndapin immunoreactivity in the genotypes cherΔ12.1/+ (control), cherΔ12.1/cherQ1415sd (cherQ1415sd), and cherΔ12.1/cher1 (cher1). (B) Anti-HA immunoreactivity in the genotypes UAS-HA-Ral/G14-Gal4; cherΔ12.1/+ (control), UAS-HA-Ral/G14-Gal4; cherΔ12.1/cherQ1415sd (cherQ1415sd), and UAS-HA-Ral/G14-Gal4; cherΔ12.1/cher1 (cher1). (C) Quantification of mean synaptic Syndapin and HA-Ral immunofluorescence for the genotypes in (A,B). Quantification of HA-Ral is given for NMJs on muscle 4 and muscles 6/7. (D) Domain organization of the two filamin isoforms. The FLN90 isoform consists of the C-terminal region of the FLN240 isoform. The location of the actin-binding domain (ABD) is shown and positions of Ig domains are numbered. Also indicated are the antigens for the two filamin antibodies used in this study. (E) Western blots of third-instar larval lysates probed with the FLN-C antibody. FLN240 and FLN90 (which appears as a doublet) are both present in control heterozygous larvae. In cherQ1415sd (cherΔ12.1/cherQ1415sd) both isoforms are almost undetectable; in cher1 (cherΔ12.1/cher1) the short isoform remains. Tubulin immunoreactivity is shown as a loading control. (F) Syndapin immunoreactivity in the genotypes G14-Gal4/+;cherQ1415sd/+ (control), G14-Gal4/+;cherQ1415sd/cherΔ12.1 (cherQ1415sd), and G14-Gal4/UAS-HA-FLN90;cherQ1415sd/cherΔ12.1 (rescue). (G) Quantification of mean synaptic Syndapin immunofluorescence for the genotypes (F). Scale bars: 10 um. Number of NMJs quantified is indicated in each graph. Multiple comparisons in (C) and (G) performed using Kruskal-Wallis test with Dunn’s multiple comparisons test. ****p<0.0001; other p values are indicated. Error bars indicate ± SEM.
Figure 3—figure supplement 1
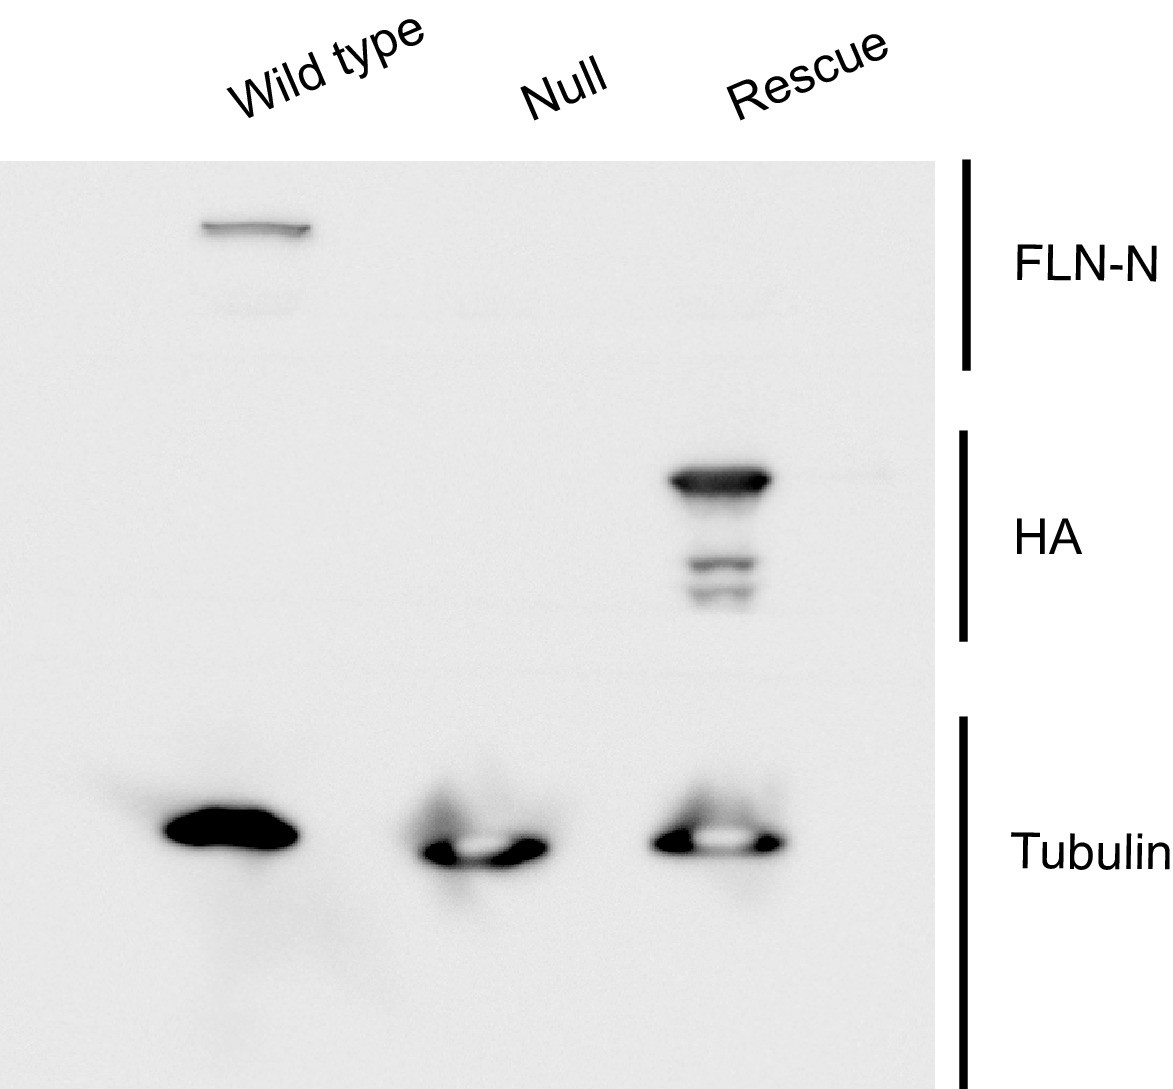
Evidence confirming selective rescue of the short FLN90 isoform.
Western blots of third-instar larval lysates probed with the FLN-N antibody, which is directed to the N terminus of filamin and thereby selectively labels the long (FLN240) isoform. FLN240 is detected in wild type (G14-Gal4/+;cherQ1415sd/+) larvae but not with the filamin null (G14-Gal4/+;cherQ1415sd/cherΔ12.1 or the FLN90 rescue genotype (G14-Gal4/UAS-HA-FLN90;cherQ1415sd/cherΔ12.1). Conversely, the FLN90 rescue genotype selectively expresses the 90 kDa rescue construct (UAS-HA-FLN90) and is sufficient to rescue SSR growth (See Figure 3F and G). Tubulin immunoreactivity is shown as a loading control.
Figure 4 with 1 supplement
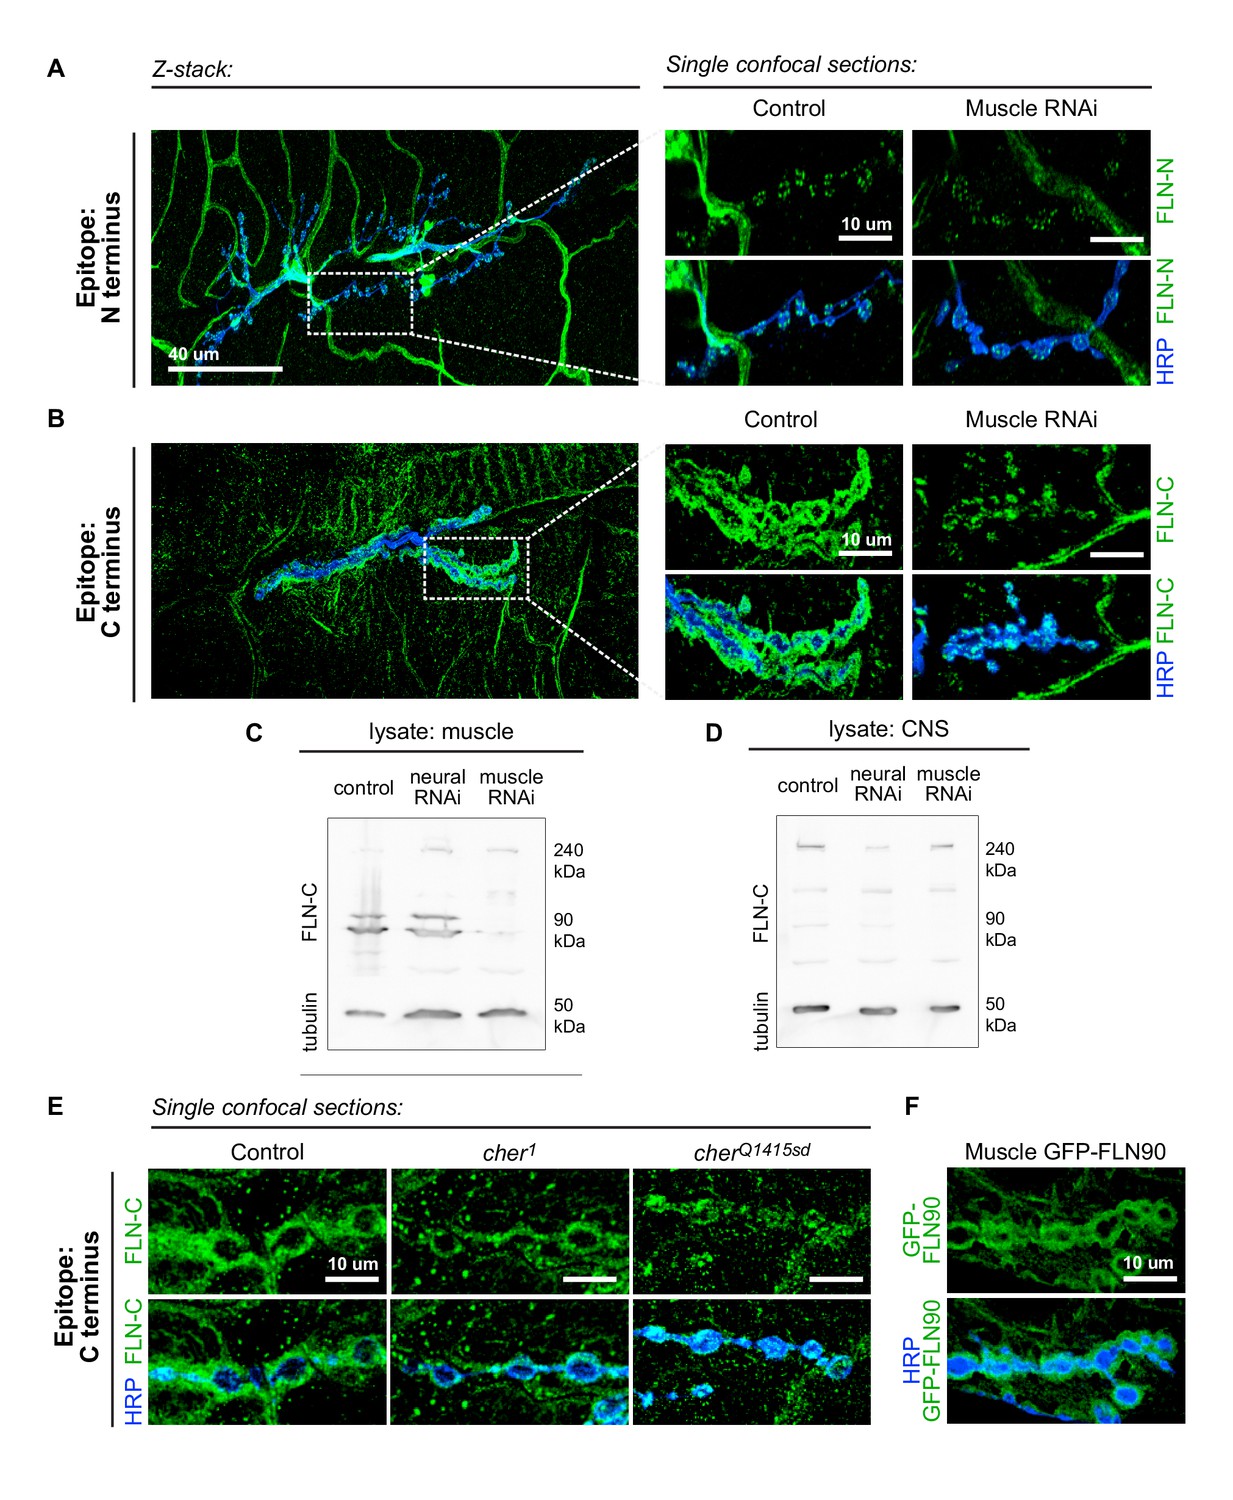
The short isoform of filamin localizes to the subsynaptic region.
(A) Left: a low-magnification, z-stack confocal image of a wildtype NMJ immunostained with FLN-N to detect FLN240 reveals immunostaining in trachea, glia, and nerves. Right: a single 0.4 μm confocal section of individual boutons from the boxed region. (B) Images, as in (A) of an NMJ immunostained with FLN-C to detect both FLN240 and FLN290. Muscle-specific filamin knockdown (G14-Gal4/+;UAS-filamin RNAi/+) abolished the immunoreactivity surrounding the boutons in the control (G14-Gal4/+;+/+). (C and D) Western blots of third-instar larval body walls (C) and CNS (D) immunoprobed with FLN-C. Muscles were enriched in FLN90, while the CNS preferentially expressed FLN240. Filamin RNAi was driven by G14-Gal4 (muscle) or C155-Gal4 (neural). Tubulin was used as a loading control. (E) Single 0.4 μm confocal sections immunostained for both filamin isoforms with FLN-C. Postsynaptic staining was preserved in control (cherΔ12.1/+) and cher1 (cherΔ12.1/ cher1), but not in the cherQ1415sd mutant (cherΔ12.1/cherQ1415sd). (F) Confocal images of NMJs immunostained for GFP-FLN90 expressed in the muscle (UAS-GFP-FLN90/+;MHCGS/+). The distribution recapitulates that of endogenous filamin detected by FLN-C. For all images, scale bar: 10 μm.
Figure 4—figure supplement 1
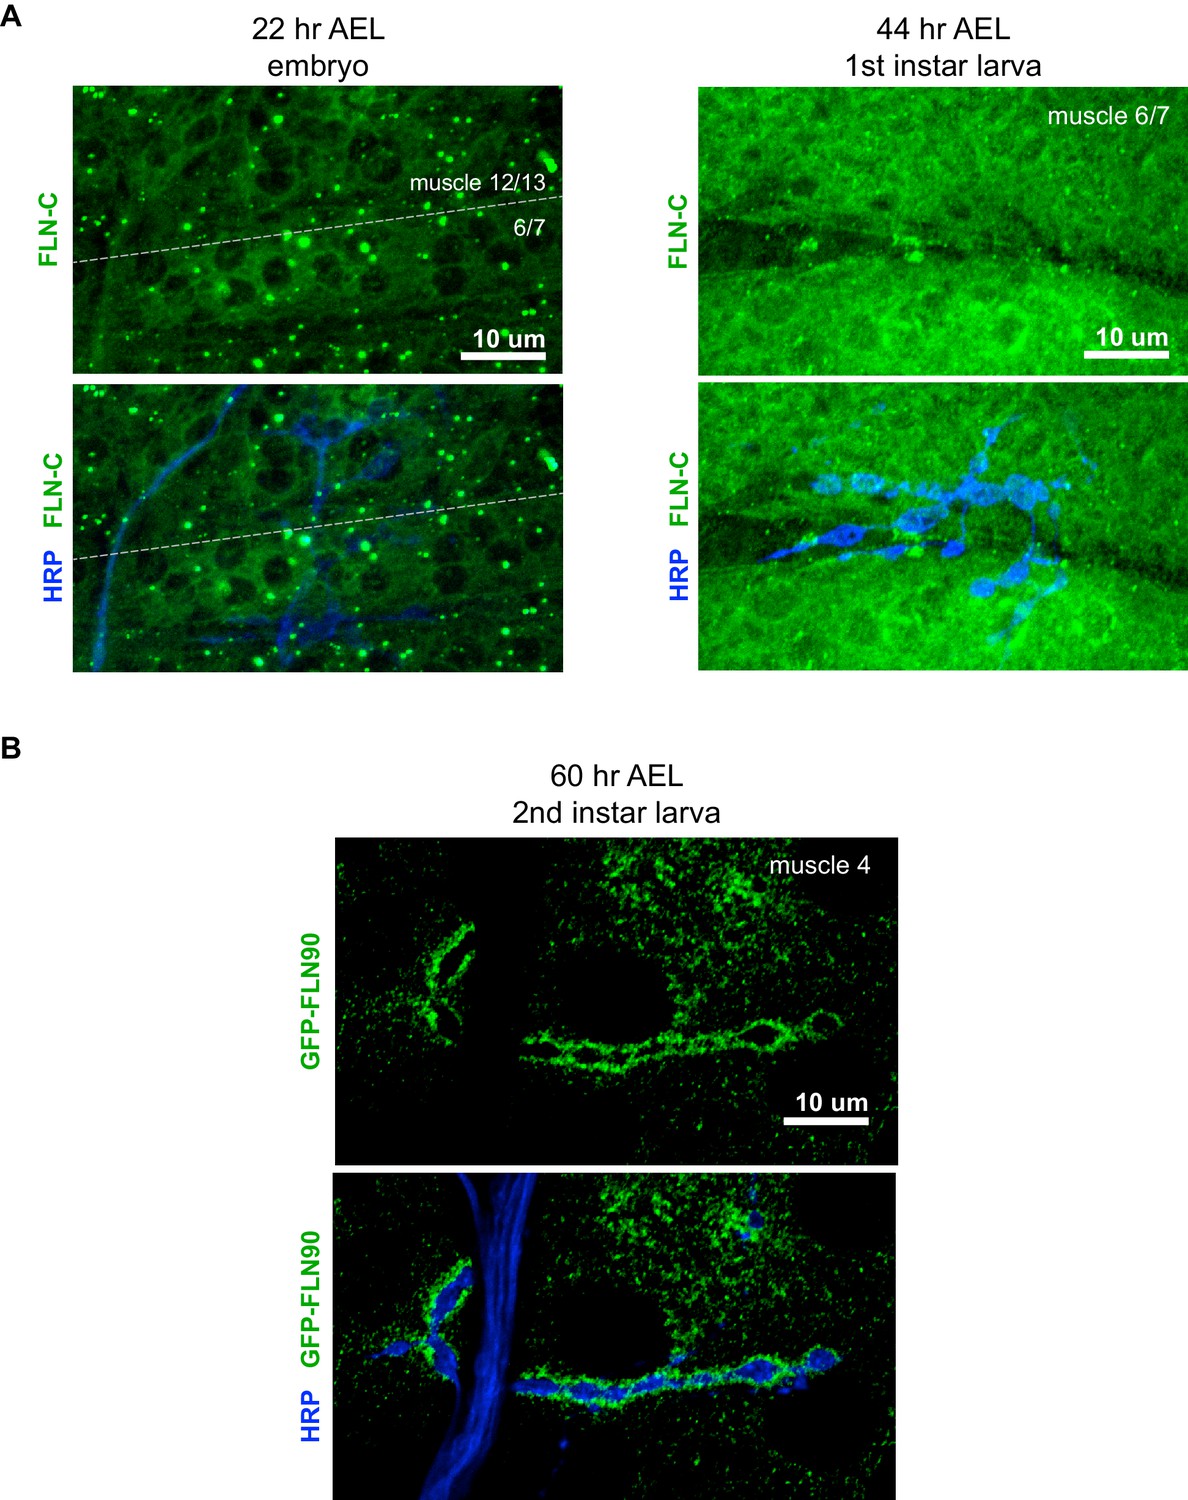
Filamin expression during NMJ development.
(A) Confocal z-stack images of FLN-C immunoreactivity at the NMJ at early stages of synapse development as indicated; AEL = after egg laying. (B) Confocal z-stack images of second-instar NMJs immunostained for GFP-FLN90 expressed in the muscle (UAS-GFP-FLN90/+;MHCGS/+). Scale bars: 10 μm.
Figure 5
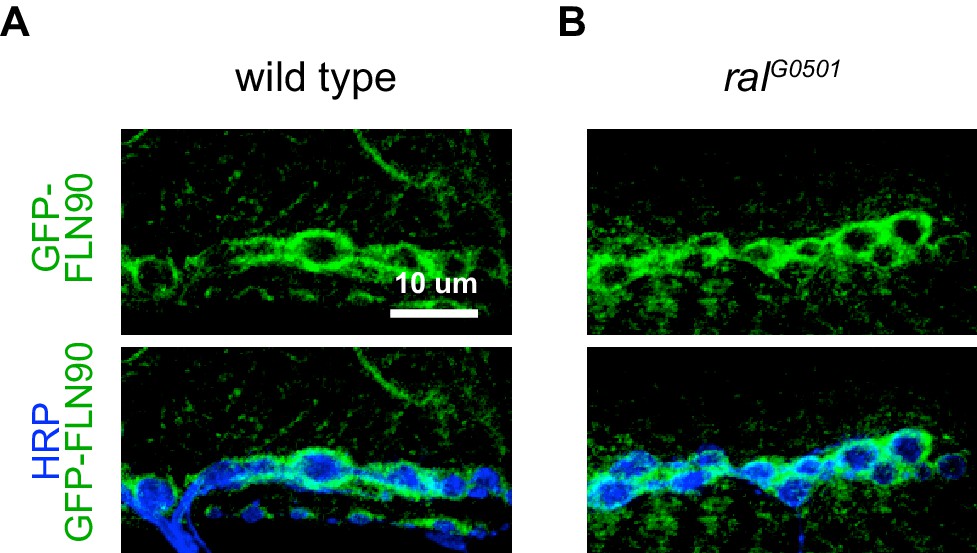
FLN90 localizes subsynaptically even in the absence of SSR formation.
(A,B) Confocal, z-stack images of third-instar NMJs immunostained for GFP-FLN90 expressed in the muscle in (A) wild-type (UAS-GFP-FLN90/+;MHCGS/+) and (B) Ral null (RalG0501/y; UAS-GFP-FLN90/+;MHCGS/+) larvae which lack SSR. Scale bars: 10 μm.
Figure 6 with 1 supplement
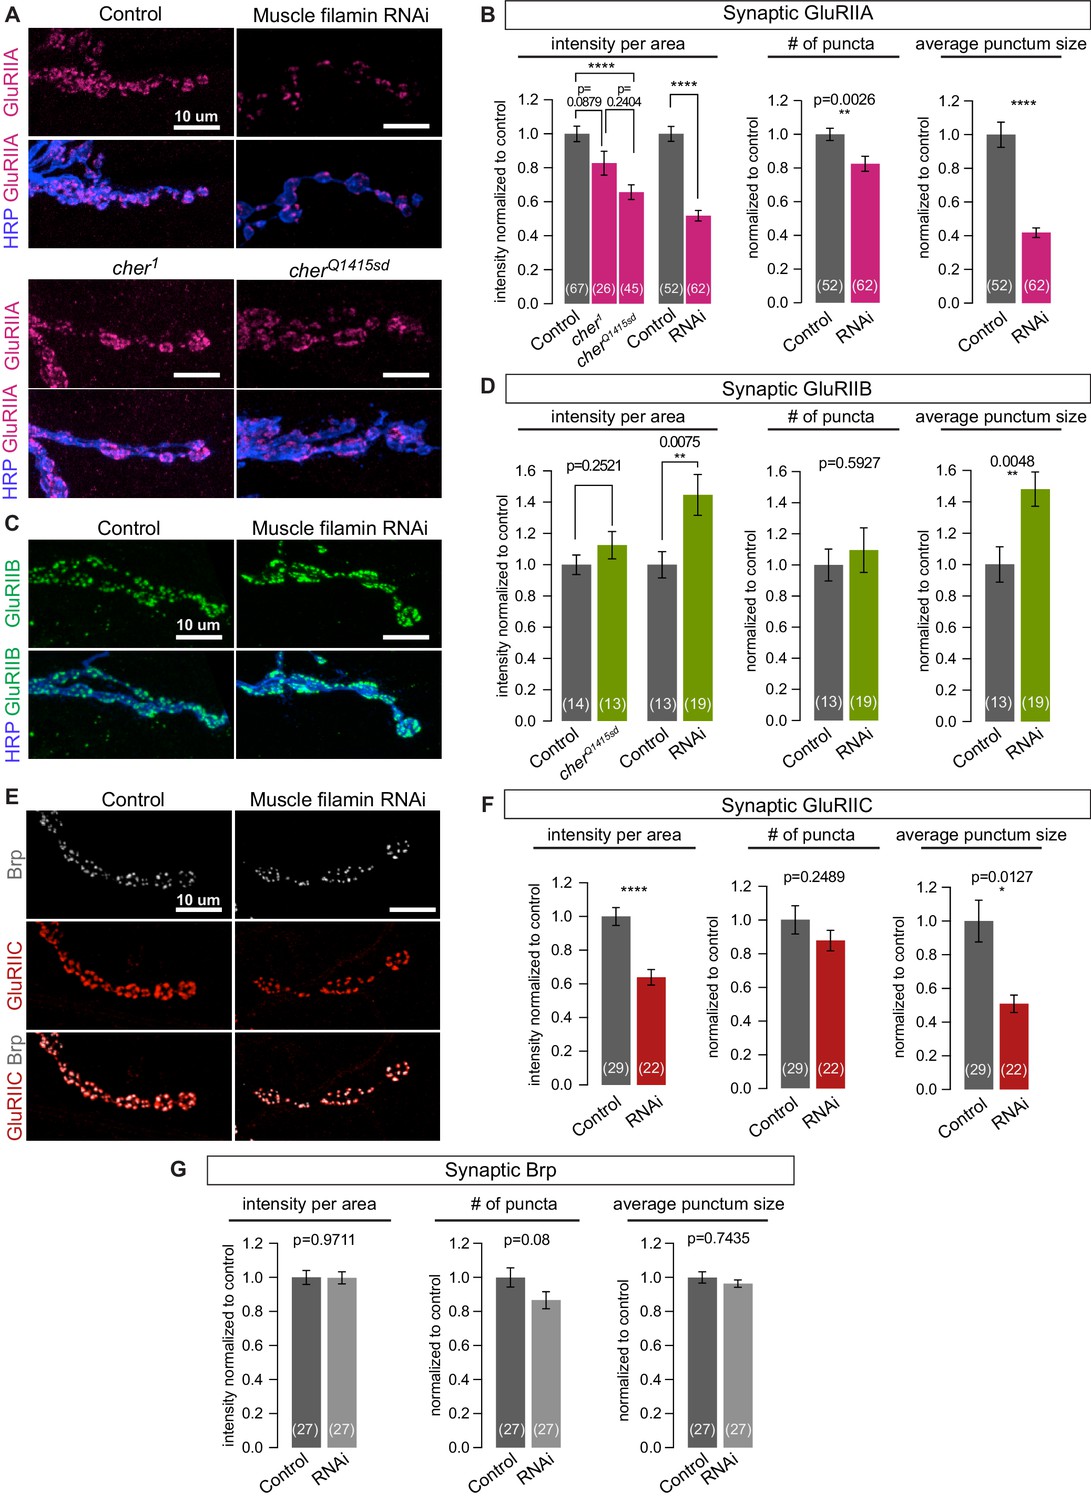
Filamin is required for localizing type-A, but not type-B, glutamate receptors.
(A,B) Confocal images and quantification of NMJs immunostained for GluRIIA in control larvae (G14-Gal4/+;+/+), with muscle-specific knockdown of filamin (G14-Gal4/+;UAS-filamin RNAi), and in cher mutants (cherΔ12.1/cher1 and cherΔ12.1/cherQ1415sd). (C,D) Confocal images and quantification of NMJs immunostained for GluRIIB. Genotypes as in (A). (E) Confocal images of NMJs at muscle 6/7, showing the apposition of releases sites (Bruchpilot/Brp immunoreactivity) and GluRIIC, the pan-GluR subunit, at NMJs of control (G14-Gal4/+) animals versus animals with muscle-specific knockdown against filamin (G14-Gal4/+;UAS-filamin RNAi). (F) Quantification of synaptic GluRIIC levels at the indicated genotypes from (E). (G) Quantification of synaptic Brp levels and distribution parameters at the indicated genotypes from (E). Scale bars: 10 um. Number of NMJs quantified is indicated in each bar. Statistical significance was determined with two-tailed unpaired t test except for: (1) in (B), the comparison of intensities of mutant lines used the Kruskal-Wallis test with Dunn’s multiple comparisons test; and (2) the Kolmogorov-Smirnov test was used for nonparametric analysis of data with non- normal distributions: in (B), GluRIIA number of puncta and average punctum size; in (F), GluRIIC average punctum size; in (G), Brp average punctum size. ****p<0.0001; other p values indicated on each graph; all error bars indicate ± SEM.
Figure 6—figure supplement 1
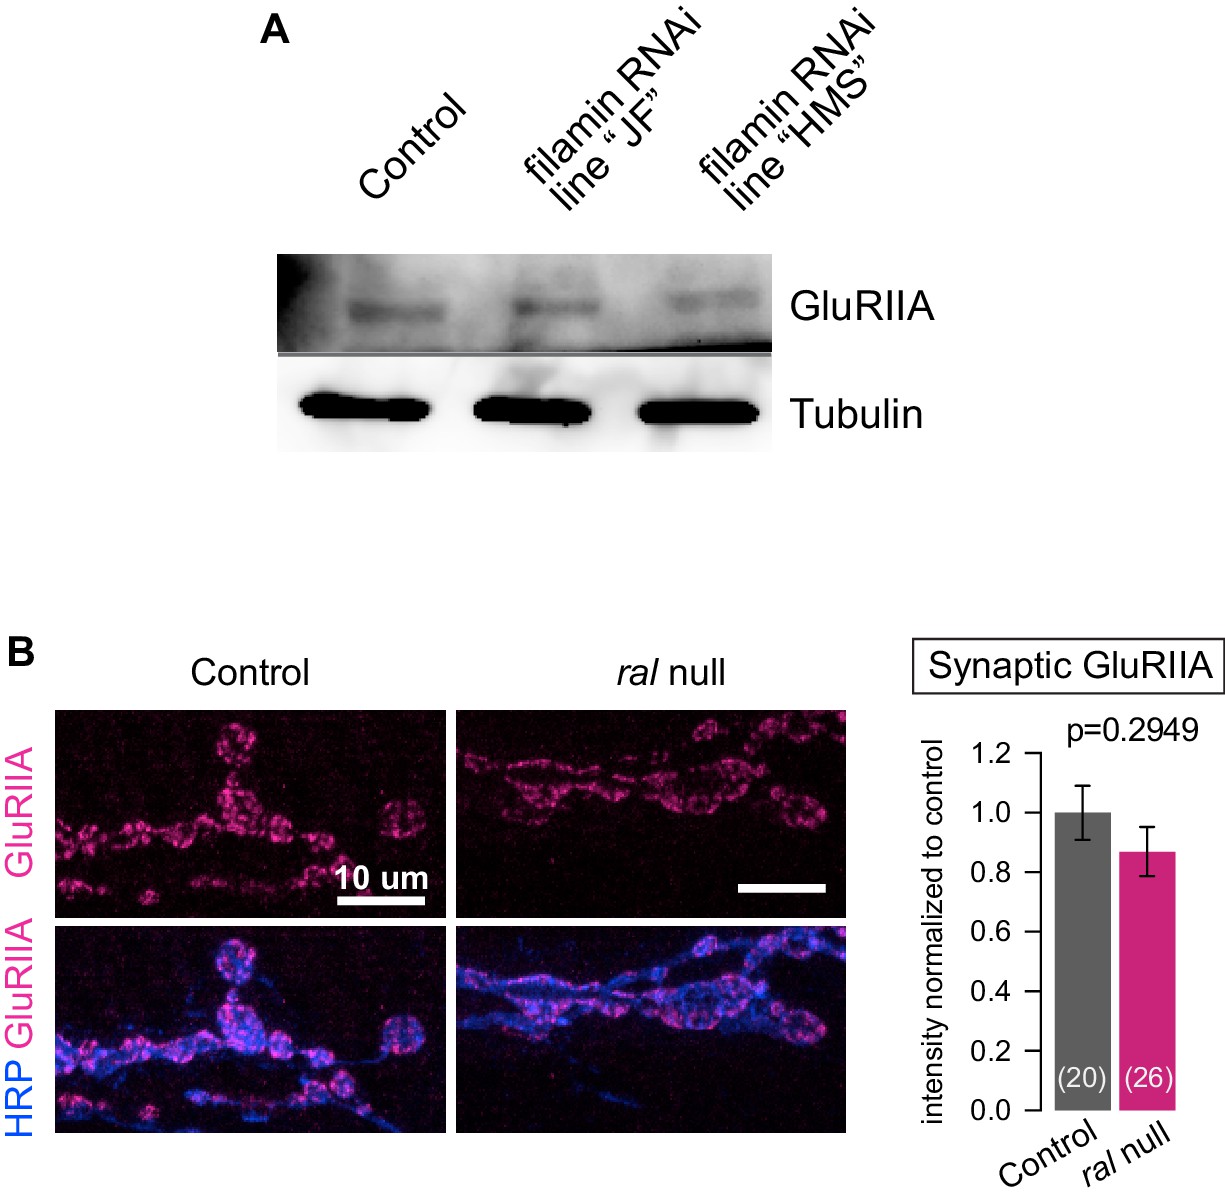
Additional analysis of the effects of filamin loss on GluRs.
(A) Western blot analysis for GluRIIA expression in third-instar larval lysates, in control larvae (G14-Gal4/+;+/+) and in larvae expressing two independent lines of RNAi against filamin in muscles (G14-Gal4/UAS-Cher RNAi JF; +/+ and G14-Gal4/+;UAS-Cher RNAi HMS/+). ‘filamin RNAi HMS’ is the line consistently used for all RNAi experiments in this study. ‘filamin RNAi JF’ is another RNAi line that effectively knocks down filamin expression. GluRIIA levels are similar across the genotypes. Tubulin immunoreactivity is shown as a loading control. (B) Representative confocal images and quantification GluRIIA immunofluorescence of NMJs at muscle 6/7, immunostained with anti-GluRIIA and anti-HRP, in control (ralG0501/+) and ral null animals (ralG0501/y). For quantification background was subtracted and values were normalized to control. Representative images for each experiment reflect the mean values across NMJs examined. Images are shown as z-stacks with maximum-intensity projection. p values indicated on each graph. All error bars indicate ± SEM.
Figure 7

Electrophysiological properties of NMJs lacking muscle filamin.
(A,B) Representative mEPSP traces from muscles of control larvae (G14-Gal4/+;+/+) and larvae with filamin knockdown (G14-Gal4/+;UAS-filamin RNAi) and quantification of average mEPSP frequency and amplitude in those genotypes. Y-axis scale bar: 1 mV; x-axis scale bar: 1s. (C,D) Representative EPSP traces from the genotypes in A and quantification of average EPSP amplitude and area under the curve. Y-axis scale bar: 4 mV; x-axis scale bar: 100 ms. Number of NMJs quantified is indicated in each graph. For (B) and (D), statistical significance was determined from Kolmogorov-Smirnov test for nonparametric analysis except for the mEPSP amplitude, whose data showed a normal distribution and two-tailed unpaired t test was used. p values indicated on each graph. All error bars indicate ± SEM.
Figure 8
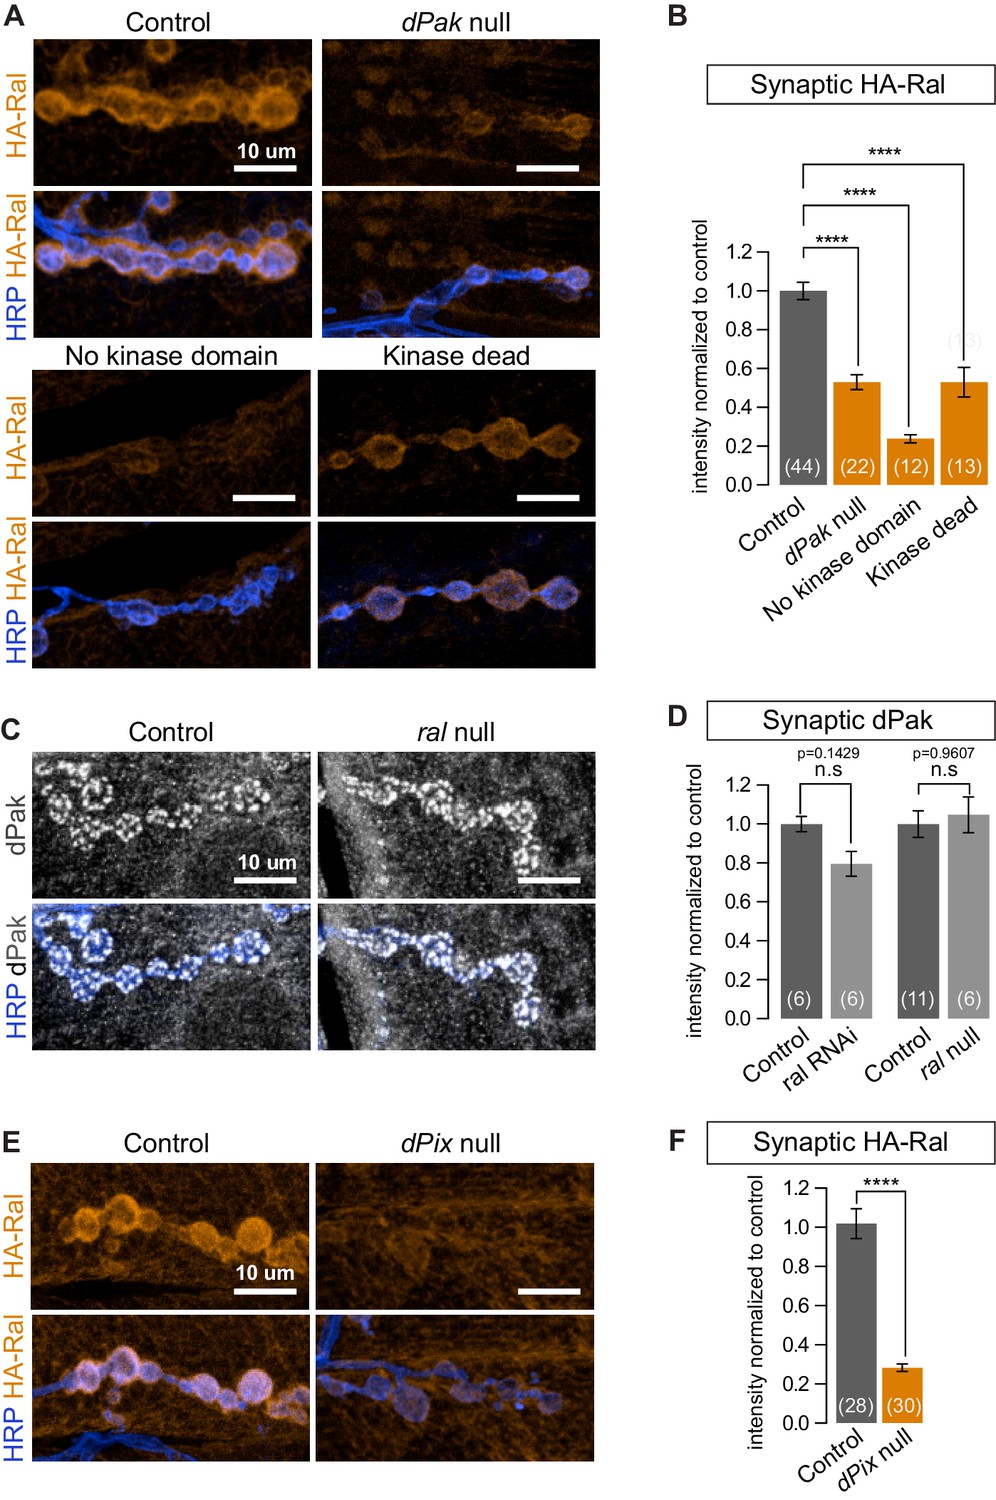
dPak and its kinase activity are required for localizing Ral.
(A,B) Confocal images and quantification of subsynaptic HA-Ral at NMJ of the genotypes: control (UAS-HA-Ral/G14-Gal4;dPak11/+), dPak null (UAS-HA-Ral/G14-Gal4;dPak11/dPak6), no kinase domain (UAS-HA-Ral/G14-Gal4; dPak11/dPak21), and kinase dead (UAS-HA-Ral/G14-Gal4; dPak11/dpak3). (C,D) Confocal images and quantification of dPak immunoreactivity in control (ralG0501/+) and ral null larvae (ralG0501/y) and (in D) also upon knockdown of Ral (G14-Gal4/+;+/+ and G14-Gal4/+;UAS-ral RNAi). (E,F) Confocal images and quantification of subsynaptic HA-Ral at NMJs of control (dPixP1036/+;UAS-HA-Ral/MHCGS) and dPix null larvae (dPixP1036/dPix1;UAS-HA-Ral/MHCGS). Scale bars: 10 μm. Number of NMJs quantified is indicated in each graph. For (D), statistical significance determined with Kolmogorov-Smirnov test; for (F), two-tailed unpaired t test; and for (B), multiple comparisons were performed using Kruskal-Wallis test with Dunn’s multiple comparisons test. ****p<0.0001; other p values are indicated on each graph; ‘n.s’ = not significant. All error bars indicate ± SEM.
Figure 9 with 1 supplement

Filamin is required for localizing dPak and its activator Rac1.
(A,B) Confocal images and quantification of dPak immunoreactivity in control NMJs (G14-Gal4/+;+/+) and with muscle-specific knockdown of filamin (G14-Gal4/+;UAS-filamin RNAi). (C,D) Representative single 0.4 μm confocal sections and quantification of FLN-C immunoreactivity at control NMJs (G14-Gal4/+;+/+) and with muscle-specific knockdown of dPak (G14-Gal4/+;UAS-dPak RNAi/+). (E,F) Confocal images and quantification of NMJs immunostained for GFP-Rac1 expressed under control by the endogenous Rac1 promoter in control larvae (G14-Gal4/Rac::GFP-Rac;+/+) and with muscle-specific knockdown of filamin (G14-Gal4/Rac::GFP-Rac;UAS-filamin RNAi). Scale bars: 10 um. Number of NMJs quantified is indicated in each graph. Statistical significance determined with two-tailed unpaired t test. ****p<0.0001; other p values are indicated on each graph. All error bars indicate ± SEM. (G) In-situ PLA (Proximity Ligation Assay) detection of Drosophila GFP-FLN90 and V5-dPak (left) and GFP and V5-dPak (right, as negative control) expressed in HEK293T cells. Immunoreactivities are shown for GFP (blue) to identify transfected cells and PLA-positive signal (gray).
Figure 9—figure supplement 1
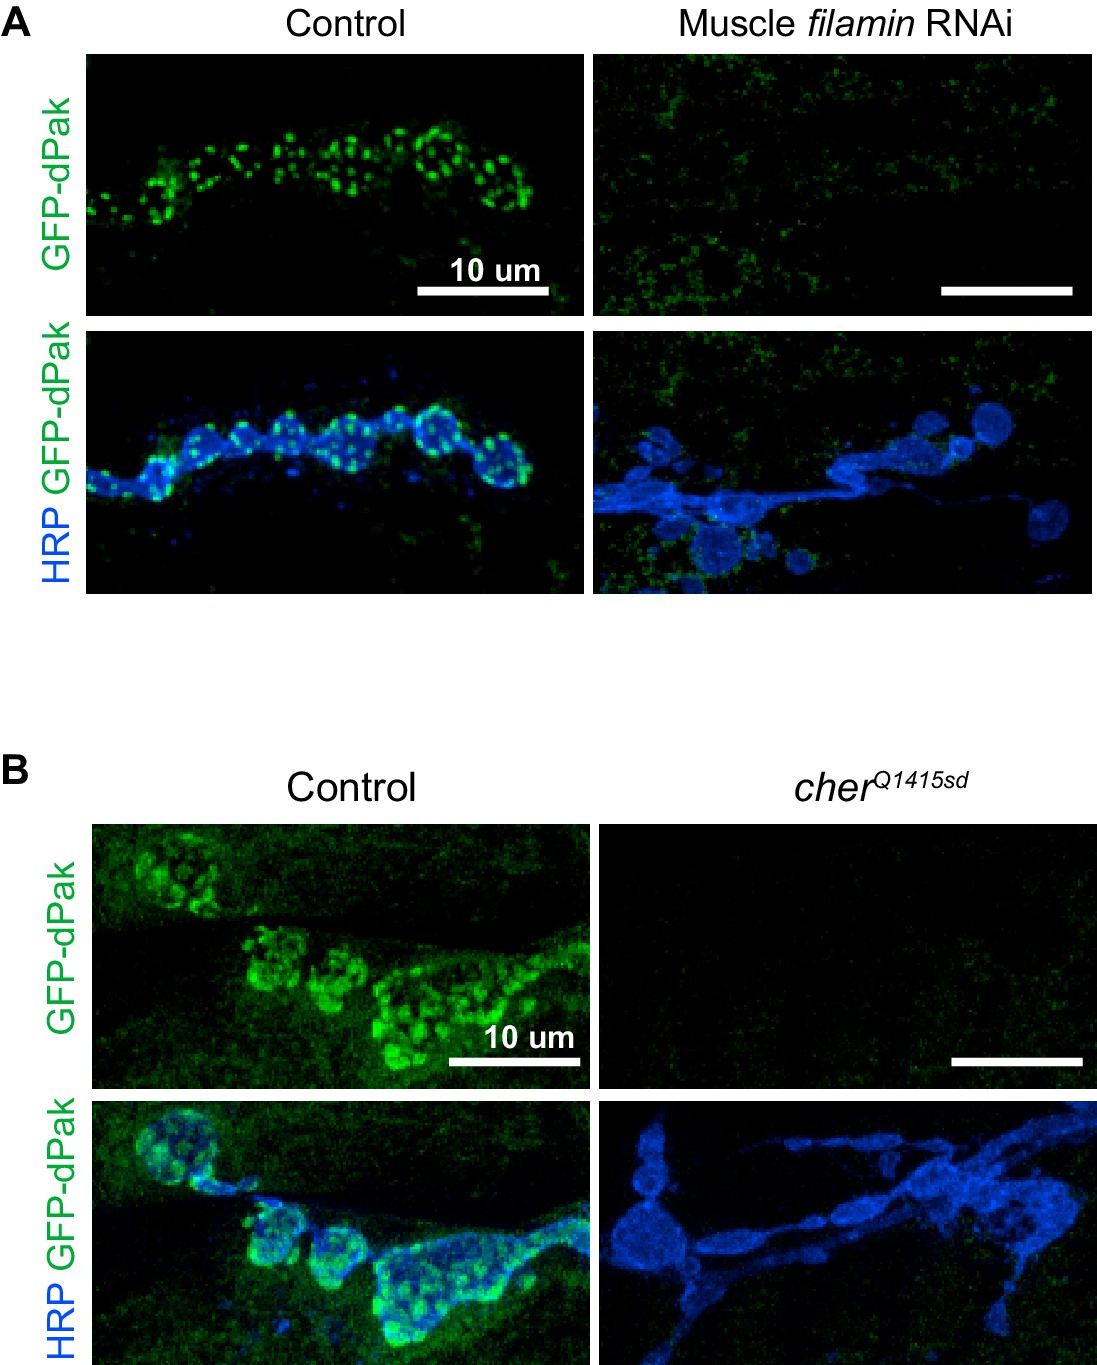
Loss of filamin disrupts synaptic targeting of GFP-dPak.
(A) Representative confocal images of NMJs at muscle 6/7, immunostained for GFP-dPak in control larvae (G14-Gal4/UAS-GFP-dPak;+/+) and larvae co-expressing RNAi against filamin (G14-Gal4/UAS-GFP-dPak;UAS-filamin RNAi/+). (B) Representative confocal images of NMJs immunostained for GFP-dPak expressed in the postsynaptic muscles in control (UAS-GFP-dPak/G14-Gal4;cherΔ12.1/+) and filamin null larvae (UAS-GFP-dPak/G14-Gal4; cherΔ12.1/cherQ1415sd). For both (A) and (B), the high variability of background GFP fluorescence precluded reliable quantification. Images are shown as z-stacks with maximum-intensity projection. Scale bar: 10 μm.
Figure 10
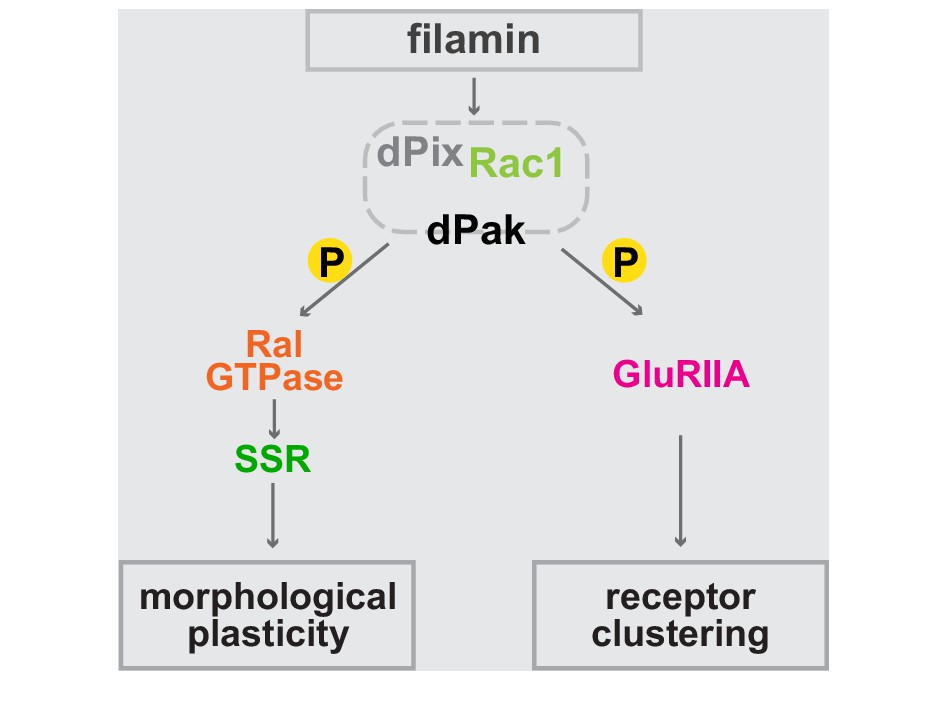
Bifurcated filamin-dependent pathways for SSR growth and receptor localization.
The epistatic relationships of proteins required for SSR growth and GluRIIA localization at the synapses are diagrammed. Filamin is required to localize dPak to the synapse and dPak is required for Ral localization, without which exocyst- and activity-dependent growth of the SSR cannot occur. Independently of Ral, dPak localization is also needed for GluRIIA to cluster at the postsynaptic density which is otherwise composed only of type-B receptors. In both branches of the pathway, dPak acts as a kinase and with its associated partners Pix and Rac1.
Download links
A two-part list of links to download the article, or parts of the article, in various formats.
Downloads (link to download the article as PDF)
Open citations (links to open the citations from this article in various online reference manager services)
Cite this article (links to download the citations from this article in formats compatible with various reference manager tools)
Filamin, a synaptic organizer in Drosophila, determines glutamate receptor composition and membrane growth
eLife 5:e19991.
https://doi.org/10.7554/eLife.19991


