A widely employed germ cell marker is an ancient disordered protein with reproductive functions in diverse eukaryotes
- Whitehead Institute, United States
- University of Massachusetts Medical School, United States
- Howard Hughes Medical Institute, United States
- Children's Hospital Oakland, United States
- Massachusetts Institute of Technology, United States
- University of Kansas Medical Center, United States
- University of South Florida, United States
Figures
Figure 1 with 2 supplements
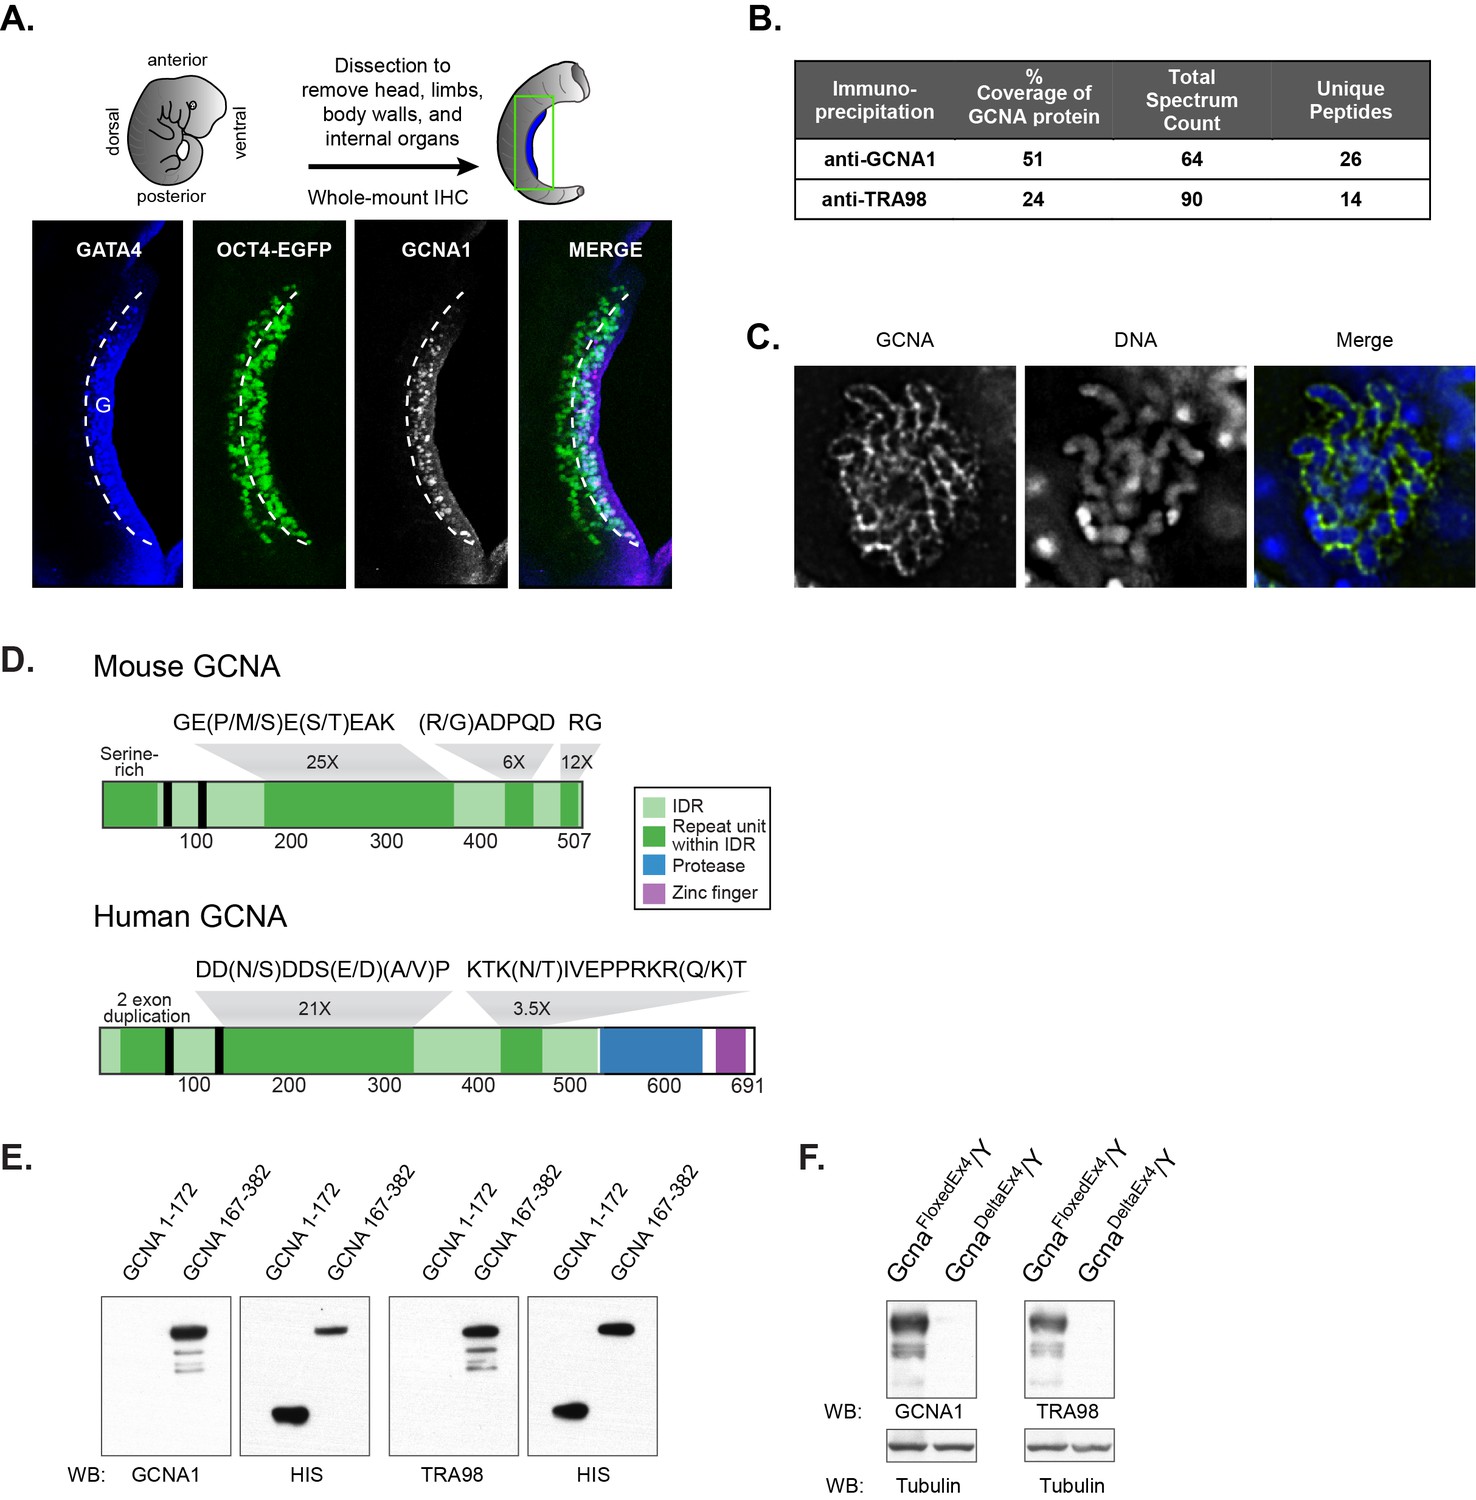
Identification of the antigen recognized by GCNA1 and TRA98 antibodies.
(A) Schematic illustration depicting isolation of a mouse embryonic day 11.5 gonad. GCNA (white, pink in merge) is specifically expressed by germ cells (green) only after they enter the somatic gonad (G), which is marked by its expression of GATA4 (blue). Dashed line indicates boundary of gonad. Oct4-EGFP transgene labels germ cells. (B) Mass spectrometry indicates that GCNA1 and TRA98 antibodies immunoprecipitate the same protein. (C) GCNA coats condensed chromosomes during meiotic prophase. One plane through a single nucleus of a male spermatocyte in the zygotene phase of Meiosis I is shown. (D) Mouse GCNA encodes an acidic and repetitive protein that is predicted to be disordered. Intrinsically disordered regions (IDRs) are depicted in green; repeating units of the indicated sequences are shown in dark green and non-repetitive disordered sequences are light green. Human GCNA shares a region with the same acidic and repetitive character (green) and contains additional, ordered domains – a protease domain (blue), and a C2C2 zinc finger (purple). SUMO-interacting motifs (SIMs) are indicated by black bars. (E) Bacterially expressed recombinant HIS-tagged mouse GCNA is recognized by both GCNA1 and TRA98 antibodies. The antigen is located within a protein fragment containing the murine-specific GE(P/M/S)E(S/T)EAK repeat. (F) Western blot of mouse XY embryonic stem cell lysate with a disruption in the identified locus demonstrates depletion of both GCNA1 and TRA98 antigens.
-
Figure 1—source data 1
Mass spectrometry data.
- https://doi.org/10.7554/eLife.19993.004
Figure 1—figure supplement 1
Characterization of mouse Gcna transcript and protein.
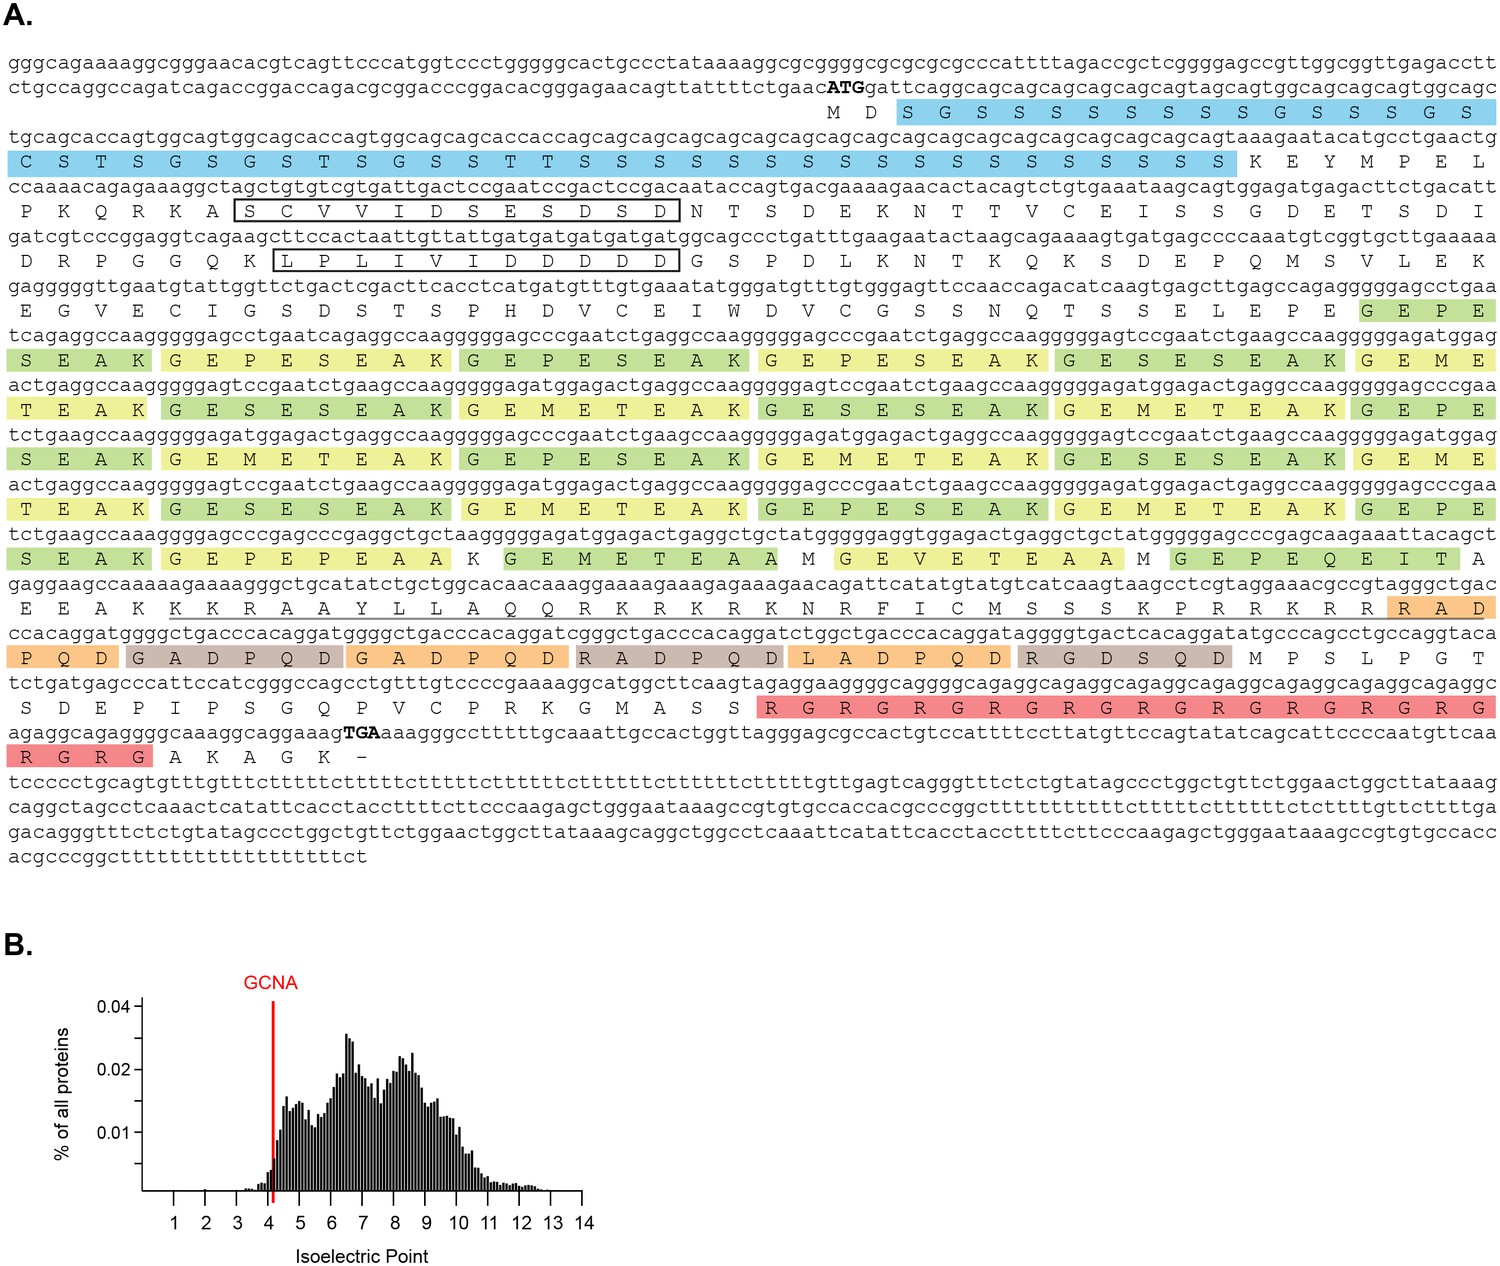
(A) Sequence of GCNA cDNA cloned from adult mouse testis. cDNA sequence and extent of UTRs confirmed by comparison with RNAseq data (Ramsköld et al., 2009). Internal tandem repeats are denoted by color blocks. Start and stop codons are capitalized. Predicted nuclear localization signal (NLS) is underlined. Predicted SUMO interacting motifs (SIMs) are boxed. (B) Comparison of the isoelectric point of mouse GCNA with those of all proteins in the mouse proteome (RefSeq).
Figure 1—figure supplement 2
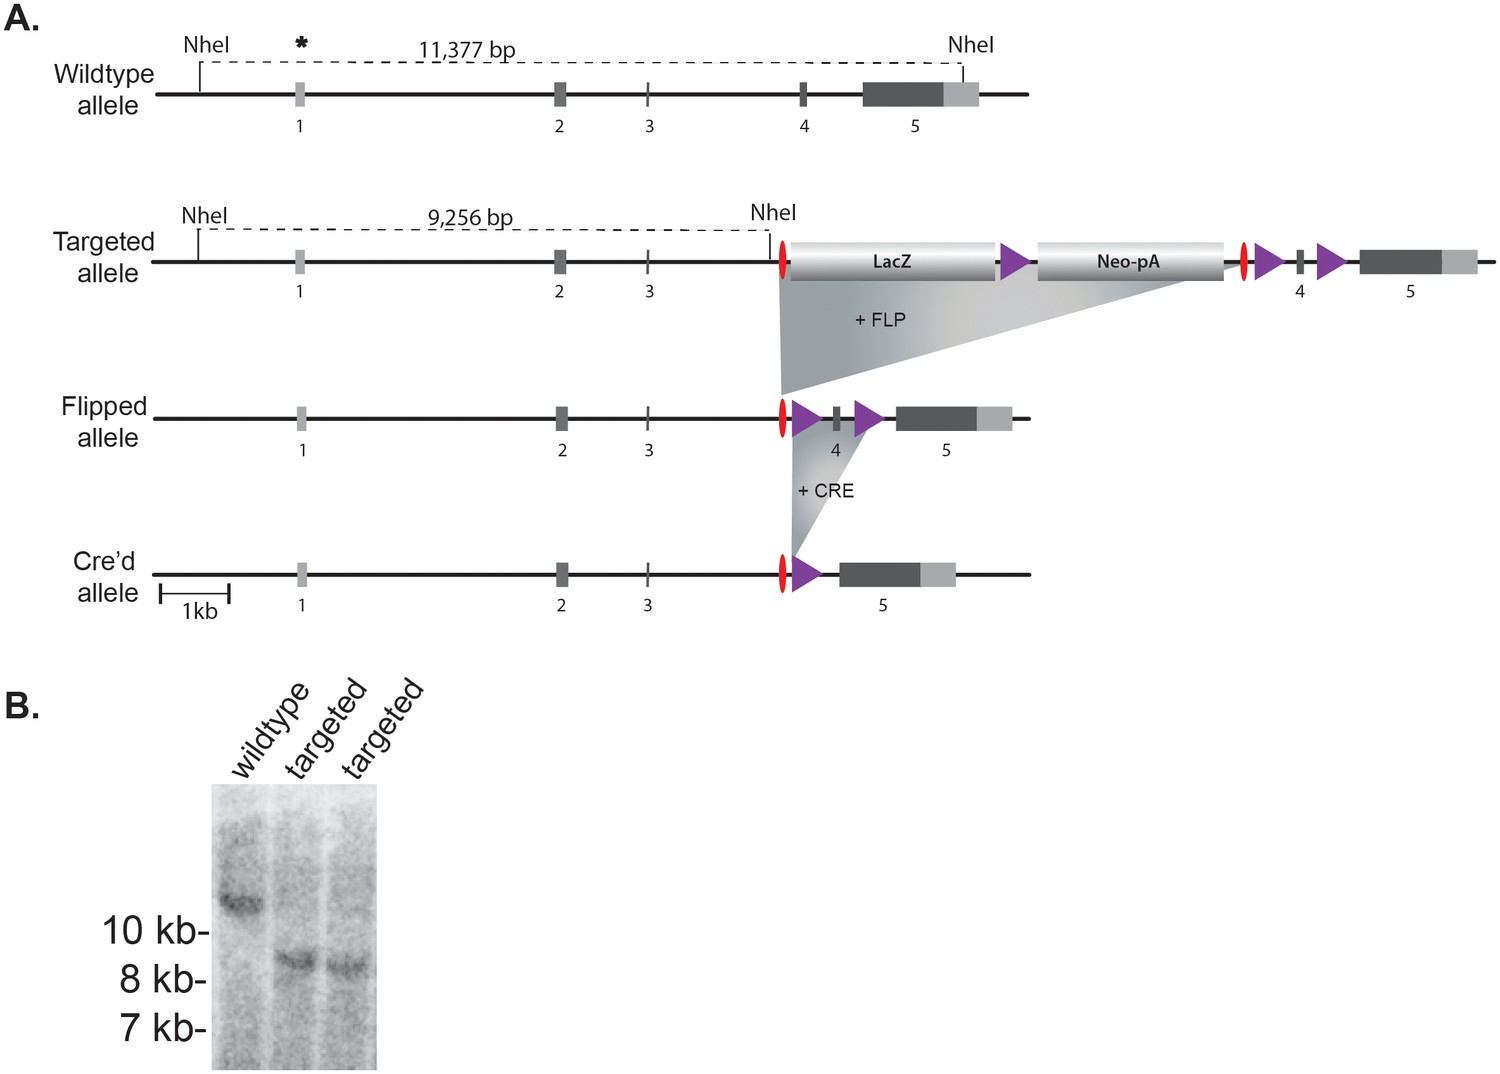
Generation of Gcna-targeted ES cells and mice.
(A) Mouse Gcna gene targeting strategy. Purple triangles are LoxP sites and red ovals are FRT recombination sites. Coding portions of exons are dark gray while UTRs are light gray. (B) Southern blot using probe indicated by asterisk after digesting genomic DNA with NheI. The probe and the 5’ NheI site are both outside of the homology arms.
Figure 2
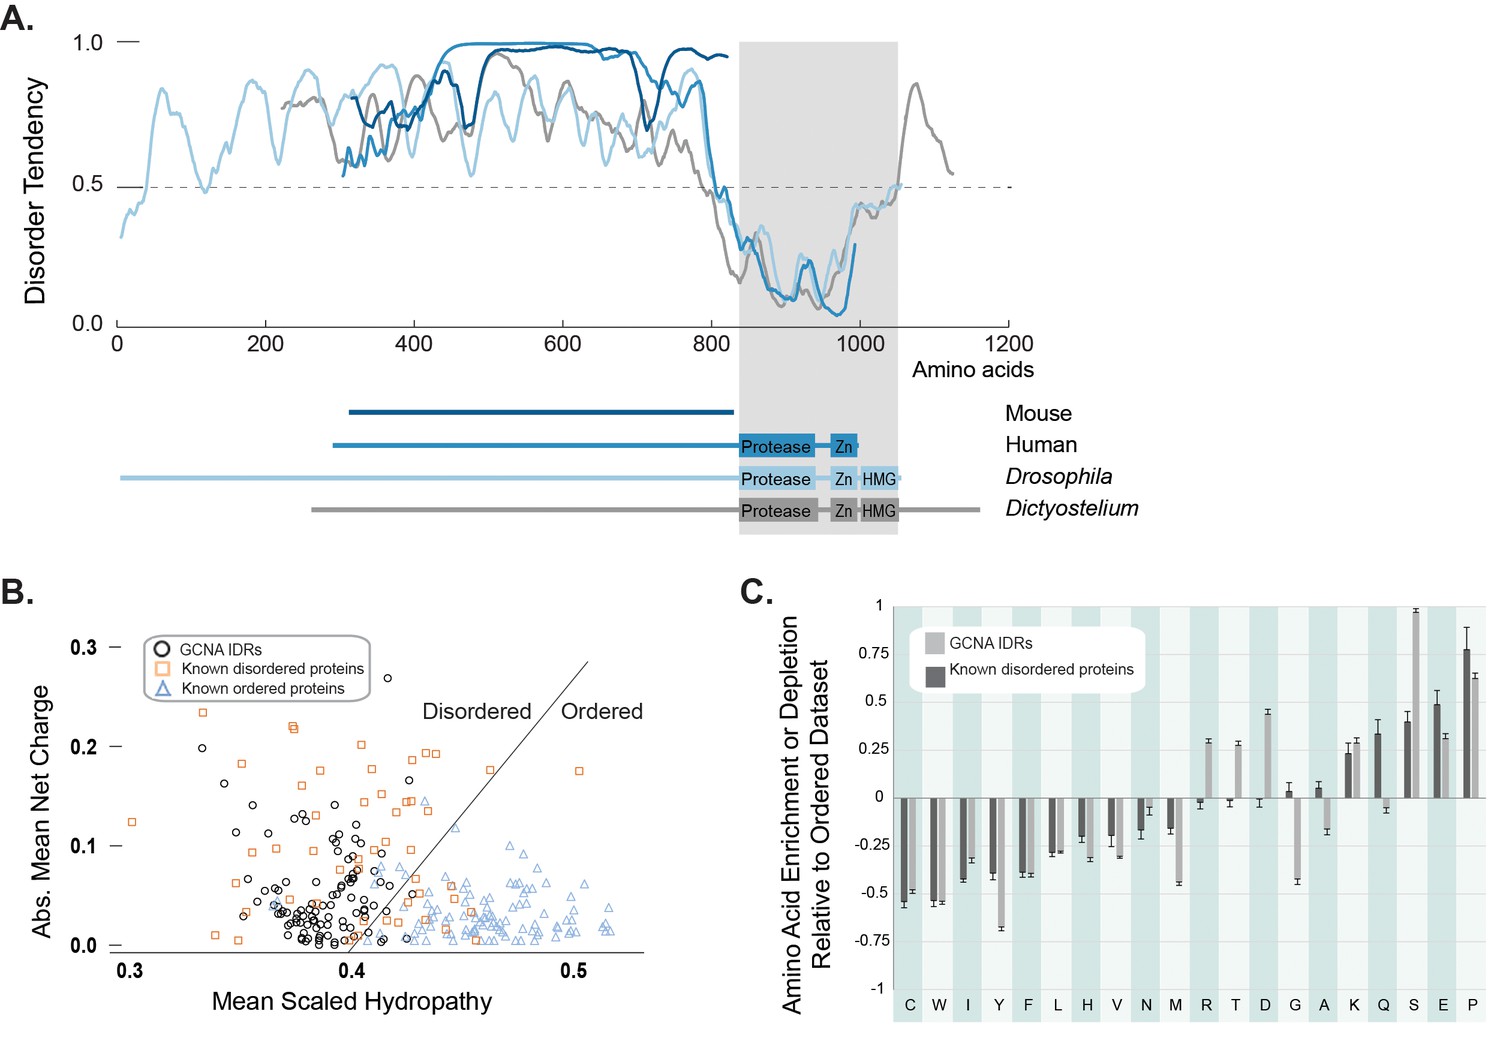
GCNA proteins across eukarya are predicted to have large intrinsically disordered regions.
(A) Disorder tendency of GCNA proteins from mouse (navy), human (medium blue), Drosophila melanogaster (light blue), and Dictyostelium discoideum (gray). Residues above the dotted line are predicted to be disordered. Folded domains are indicated by gray rectangle. (B) Charge-hydropathy analysis (mean scaled hydropathy, <H>, against absolute mean net charge, <R>) predicts GCNA IDRs to be disordered by comparison to a set of known disordered proteins (orange squares) and ordered proteins (blue triangles). IDRs of 114 GCNA proteins across eukarya (black circles) are plotted. The boundary between unfolded and folded space is empirically defined by the equation <H>b = (<R> + 1.151)/2.785 (Uversky et al., 2000). (C) Amino acid composition of GCNA IDRs. Enrichment or depletion is expressed as (Cx − Corder)/Corder, representing the normalized excess of a given residue’s content in a query dataset (Cx) relative to the corresponding value in the dataset of ordered proteins (Corder). Error bars represent fractional differences of the standard deviations of observed relative frequencies of bootstrapped samples of the datasets.
-
Figure 2—source data 1
Charge/hydropathy analysis.
- https://doi.org/10.7554/eLife.19993.008
Figure 3 with 2 supplements

Synteny mapping of Gcna orthologs across vertebrates.
Comparison of the genomic region containing Gcna in mouse (GRCm38/mm10) with syntenic regions in human (GRCh38/hg38), rabbit (Broad/oryCun2), opossum (Broad/monDom5), chicken (ICGSC Gallus_gallus-4.0/galGal4), zebrafish (Zv9/danRer7), and elephant shark (Callorinchus_milii-6.1.3/calMil1). Gcna orthologs are indicated in green.
Figure 3—figure supplement 1
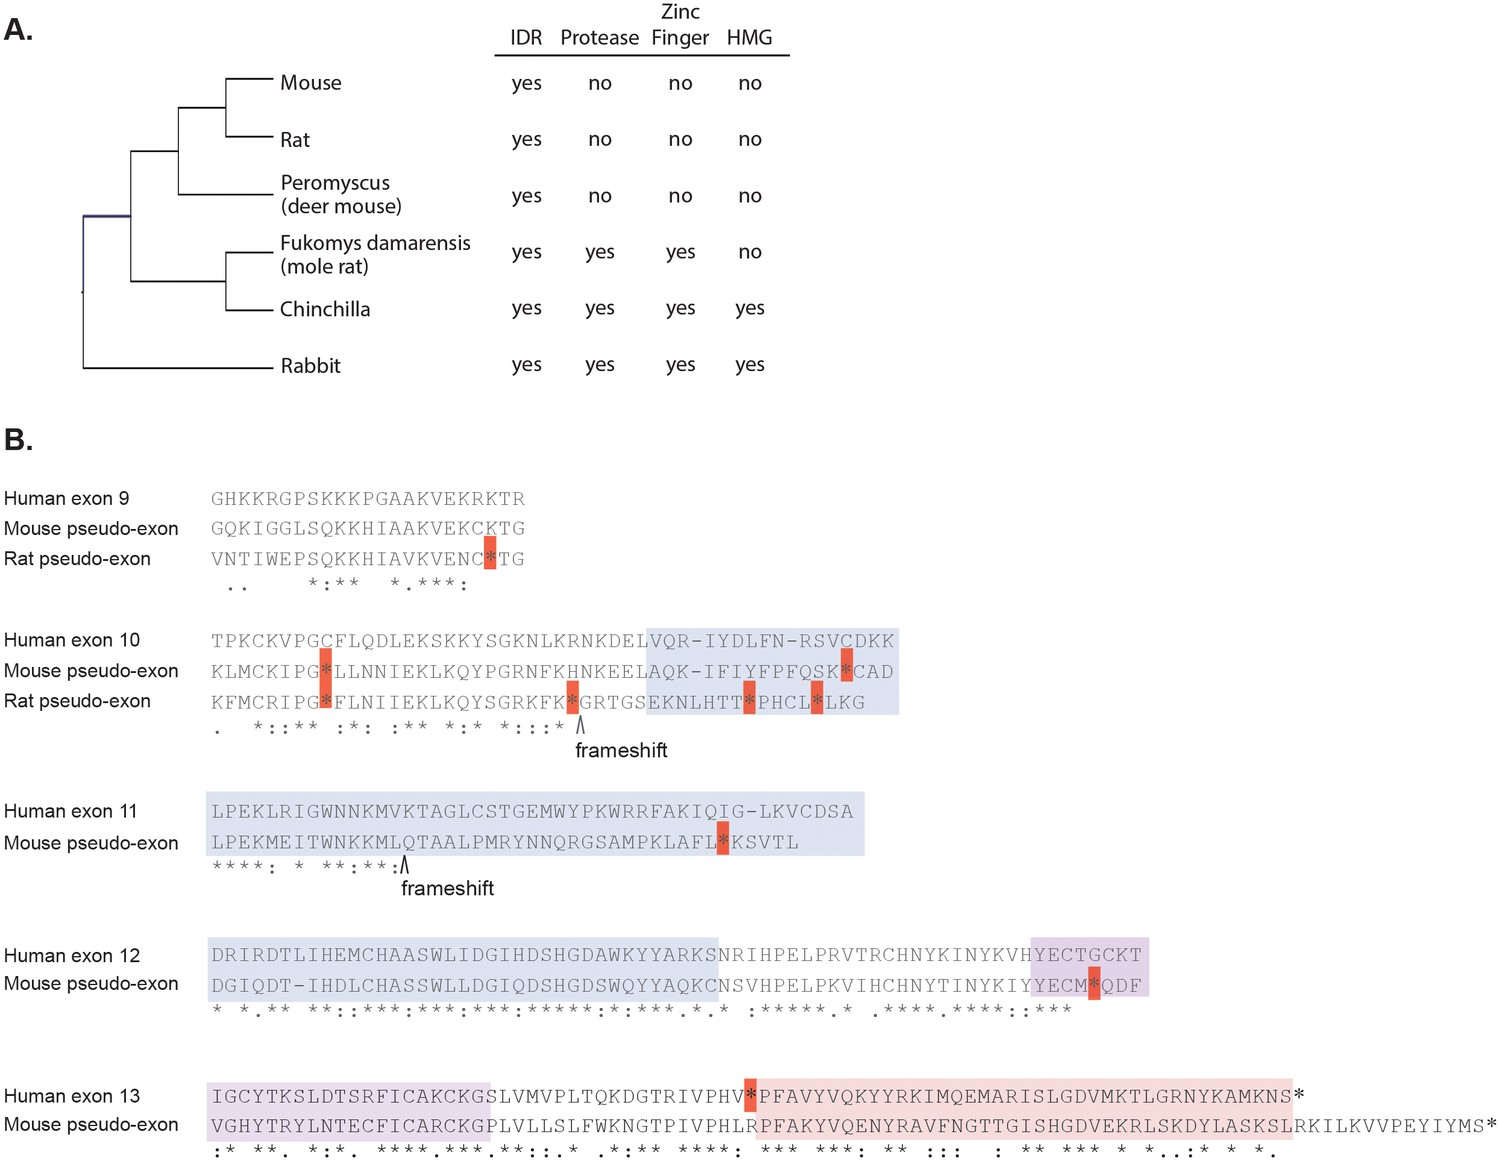
Loss of structured domains in the murine lineage.
(A) Domain composition of rodent GCNA proteins. Rabbit, which diverged from rodents 80 million years ago, serves as an outgroup. (B) Mouse and rat genomes contain non-transcribed pseudo-exons encoding structured domains. Human metalloprotease and zinc finger domains (encoded by human exons 10–12 and 12–13, respectively) aligned with translations of the corresponding mouse and rat non-transcribed exon remnants. Identical residues are indicated by stars, strongly similar residues by colons, and weakly similar residues by periods according to the Gonnet PAM 250 matrix (ClustalW). Dashes represent gaps in the alignment. Stop codons are indicated by red boxes and frameshifts by carets. Regions are color coded as follows: zinc metalloprotease-like (blue), zinc finger (purple), and HMG box (pink). The coordinates of the pseudo-exons in the mouse GRCm38/mm10 release are as follows (numbered according to corresponding human exons): exon 9 (ChrX: 101707035–101707103), exon 10 (ChrX: 101721392–101721498), exon 11 (ChrX: 101724005–101724133), exon 12 (ChrX: 101725798–101726001), and exon 13 (ChrX: 101727141–101727423). The coordinates of the pseudo-exons in rat RGSC 6.0/m6 are: exon 9 (ChrX: 71604116–71604175) and exon 10 (ChrX: 71610020–71610164). Sequences corresponding to human exons 11- 13 are not found in the rat genome. Note: primates have an in-frame stop codon before the HMG box (exon 13).
Figure 3—figure supplement 2
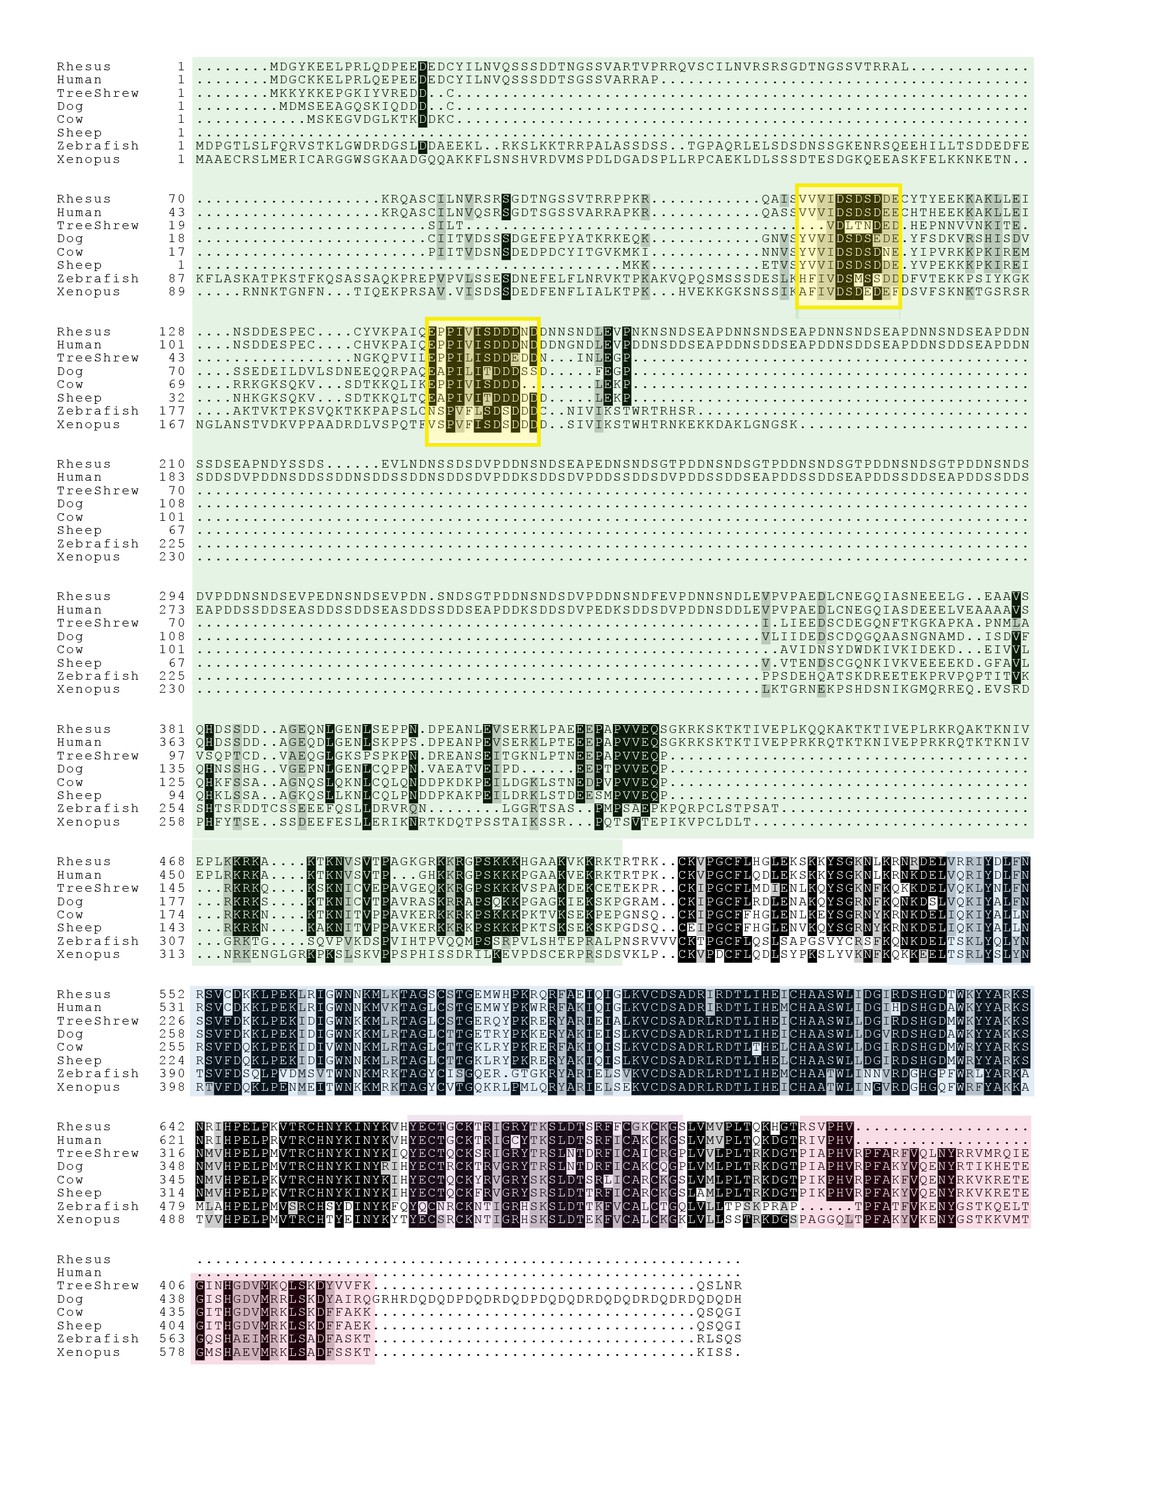
Alignment of vertebrate GCNA proteins.
Vertebrate GCNA proteins show little conservation of primary amino acid sequence outside of structured domains. SUMO-interacting motifs (SIMs) (yellow) comprise small islands of conservation within the IDRs (green). Structured regions are color coded as follows: zinc metalloprotease (blue), zinc finger (purple), and HMG box (red). Residues identical in 70% of the sequences are shaded black; similar residues are gray.
Figure 4 with 3 supplements
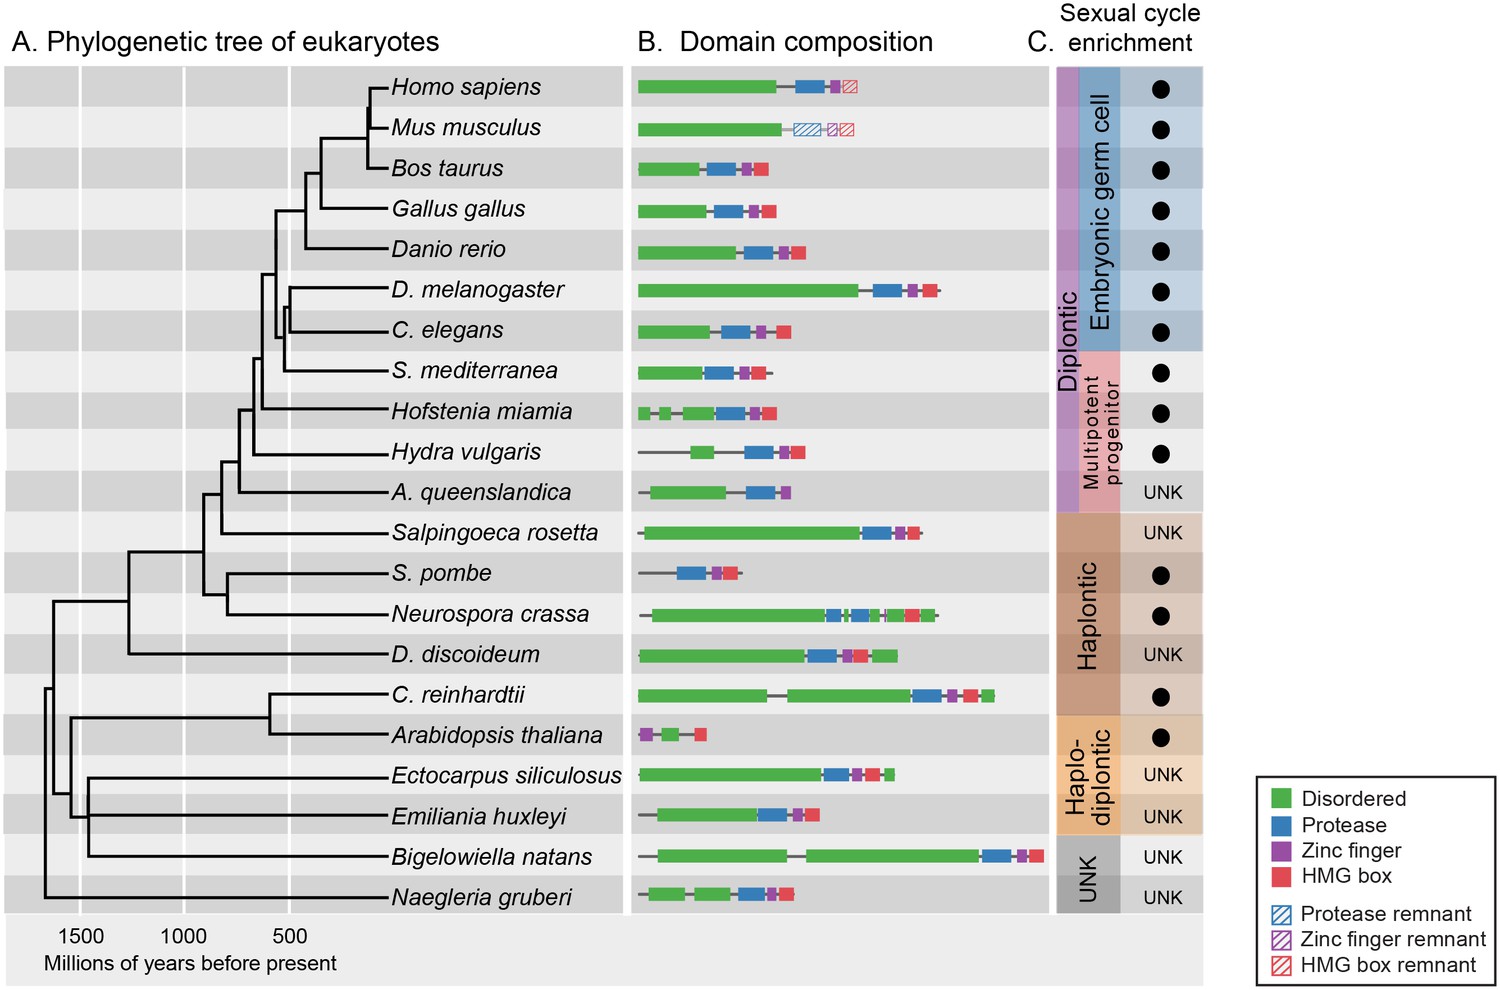
GCNA proteins have origins in the earliest eukaryotes and are associated with reproduction.
(A) Phylogenetic tree of eukaryotes (topology of the tree is drawn as in [He et al., 2014], with estimated divergence times obtained from the TimeTree database [Hedges et al., 2006]). GCNA proteins are present in all major groups of eukaryotes regardless of the nature of their sexual life cycle – whether haplontic (haploid with a diploid phase that undergoes meiosis), diplontic (a diploid that undergoes meiosis to produce gametes), or haplodiplontic (alternates between haploid and diploid phases of the life cycle). (B) Domain composition of GCNA orthologs. Of note, S. pombe does not have an IDR, but a related fission yeast, S. japonicus, does (not shown). (C) Black circles indicate a given GCNA ortholog has enriched expression in reproductive cells or tissues or is upregulated during the sexual cycle. Organisms for which expression data do not exist are indicated by UNK (unknown).
-
Figure 4—source data 1
List of GCNA family members.
- https://doi.org/10.7554/eLife.19993.013
-
Figure 4—source data 2
Reproductive expression of GCNA family members.
- https://doi.org/10.7554/eLife.19993.014
Figure 4—figure supplement 1
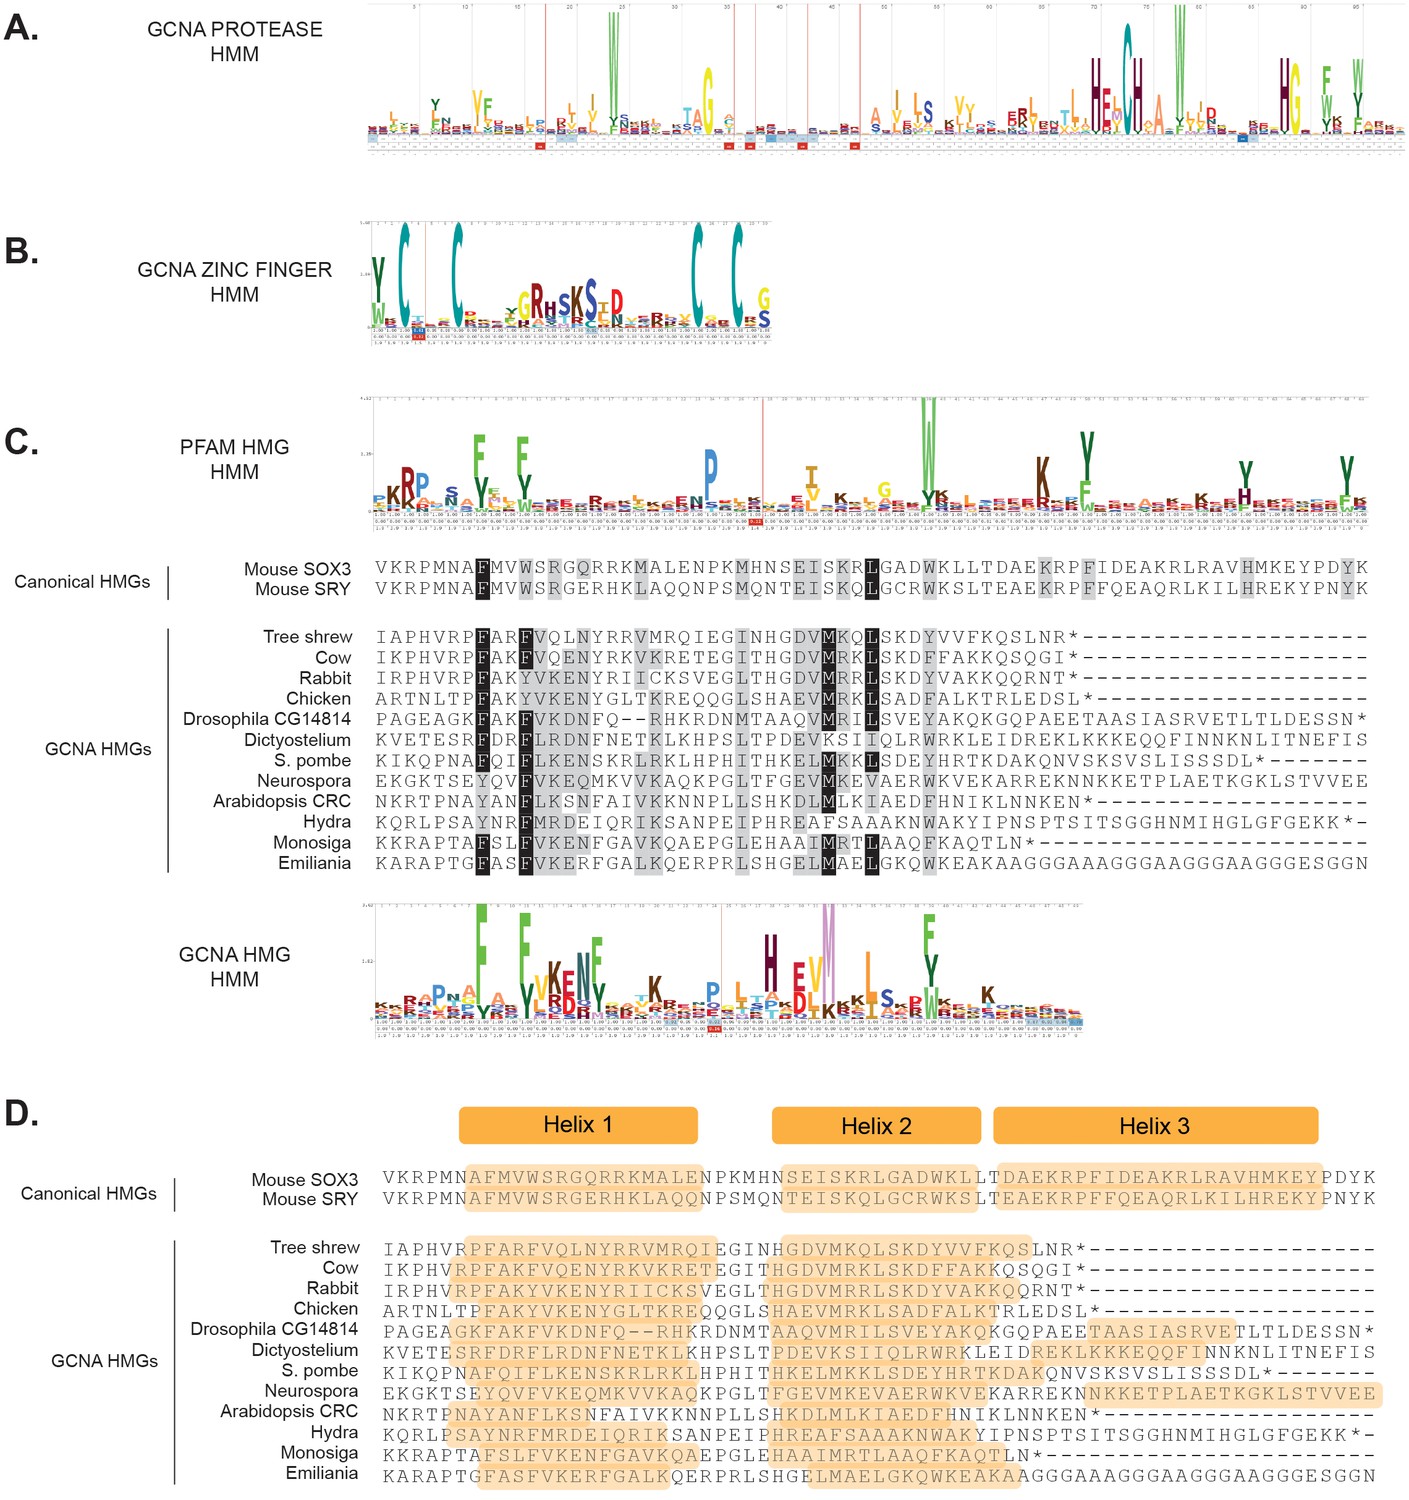
Alignments and probabilistic hidden Markov models (HMMs) of structured domains found in GCNA family members.
(A) HMM of GCNA protease domain with its HExCH active site. (B) HMM of the characteristic C2C2 zinc finger found in the GCNA family. (C) Alignment of GCNA HMG boxes with the HMMs from Pfam HMGs (a conglomerate of many types of HMG boxes) and GCNA HMGs. Canonical HMG boxes are shown for comparison. Residues identical in 70% of the sequences are shaded black; similar residues are gray. (D) Secondary structure prediction of GCNA HMG boxes showing the two predicted alpha helices (orange). Most GCNA proteins terminate before the third helix of canonical HMG boxes, but a third helix may form in some species. HMMs used for ortholog discovery can be found in Figure 4—figure supplement 1—source data 1—source
-
Figure 4—figure supplement 1—source data 1
Hidden Markov models used to discover GCNA orthologs.
- https://doi.org/10.7554/eLife.19993.016
Figure 4—figure supplement 2
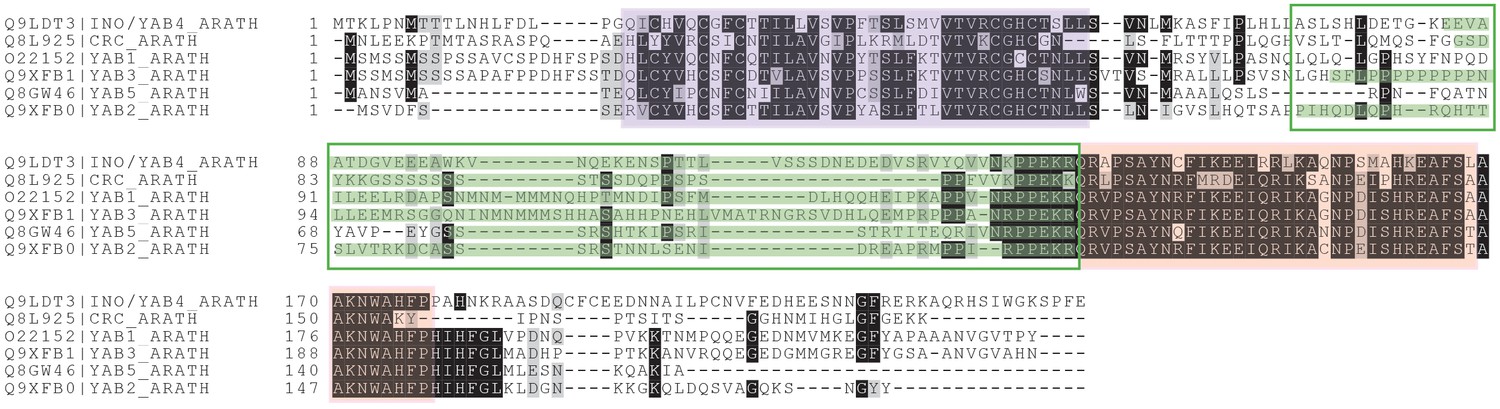
GCNA proteins in higher plants comprise the YABBY family.
YABBY and GCNA proteins possess an IDR, a C2C2 zinc finger, and a characteristic two-helix HMG box (Bowman and Smyth, 1999). Regions are color coded as follows: IDR/'central variable region' (region outlined in green, with IUPred (Dosztányi et al., 2005) predicted disordered residues highlighted in green), C2C2 zinc finger (purple), and two-helix HMG box (pink). Residues that are identical in 70% of the sequences are shaded black; similar residues are shaded gray.
Figure 4—figure supplement 3
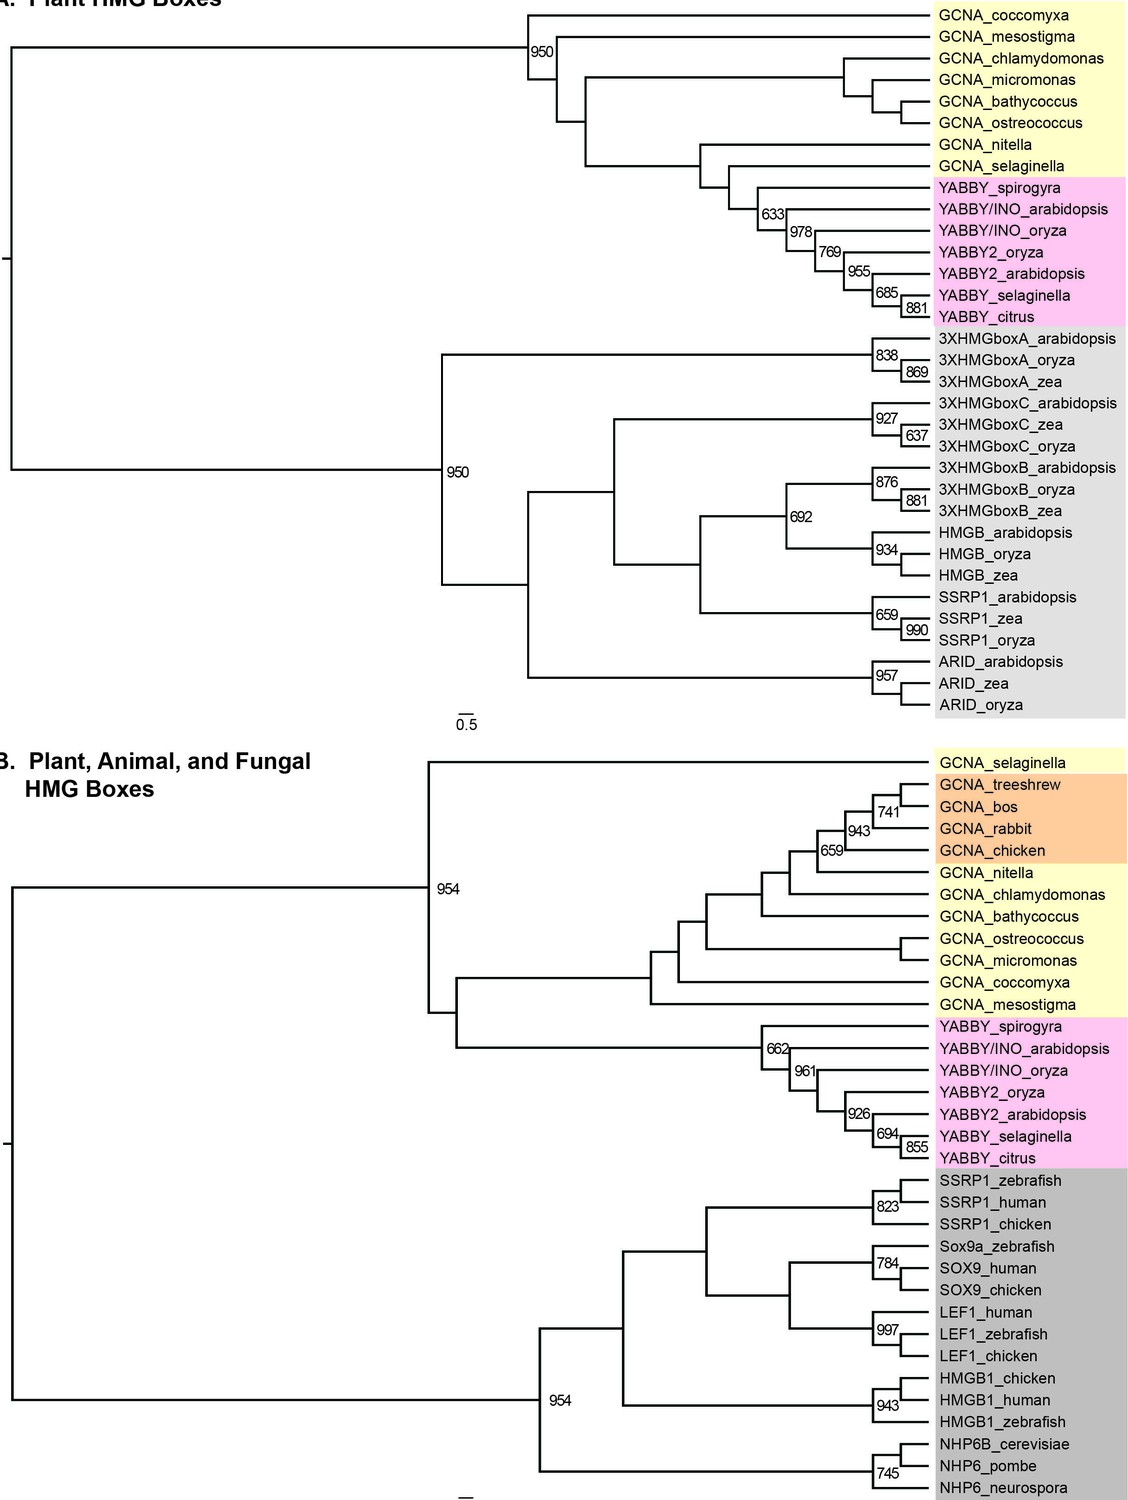
GCNA and YABBY HMG boxes are more closely related to each other than they are to any other type of HMG box, either within plants or across eukarya.
(A) Maximum likelihood tree of all known classes of plant HMG boxes. GCNA proteins in green algae and spikemoss (Selaginella, a basal land plant) are yellow. YABBY proteins in green algae (Spirogyra), Selaginella, and seed plants are pink. The six non-GCNA/YABBY types of plant HMG boxes are gray. (B) Maximum likelihood tree of all major classes of animal and fungal HMG boxes. The two-helix HMG boxes of GCNAs and YABBYs are more related to each other than they are to the first two helices of any other type of HMG box in animals or fungi. Colors are as in (A), with the addition of vertebrate GCNA proteins (orange). Non-GCNA/YABBY classes of HMG boxes are gray. Bootstrap values over 600 (out of 1000) are indicated. Trees were constructed using PhyML.
Figure 5 with 1 supplement
GCNA RNA and protein are enriched in germ cells of a variety of model organisms.
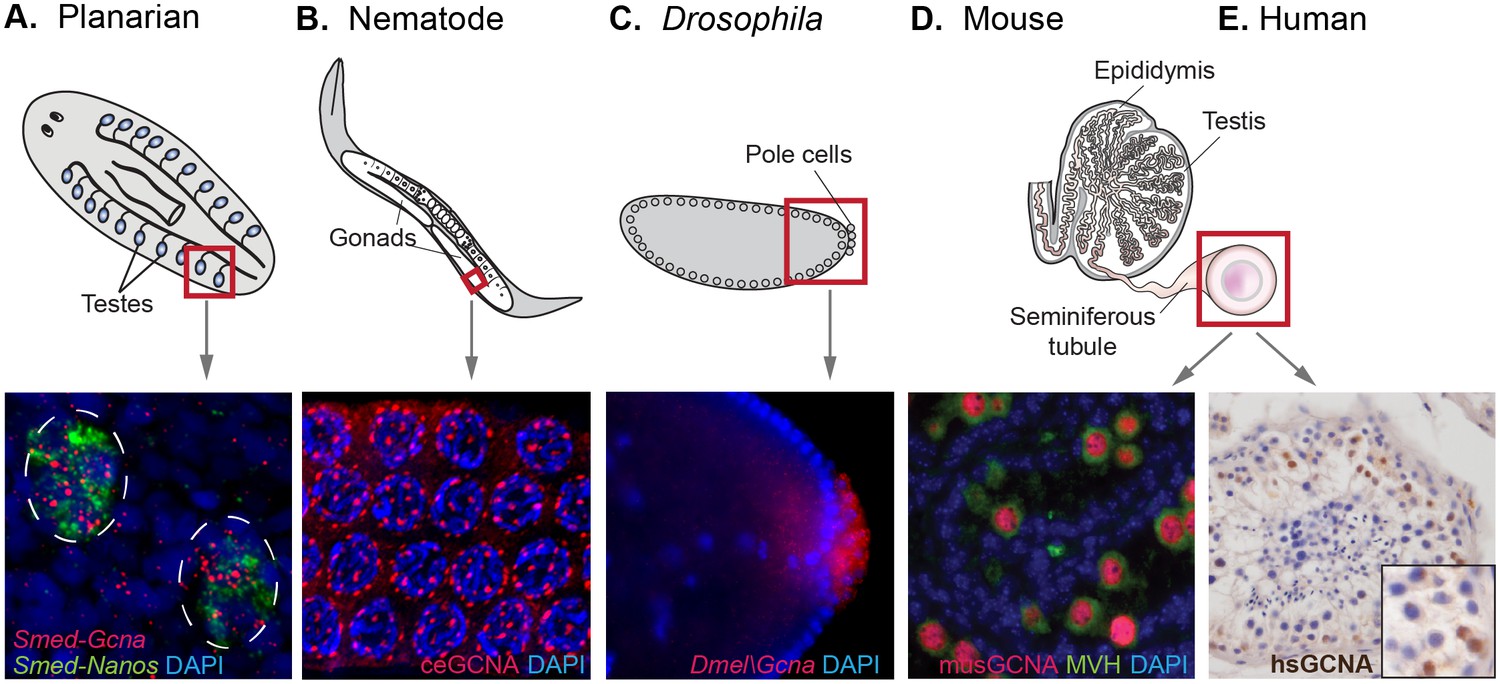
(A) Germ cells residing in testes (circled) of a sexual strain of the planarian flatworm Schmidtea mediterranea are enriched for Gcna transcript (red), as well as that of germ cell marker Nanos (green). (B) Germ cells in pachytene stage of meiosis in nematode C. elegans express GCNA protein (red). Nuclei stained with DAPI (blue). (C) Pole cells, the earliest germ cells in a Drosophila melanogaster embryo, are enriched for transcript of Gcna ortholog CG14814. Image reproduced with permission (Lécuyer et al., 2007). GCNA protein is expressed in germ cells in cross sections of mouse (D) and human (E) seminiferous tubules, the site of meiosis and sperm production. (D) Pre-meiotic germ cells in testis of 1-day old mouse are labeled using antibodies recognizing GCNA (red) and DDX4/MVH (green). (E) Antibody recognizing human GCNA labels nuclei of germ cells (brown). Red squares indicate origin of structures and/or cells depicted below each diagram.
Figure 5—figure supplement 1
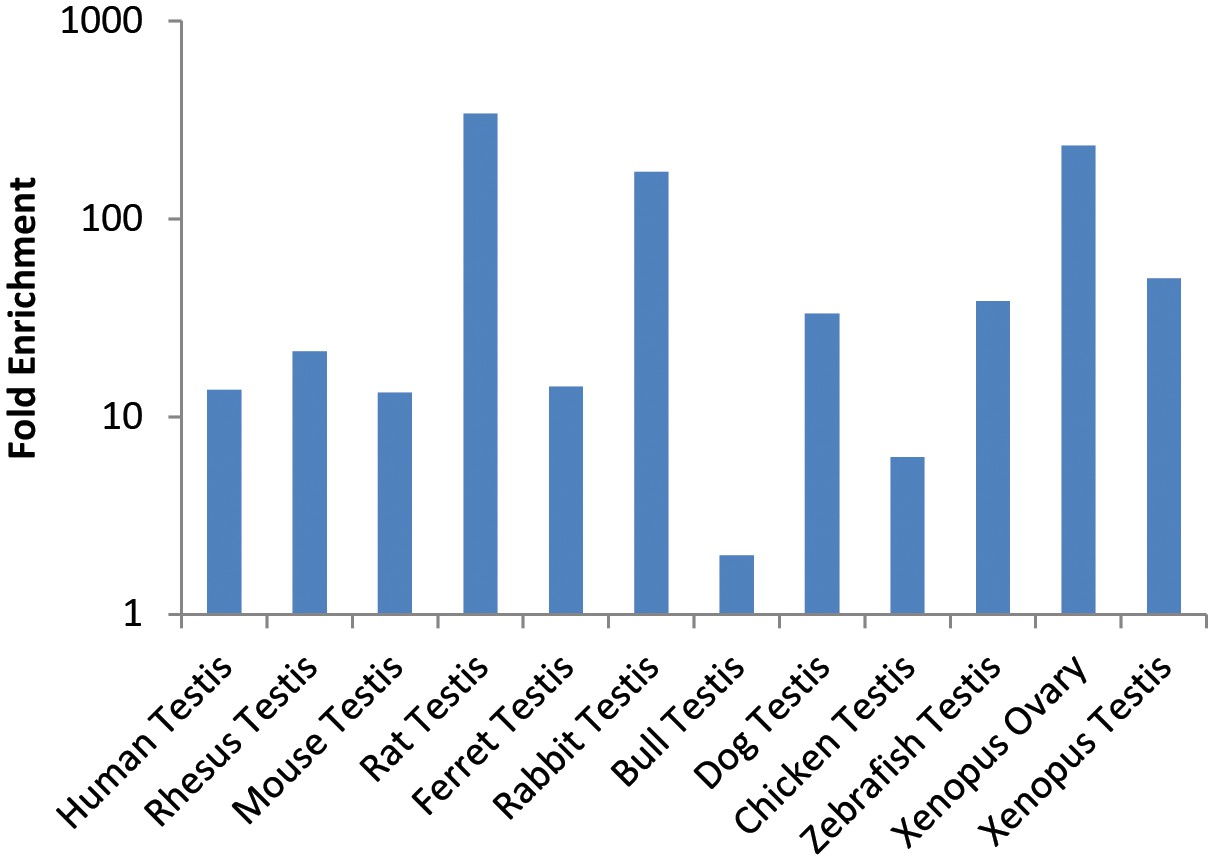
Enrichment of Gcna expression in reproductive tissues of vertebrates.
Fold enrichment is calculated compared to the average expression in all somatic tissues. Source data may be found in Figure 4—source data 2.
Figure 6 with 1 supplement
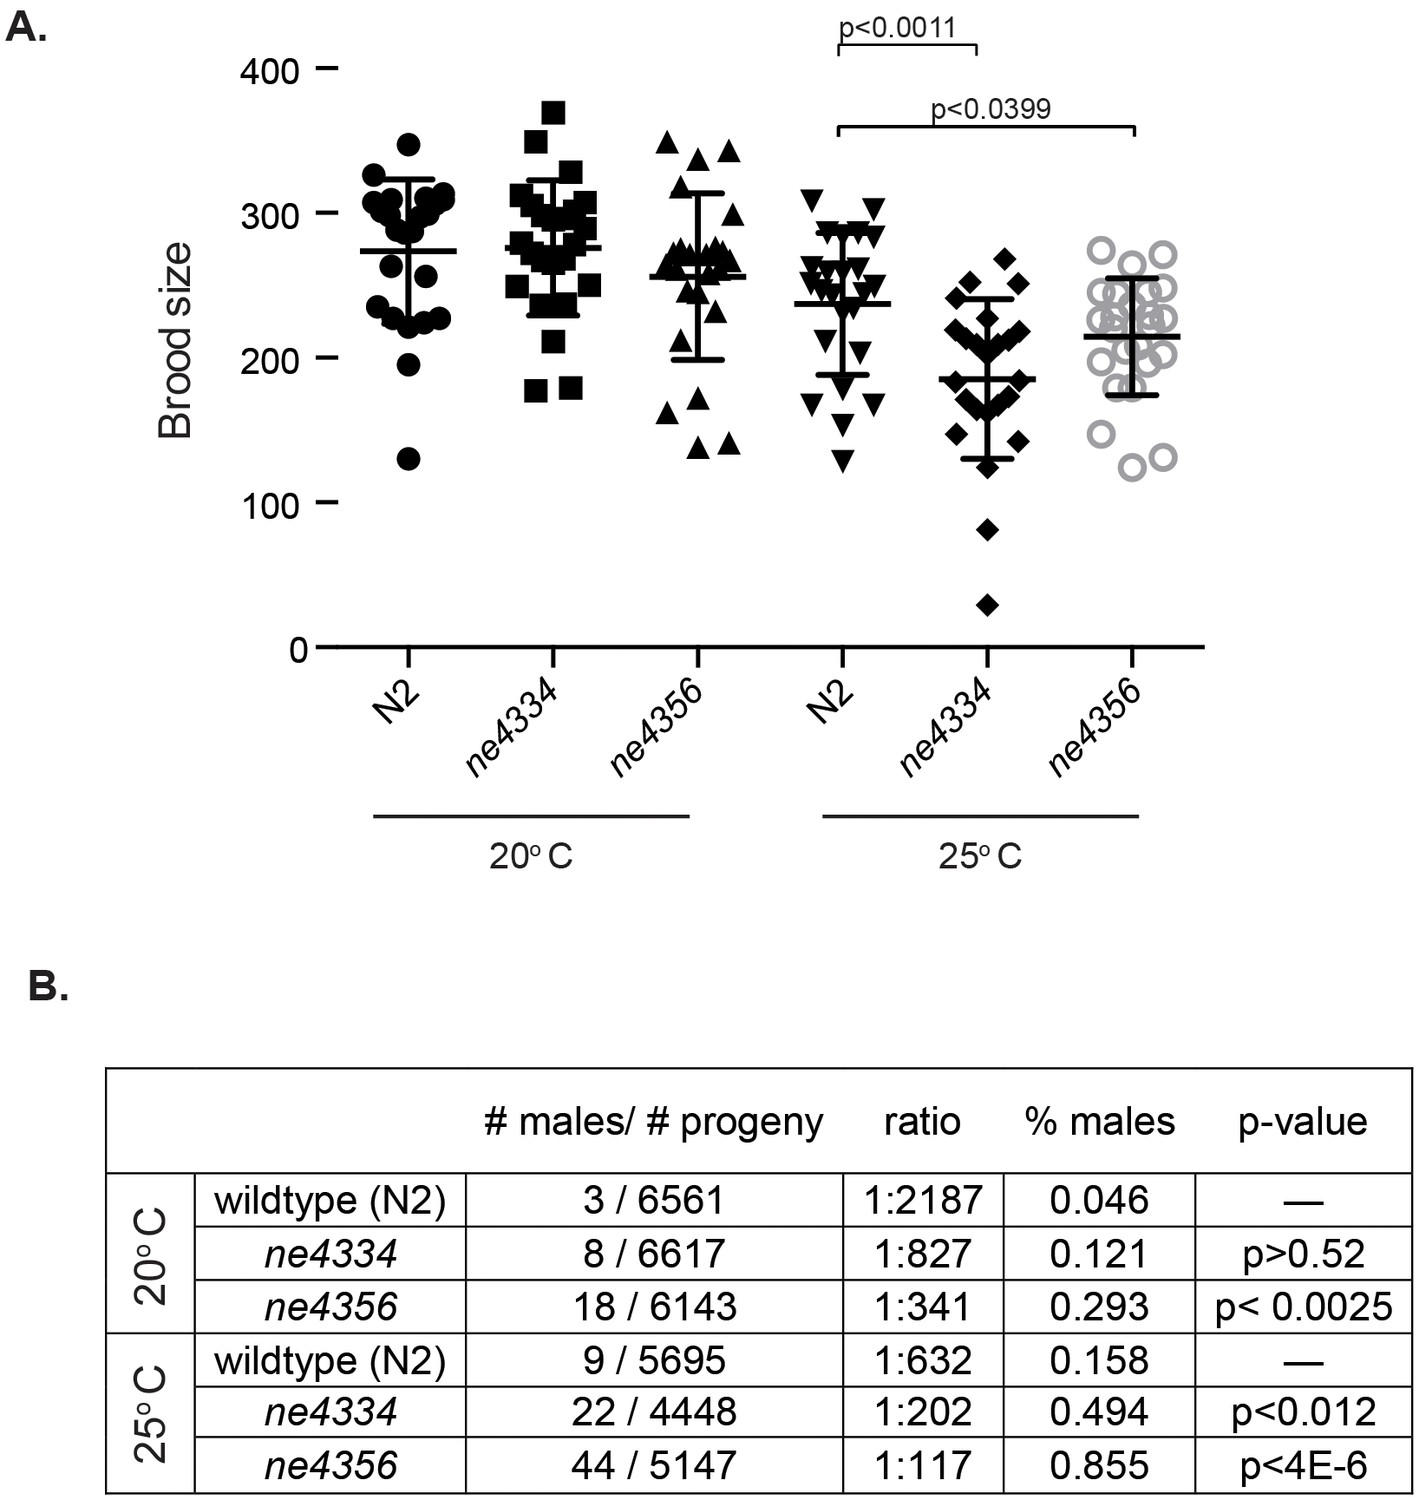
C. elegans gcna-1 mutants present reproductive phenotypes.
(A) Two alleles of gcna-1 in C. elegans exhibit significant reduction in brood size at 25 degrees Celsius. Twenty-four broods were counted for each allele at each temperature. Each symbol represents the number of progeny derived from a single hermaphrodite. Outliers are shown and no data was excluded. Bars indicate mean +/- standard deviation. P-values were calculated with two-tailed non-parametric Mann-Whitney test. (B) gcna-1 mutants also exhibit a high incidence of male progeny at both 20 and 25 degrees Celsius. Twenty-four broods were counted and scored for each allele at each temperature. P-values were calculated using a chi-squared test with correction for multiple testing.
Figure 6—figure supplement 1

C. elegans gcna-1 alleles.
(A) Diagrams of wildtype (N2), ne4334 (2-bp deletion), and ne4356 (1748-bp deletion) alleles. (B) Sequencing traces confirming the 2-bp deletion in the ne4334 allele. (C) PCR genotyping of the ne4356 allele confirming the large deletion. F3/R1 primers bind outside of the deletion, while the binding site of primer F1 is within the deleted region.
Figure 7

Gcna is required for male fertility in mice.
(A) Gcna-mutant male mice exhibit marked subfertility, and most are sterile. Each datapoint represents the number of litters (A) and pups (B) sired by a single male (n=15 for wildtype, n=11 for GcnaDeltaEx4/Y). P-values were calculated using a two-sided Wilcoxon rank sum test. (B) Epididymal ducts in Gcna-mutant males are largely devoid of sperm in the lumen when compared to those of wildtype mice.
Figure 8 with 1 supplement

GCNA, Wss1, and Spartan proteins comprise a family of proteases.
(A) Maximum likelihood phylogenetic tree showing relationships among eukaryotic GCNA, Wss1, Spartan, and bacterial SprT protease domains. GCNA, Wss1, and Spartan are present across eukarya, including the most primitive eukaryotes, except that Wss1 proteins have been lost in animals. Gray and black circles indicate nodes with bootstrap values greater than 600 and 900 (out of 1000), respectively. Tree is based on alignment of the protease domains and was created with PhyML. (B) Structural modeling of GCNA, Wss1, and Spartan protease domains places GCNA in the minigluzincin family of proteases along with Wss1 and Spartan. Pairwise protein structure comparison using FATCAT (Ye and Godzik, 2004) detected strong structural similarity, as evidenced by small root-mean-square deviations (RMSDs), which are measures of the average distance (in Angstroms) between the carbon atoms of the superimposed proteins. All structures were found to be significantly similar.
Figure 8—figure supplement 1
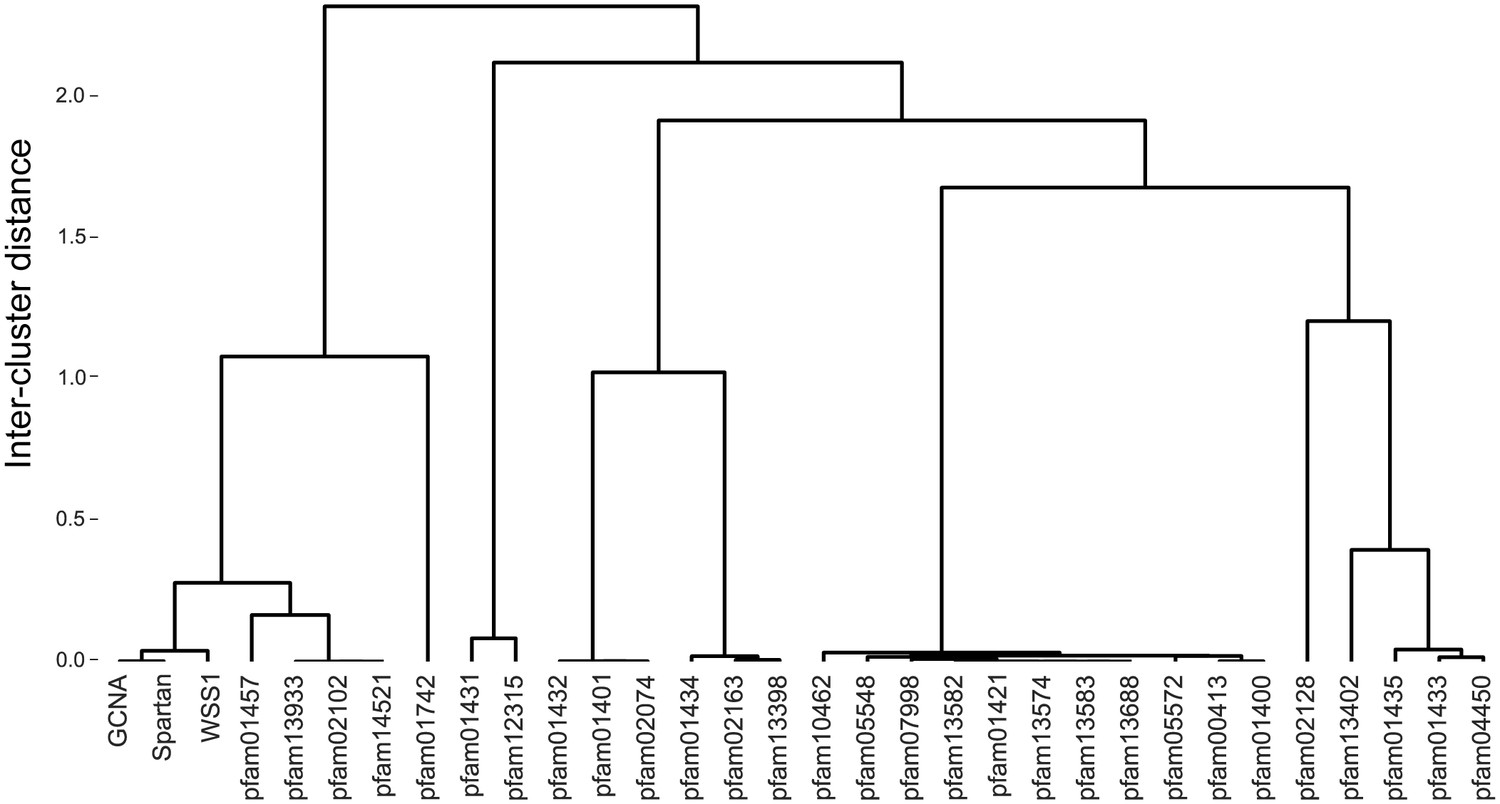
GCNA, Spartan, and Wss1 form a subgroup within the larger Peptidase Clan MA.
Clan MA, one of 15 clans of metallopeptidases in MEROPS, contains all of the peptidases that have arisen from a single evolutionary origin as defined by tertiary structure, the order of catalytic residues, and sequence motifs surrounding the catalytic site. Dendrogram was constructed by heirarchically clustering protein groups based on comparison of HMMs using alignment and secondary structure scoring.
Figure 9
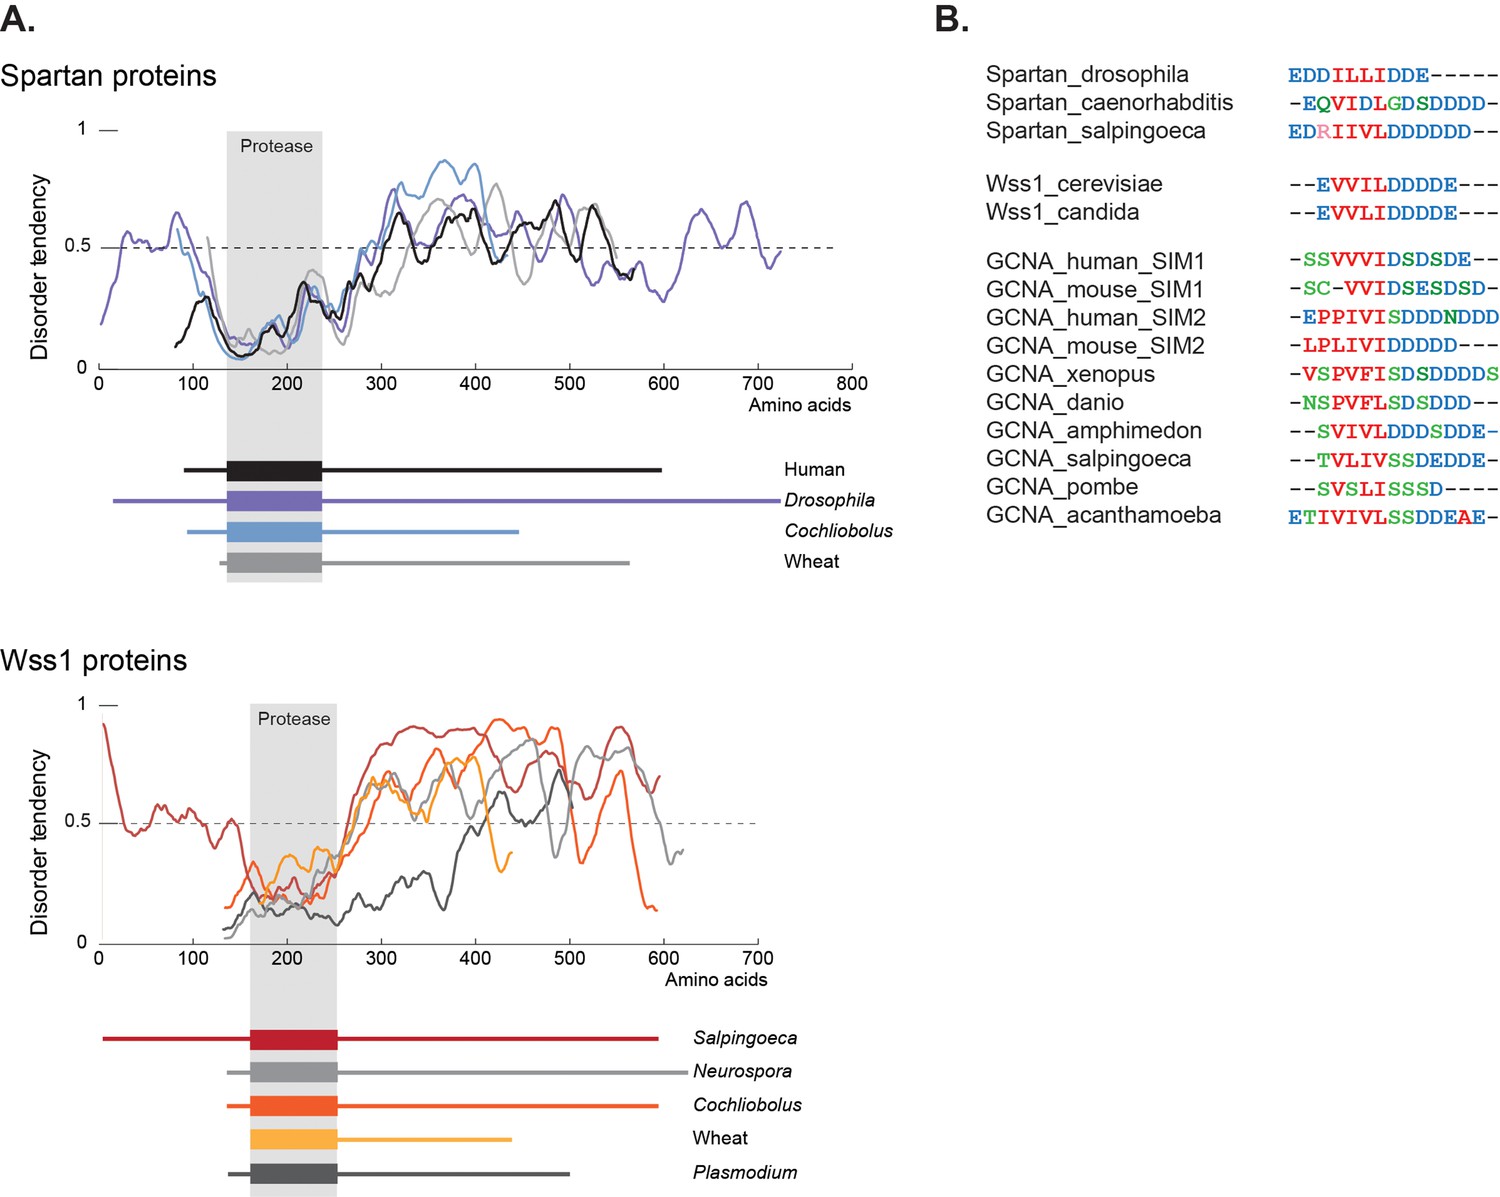
GCNA, Wss1, and Spartan proteins have SUMO interacting motifs within large disordered regions.
(A) Spartan and Wss1 have significant disordered regions outside of their protease domains. Residues above the dotted line are predicted to be disordered. (B) GCNA proteins contain conserved SUMO-interacting motifs (SIMs) that are homologous to those found in Spartan and Wss1 proteins. Residues are colored as follows: blue (acidic), green (hydroxyl, sulfhydryl, amine), red (small and hydrophobic), pink (basic).
Additional files
-
Source code 1
Perl script for isoelectric point calculation.
- https://doi.org/10.7554/eLife.19993.027
Download links
A two-part list of links to download the article, or parts of the article, in various formats.
Downloads (link to download the article as PDF)
Open citations (links to open the citations from this article in various online reference manager services)
Cite this article (links to download the citations from this article in formats compatible with various reference manager tools)
A widely employed germ cell marker is an ancient disordered protein with reproductive functions in diverse eukaryotes
eLife 5:e19993.
https://doi.org/10.7554/eLife.19993


