Response repetition biases in human perceptual decisions are explained by activity decay in competitive attractor models
- UCL Institute of Neurology, University College London, United Kingdom
Figures
Figure 1
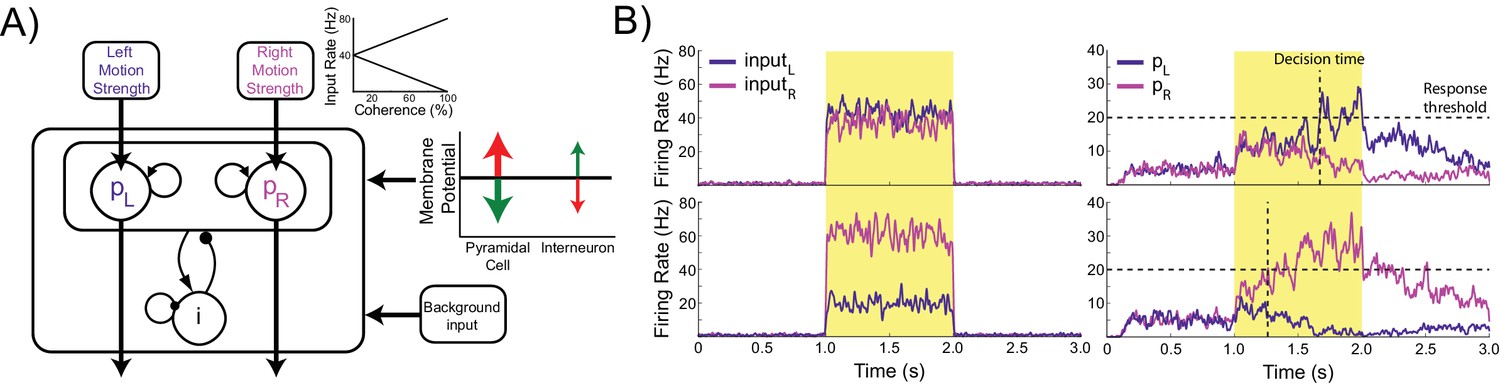
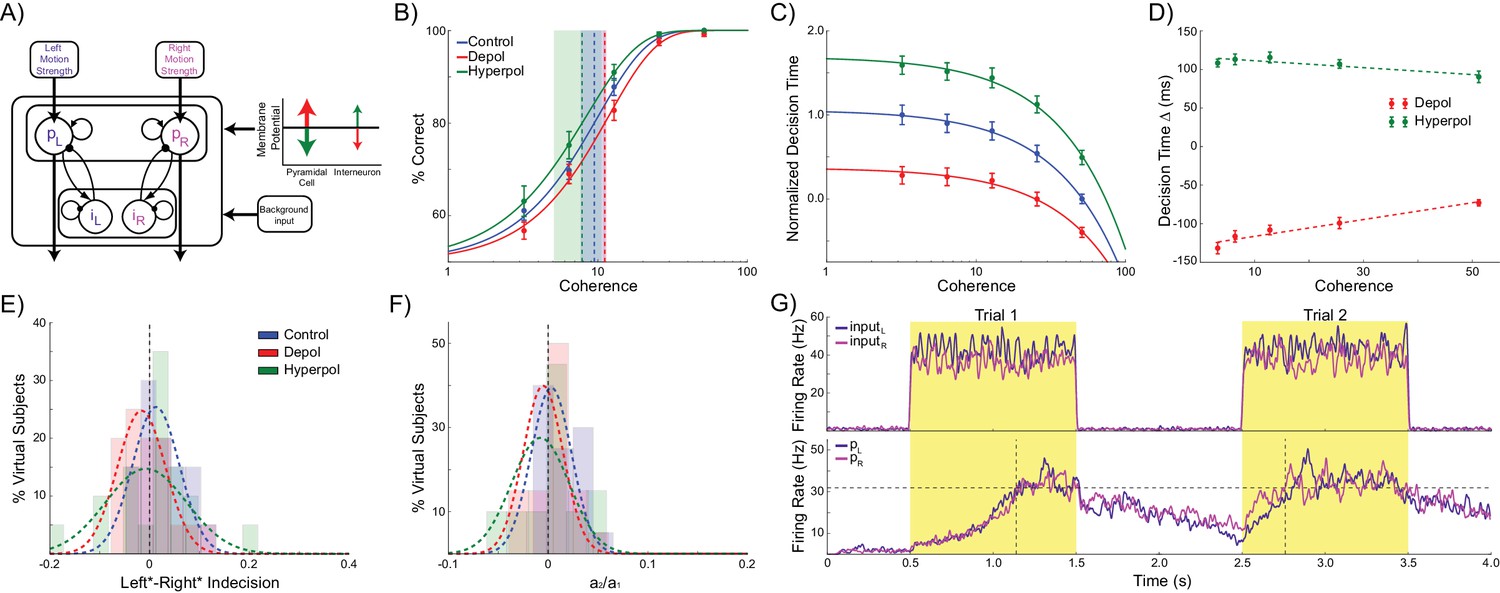
Model architecture.
(A) The model contains two populations of pyramidal cells which inhibit each other through a common pool of inhibitory interneurons. The pyramidal populations receive task-related inputs signaling the momentary evidence for each response option. The mean input firing rate to each pyramidal population varies as a function of the stimulus coherence (inset). Difficult trials have low coherence, easy trials high coherence. tDCS is simulated by modulating the membrane potential of the pyramidal and interneuron populations. (B) Firing rates of the task-related inputs (left column) and two pyramidal populations (right column) during representative trials with low (top row), and high (bottom row) coherence. The horizontal dotted lines denote the response threshold (20 Hz in this example) and the vertical dotted lines show the decision time - when one of the pyramidal population’s firing rate crosses the response threshold.
Figure 2
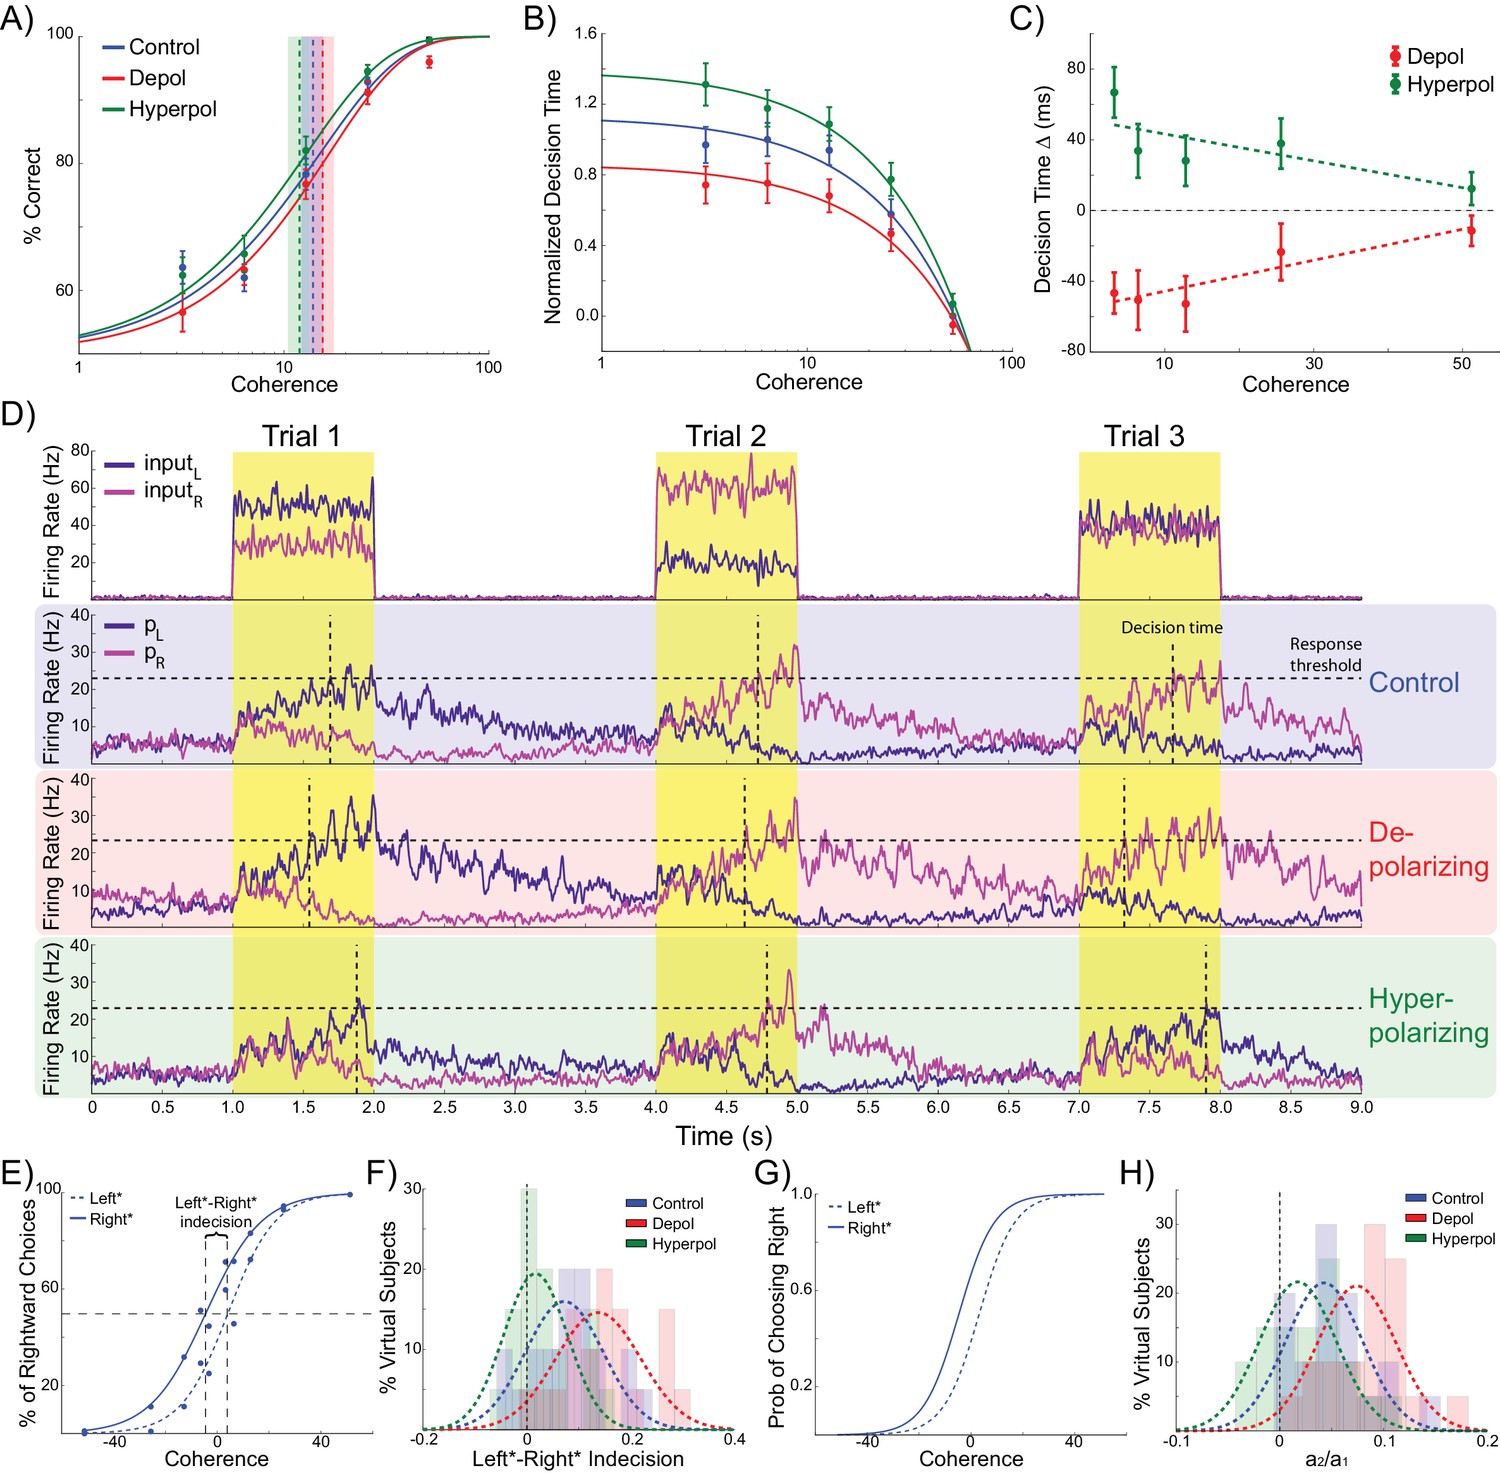
Effects of simulated network stimulation on model behaviour.
(A) There was no average change in the decision threshold with either depolarizing or hyperpolarizing stimulation, where the decision threshold reflects the coherence required to reach 80% accuracy. (B) Decision time decreases with increasing coherence, with depolarizing stimulation speeding decision time and hyperpolarizing stimulation slowing decisions. (C) Depolarizing stimulation decreases and hyperpolarizing stimulation increases decision time, but this effect is reduced with increasing coherence. (D) Neural dynamics of the model. The model was run continuously, with the decaying activity of each trial influencing the initial activity at the beginning of the following trial. Depolarizing stimulation delayed the return of this decaying activity to baseline levels, while hyperpolarizing stimulation dampened the overall dynamics of the model and therefore suppressed residual activity. (E) When sorted by the choice made on the previous trial (Left* or Right*), the indecision point (or level of coherence resulting in chance selection of the same choice), shifts. This reflects a bias towards repeating that decision. (F) The positive shift in indecision point is further increased by depolarizing stimulation and decreased by hyperpolarizing stimulation. (G) A logistic regression model was fit to choice behavior with coefficients for coherence and the choice on the previous trial. (H) This analysis confirms a positive value for the influence of the previous choice on the current choice (a1), scaled by the influence of coherence (a2). Depolarizing stimulation increases this ratio, and hyperpolarizing stimulation reduces it. See Figure 2—source data 1 for raw data.
-
Figure 2—source data 1
Competitive attractor model accuracy, decision time, and choice hysteresis with simulated network stimulation.
- https://doi.org/10.7554/eLife.20047.005
Figure 3
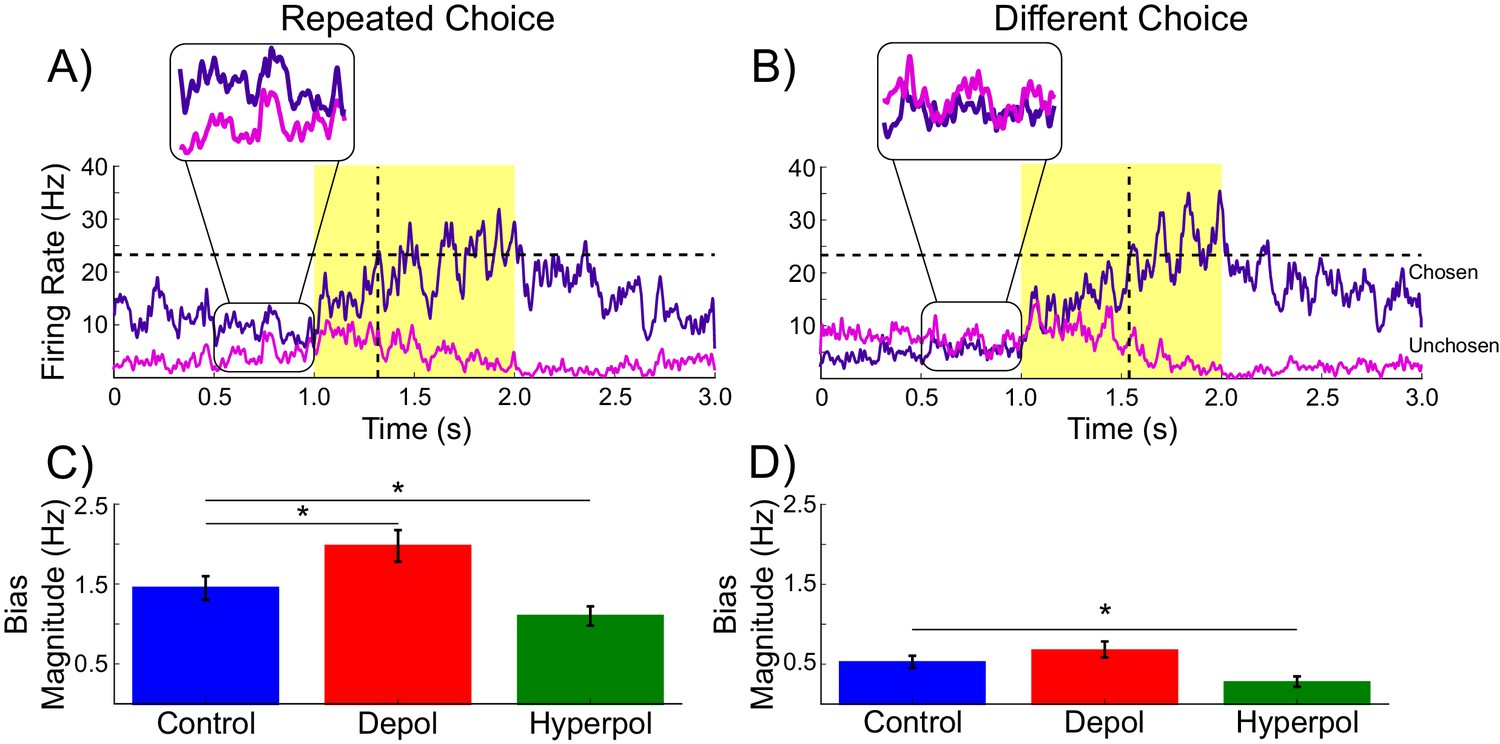
Decaying tail activity causes neural hysteresis effects.
(A) Example trial in which the previous choice was repeated, showing a marked difference in the decaying tail activity from the previous trial between the eventually chosen and unchosen pyramidal populations, prior to the onset of the stimulus. (B) Example trial in which the pre-stimulus difference between chosen and unchosen firing rates is small. As a consequence, the bias in activity at stimulus onset is not strong enough to influence the choice. (C) The mean difference in firing rates in the 500 ms prior to the onset of the task-related inputs (magnified region in A) is amplified by depolarizing (red) and suppressed by hyperpolarizing (green) stimulation, relative to no stimulation (blue). (D) When the bias in pre-stimulus activity is relatively small, the model behavior is dominated by the task-related inputs, and therefore the model is able to overcome the hysteresis bias and make a different choice. See Figure 3—source data 1 for raw data.
-
Figure 3—source data 1
Model prestimulus firing rates in repeated and non-repeated choice trials.
- https://doi.org/10.7554/eLife.20047.010
Figure 4
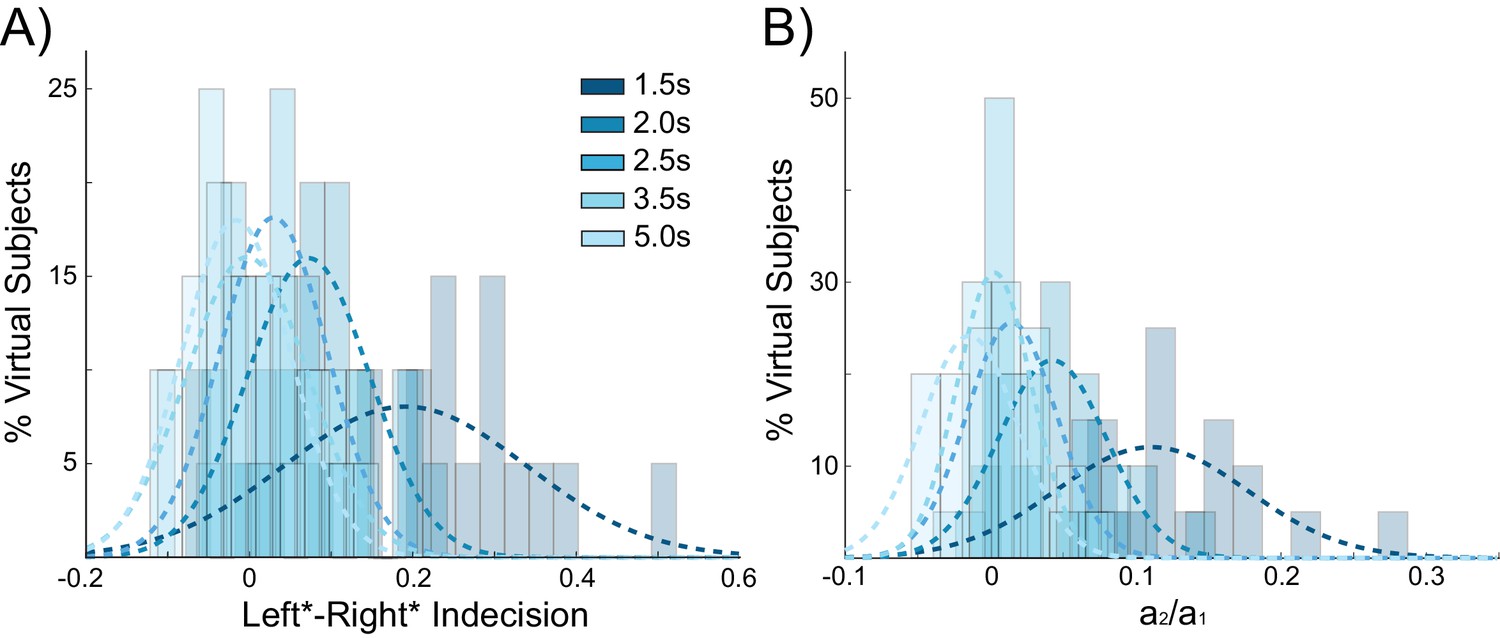
Behavioral choice hysteresis diminishes with longer interstimulus intervals.
(A) The mean of the indecision point shift decreases with longer interstimulus intervals (ISIs), reflecting a smaller choice hysteresis effect. (B) Similarly, the ratio a1/ a2 from the logistic regression, representing the relative influence of the previous choice on the current choice relative to the influence of coherence, decreases with increasing ISIs. Choice hysteresis is strongest for short ISIs of 1.5 s, and disappears for the longest ISI of 5 s. See Figure 4—source data 1 for raw data.
-
Figure 4—source data 1
Model choice hysteresis behavior with increasing ISIs.
- https://doi.org/10.7554/eLife.20047.012
Figure 5
Accumulator model architecture and simulations.
(A) In the accumulator version of the model, the inhibitory interneuron population is split into two subpopulations, each connected exclusively to the corresponding pyramidal population. The pyramidal populations can thus only integrate the task related inputs through their recurrent connectivity and cannot inhibit each other. (B) Neither depolarizing nor hyperpolarizing stimulation significantly changed the decision threshold. (C) As with the competitive attractor model, decision time decreases with increasing coherence, and depolarizing stimulation speeds decision time, while hyperpolarizing stimulation slows decisions. (D) The effects of stimulation on decision time are reduced with increasing coherence. (E) There is no shift in indecision point when sorting trials based on the previous choice, and stimulation does not affect this. (F) The relative influence of the previous choice on the current decision is nearly zero, and this is not changed by stimulation. (G). Neural dynamics of the accumulator model. The losing pyramidal population is not inhibited and therefore residual activity from both populations carries over into the next trial. See Figure 5—source data 1 for raw data.
-
Figure 5—source data 1
Accumulator model accuracy, decision time, and choice hysteresis with simulated network stimulation.
- https://doi.org/10.7554/eLife.20047.014
Figure 6
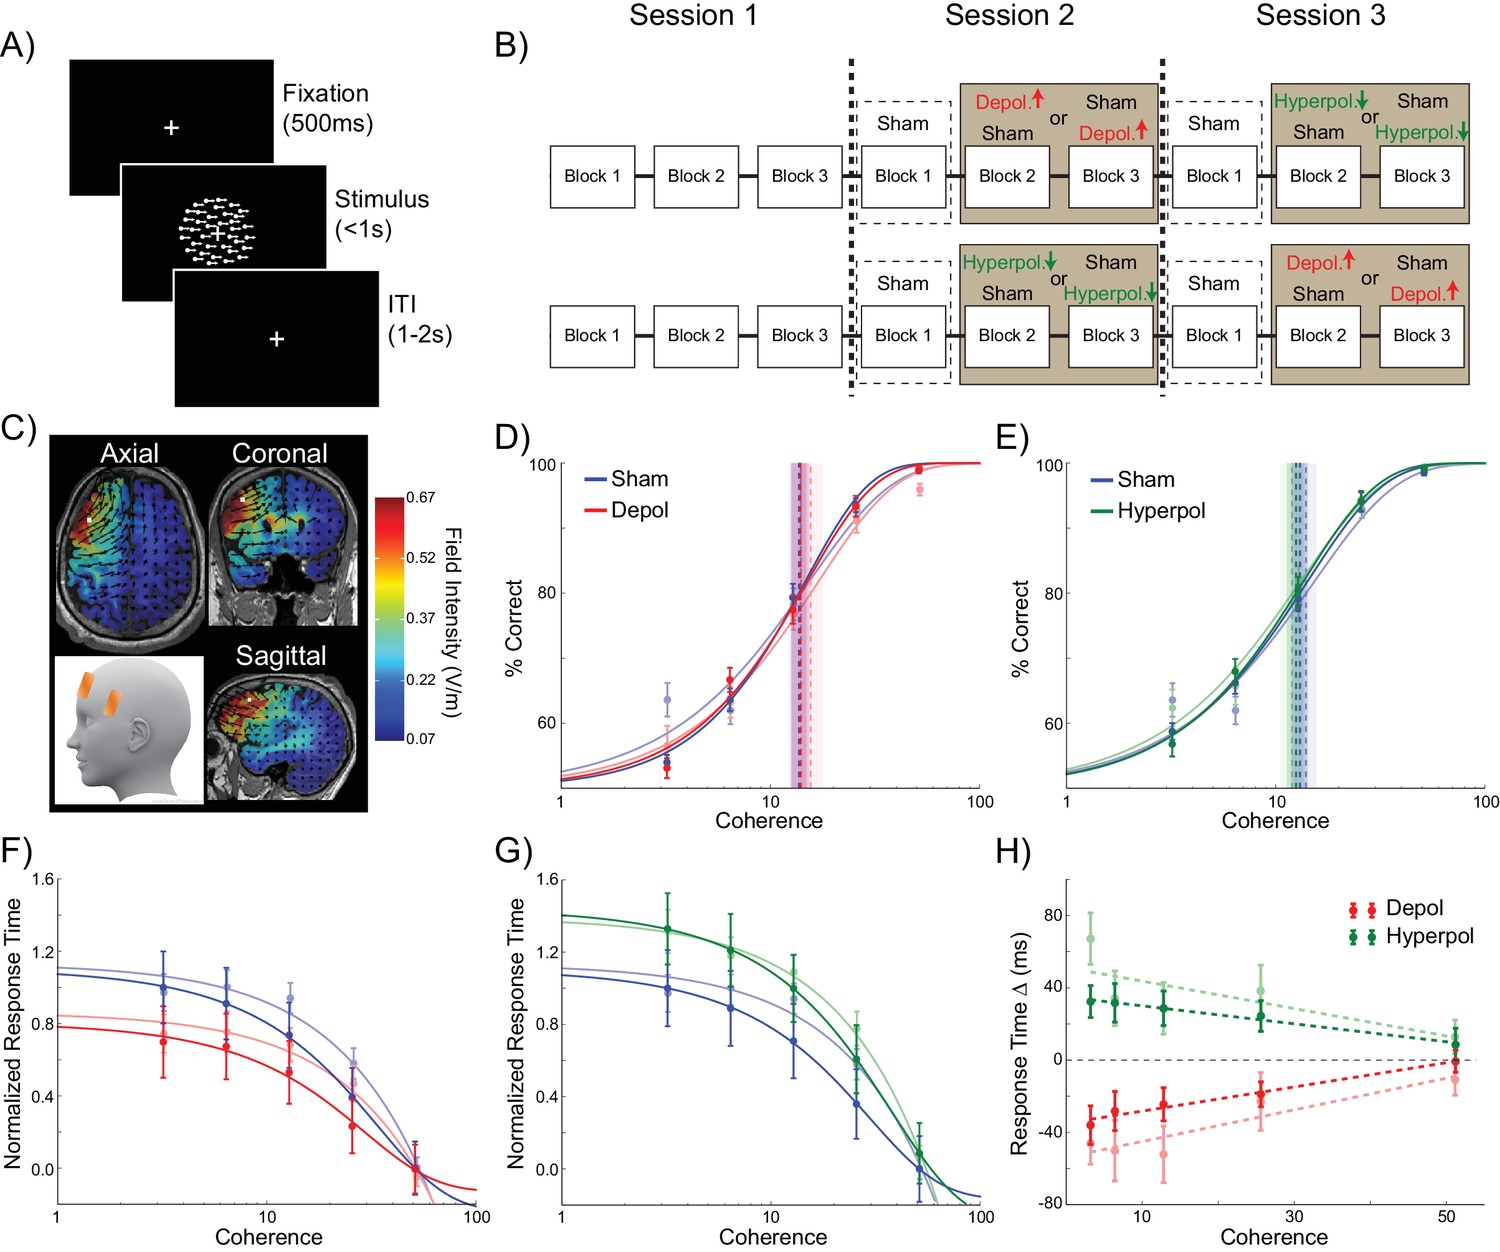
Experiment design and behavioral effects of stimulation in human participants.
(A) Behavioral task. (B) Experimental protocol. (C) Electrode positions and estimated current distribution during left dorsolateral prefrontal stimulation. (D–E) Neither depolarizing nor hyperpolarizing stimulation altered the decision thresholds of human participants (model predictions shown in shaded colors in the background). (F–H) In human participants depolarizing and hyperpolarizing stimulation significantly decreased and increased the decision time, respectively, relative to sham stimulation, matching the model predictions shown in matte colors. See Figure 6—source data 1 for raw data.
-
Figure 6—source data 1
Human participant accuracy and reaction time.
- https://doi.org/10.7554/eLife.20047.016
Figure 7
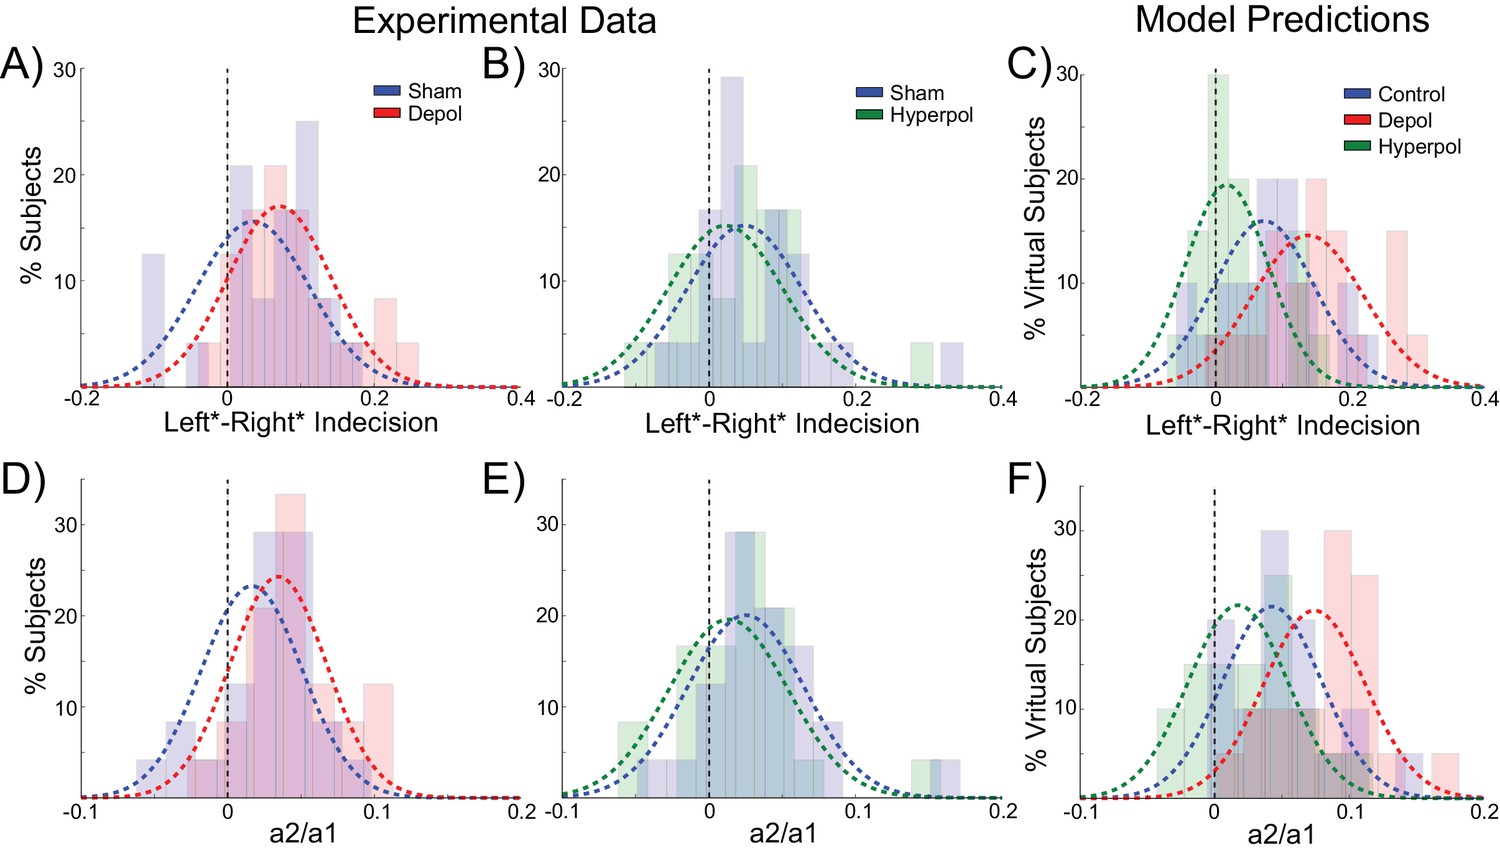
Behavioral effects of stimulation on choice hysteresis.
(A–B) Depolarizing stimulation positively shifted the indecision point in human participants, while hyperpolarization caused the opposite effects, relative to sham stimulation. (C) These results are in line with model predictions (repeated from Figure 2F). (D–E) The relative influence of the previous choice in the current decision of human participants was increased by depolarizing and decreased by hyperpolarizing stimulation, relative to sham. (F) These results are just as predicted by the model (repeated from Figure 2H). See Figure 7—source data 1 for raw data.
-
Figure 7—source data 1
Human participant behavioral choice hysteresis.
- https://doi.org/10.7554/eLife.20047.018
Figure 8
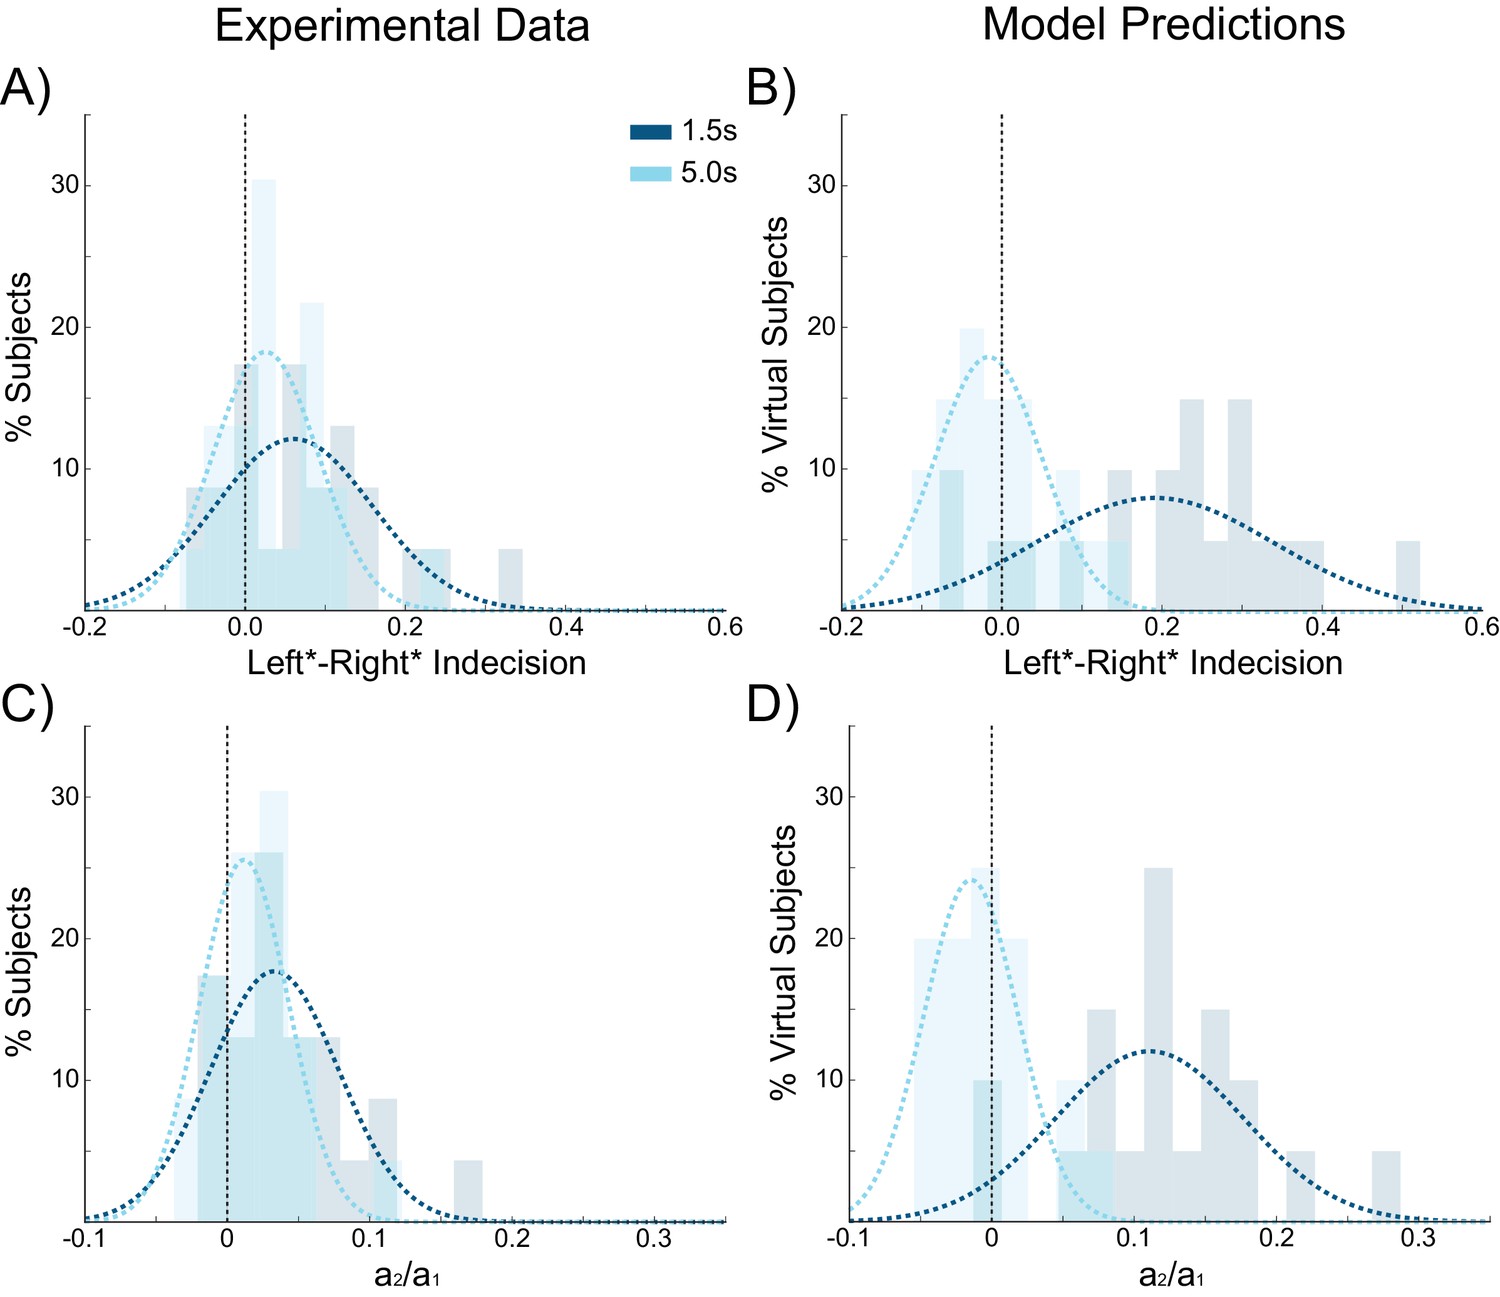
Choice hysteresis in human participants diminishes with longer interstimulus intervals.
(A) The mean of the indecision point in human participants approaches zero with a 5 s interstimulus intervals (ISIs), reflecting a smaller choice hysteresis effect. (B) These results are similar to those predicted by the model (repeated from Figure 4A). (C) The relative influence of the previous choice on the current decision is smaller with a 5 s ISI than a 1.5 s ISI. (D) These results match the predictions of the model (repeated from Figure 4B). See Figure 8—source data 1 for raw data.
-
Figure 8—source data 1
Human participant behavioral choice hysteresis with increasing ISIs.
- https://doi.org/10.7554/eLife.20047.020
Tables
Table 1
Accuracy threshold statistics.
Depolarizing | Hyperpolarizing | |||
|---|---|---|---|---|
W(19) | p | W(19) | P | |
Total task-related input firing rates = 60 Hz | 62 | 0.108 | 67 | 0.156 |
Refresh rate = 30 Hz | 69 | 0.179 | 57 | 0.073 |
Refresh rate = 120 Hz | 34 | 0.008 | 78 | 0.314 |
Inhibitory interneuron stimulation | 76 | 0.279 | 92 | 0.627 |
Pyramidal cell stimulation only | 91 | 0.601 | 89 | 0.55 |
Uniform stimulation | 84 | 0.433 | 43 | 0.021 |
Reinitialization | 81 | 0.37 | 91 | 0.601 |
Accumulator | 53 | 0.052 | 54 | 0.057 |
Table 2
Decision time difference statistics.
Depolarizing | Hyperpolarizing | |||
|---|---|---|---|---|
B1 | p | B1 | p | |
Total task-related input firing rates = 60 Hz | 50.442 | 0.043 | −56.366 | 0.037 |
Refresh rate = 30 Hz | 90.272 | 0.024 | −83.599 | 0.036 |
Refresh rate = 120 Hz | 93.289 | 0.015 | −90.707 | 0.03 |
Inhibitory interneuron stimulation | 106.958 | 0.027 | 16.913 | 0.704 |
Pyramidal cell stimulation only | 87.496 | 0.028 | −77.929 | 0.045 |
Uniform stimulation | 60.71 | 0.157 | 56.522 | 0.168 |
Reinitialization | 72.805 | 0.037 | −83.953 | 0.035 |
Accumulator | 108.859 | <0.001 | −44.87 | 0.008 |
Table 3
Choice hysteresis simulation statistics.
Indecision point shifts (Left*-Right*) | Logistic regression (a2/a1) | |||||||
|---|---|---|---|---|---|---|---|---|
Depolarizing | Hyperpolarizing | Depolarizing | Hyperpolarizing | |||||
W(19) | p | W(19) | p | W(19) | p | W(19) | p | |
Total task-related input firing rates = 60 Hz | 42 | 0.019 | 42 | 0.019 | 50 | 0.04 | 50 | 0.04 |
Refresh rate = 30 Hz | 49 | 0.037 | 32 | 0.006 | 46 | 0.028 | 52 | 0.048 |
Refresh rate = 120 Hz | 38 | 0.013 | 42 | 0.019 | 44 | 0.023 | 31 | 0.006 |
Inhibitory interneuron stimulation only | 65 | 0.135 | 80 | 0.351 | 40 | 0.015 | 62 | 0.108 |
Pyramidal cell stimulation only | 48 | 0.033 | 44 | 0.023 | 48 | 0.033 | 34 | 0.008 |
Uniform stimulation | 79 | 0.332 | 43 | 0.021 | 99 | 0.823 | 73 | 0.232 |
Reinitialization | 74 | 0.247 | 96 | 0.737 | 66 | 0.145 | 95 | 0.709 |
Accumulator | 54 | 0.057 | 95 | 0.709 | 71 | 0.204 | 85 | 0.455 |
Table 4
Parameter values for the competitive attractor model.
Parameter | Description | Value |
|---|---|---|
GAMPA(ext) | Maximum conductance of AMPA synapses from task-related inputs | 1.6nS |
GAMPA(background) | Maximum conductance of AMPA synapses from background inputs | 2.1nS (pyramidal cells), 1.53nS (interneurons) |
GAMPA(rec) | Maximum conductance of AMPA synapses from recurrent inputs | 0.05nS (pyramidal cells), 0.04nS (interneurons) |
GNMDA | Maximum conductance of NMDA synapses | 0.145nS (pyramidal cells), 0.13nS (interneurons) |
GGABA-A | Maximum conductance of GABAA synapses | 1.3nS (pyramidal cells), 1.0nS (interneurons) |
τAMPA | Decay time constant of AMPA synaptic conductance | 2 ms |
τ1-NMDA | Rise time constant of NMDA synaptic conductance | 2 ms |
τ2-NMDA | Decay time constant of NMDA synaptic conductance | 100 ms |
τGABA-A | Decay time constant of GABAA synaptic conductance | 5 ms |
[Mg2+] | Extracellular magnesium concentration | 1 mM |
EAMPA | Reversal potential of AMPA-induced currents | 0 mV |
ENMDA | Reversal potential of NMDA-induced currents | 0 mV |
EGABA-A | Reversal potential of GABAA-induced currents | −70 mV |
C | Membrane capacitance | 0.5nF (pyramidal cells), 0.2nF (interneurons) |
gL | Leak conductance | 25nS (pyramidal cells), 20nS (interneurons) |
EL | Resting potential | −70 mV |
ΔT | Slope factor | 3 mV |
VT | Voltage threshold | −55 mV |
Vs | Spike threshold | −20 mV |
Vr | Voltage reset | −53 mV |
τr | Refractory period | 2 ms (pyramidal cells), 1 ms (interneurons) |
Download links
A two-part list of links to download the article, or parts of the article, in various formats.
Downloads (link to download the article as PDF)
Open citations (links to open the citations from this article in various online reference manager services)
Cite this article (links to download the citations from this article in formats compatible with various reference manager tools)
Response repetition biases in human perceptual decisions are explained by activity decay in competitive attractor models
eLife 5:e20047.
https://doi.org/10.7554/eLife.20047


