MEF2C regulates cortical inhibitory and excitatory synapses and behaviors relevant to neurodevelopmental disorders
- Medical University of South Carolina, United States
- Harvard Medical School, United States
- The University of Texas Southwestern Medical Center, United States
- Medical Scientist Training Program, The University of Texas Southwestern Medical Center, United States
Figures
Figure 1 with 1 supplement
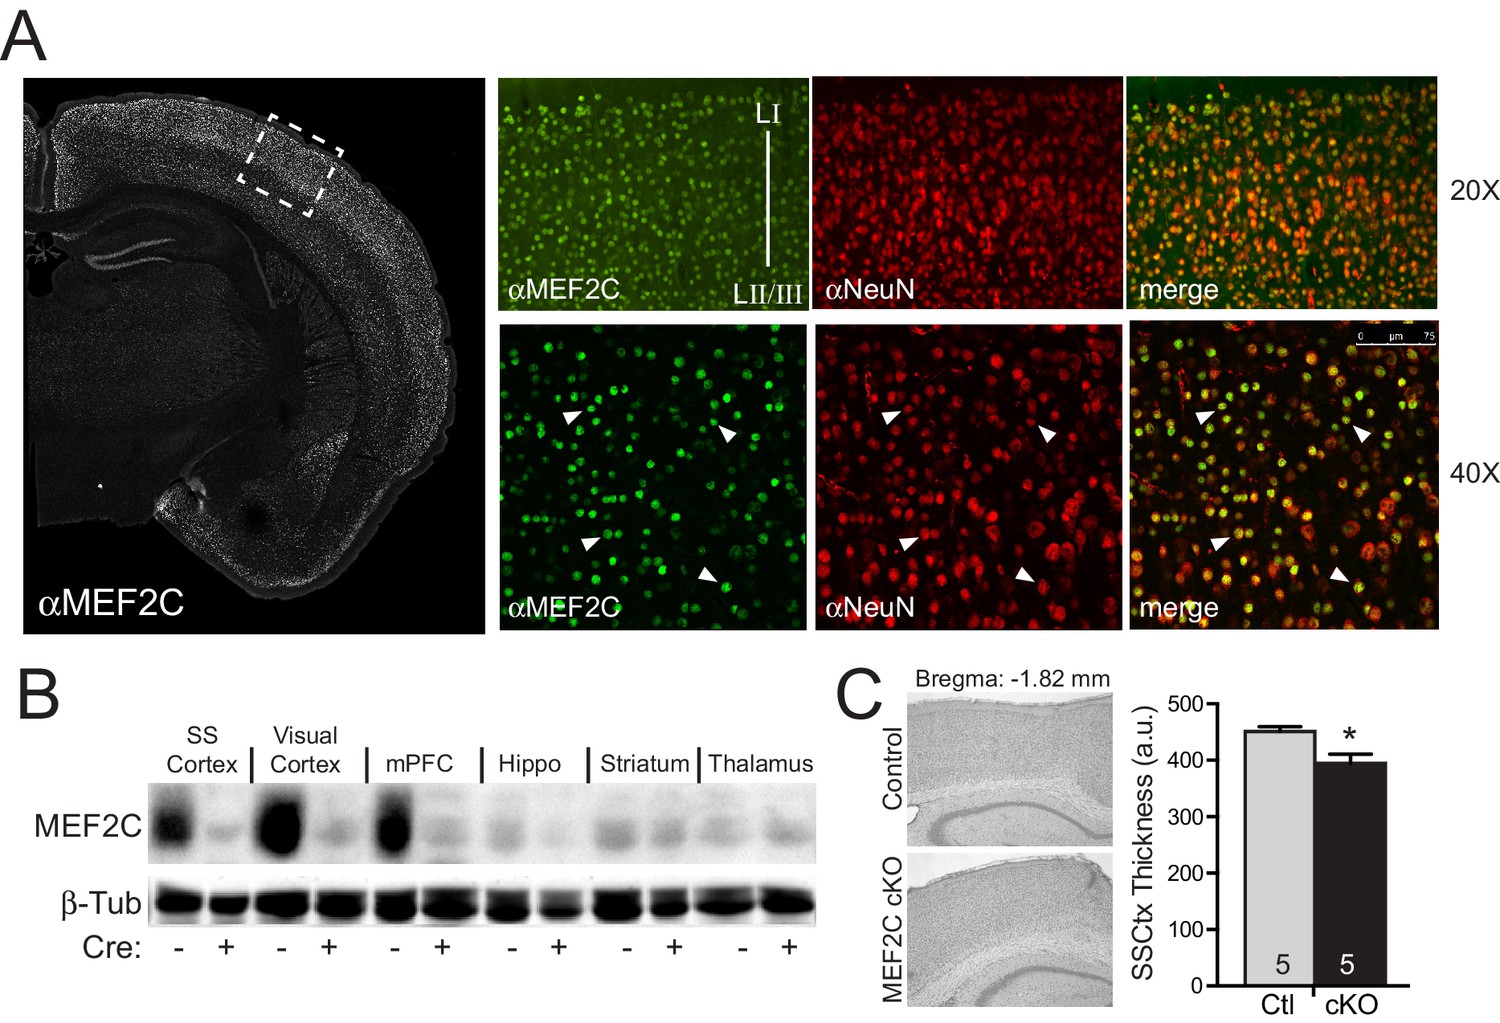
Generation of Mef2c cKO mice.
(A) MEF2C protein (green) is enriched in NeuN-positive cortical neurons (red). (B) Western blot of MEF2C in various brain regions. (C) Somatosensory cortical thickness was slightly reduced in Mef2c cKO brains (~10%) compared to control littermates. Thickness was averaged over 4 slices/brain from 5 brains per genotype. Data are represented as mean ± SEM. Statistical significance was determined by unpaired t-test. *p<0.05, ns=not significant.
Figure 1—figure supplement 1
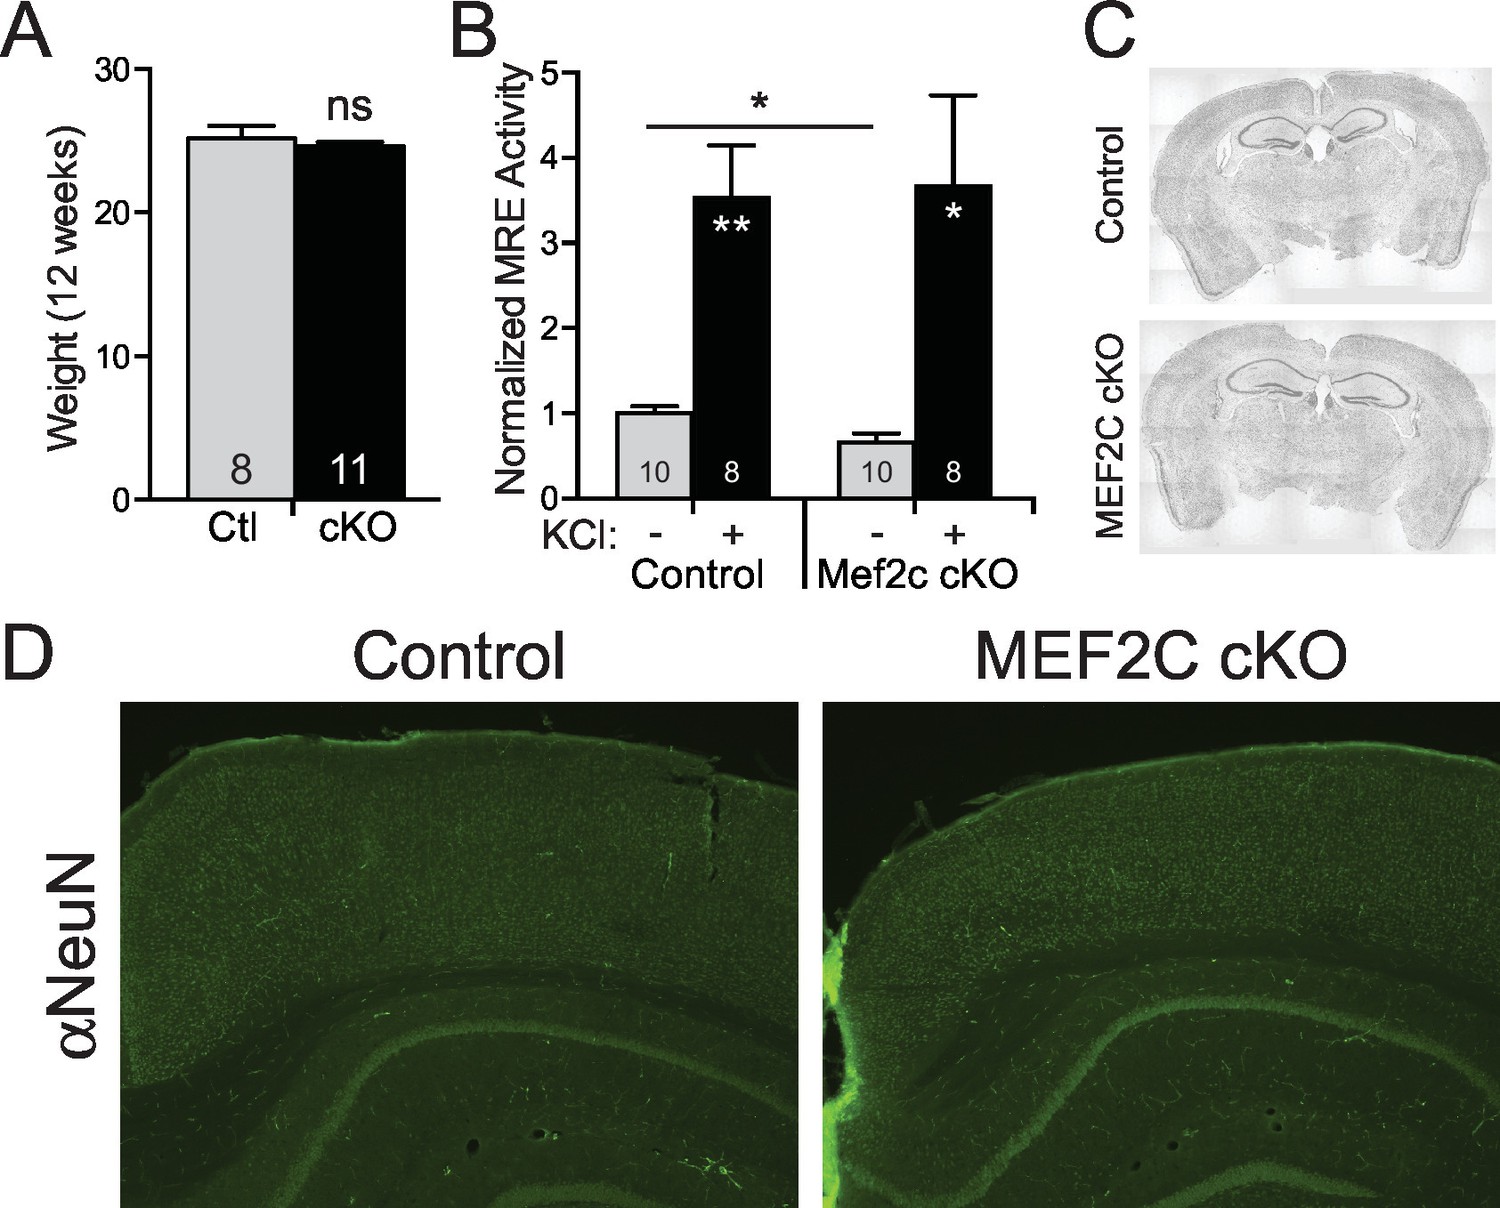
Neuronal characterization of Mef2c cKO mice.
(A) There was no difference in body weight between Mef2c cKO mice and control littermates during behavioral testing (12 weeks). (B) Basal MEF2 transcriptional activity is reduced by ~40% in Mef2c cKO neuronal cultures, and neuronal depolarization with KCl (60 mM) promotes MEF2 activity in both control and Mef2c cKO cultures. Cortical cultures from control and Mef2c cKO animals were transfected with MEF2-response element (MRE)-Luciferase at DIV5, and activity was monitored at DIV7. (C) Nissl staining of adult control and Mef2c cKO brains show no gross morphological changes in the brain. (D) NeuN staining of adult control and Mef2c cKO brains reveal normal neuronal migration and layering. Data are represented as mean ± SEM. Statistical significance was determined by unpaired t-test. *p<0.05, **p<0.005, ns=not significant.
Figure 2
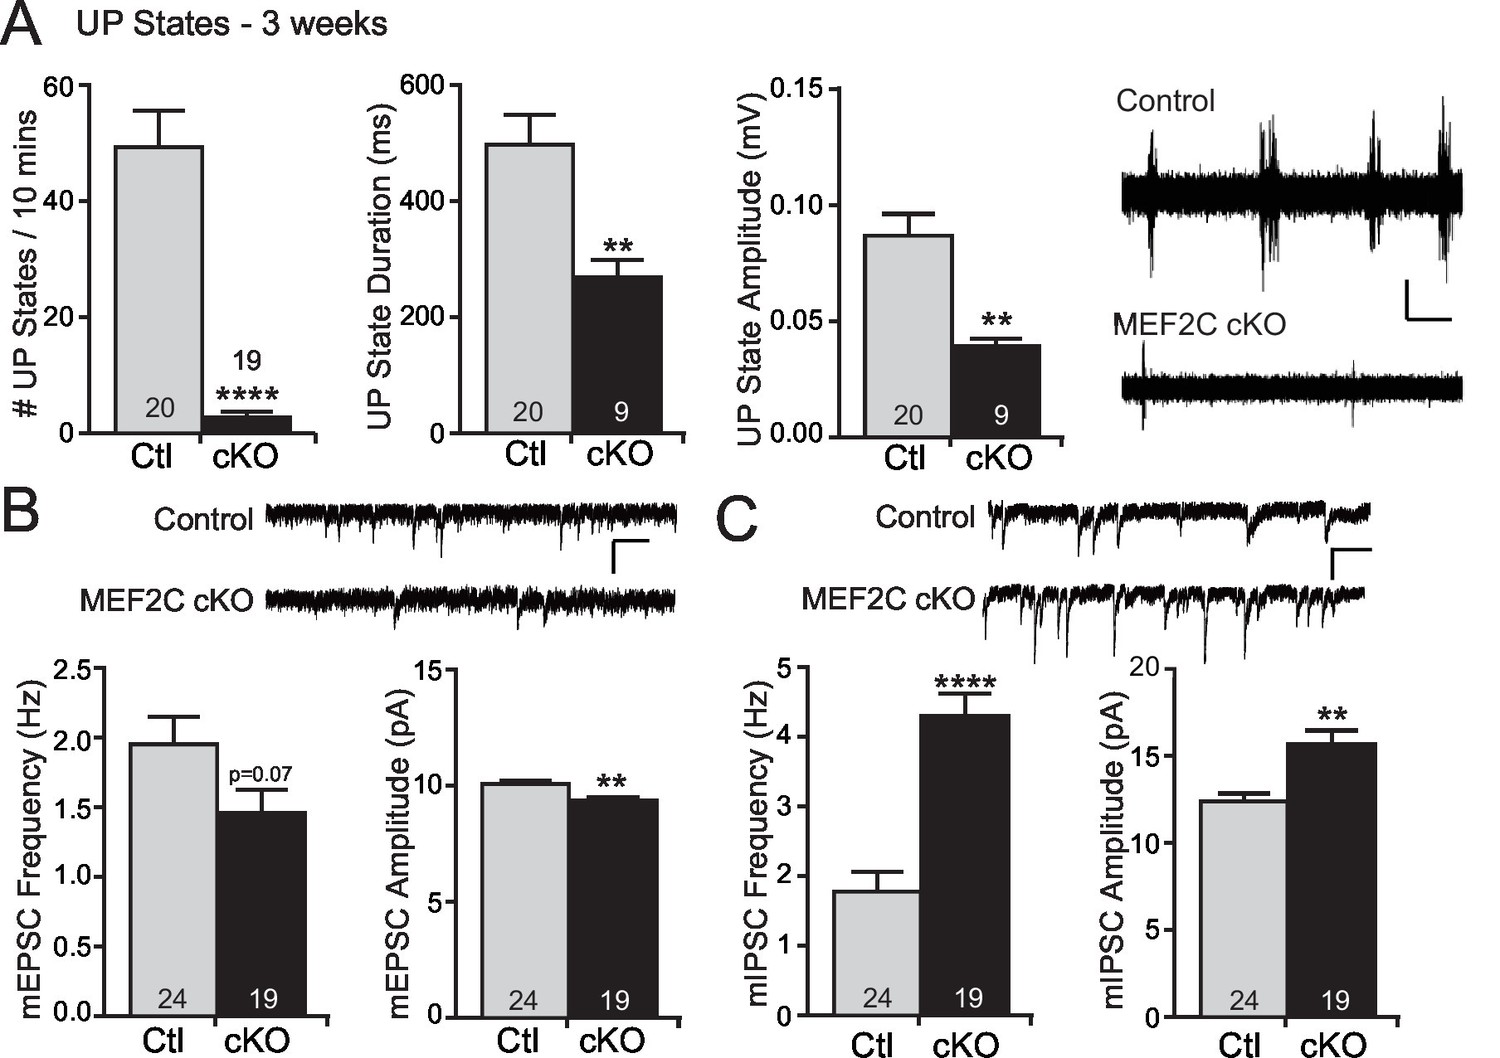
Increased cortical inhibition in Mef2c cKO mice.
(A) UP states in 3-week old Mef2c cKO mice. Mef2c cKO mice have fewer spontaneous UP states than control mice. Additionally, the duration and amplitude of each spontaneous UP state was significantly reduced in the Mef2c cKO mice. Representative recordings from control and Mef2c cKO organotypic slices. Scale bar = 50 µV/1 s. (B) Mef2c cKO mice have reduced mEPSC frequency and amplitude in cortical layer 2/3 pyramidal neurons from 3-week old mice. Scale bar = 200 ms/10 pA. (C) Mef2c cKO mice have increased mIPSC frequency and amplitude in cortical layer 2/3 pyramidal neurons from 3-week old mice. Scale bar = 200 ms/10 pA. Data are represented as mean ± SEM. Statistical significance was determined by unpaired t-test using GraphPad Prism. *p<0.05, **p<0.01, ****p<0.0001. Numbers of slices/neurons (n) are reported in each bar for respective experiment.
Figure 3 with 1 supplement
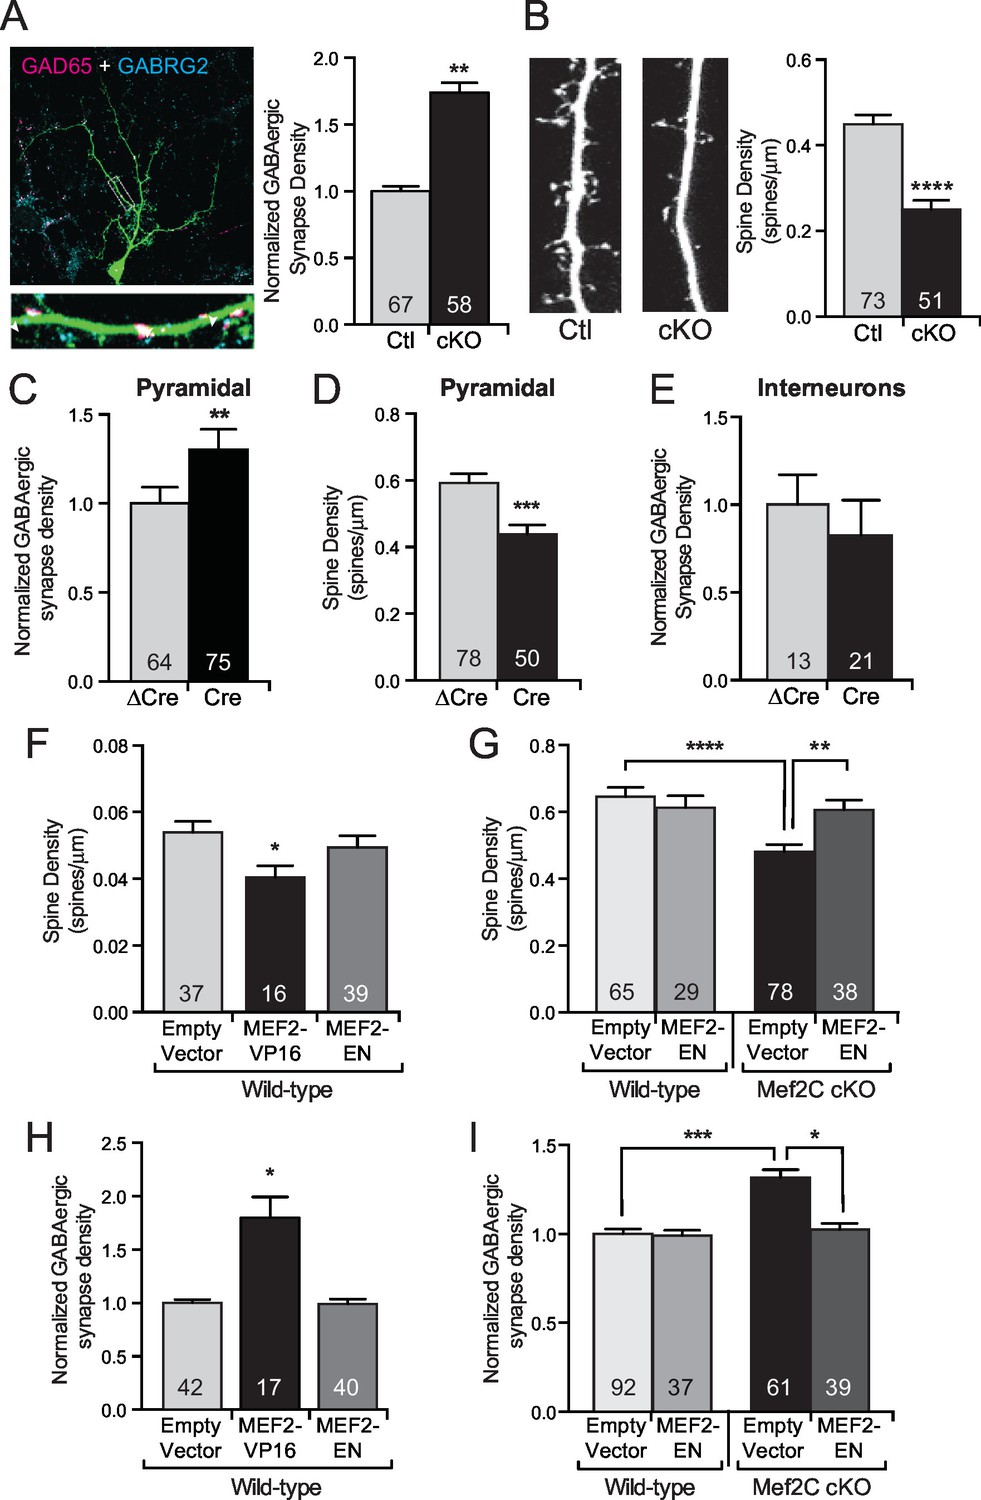
MEF2C functions as a transcriptional repressor to regulate synapse development in postsynaptic cortical pyramidal neurons.
(A) Representative image of a GFP expressing mouse cortical neuron immunostained with antibodies against GAD65 (pre-synaptic) and GABRG2 (post-synaptic). Quantification of inhibitory synapse density (see Materials and methods) on Mef2c cKO neurons showed an increase compared to wildtype control neurons. (B) Representative image of spine density across a dendritic stretch. Quantification of spine density on Mef2c cKO neurons showed a reduction compared to wildtype control neurons. (C) Quantified GABAergic synapse density onto Mef2cfl/flcortical pyramidal neurons transfected at DIV4 with either Cre-GFP (Cre) or an enzyme-dead mutant of Cre-GFP (ΔCre). (D) Quantified spine density onto Mef2cfl/fl cortical pyramidal neurons transfected at DIV4 with either Cre-GFP (Cre) or an enzyme-dead mutant of Cre-GFP (ΔCre). (E) Quantified GABAergic synapse density onto Mef2cfl/flGAD65 positive interneurons transfected at DIV4 with either Cre-GFP (Cre) or an enzyme-dead mutant of Cre-GFP (ΔCre). (F) Quantified spine density onto WT cortical pyramidal neurons transfected at DIV4 with either an empty vector, a constitutive transcriptional promoting form of MEF2C (MEF2-VP16), or a constitutive transcription repressor form of MEF2C (MEF2-EN). (G) Quantified spine density onto wildtype or Mef2c cKO neurons transfected with either an empty vector or MEF2-EN. (H) Quantified GABAergic synapse density onto WT cortical pyramidal neurons transfected at DIV4 with an empty vector, a constitutive transcriptional promoting form of MEF2C (MEF2-VP16), or a constitutive transcription repressor form of MEF2C (MEF2-EN). (I) Quantified GABAergic synapse density onto wildtype or Mef2c cKO neurons transfected with an empty vector or MEF2-EN. Data are represented as mean ± SEM. Number (n) of neurons (A,C,E,H,I) or of dendritic stretches (B,D,F,G) are reported in each bar. Statistical significance was determined by unpaired t-test (A–E), One-way ANOVA (F,H) or Two-way ANOVA (G,I) using GraphPad Prism. *p<0.05, **p<0.01, ***p<0.001, ****p<0.0001. Also see Figure 3—figure supplement 1.
Figure 3—figure supplement 1
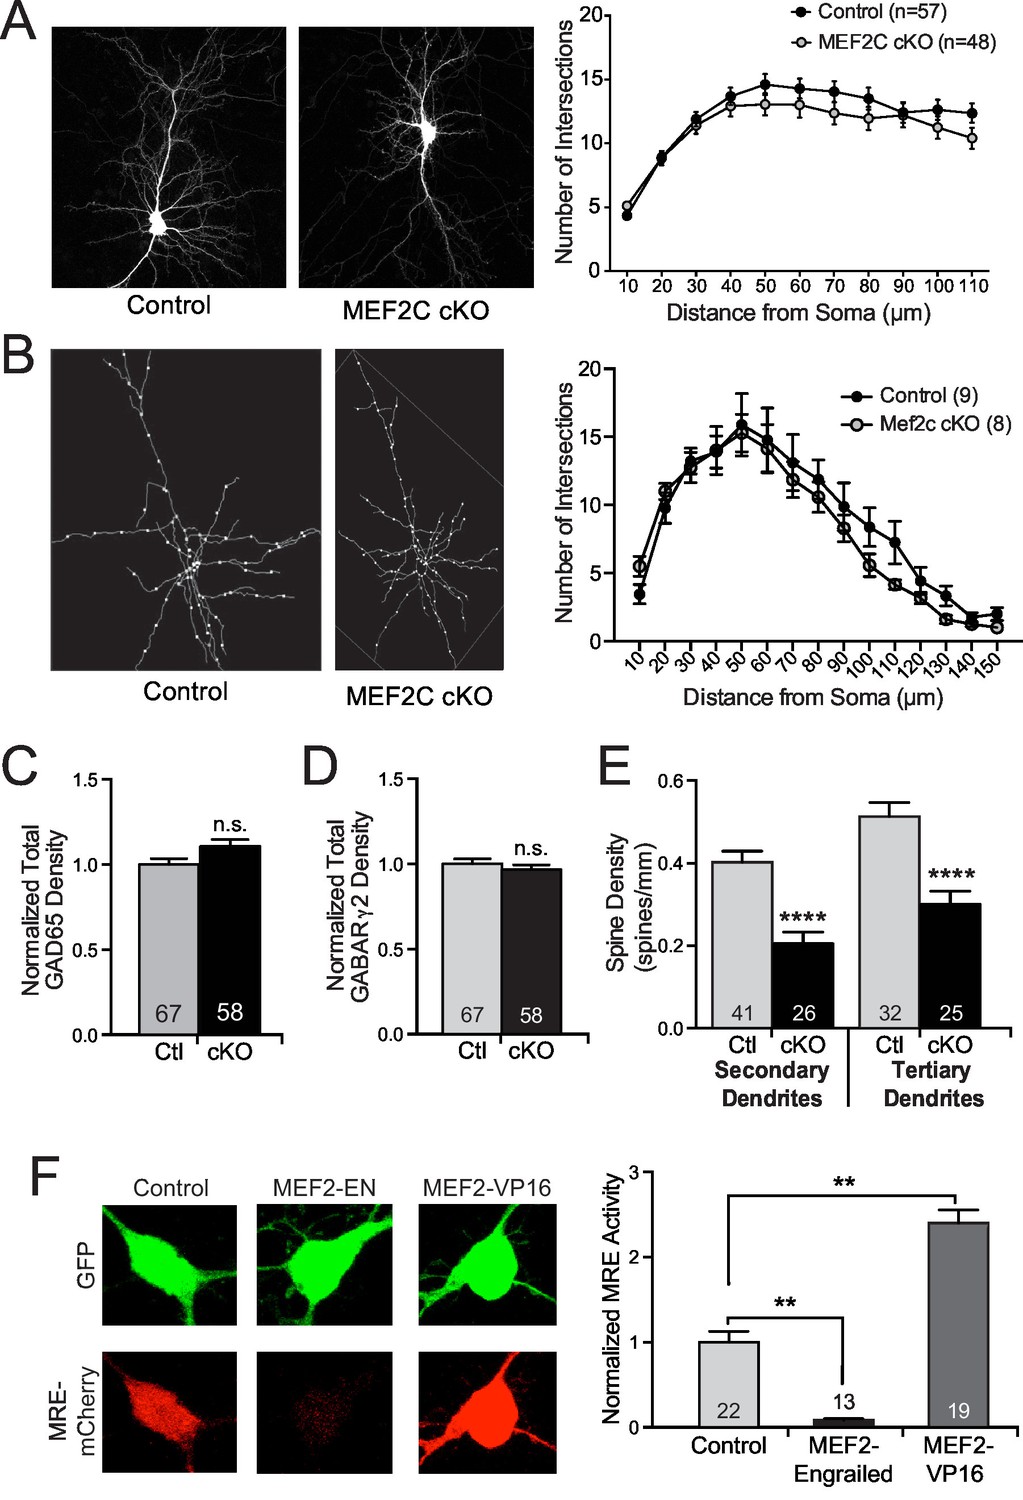
Structural synaptic changes in Mef2c cKO neurons.
(A) Representative images of GFP-transfected primary cortical neurons at DIV18. Sholl analysis of pyramidal neurons at DIV18 reveals no significant changes in dendritic complexity in Mef2c cKO neurons in vitro. n=57 neurons for control and n=48 neurons for Mef2c cKO. (B) Representative traces of in vivo golgi-stained cortical layer 2/3 pyramidal neurons from somatosensory cortex in adult mice. Sholl analysis of pyramidal neurons reveals no significant changes in dendritic complexity by genotype. n=9 neurons from 3 control animals and n=8 neurons from 3 Mef2c cKO animals. (C−D) Immunocytochemical analysis of inhibitory GAD65-presynaptic (B) and GABARγ2-postsynaptic (C) puncta in cultured cortical neurons at DIV18. Cortical neurons from Mef2c cKO mice show no change in inhibitory presynaptic puncta (GAD65 positive) or postsynaptic puncta (GABARγ2 positive) compared to controls as measured by co-localization of GAD65 (presynaptic) and GFP (neuron mask). (E) Mef2c cKO neurons have fewer dendritic spines than control neurons. Primary cortical neurons were grown to DIV18, and spines were visualized using myristoylated-GFP. Reduced spine density was observed in both secondary and tertiary dendrites, resulting in an overall reduction in spine density in all dendrites (Figure 3B). Numbers of dendritic stretches (n) are reported in each bar from at least 30 control and 22 Mef2c cKO neurons. (F) MEF2C-Engrailed and MEF2C-VP16 regulate MEF2 transcriptional activity in cultured cortical neurons. (left) Representative images of 3XMRE-mCherry expression in cortical neurons transfected with either empty vector, MEF2C-EN or MEF2C-VP16. (right) Quantification of average 3XMRE-mCherry intensity normalized to GFP intensity. Data are represented as mean ± SEM. Statistical significance was determined by repeated measures ANOVA (A,B), unpaired t-test (C–E), or one-way ANOVA followed by Kruskal-Wallis post-hoc test (F). **p<0.01, ****p<0.0001, ns=not significant.
Figure 4 with 1 supplement
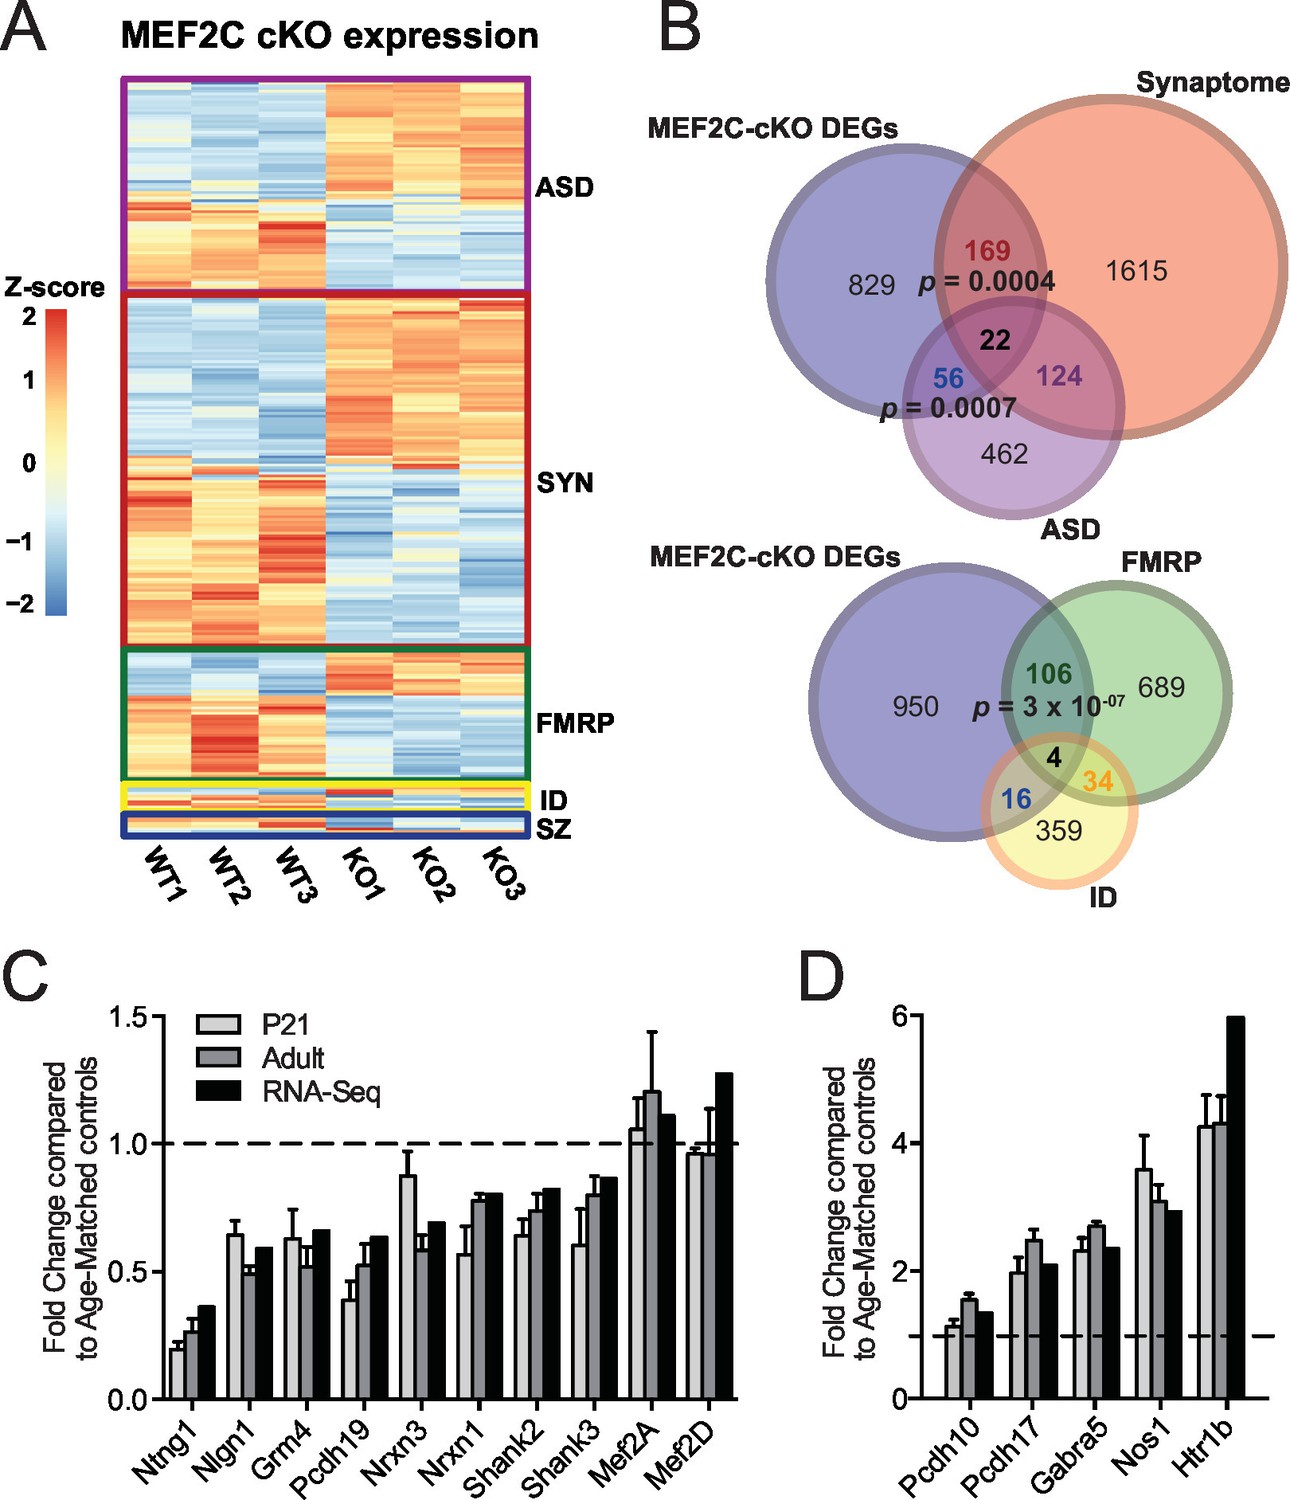
Characterization of Mef2c cKO RNA-Seq differentially expressed genes.
(A) Heatmap showing the disorder-related genes differentially expressed in Mef2c cKO (KO) compared with wild-type (WT). In red, genes with higher expression; in blue, genes with lower expression. (B) Overlap between Mef2c cKO DEGs and gene sets of interest. Marked, the overlap p-values. Number of genes for each gene sets are indicated. (C) Relative expression of selective down-regulated ASD-associated genes from Mef2c cKO DEGs compared to controls. Both RNA-Seq and qPCR (P21 and Adult) show similar expression changes for most genes. (D) Relative expression of selective up-regulated Mef2c cKO DEGs compared to controls. Both RNA-Seq and qPCR (P21 and Adult) show similar expression changes. Data are represented as mean ± SEM. See Materials and methods for statistical analysis. n=3 animals/genotype for RNA-Seq; n=6 animals/genotype for adult qPCR; n=6 control and n=4 Mef2c cKO for P21 qPCR. Also see Tables 1, Supplementary file 1 and Figure 4—figure supplement 1.
Figure 4—figure supplement 1
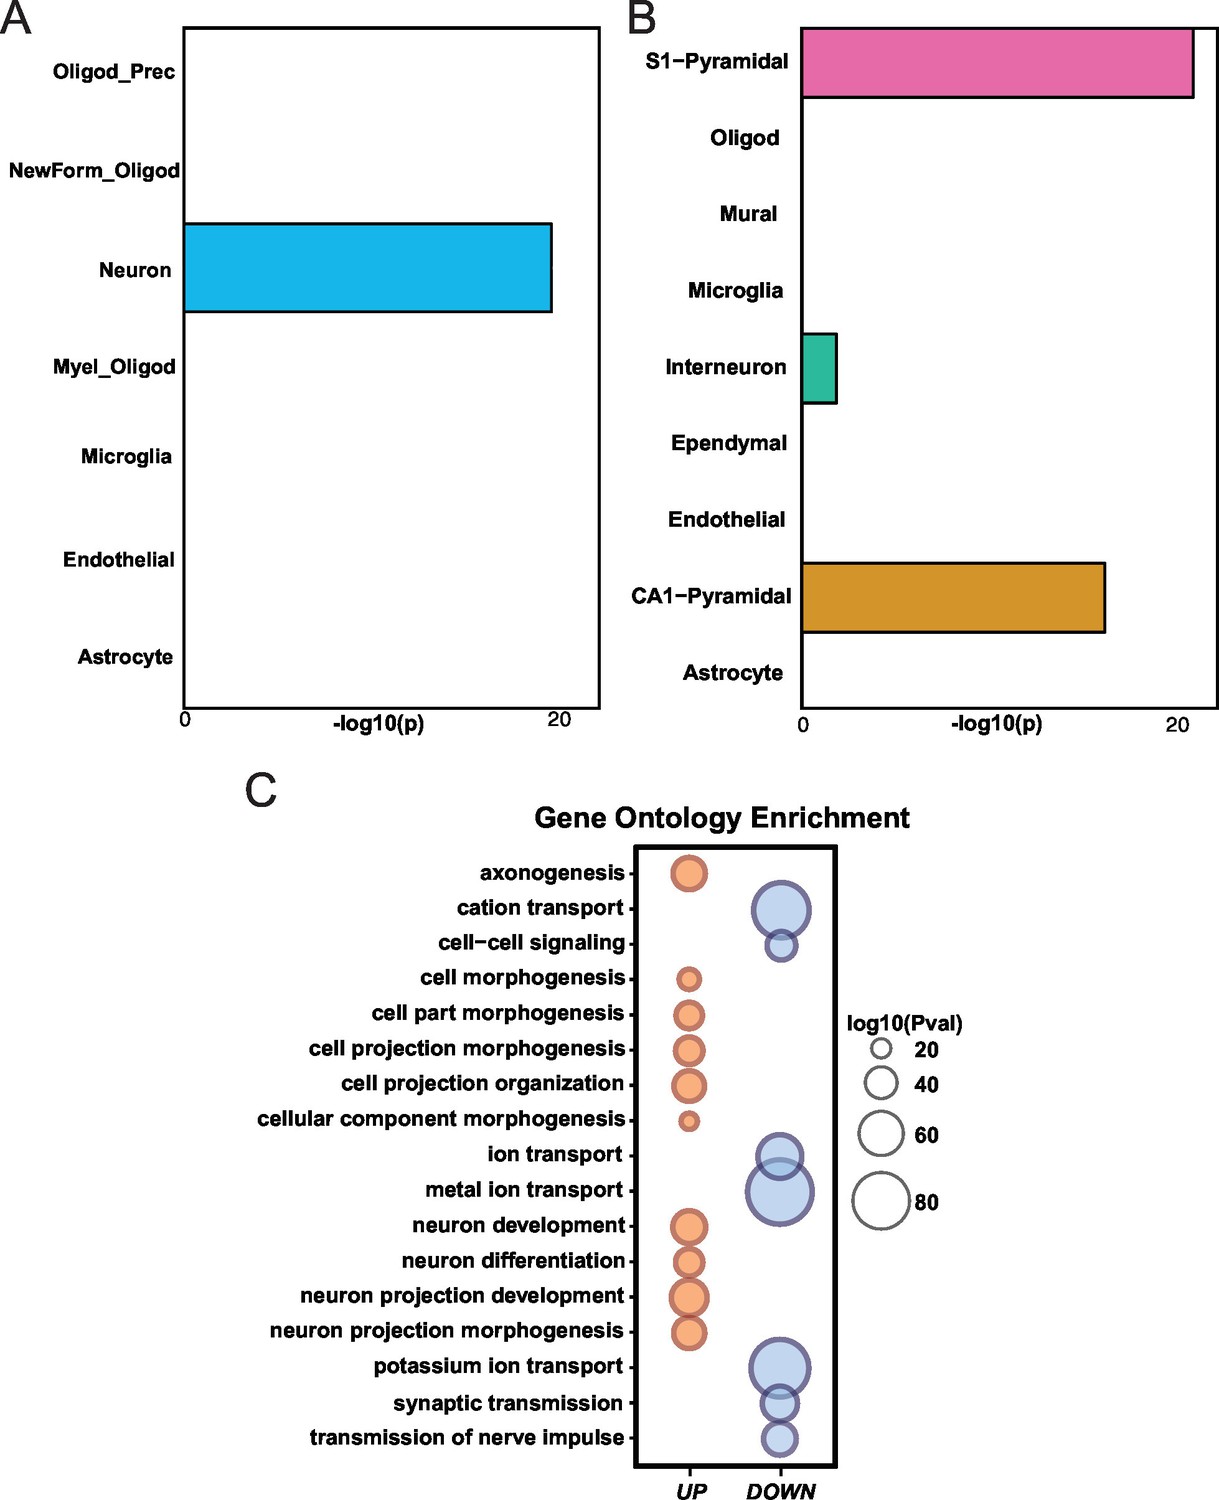
Differential gene expression in Mef2c cKO cortical tissue.
(A) Mef2c cKO DEGs were significantly enriched for neuron-specific genes. (B) Mef2c cKO DEGs were significantly enriched for S1-Pyramidal and CA1-Pyramidal neurons. Gene ontology enrichment for Mef2c cKO DEGs. In red, the up-regulated genes; in blue, the down-regulated genes. Circle size is correlated with the adjusted p-value. Gene ontology categories are alphabetically listed on the y-axis. Differentially expressed genes showed enrichment for categories involved in neuronal development and synaptic transmission.
Figure 5 with 1 supplement
Social behavior abnormalities in Mef2c cKO mice.
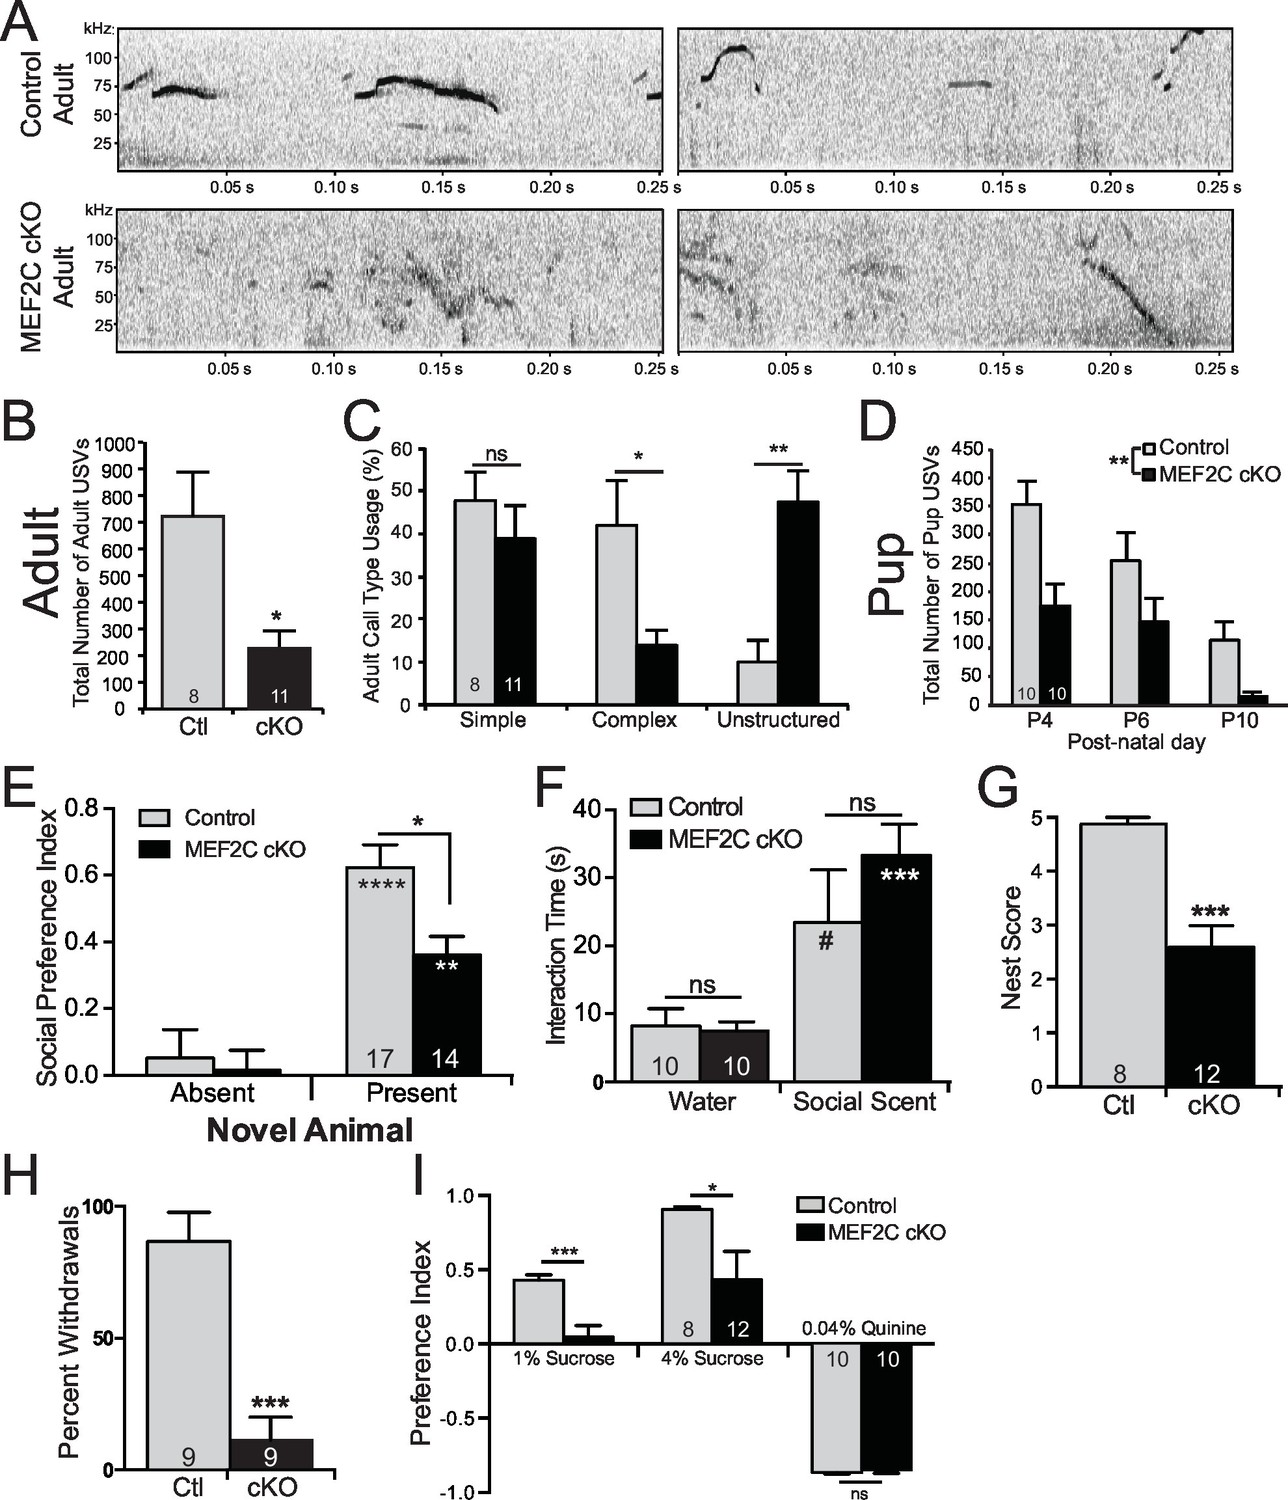
(A) Representative spectrograms of ultrasonic vocalizations (USVs) recorded from adult male mice in the presence of an estrous female mouse. (B) Adult Mef2c cKO male mice emit fewer USVs to an estrous female than control littermates. (C) Adult Mef2c cKO male mice show different call types than control littermates. Mef2c cKO mice have more unstructured USVs (%) and fewer complex USVs than control mice. Representative images of call types and further breakdown of USV sub-type are presented in Figure 5—figure supplement 1A,B. (D) Juvenile Mef2c cKO mice (pups) emit fewer USVs during maternal separation than control littermates. USVs were recorded on postnatal days (P) 4, 6, and 10. (E) Mef2c cKO mice show reduced preference for interacting with a novel social target. (F) Mef2c cKO mice show normal olfactory response to novel social scent. (G) Mef2c cKO mice fail to build structured nest when utilizing a nest score system (Deacon, 2006). (H) Mef2c cKO mice induce control littermates to withdrawal in the tube test for social dominance in >90% of trials. (I) Mef2c cKO mice show reduced preference for a natural reward, sucrose. Both genotypes showed aversion to the bitter solution, 0.04% quinine. Data are represented as mean ± SEM. Statistical significance was determined by unpaired t-test (B,G,H–I) or 2-way ANOVA with Sidak’s post-hoc comparison (C–F). #p<0.1, *p<0.05, **p<0.005, ***p<0.0005, ns=not significant. Numbers of animals (n) are reported in each bar for respective experiment. Also see Figure 5—figure supplement 1.
Figure 5—figure supplement 1

Characterization of Mef2c cKO mouse USVs.
(A) Representative images of the different classes of call types, modified from previous studies (Shalizi and Bonni, 2005). Example of different USV types: Short/Simple (flat and upward), Complex (1-Frequency jump and complex), and Unstructured (mixed and unstructured), respectively. (B) Breakdown of the call usage frequency of each sub-type of USVs emitted by adult Mef2c cKO male mice to an estrous female mouse. (C) Adult Mef2c cKO male mice take longer to emit the first USV to an estrous female. (D) No significant difference in the average duration of each adult USV was observed between control and Mef2c cKO mice. (E) No change in USV amplitude was recorded at either the start or end of each call. (F) The average maximum amplitude of USVs was not different between control and Mef2c cKO mice. (G) Mean frequency of adult USVs at the start and end of each call. While both genotypes show the same average start frequency for each USV, control mouse USVs ended at a higher frequency than the call started while Mef2c cKO mice show reduced frequency at the end of the call. (H) The average maximum frequency for USVs was reduced in Mef2c cKO mice compared to control mice. (I) No significant differences in the duration of USVs from pups during maternal separation were recorded. (J) No difference in the call types (simple, complex, unstructured) was observed between control and Mef2c cKO juvenile mice. (K) Mef2c cKO mice show reduced time interacting with a social target in a 2-choice interaction assay. Time spent interacting with a social target (novel mouse) and novel object (black paper binder) are reported. Solid bars represent empty holding cages (targets absent). Striped bars represent targets present (mouse and object). Data are represented as mean ± SEM. Statistical significance was determined by unpaired t-test (B–D,F,H) or 2-way ANOVA (E,G,J–K). #p<0.10, *p<0.05, **p<0.005, ****p<0.0001. ns = not significant. Numbers of animals (n) are reported in each bar for adult and juvenile mouse USV and social interaction experiments.
Figure 6 with 1 supplement
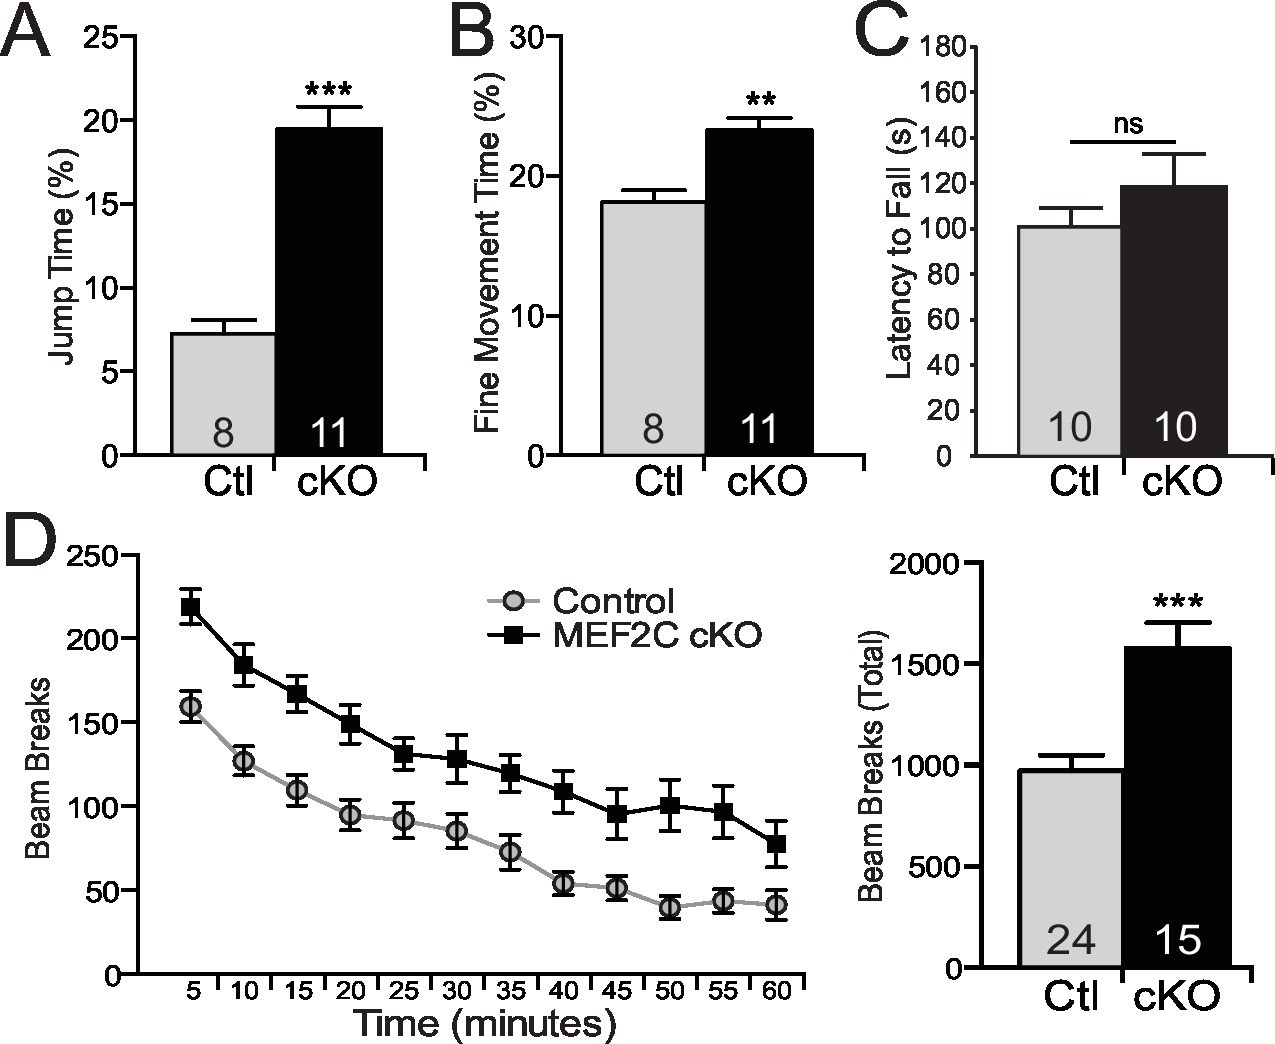
Repetitive behaviors and hyperactivity in Mef2c cKO mice.
(A) Mef2c cKO mice spend more time jumping than control animals in an operant chamber over a 1-hr interval. (B) Mef2c cKO mice have more fine motor movements in an operant chamber, reflective of stereotypic activity. (C) Latency to fall off an accelerating rotarod is not different in the Mef2c cKO mice. (D) Mef2c cKO mice are hyperactive compared to control littermates. Activity was monitored for 1 hr, and data is plotted by beam breaks/5 min (left) and cumulative beam breaks (right). Data are represented as mean ± SEM. Statistical significance was determined by unpaired t-test (A–D) or 2-way ANOVA (D). **p<0.005, ***p<0.0005, ns=not significant. Numbers of animals (n) are reported in each bar for respective experiment.
Figure 6—figure supplement 1

Mef2c cKO mice do not exhibit repetitive grooming or digging.
(A) No difference in time spent grooming is observed in Mef2c cKO mice compared to controls. (B) No difference in the number of digging bouts was observed between control and Mef2c cKO mice. Data are represented as mean ± SEM. Statistical significance was determined by unpaired t-test. ns=not significant. Numbers of animals (n) are reported in each bar for respective experiment.
Figure 7
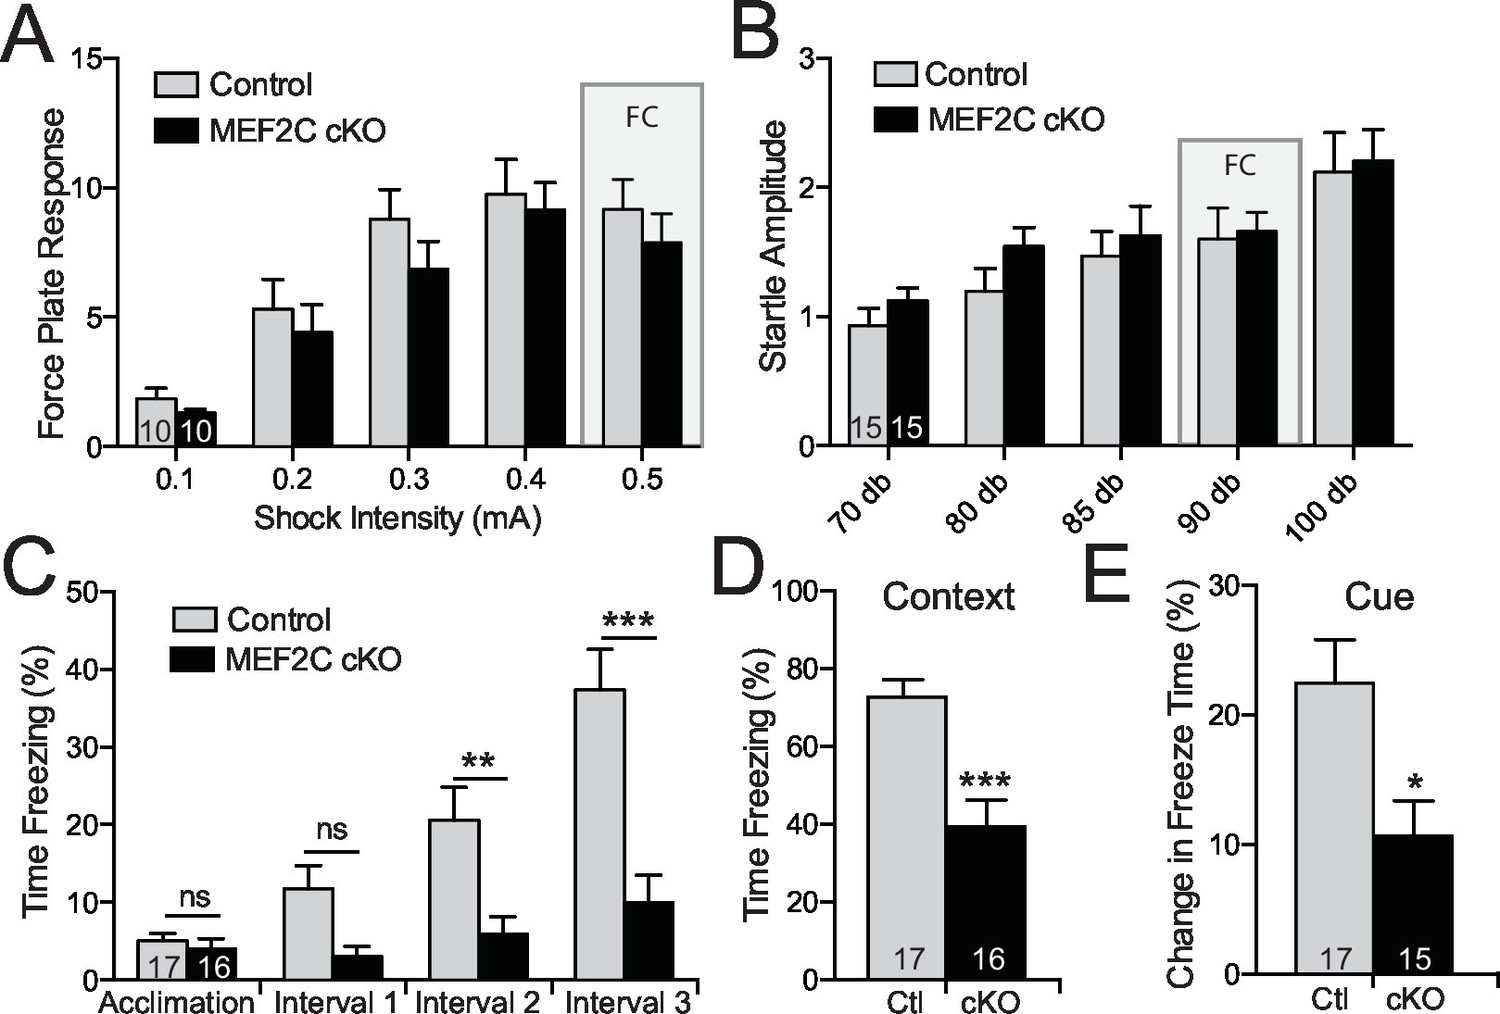
Cognitive deficits in Mef2c cKO mice.
(A–B) Both control and Mef2c cKO mice showed similar force plate response to various intensities of shock (A) or acoustic startle (B). Grey bars highlight the intensities used in fear conditioning (FC). (C) During training for fear conditioning, Mef2c cKO mice fail to increase freezing during the 1-minute intervals after each tone/shock pairing. (D) Fear Conditioning. Mef2c cKO mice show deficits in contextual memory. (E) Fear Conditioning. In a novel context, Mef2c cKO mice show deficits in cue-dependent memory. Data are represented as mean ± SEM. Statistical significance was determined by 2-way ANOVA (A–C) or unpaired t-test (D,E). *p<0.05, **p<0.005, ***p<0.0005, ns=not significant. Numbers of animals (n) are reported in each bar for respective experiment.
Tables
Table 1
Gene-ontology of Mef2c cKO DEGs.
| Category | Term | Count | Benjamini | log |
|---|---|---|---|---|
| UP | neuron projection development | 22 | 2.49E-05 | 46.03800653 |
| UP | neuron development | 24 | 7.33E-05 | 41.34896025 |
| UP | axonogenesis | 18 | 9.25E-05 | 40.33858267 |
| UP | neuron projection morphogenesis | 18 | 0.00014 | 38.53871964 |
| UP | cell projection organization | 24 | 0.000175 | 37.56961951 |
| UP | cell morphogenesis involved in neuron differentiation | 18 | 0.000181 | 37.42321425 |
| UP | cell projection morphogenesis | 18 | 0.00055 | 32.59637311 |
| UP | neuron differentiation | 26 | 0.000569 | 32.44887734 |
| UP | cell morphogenesis involved in differentiation | 18 | 0.000822 | 30.85128182 |
| UP | cell part morphogenesis | 18 | 0.000822 | 30.85128182 |
| UP | cell morphogenesis | 20 | 0.008075242 | 20.92844454 |
| UP | cellular component morphogenesis | 20 | 0.03538264 | 14.51209766 |
| DOWN | potassium ion transport | 28 | 7.00E-09 | −8.15E+01 |
| DOWN | metal ion transport | 44 | 5.62E-10 | −92.50263684 |
| DOWN | cation transport | 45 | 1.63E-08 | 7.79E+01 |
| DOWN | ion transport | 50 | 1.25E-06 | −59.03089987 |
| DOWN | synaptic transmission | 21 | 3.13E-05 | −45.04455662 |
| DOWN | transmission of nerve impulse | 23 | 7.95E-05 | –40.99632871 |
| DOWN | cell-cell signaling | 25 | 0.00035 | −34.55931956 |
Additional files
-
Supplementary file 1
Gene expression in SSC of Mef2c cKO mice.
- https://doi.org/10.7554/eLife.20059.016
Download links
A two-part list of links to download the article, or parts of the article, in various formats.
Downloads (link to download the article as PDF)
Open citations (links to open the citations from this article in various online reference manager services)
Cite this article (links to download the citations from this article in formats compatible with various reference manager tools)
MEF2C regulates cortical inhibitory and excitatory synapses and behaviors relevant to neurodevelopmental disorders
eLife 5:e20059.
https://doi.org/10.7554/eLife.20059


