The genome of the crustacean Parhyale hawaiensis, a model for animal development, regeneration, immunity and lignocellulose digestion
- University of Oxford, United Kingdom
- Janelia Farm Research Campus, United States
- Imperial College London, United Kingdom
- Centre National de la Recherche Scientifique (CNRS) and É cole Normale Supé rieure de Lyon, France
- University of California, United States
- Howard Hughes Medical Institute, University of California, United States
- Harvard University, United States
- Smithsonian National Museum of Natural History, United States
- Institut fur Biologie,Humboldt-Universitat zu Berlin, Germany
Figures
Figure 1
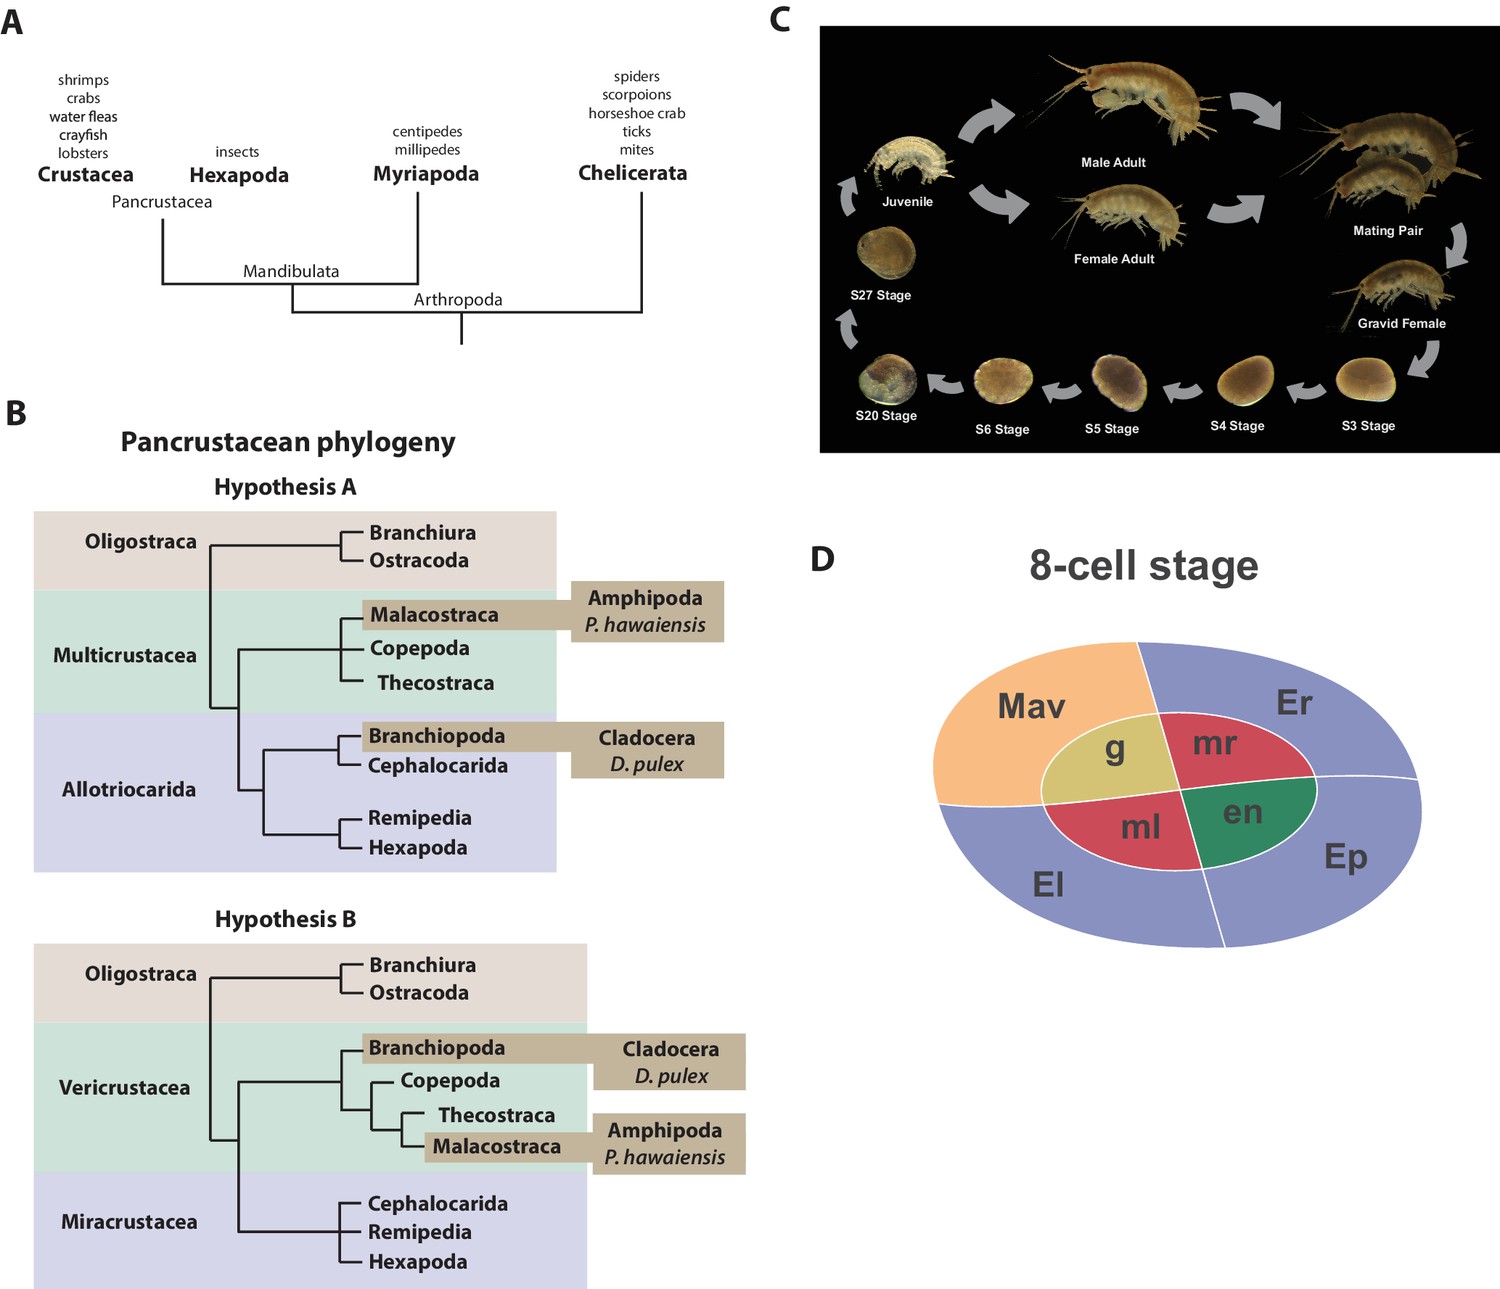
Introduction.
(A) Phylogenetic relationship of Arthropods showing the Chelicerata as an outgroup to Mandibulata and the Pancrustacea clade which includes crustaceans and insects. Species listed for each clade have ongoing or complete genomes. Species include Crustacea: Parhyale hawaiensis, D. pulex; Hexapoda: Drosophila melanogaster, Apis mellifera, Bombyx mori, Aedis aegypti, Tribolium castaneum; Myriapoda: Strigamia maritima, Trigoniulus corallines; Chelicerata: Ixodes scapularis, Tetranychus urticae, Mesobuthus martensii, Stegodyphus mimosarum. (B) One of the unresolved issues concerns the placement of the Branchiopoda either together with the Cephalocarida, Remipedia and Hexapoda (Allotriocarida hypothesis A) or with the Copepoda, Thecostraca and Malacostraca (Vericrustacea hypothesis B). (C) Life cycle of Parhyale that takes about two months at 26C. Parhyale is a direct developer and a sexually dimorphic species. The fertilized egg undergoes stereotyped total cleavages and each blastomere becomes committed to a particular germ layer already at the 8-cell stage depicted in (D). The three macromeres Er, El, and Ep give rise to the anterior right, anterior left, and posterior ectoderm, respectively, while the fourth macromere Mav gives rise to the visceral mesoderm and anterior head somatic mesoderm. Among the 4 micromeres, the mr and ml micromeres give rise to the right and left somatic trunk mesoderm, en gives rise to the endoderm, and g gives rise to the germline.
Figure 2
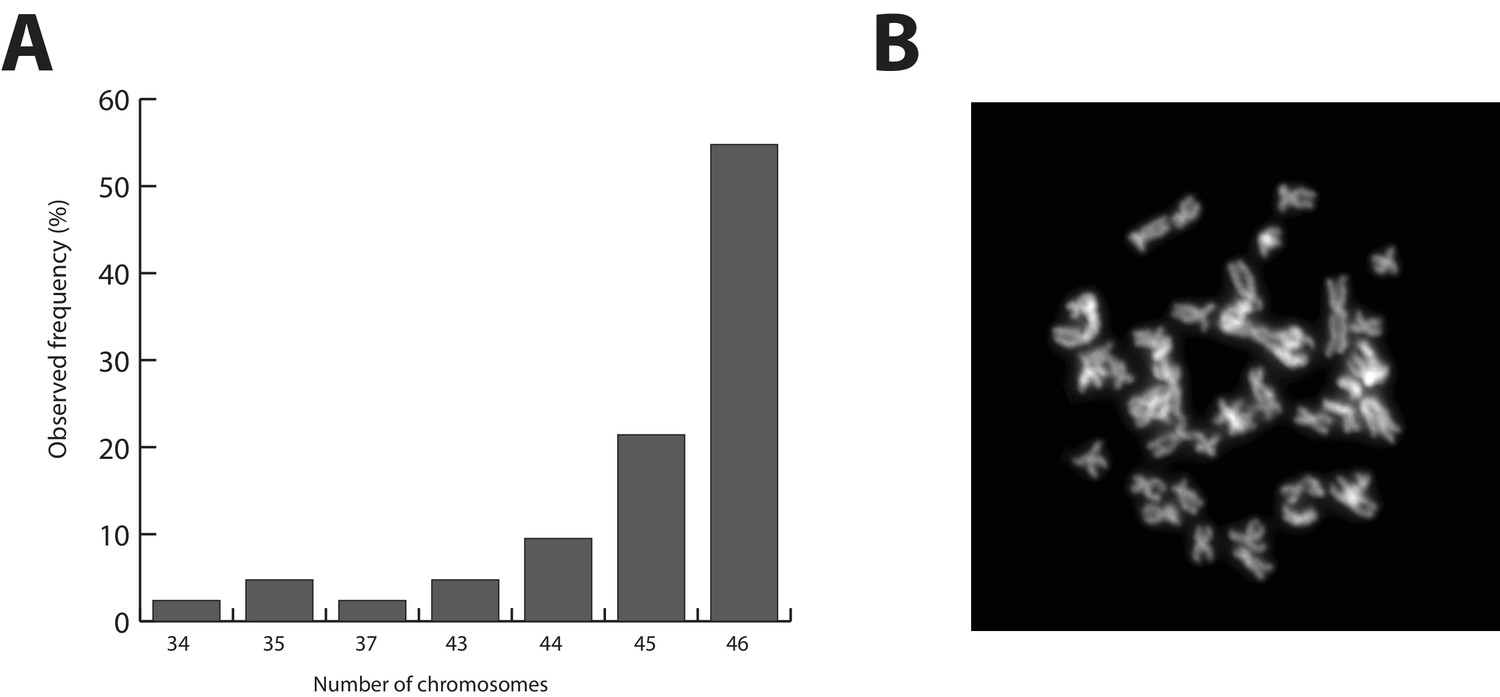
Parhyale karyotype.
(A) Frequency of the number of chromosomes observed in 42 mitotic spreads. Forty-six chromosomes were observed in more than half of all preparations. (B) Representative image of Hoechst-stained chromosomes.
Figure 3
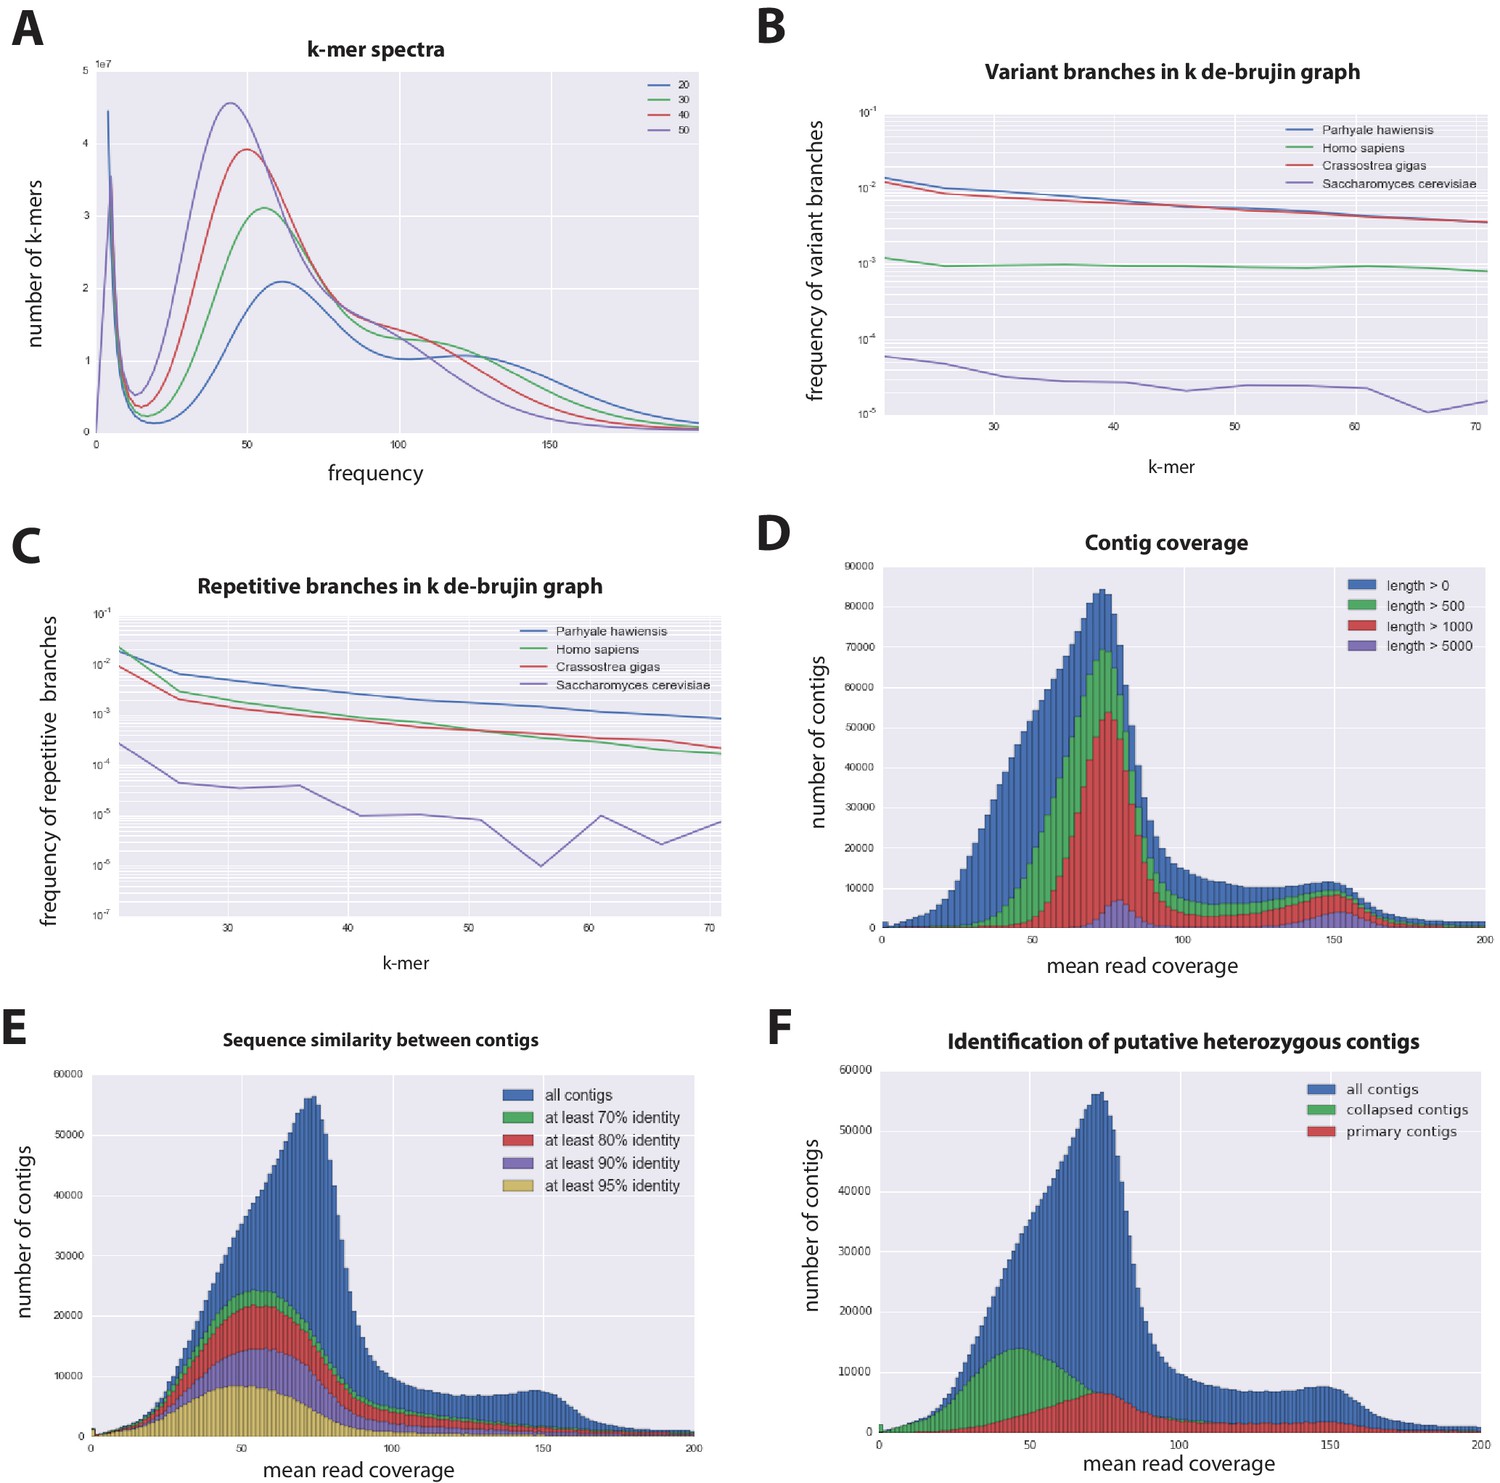
Parhyale genome assembly metrics.
(A) K-mer frequency spectra of all reads for k-lengths ranging from 20 to 50. (B) K-mer branching analysis showing the frequency of k-mer branches classified as variants compared to Homo sapiens (human), Crassostrea gigas (oyster), and Saccharomyces cerevisiae (yeast). (C) K-mer branching analysis showing the frequency of k-mer branches classified as repetitive compared to H. sapiens, C. gigas and S. cerevisiae. (D) Histogram of read coverages of assembled contigs. (E) The number of contigs with an identity ranging from 70–95% to another contig in the set of assembled contigs. (F) Collapsed contigs (green) are contigs with at least 95% identity with a longer primary contig (red). These contigs were removed prior to scaffolding and added back as potential heterozygous contigs after scaffolding.
Figure 4 with 1 supplement
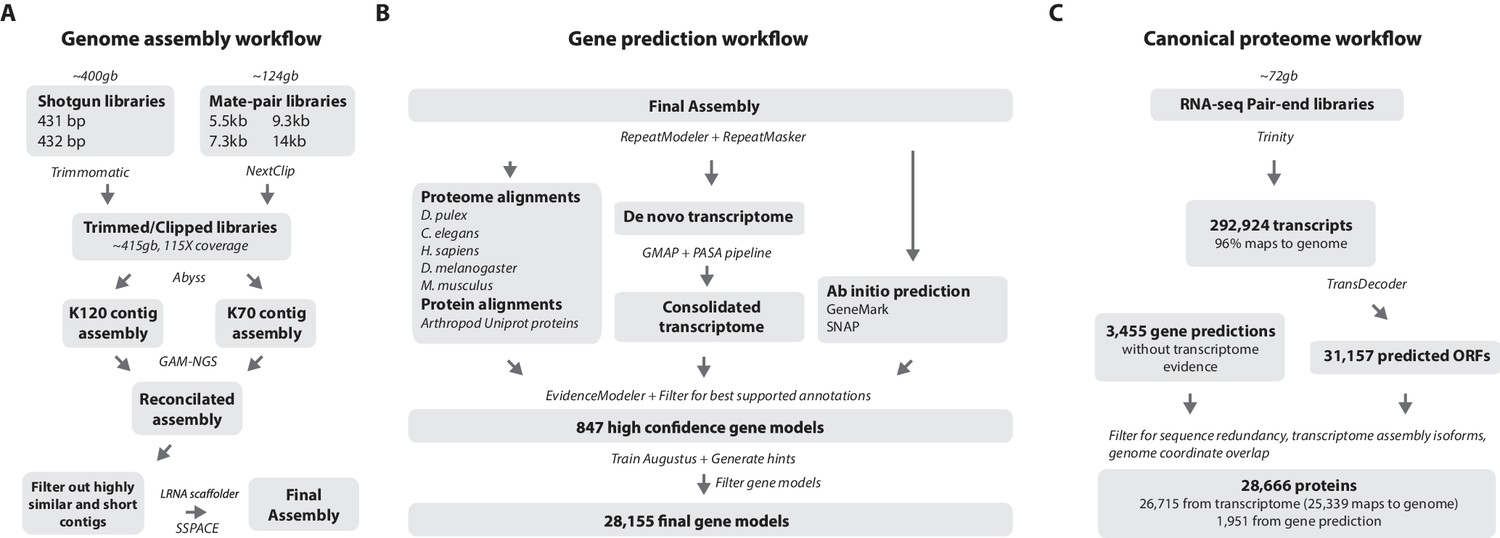
Workflows of assembly, annotation, and proteome generation.
(A) Flowchart of the genome assembly. Two shotgun libraries and four mate-pair libraries with the indicated average sizes were prepared from a single male animal and sequenced to a predicted depth of 115x coverage after read filtering, based on a predicted size of 3.6 Gbp. Contigs were assembled at two different k-lengths with Abyss and the two assemblies were merged with GAM-NGS. Filtered contigs were scaffolded with SSPACE. (B) The final scaffolded assembly was annotated with a combination of Evidence Modeler to generate 847 high quality gene models and Augustus for the final set of 28,155 predictions. These protein-coding gene models were generated based on a Parhyale transcriptome consolidated from multiple developmental stages and conditions, their homology to the species indicated, and ab initio predictions with GeneMark and SNAP. (C) The Parhyale proteome contains 28,666 entries based on the consolidated transcriptome and gene predictions. The transcriptome contains 292,924 coding and non-coding RNAs, 96% of which could be mapped to the assembled genome.
-
Figure 4—source data 1
Catalog of repeat elements in Parhyale genome assembly.
Description of repeat content in the Parhyale genome.
- https://doi.org/10.7554/eLife.20062.008
-
Figure 4—source data 2
Software and Data.
List of programs and bioinformatic tools and publicly available sequence data used in this study.
- https://doi.org/10.7554/eLife.20062.009
Figure 4—figure supplement 1
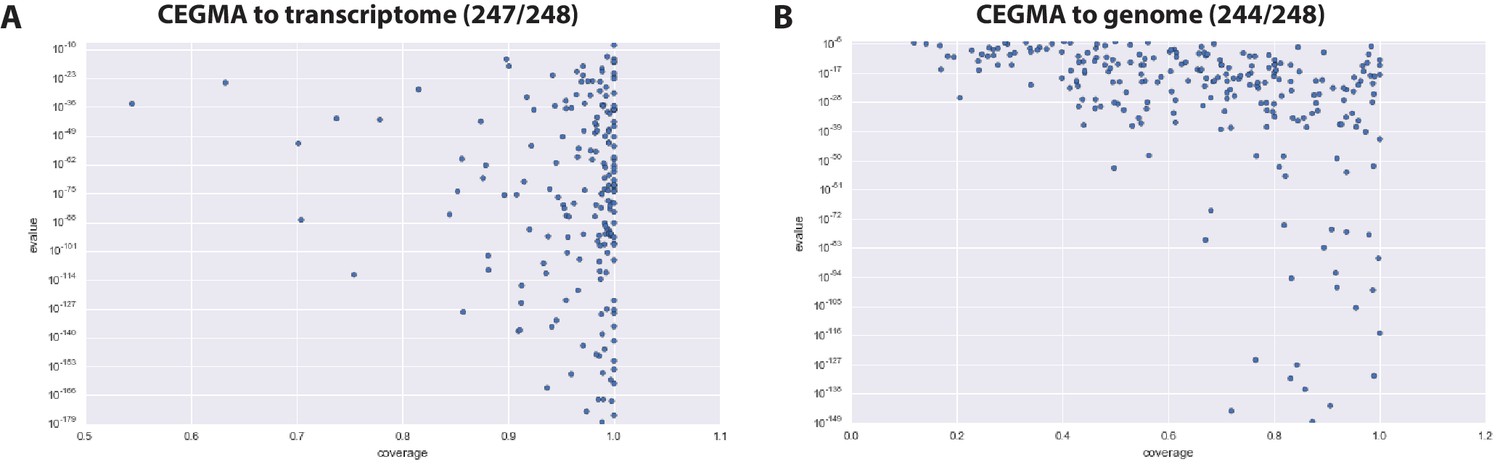
CEGMA assessment of Parhyale transcriptome and genome.
(A) CEGMA genes present in the transcriptome assembly scored by BLAST identity (y axis) and proportion of coverage (relative length, x axis) (B) CEGMA genes present in the genome assembly scored by BLAST identity (y axis) and proportion of coverage (relative length, x axis). In this analysis coverage reduced.
Figure 5 with 1 supplement

Parhyale genome comparisons.
(A) Box plots comparing gene sizes between Parhyale and humans (H. sapiens), water fleas (D. pulex), flies (D. melanogaster) and nematodes (C. elegans). Ratios were calculated by dividing the size of the top blast hit in each species with the corresponding Parhyale gene size. (B) Box plots showing the distribution of intron sizes in the same species used in A. (C) Comparison between Parhyale and representative proteomes from the indicated animal taxa. Colored bars indicate the number of blast hits recovered across various thresholds of E-values. The top hit value represents the number of proteins with a top hit corresponding to the respective species. (D) Cladogram showing the number of shared orthologous protein groups at various taxonomic levels, as well as the number of clade-specific groups. A total of 123,341 orthogroups were identified with Orthofinder across the 16 genomes used in this analysis. Within Pancrustacea, 37 orthogroups were shared between Branchiopoda and Hexapoda (supporting the Allotriocarida hypothesis) and 49 orthogroups were shared between Branchiopoda and Amphipoda (supporting the Vericrustacea hypothesis).
-
Figure 5—source data 1
List of proteins currently unique to Parhyale.
List of proteins in Parhyale without identity to other species.
- https://doi.org/10.7554/eLife.20062.013
-
Figure 5—source data 2
List of genes likely to be specific to the Malacostraca
List of genes likely to be specific to the Malacostraca.
- https://doi.org/10.7554/eLife.20062.014
-
Figure 5—source data 3
Orthofinder analysis.
Orthofinder analysis using the Parhyale predicted proteome.
- https://doi.org/10.7554/eLife.20062.015
Figure 5—figure supplement 1
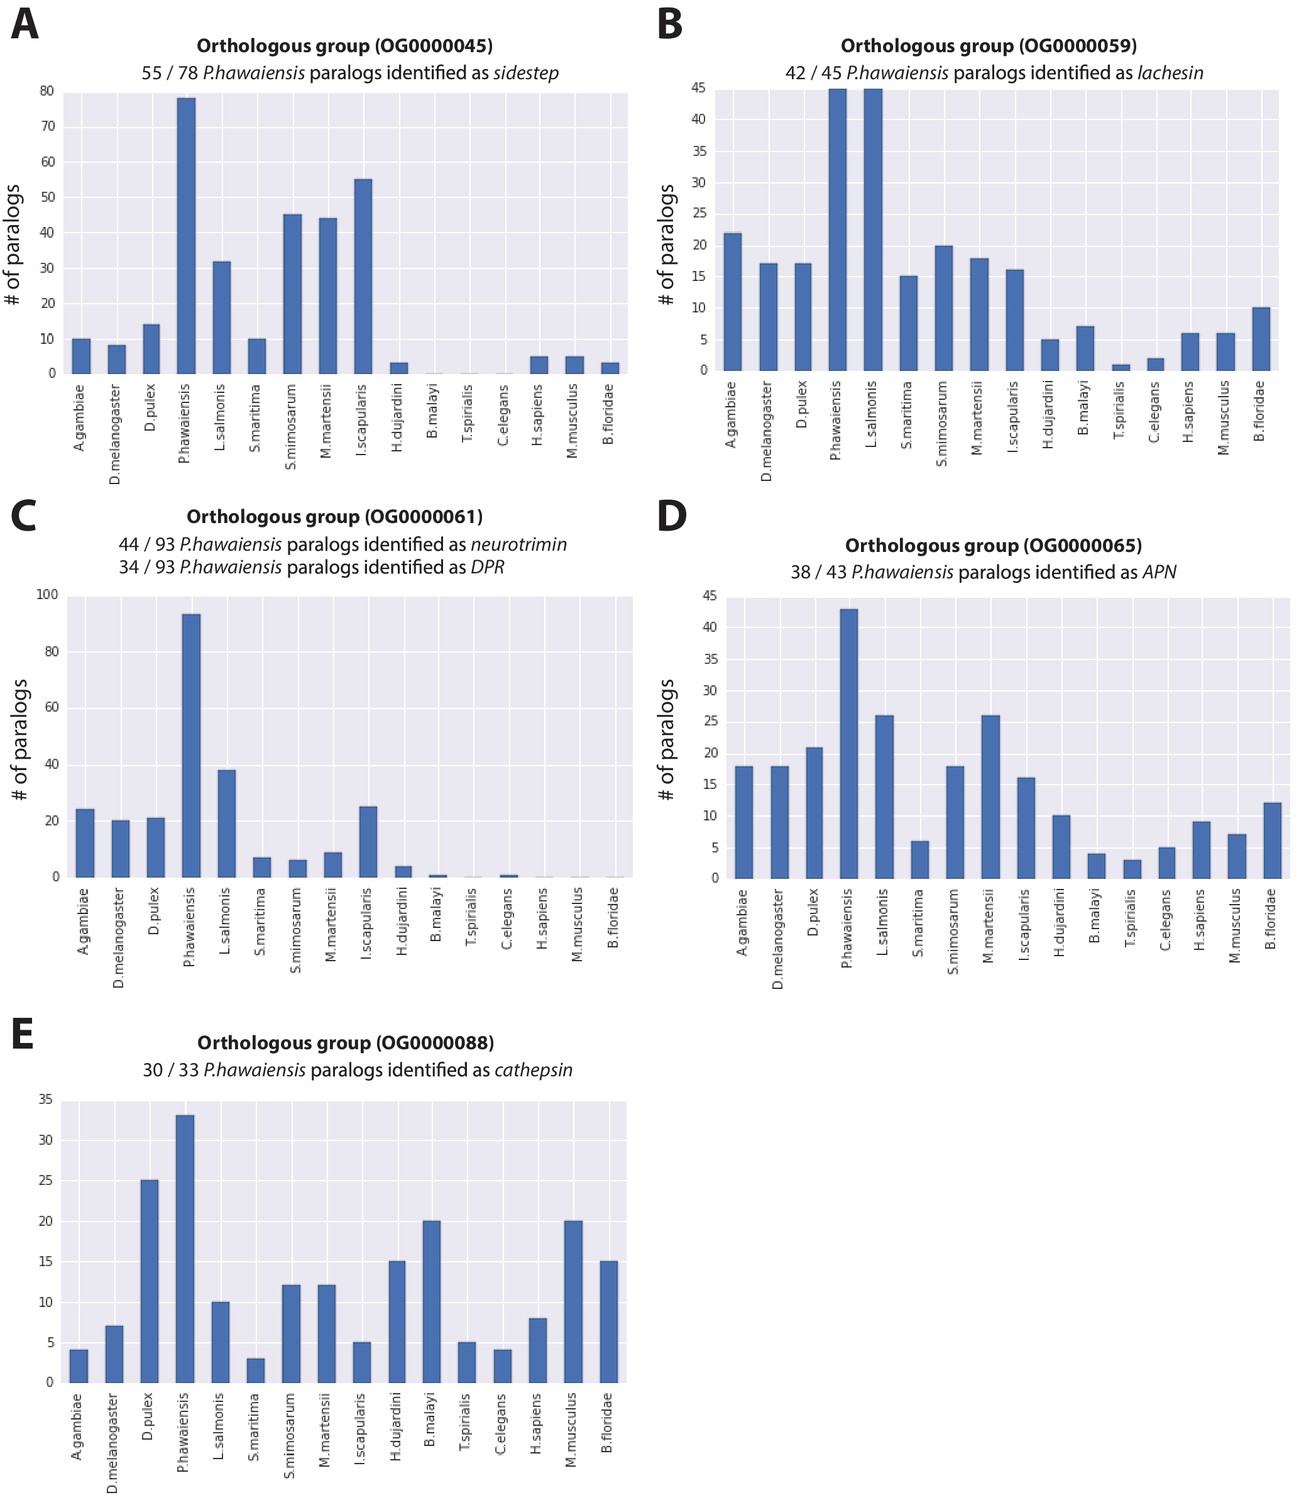
Expanded gene families in Parhyale.
Histograms showing number of paralogs in each listed species for (A) sidestep, (B) lachesin, (C) neurotrimin/DPR, (D) APN and (E) cathepsin genes for gene families over represented in Parhyale.
Figure 6 with 1 supplement

Variation analyses of predicted genes.
(A) A read coverage histogram of predicted genes. Reads were first mapped to the genome, then coverage was calculated for transcribed regions of each defined locus. (B) A coverage distribution plot showing that genes in the lower coverage region (<105x coverage, peak at 75x ) have a higher level of heterozygosity than genes in the higher coverage region (>105 coverage and <250, peak at approximately 150x coverage). (C) Distribution plot indicating that mean level of population variance is similar for genes in the higher and lower coverage regions.
-
Figure 6—source data 1
Polymorphism in Parhyale devlopmental genes.
Description of polymorphism in previously identfied Parhyale developmental genes.
- https://doi.org/10.7554/eLife.20062.018
Figure 6—figure supplement 1
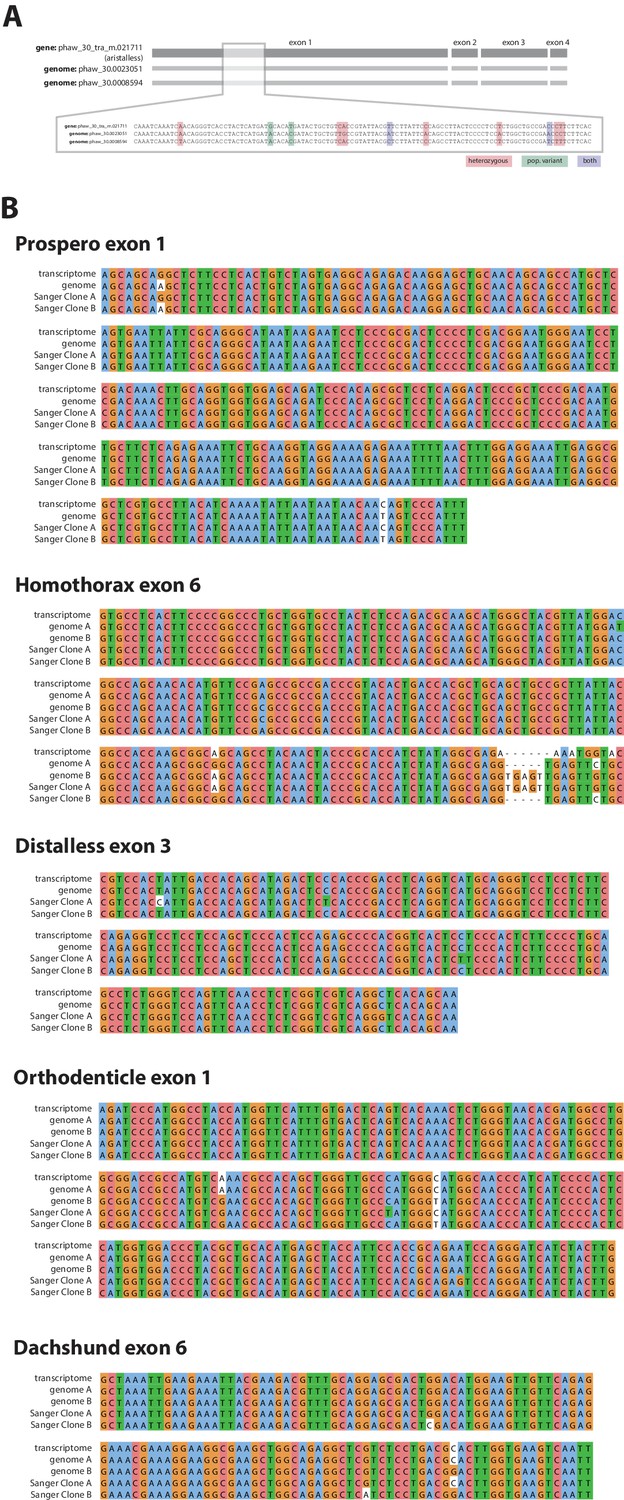
Confirmation of polymorphisms in the wider laboratory population of Parhyale.
(A) An example of laboratory population polymorphism in exon 1 of the gene aristalless. As well as heterozygoisty in the single Chicago-F male sequenced (pink and purple bases) there is additional polymorphism detectable in the transcriptome (green bases) (B) Further examples of polymorphism in the laboratory population in 5 developmental genes.
Figure 7
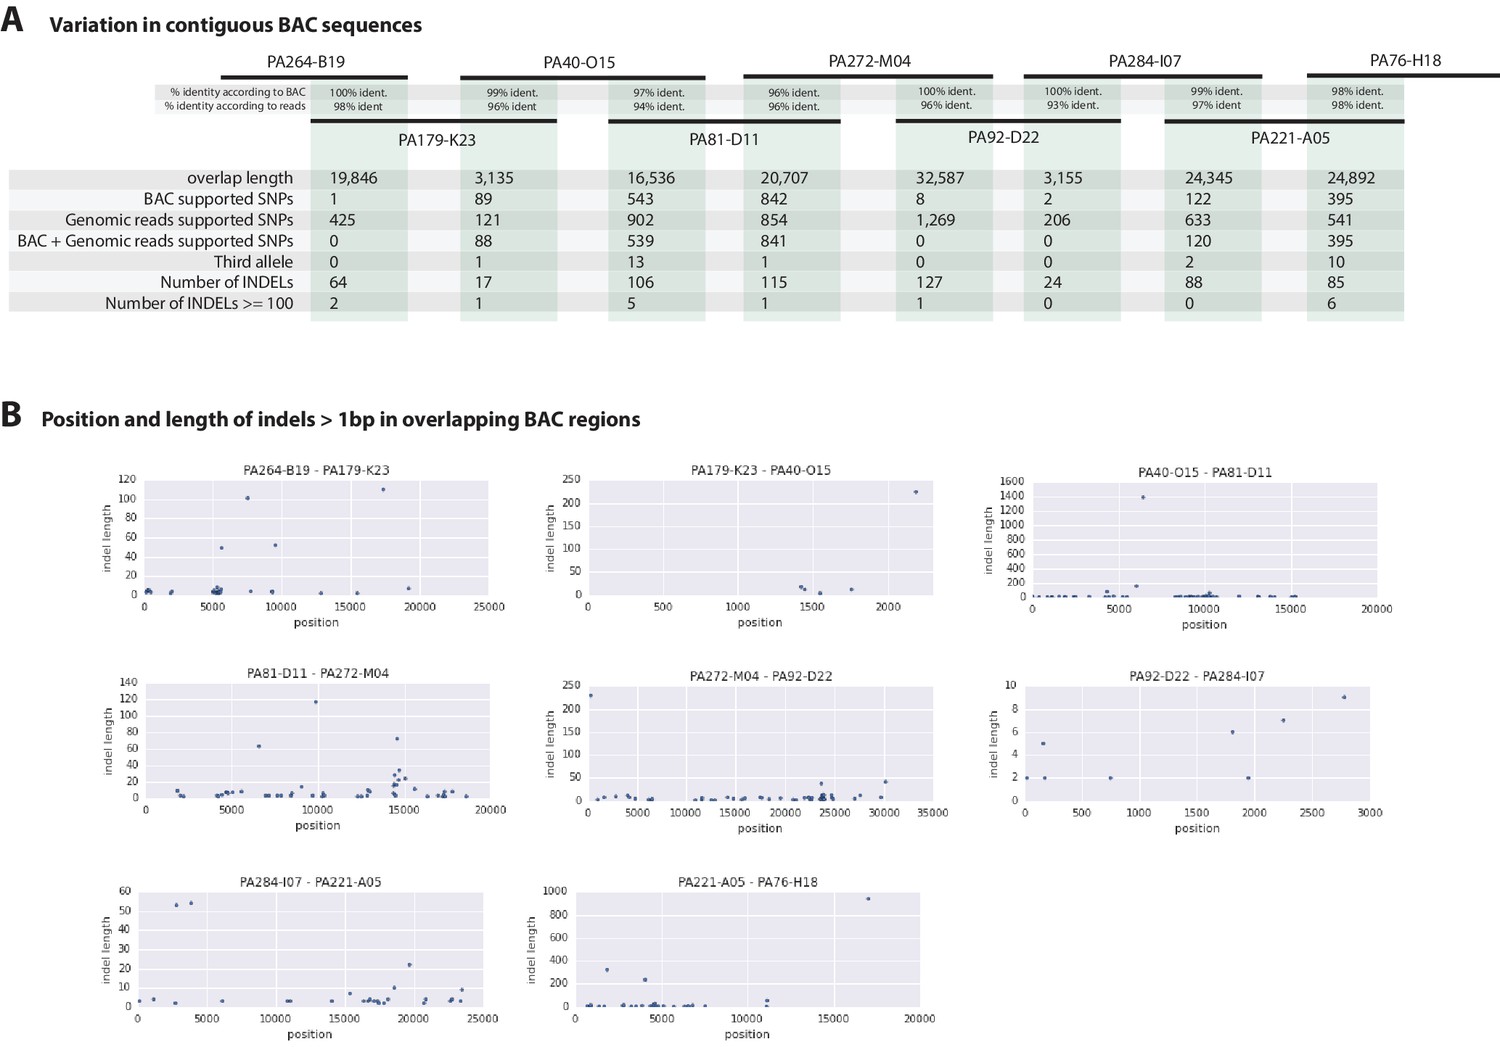
Variation observed in contiguous BAC sequences.
(A) Schematic diagram of the contiguous BAC clones tiling across the HOX cluster and their% sequence identities. 'Overlap length' refers to the lengths (bp) of the overlapping regions between two BAC clones. 'BAC supported single nucleotide polymorphisms (SNPs)' refer to the number of SNPs found in the overlapping regions by pairwise alignment.'Genomic reads supported SNPs' refer to the number of SNPs identified in the overlapping regions by mapping all reads to the BAC clones and performing variant calling with GATK. 'BAC + Genomic reads supported SNPs' refer to the number of SNPs identified from the overlapping regions by pairwise alignment that are supported by reads. 'Third allele' refers to presence of an additional polymorphism not detected by genomic reads. 'Number of INDELs' refer to the number of all insertion or deletions found in the contiguous region. 'Number of INDELs >100' are insertion or deletions greater than or equal to 100. (B) Position versus indel lengths across each overlapping BAC region.
Figure 8 with 2 supplements
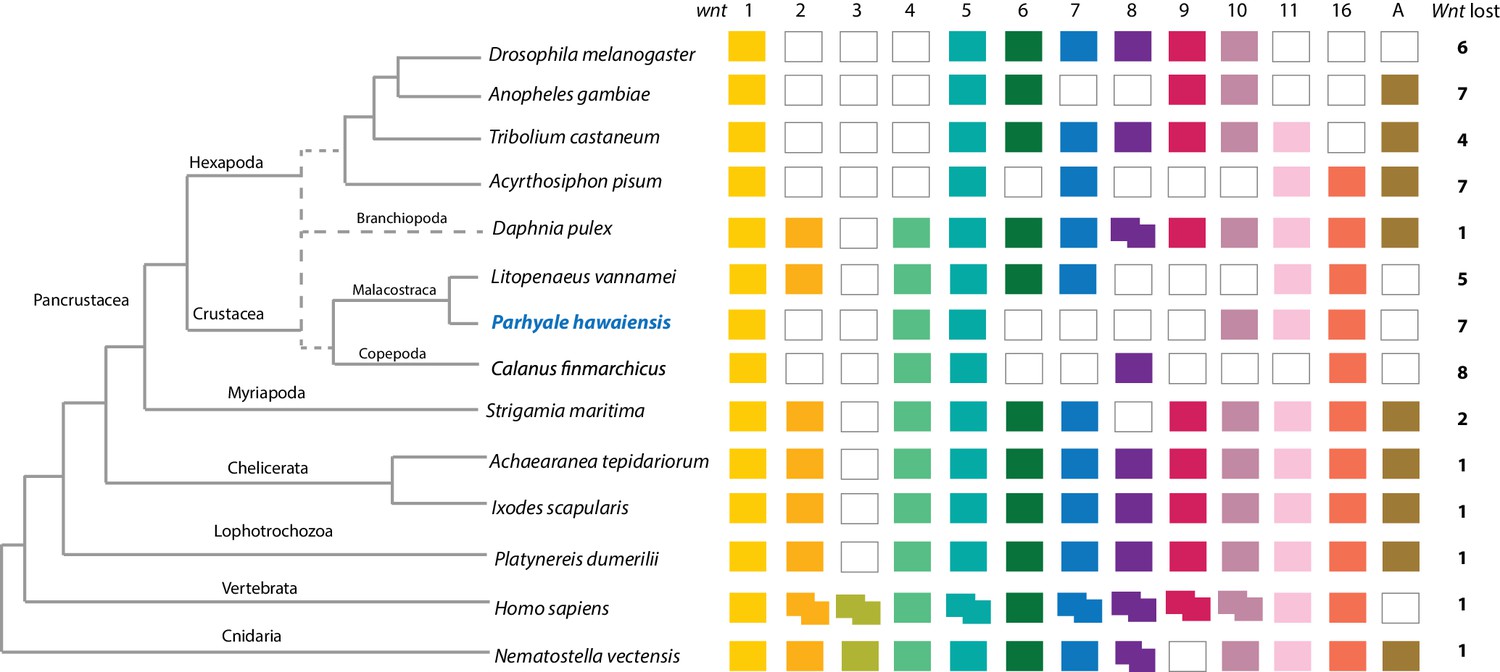
Comparison of Wnt family members across Metazoa.
Comparison of Wnt genes across Metazoa. Tree on the left illustrates the phylogenetic relationships of species used. Dotted lines in the phylogenetic tree illustrate the alternative hypothesis of Branchiopoda + Hexapoda versus Branchiopoda + Multicrustacea. Colour boxes indicate the presence of certain Wnt subfamily members (wnt1 to wnt11, wnt16 and wntA) in each species. Empty boxes indicate the loss of particular Wnt genes. Two overlapping colour boxes represent duplicated Wnt genes.
-
Figure 8—source data 1
List of Parhyale transcription factors by family.
List of Parhyale transcript IDs for all transcription factors in the proteome, grouped by transcription factor family.
- https://doi.org/10.7554/eLife.20062.023
-
Figure 8—source data 2
Wnt, TGFβ and FGF signaling pathways .
Parhyale transcript IDs for Wnt, Wnt ligand, FGF, FGFR and TGFβ pathway genes.
- https://doi.org/10.7554/eLife.20062.024
-
Figure 8—source data 3
Homeobox transcription factors.
Annotation of homeobox transcription factor genes in Parhyale.
- https://doi.org/10.7554/eLife.20062.025
Figure 8—figure supplement 1
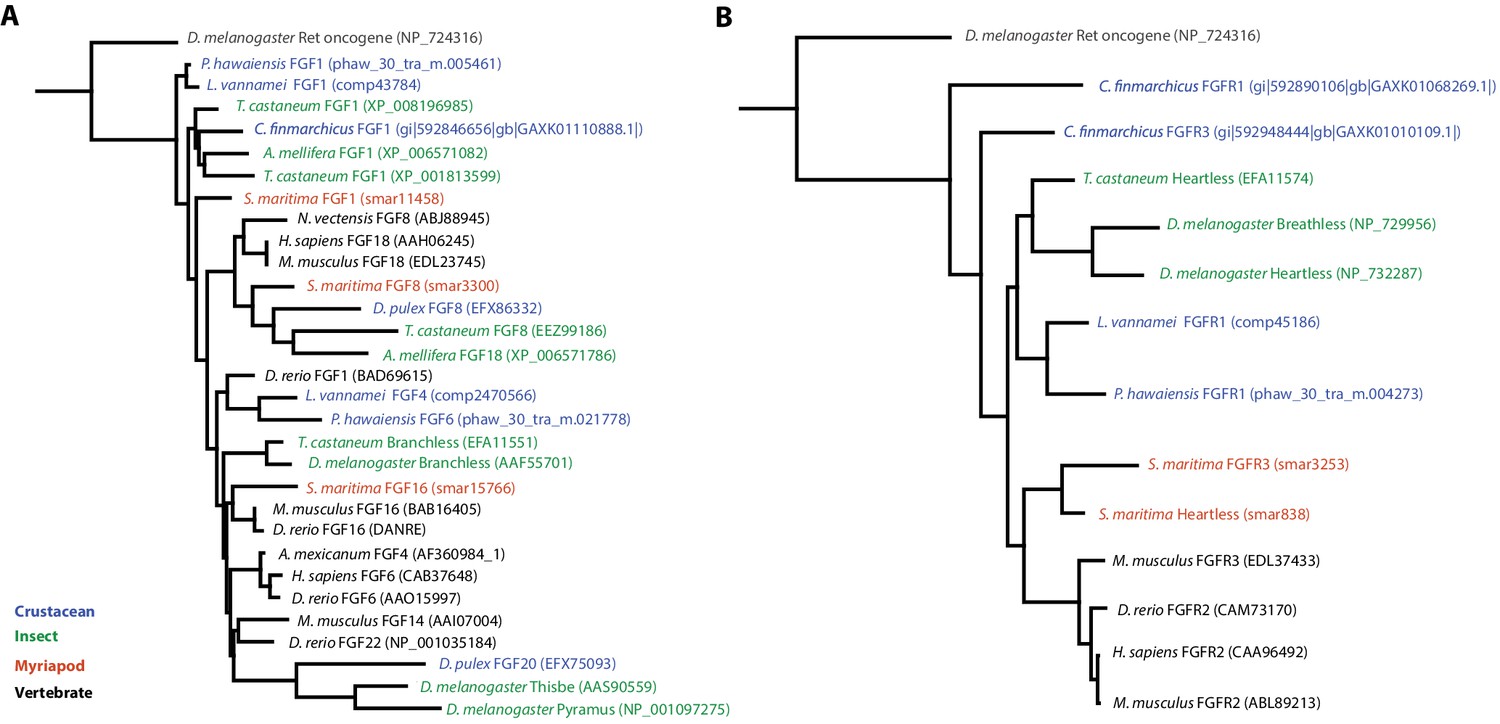
Phylogenetic tree of FGF and FGR molecules
(A) Phylogenetic tree of arthropod and vertebrate FGFs, including two FGFs from Parhyale (B) Phylogenetic tree of arthropod and vertebrate FGFRs, including a single FGFR in Parhyale.
Figure 8—figure supplement 2
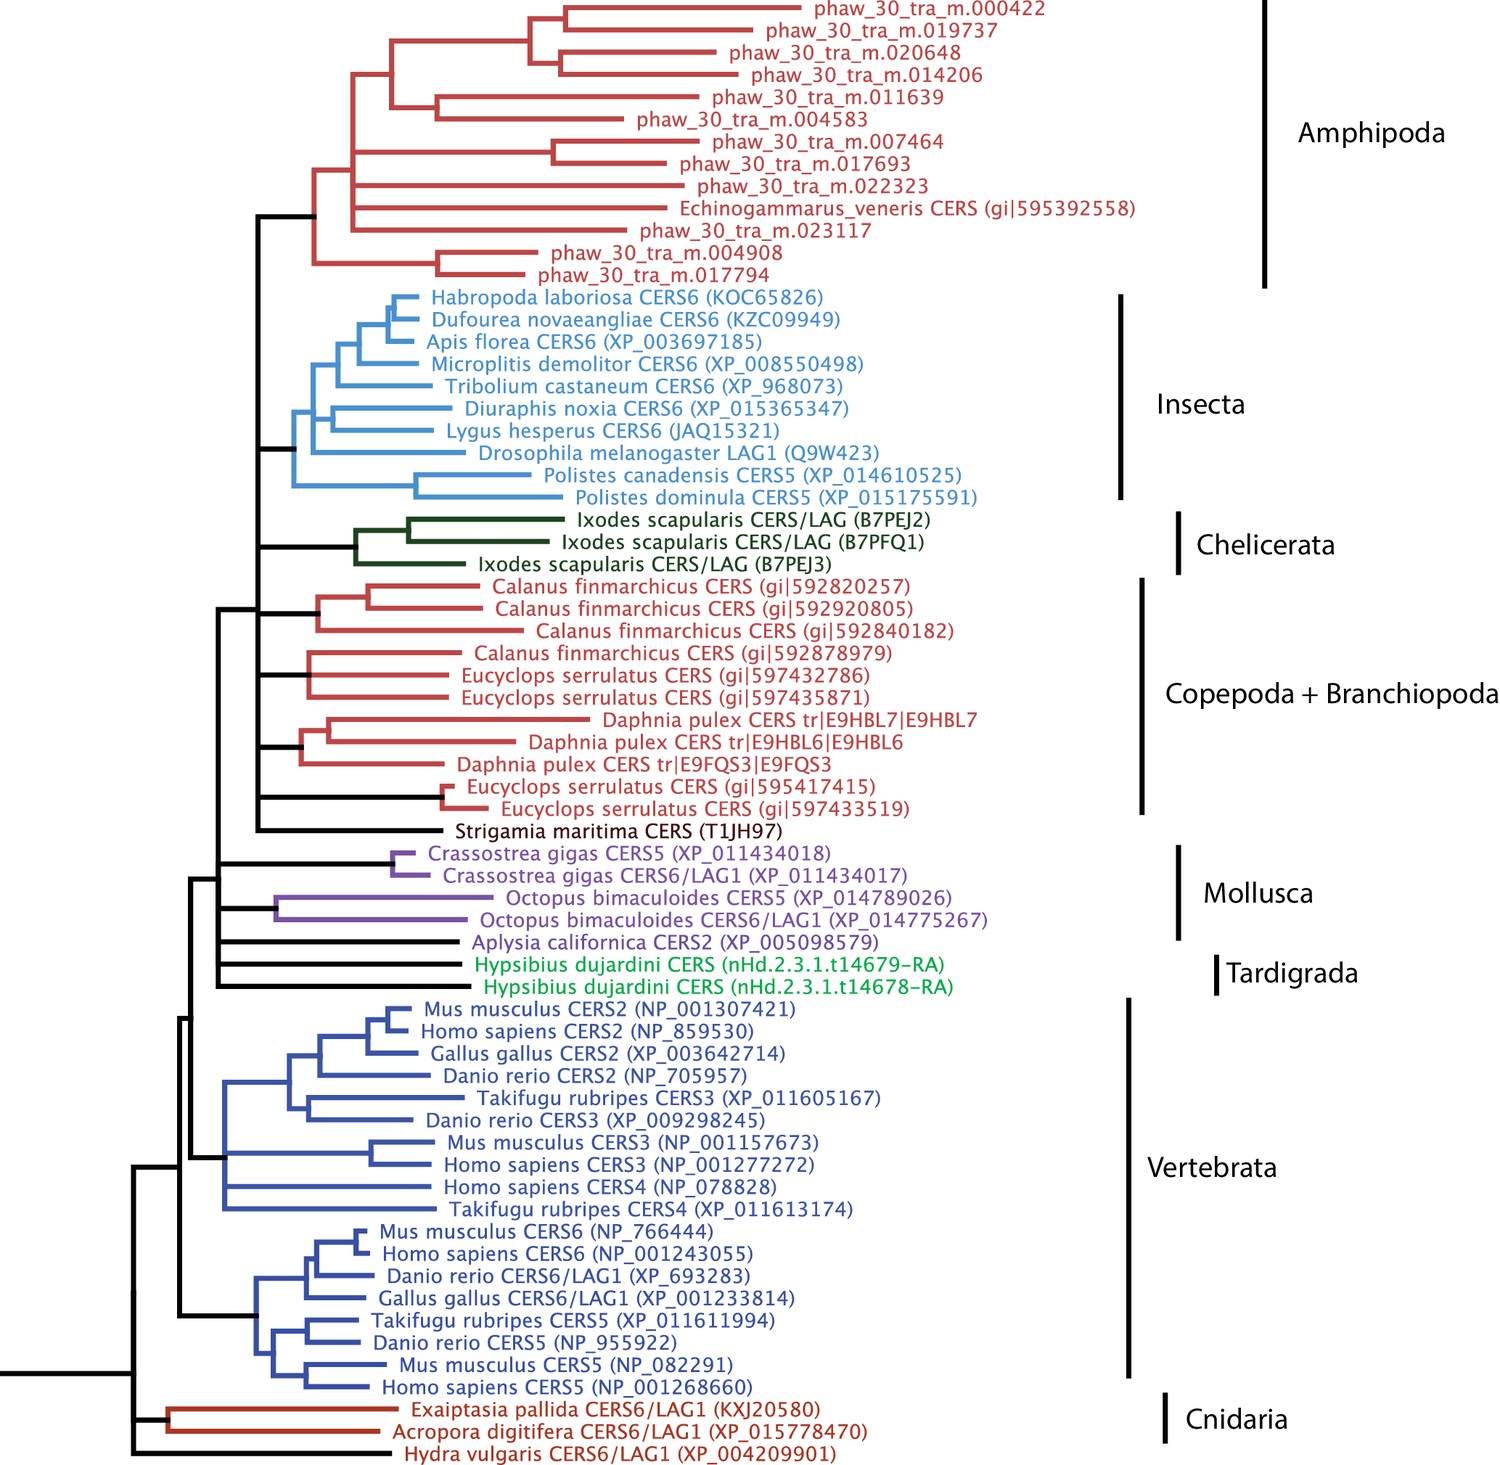
Phylogenetic tree of CERS homeobox family genes.
A phylogenetic tree highlighting an expansion of CERS homeobox family genes in Parhyale.
Figure 9
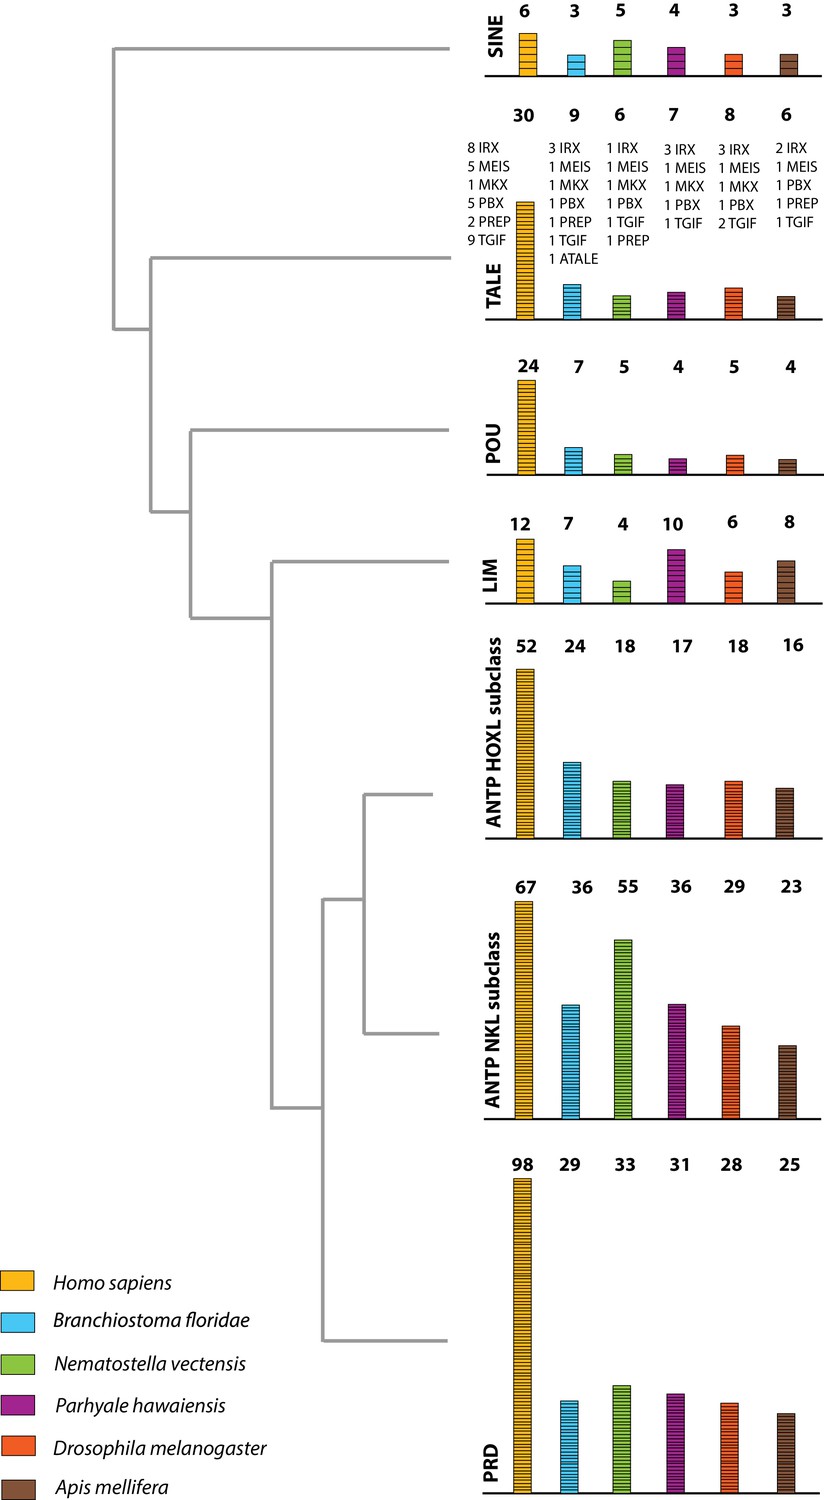
Homeodomain protein family tree.
The overview of homeodomain radiation and phylogenetic relationships among homeodomain proteins from Arthropoda (P. hawaiensis, D. melanogaster and A. mellifera), Chordata (H. sapiens and B. floridae), and Cnidaria (N. vectensis). Six major homeodomain classes are illustrated (SINE, TALE, POU, LIM, ANTP and PRD) with histograms indicating the number of genes in each species belonging to a given class.
Figure 10
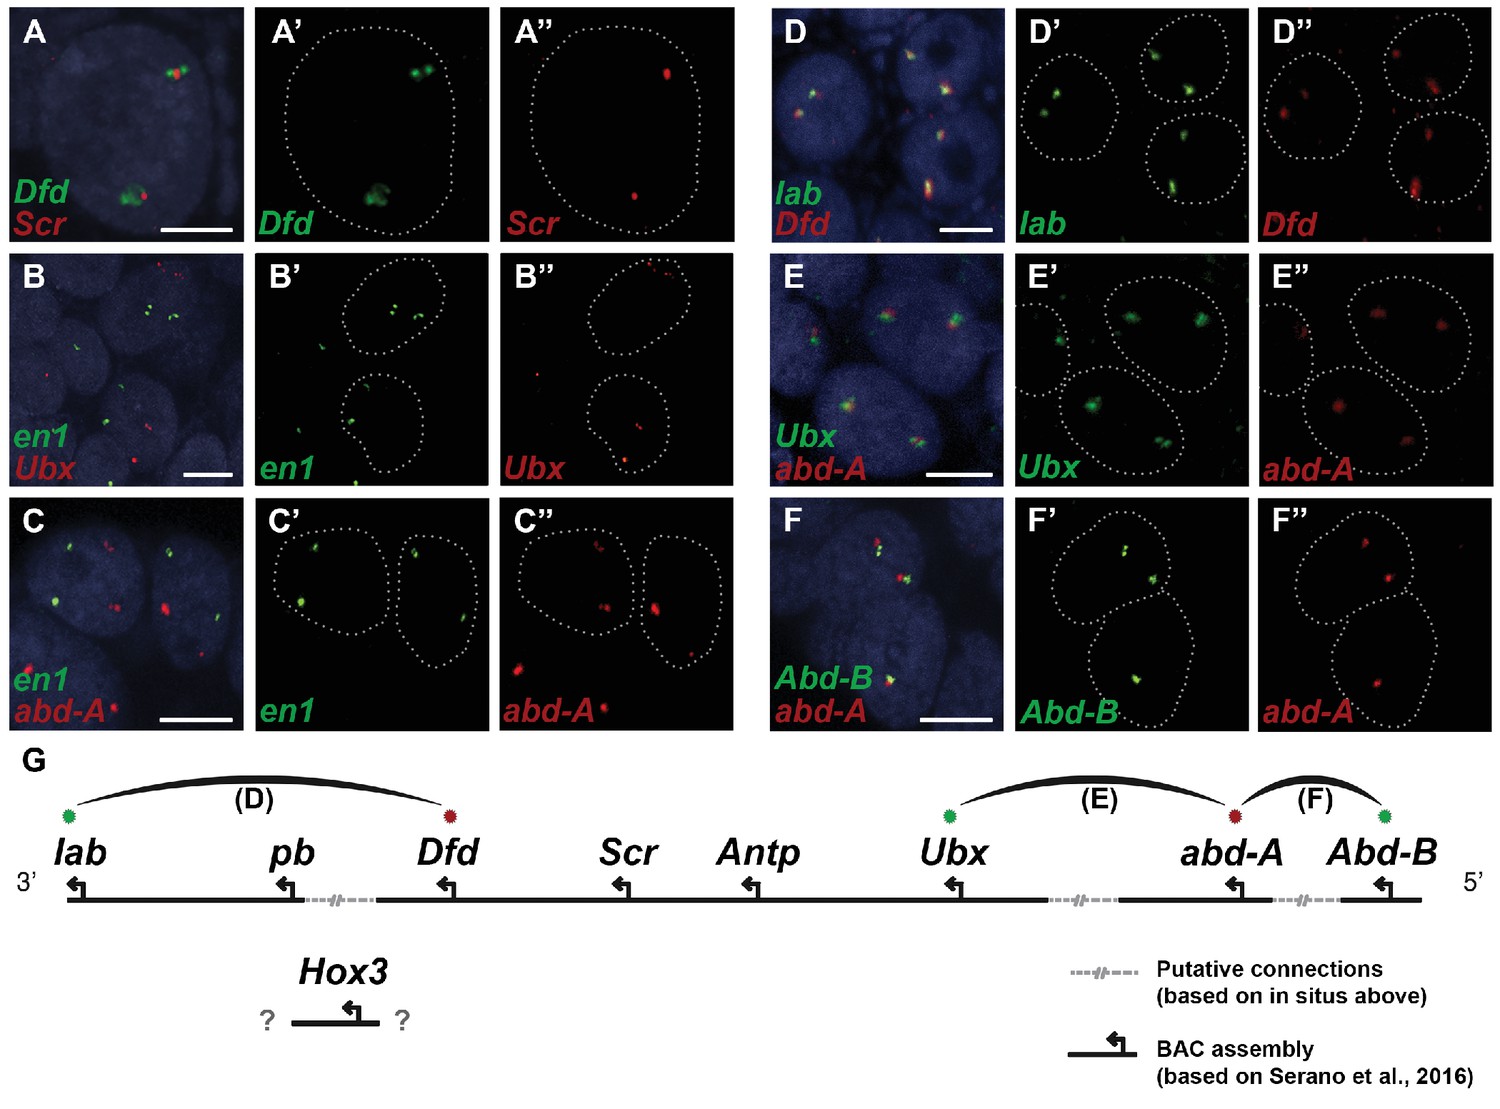
Evidence for an intact Hox cluster in Parhyale.
(A–F’’) Double fluorescent in situ hybridizations (FISH) for nascent transcripts of genes. (A–A’’) Deformed (Dfd) and Sex combs reduced (Scr), (B-B’’) engrailed 1 (en1) and Ultrabithorax (Ubx), (C–C’’) en1 and abdominal-A (abd-A), (D–D’’) labial (lab) and Dfd, (E–E’’) Ubx and abd-A, and (F–F’’) Abdominal-B (Abd-B) and abd-A. Cell nuclei are stained with DAPI (blue) in panels A–F and outlined with white dotted lines in panels A'–F' and A''. Co-localization of nascent transcript dots in A, D, E and F suggest the proximity of the corresponding Hox genes in the genomic DNA. As negative controls, the en1 nascent transcripts in B and C do not co-localize with those of Hox genes Ubx or abd-A. (G) Schematic representation of the predicted configuration of the Hox cluster in Parhyale. Previously identified genomic linkages are indicated with solid black lines, whereas linkages established by FISH are shown with dotted gray lines. The arcs connecting the green and red dots represent the linkages identified in D, E and F, respectively. The position of the Hox3 gene is still uncertain. Scale bars are 5 µm.
Figure 11
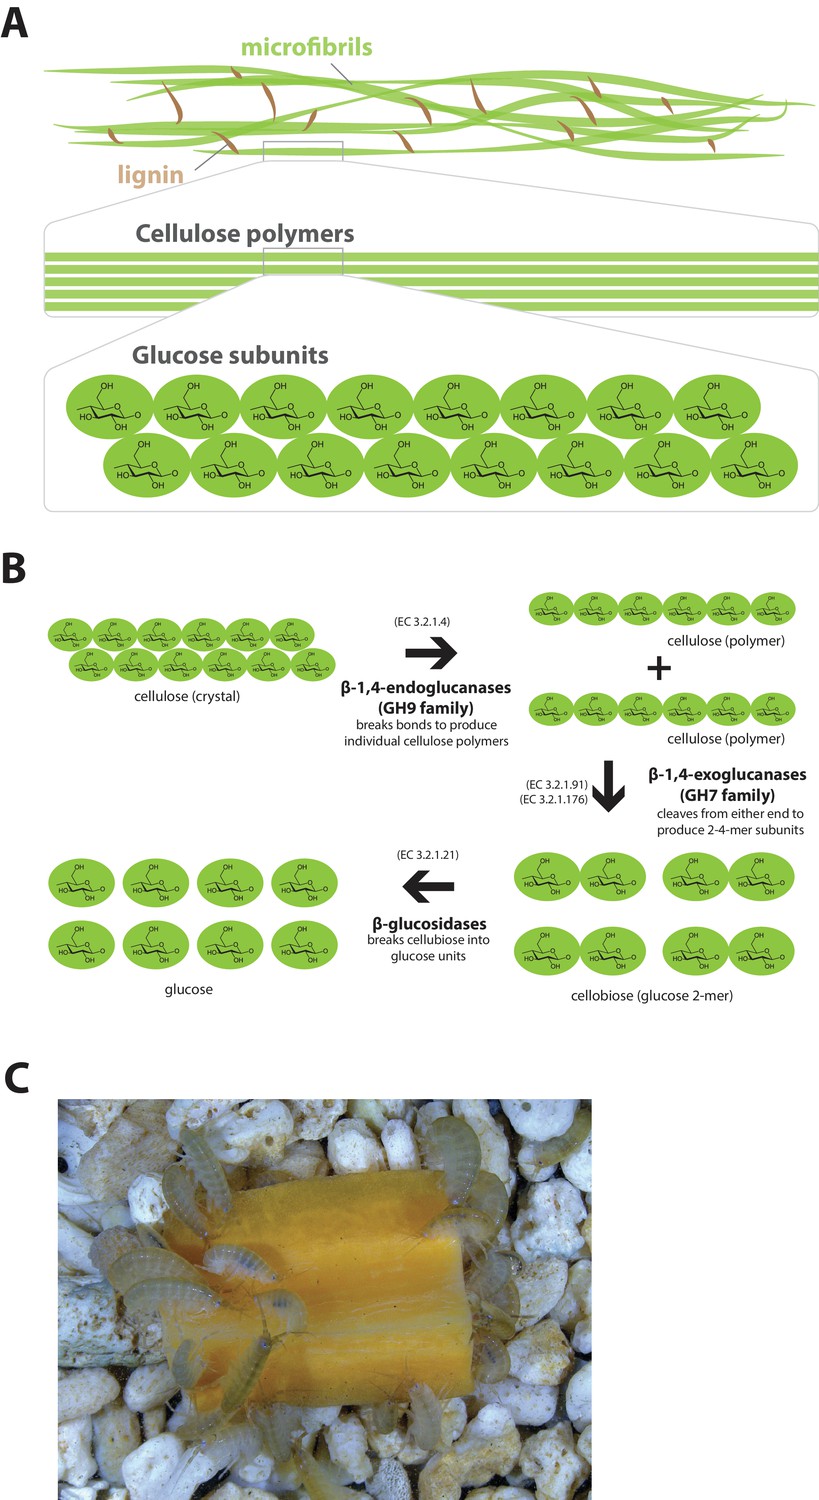
Lignocellulose digestion overview.
(A) Simplified drawing of lignocellulose structure. The main component of lignocellulose is cellulose, which is a-1,4-linked chain of glucose monosaccharides. Cellulose and lignin are organized in structures called microfibrils, which in turn form macrofibrils. (B) Summary of cellulolytic enzymes and reactions involved in the breakdown of cellulose into glucose. -1,4-endoclucanases of the GH9 family catalyze the hydrolysis of crystalline cellulose into cellulose chains. -1,4-exoclucanases of the GH7 family break down cellulose chains into cellobiose (glucose disaccharide) that can be converted to glucose by -glucosidases. (C) Adult Parhyale feeding on a slice of carrot.
Figure 12 with 1 supplement
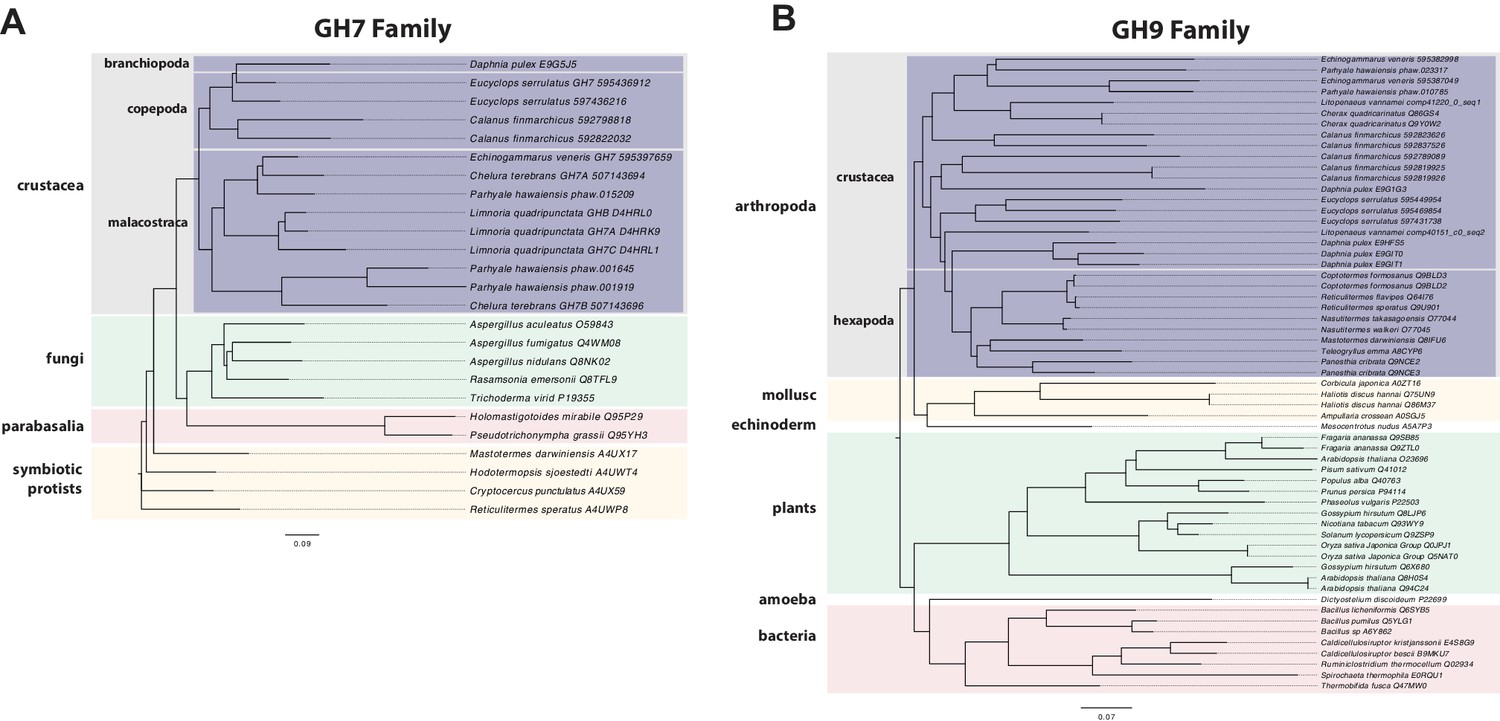
Phylogenetic analysis of GH7 and GH9 family proteins.
(A) Phylogenetic tree showing the relationship between GH7 family proteins of Parhyale, other crustaceans (Malacostraca, Branchiopoda, Copepoda), fungi and symbiotic protists (root). UniProt and GenBank accessions are listed next to the species names. (B) Phylogenetic tree showing the relationship between GH9 family proteins of Parhyale, crustaceans, insects, molluscs, echinoderms, amoeba, bacteria and plants (root). UniProt and GenBank accessions are listed next to the species names. Both trees were constructed with RAxML using the WAG+G model from multiple alignments of protein sequences created with MUSCLE.
-
Figure 12—source data 1.
Catalog of GH family genes in Parhyale.
IDs of all Parhyale GH genes and analyis of GH family membership across available malacostracan data sets.
- https://doi.org/10.7554/eLife.20062.032
Figure 12—figure supplement 1
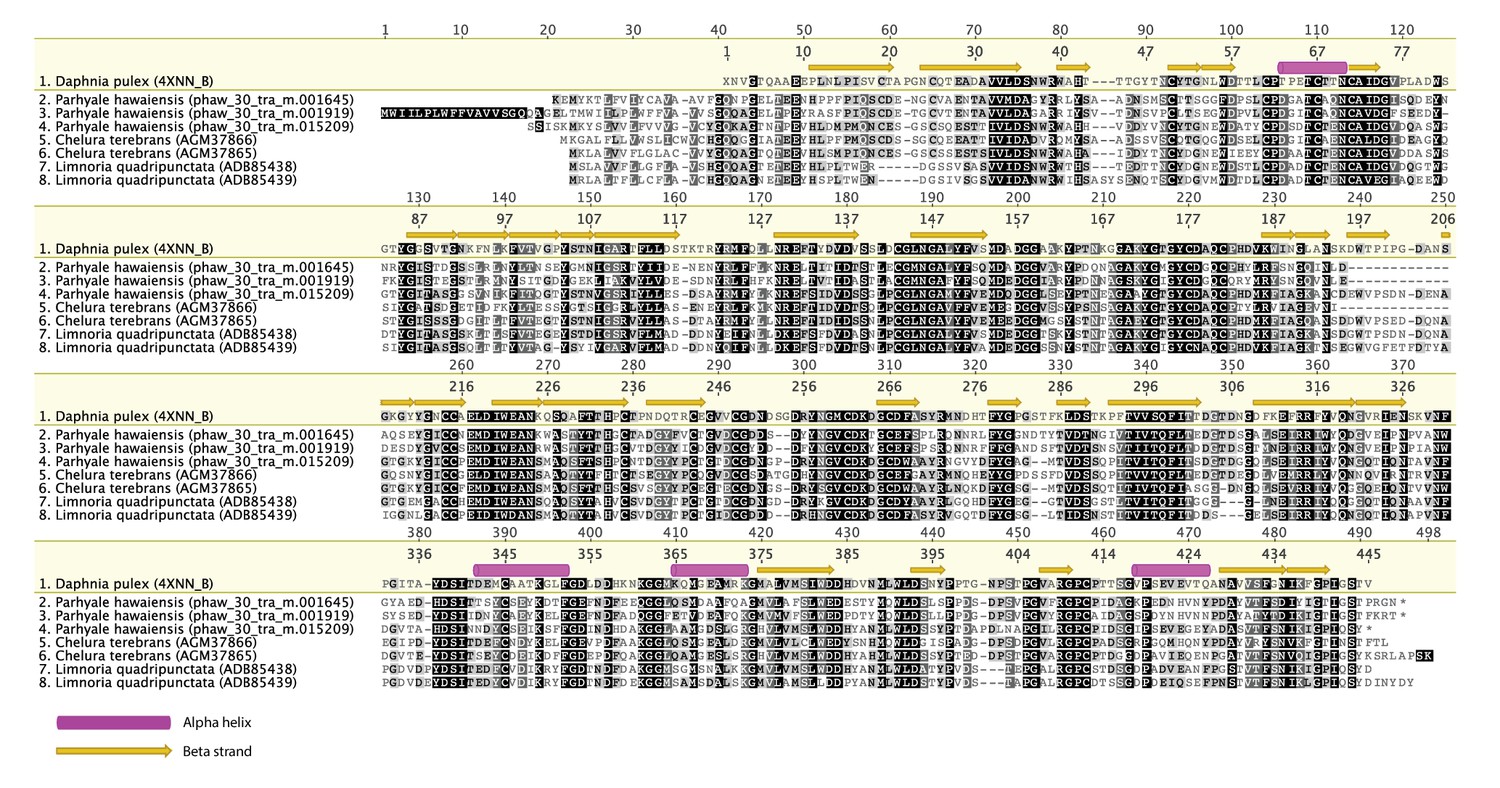
Alignment of GH7 family genes.
Alignment of GH7 family genes in Parhyale with those from Chelura terebans and Limnoria quadripunctata.
Figure 13 with 1 supplement

Comparison of innate immunity genes.
(A) Phylogenetic tree of peptidoglycan recognition proteins (PGRPs). With the exception of Remipedes, PGRPs were not found in Crustaceans. PGRPs have been found in Arthropods, including insects, Myriapods and Chelicerates. (B) Phylogenetic tree of Toll-like receptors (TLRs) generated from five Crustaceans, three Hexapods, two Chelicerates, one Myriapod and one vertebrate species. (C) Genomic organization of the Parhyale Dscam locus showing the individual exons and exon arrays encoding the immunoglobulin (IG) and fibronectin (FN) domains of the protein. (D) Structure of the Parhyale Dscam locus and comparison with the (E) Dscam loci from Daphnia pulex, Daphnia magna and Drosophila melanogaster. The white boxes represent the number of predicted exons in each species encoding the signal peptide (red), the IGs (blue), the FNs and transmembrane (yellow) domains of the protein. The number of alternatively spliced exons in the arrays encoding the hypervariable regions IG2 (exon 4 in all species), IG3 (exon 6 in all species) and IG7 (exon 14 in Parhyale, 11 in D. pulex and 9 in Drosophila) are indicated under each species schematic in the purple, green and magenta boxes, respectively. Abbreviations of species used: Parhyale hawaiensis (Phaw), Bombyx mori (Bmor), Aedes aegypti (Aaeg), Drosophila melanogaster (Dmel), Apis mellifera (Amel), Speleonectes tulumensis (Stul), Strigamia maritima (Smar), Stegodyphus mimosarum (Smim), Ixodes scapularis (Isca), Amblyomma americanum (Aame), Nephila pilipes (Npil), Rhipicephalus microplus (Rmic), Ixodes ricinus (Iric), Amblyomma cajennense (Acaj), Anopheles gambiae (Agam), Daphnia pulex (Apul), Tribolium castaneum (Tcas), Litopenaeus vannamei (Lvan), Lepeophtheirus salmonis (Lsal), Eucyclops serrulatus (Eser), Homo sapiens (H.sap). Both trees were constructed with RAxML using the WAG+G model from multiple alignments of protein sequences created with MUSCLE.
-
Figure 13—source data 1
Catalog of innate immunity related genes in Parhyale.
Parhyale IDs and numbers of immune related genes in comparison to other species.
- https://doi.org/10.7554/eLife.20062.035
Figure 13—figure supplement 1
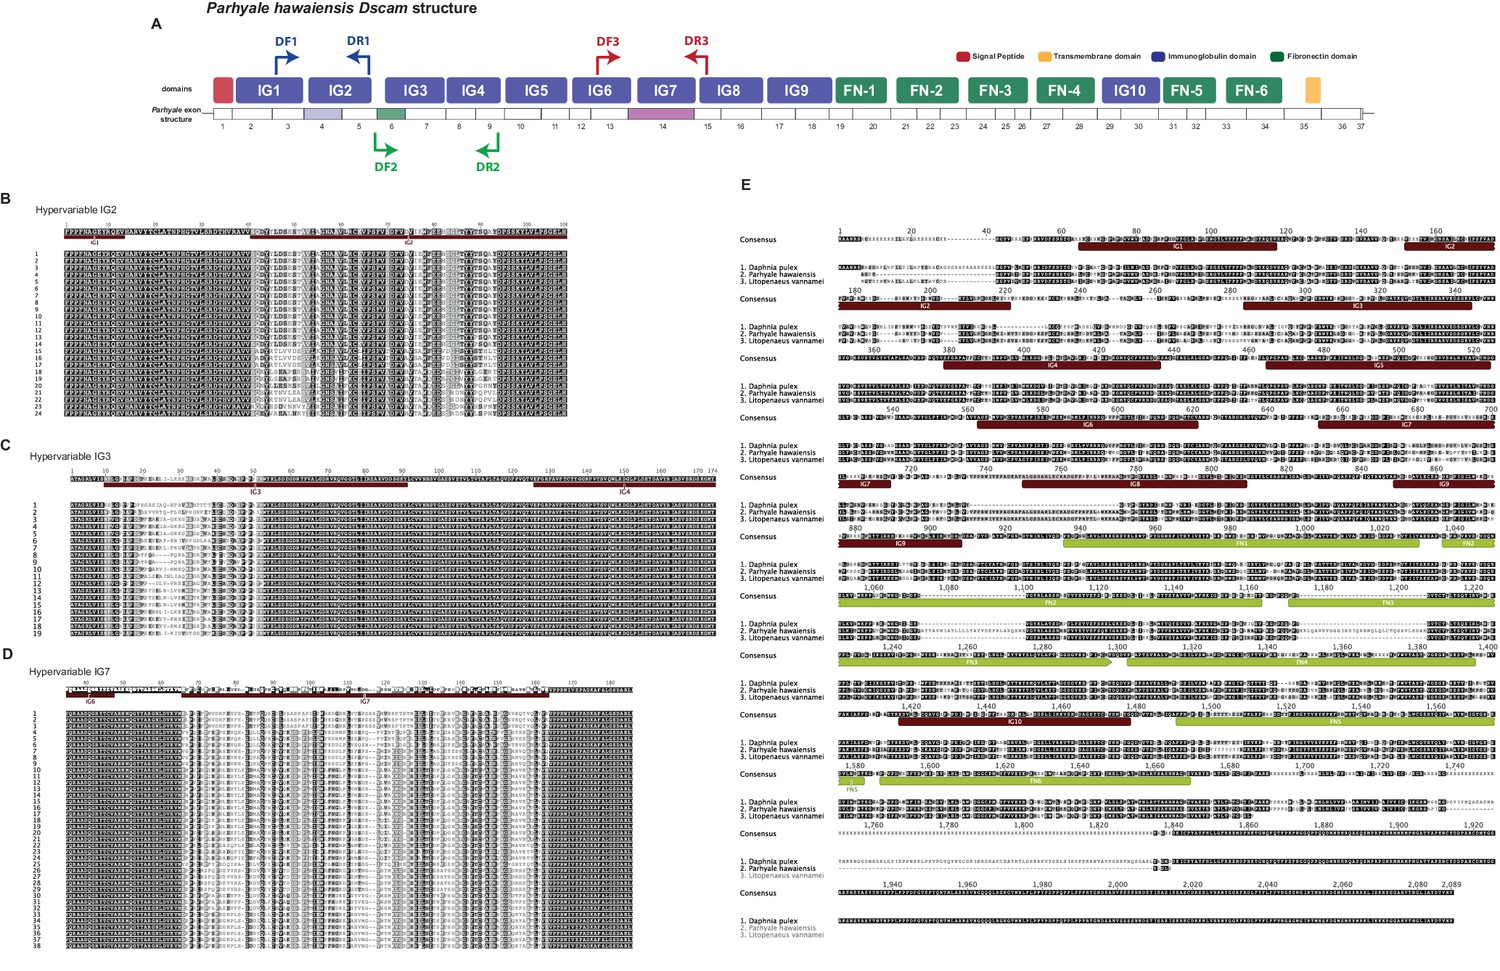
Overview of Parhyale Dscam structure and hypervariable regions
(A) Overview of domain structure of Parhyale Dscam protein and position of primers used to assess use of exons in 3 hypervariable regions. (B) Sequence alignments of cloned hypervariable regions in IG2 and (C) IG3 and (D) IG7. (E) Alignment of crustacean DsCam proteins.
Figure 14 with 2 supplements
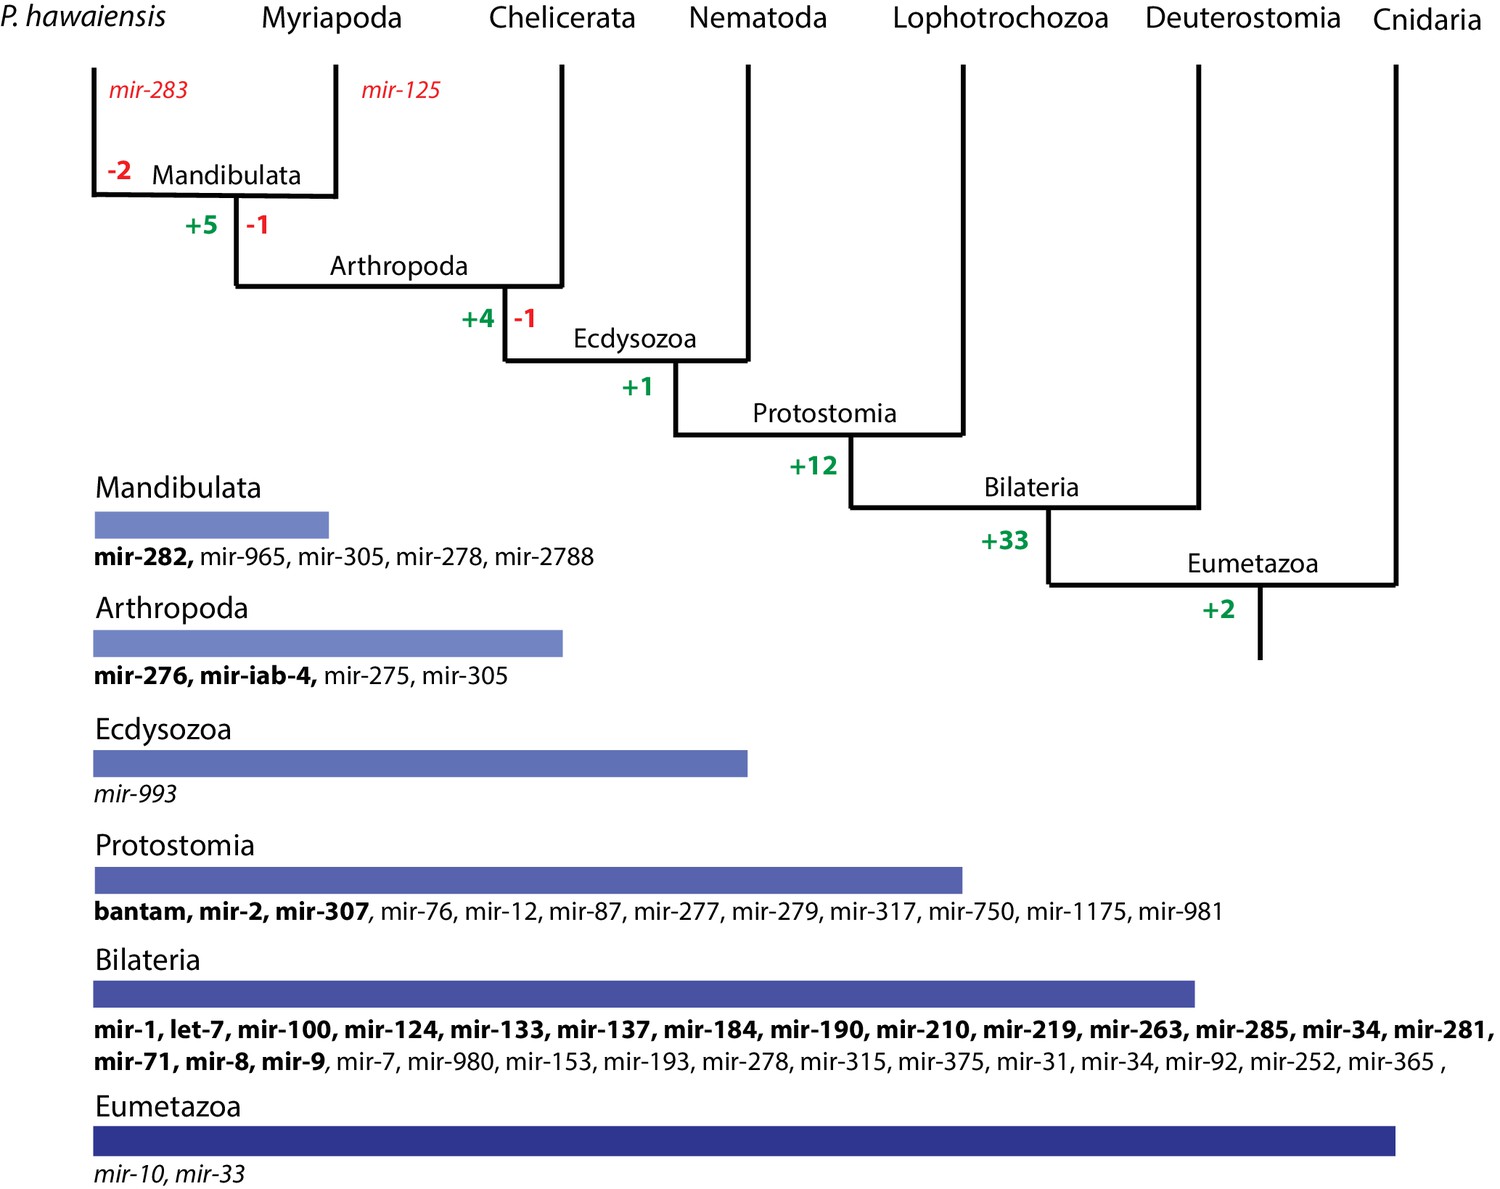
Evolution of miRNA families in Eumetazoans.
Phylogenetic tree showing the gains (in green) and losses (in red) of miRNA families at various taxonomic levels of the Eumetazoan tree leading to Parhyale. miRNAs marked with plain characters were identified by MirPara with small RNA sequencing read support. miRNAs marked with bold characters were identified by Rfam and MirPara with small RNA sequencing read support.
-
Figure 14—source data 1
RFAM based annotation of the Parhyale genome.
RFAM annotation of the Parhyale genome.
- https://doi.org/10.7554/eLife.20062.039
Figure 14—figure supplement 1
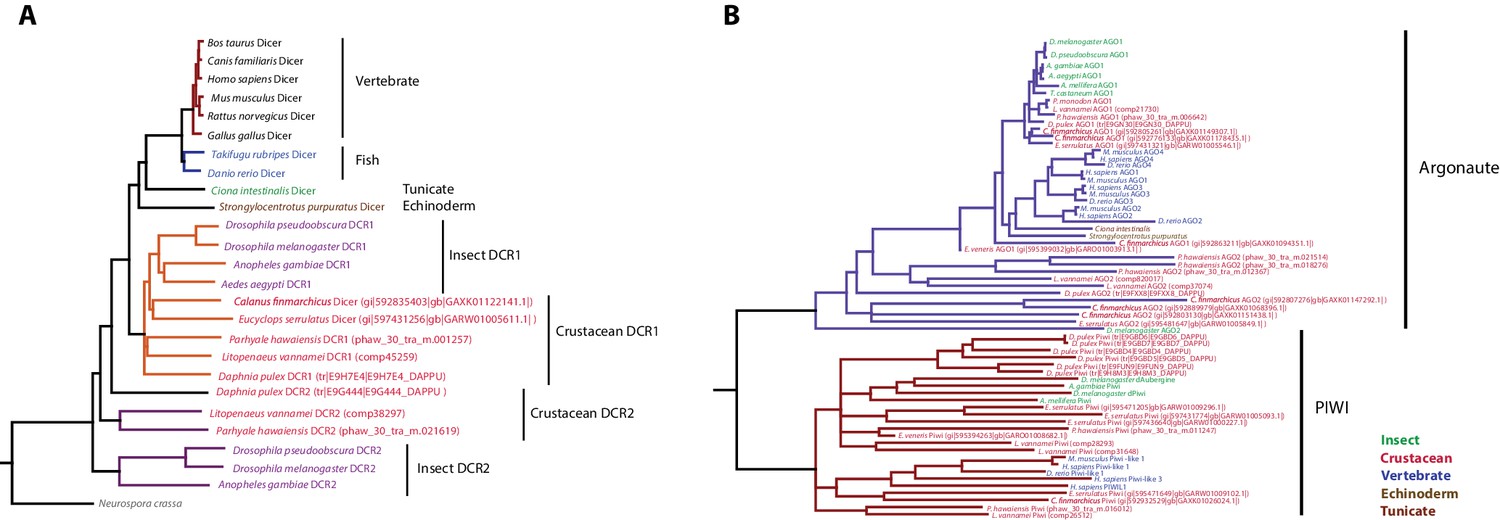
Phylogenetic trees of Dicer and PIWI/AGO genes.
(A) Phylogenetic tree of Dicer family genes, including two Dicer genes from Parhyale. (B) Phylogenetic tree of PIWI/AGO genes, including several Parhyale genes.
Figure 14—figure supplement 2
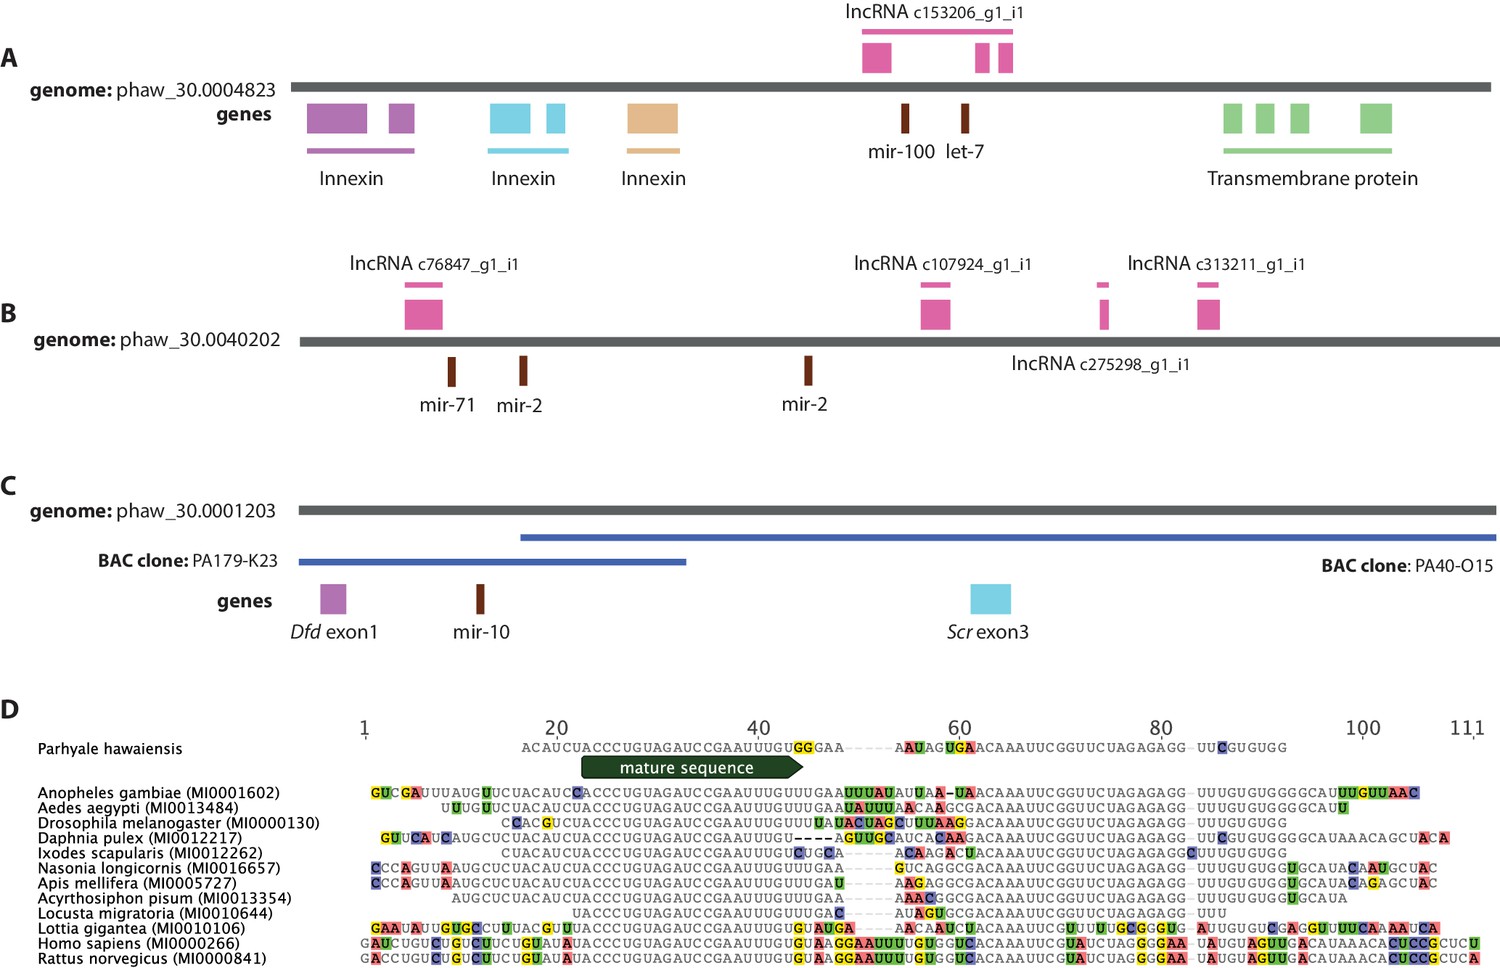
Examples of miRNAs in the Parhyale genome.
(A) Parhyale mir-100 and let-7 and clustered together in the intron of a putative lncRNA (B) A Parhyale mir-71/mir-2 family cluster (C) Parhyale mir-10 is in a conserved position in the genome between the Dfd and Scr Hox genes (D) Alignment of the predicted mir-10 precursor with mir-10 precursors from other species.
Figure 15
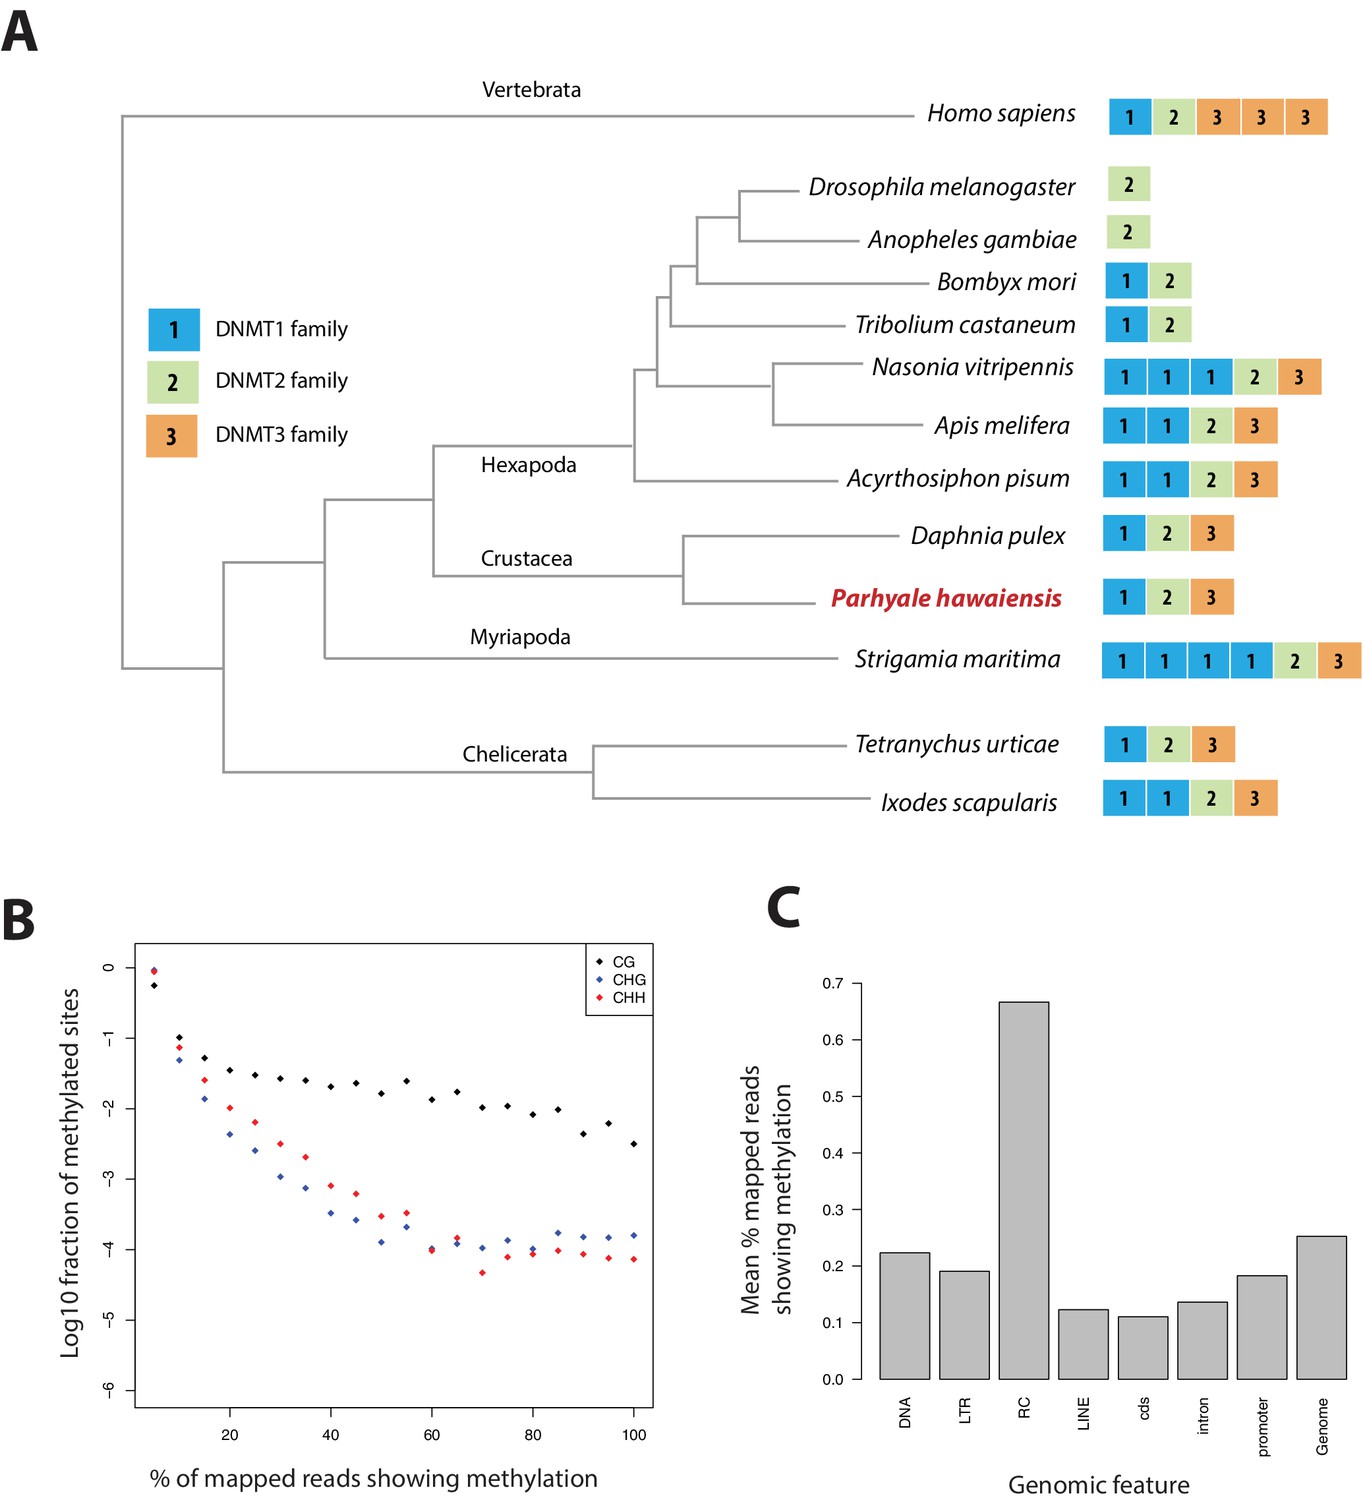
Analysis of Parhyale genome methylation.
(A) Phylogenetic tree showing the families and numbers of DNA methyltransferases (DNMTs) present in the genomes of indicated species. Parhyale has one copy from each DNMT family. (B) Amounts of methylation detected in the Parhyale genome. Amount of methylation is presented as percentage of reads showing methylation in bisulfite sequencing data. DNA methylation was analyzed in all sequence contexts (CG shown in dark, CHG in blue and CHH in red) and was detected preferentially in CpG sites. (C) Histograms showing mean percentages of methylation in different fractions of the genome: DNA transposons (DNA), long terminal repeat transposable elements (LTR), rolling circle transposable elements (RC), long interspersed elements (LINE), coding sequences (cds), introns, promoters, and the rest of the genome.
-
Figure 15—source data 1
Genes involved with epigenetic modification.
Catalog of Parhyale genes involved in DNA methylation and histone modifications.
- https://doi.org/10.7554/eLife.20062.043
Figure 16 with 1 supplement
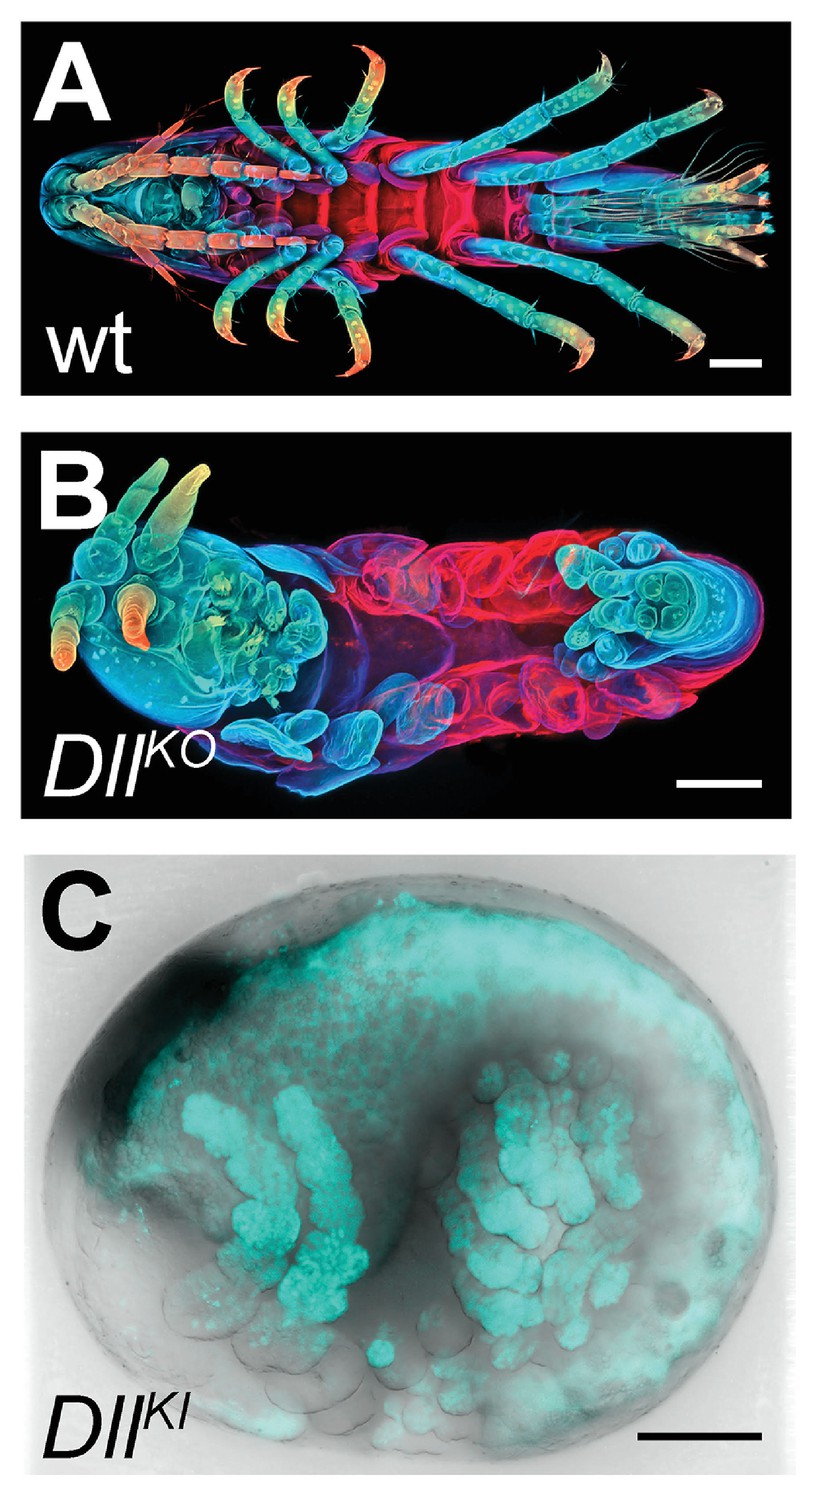
CRISPR/Cas9-based genome editing in Parhyale.
(A) Wild-type morphology. (B) Mutant Parhyale with truncated limbs after CRISPR-mediated knock-out (DllKO) of the limb patterning gene Distal-less (PhDll-e). Panels show ventral views of juveniles stained for cuticle and color-coded by depth with anterior to the left. (C) Fluorescent tagging of PhDll-e expressed in most limbs (shown in cyan) by CRISPR-mediated knock-in (DllKI) using the non-homologous-end-joining repair mechanism. Panel shows a lateral view with anterior to the left and dorsal to the top of a live embryo (stage S22) with merged bright-field and fluorescence channels. Yolk autofluorescence produces a dorsal crescent of fluorescence in the gut. Scale bars are 100 μm.
Figure 16—figure supplement 1
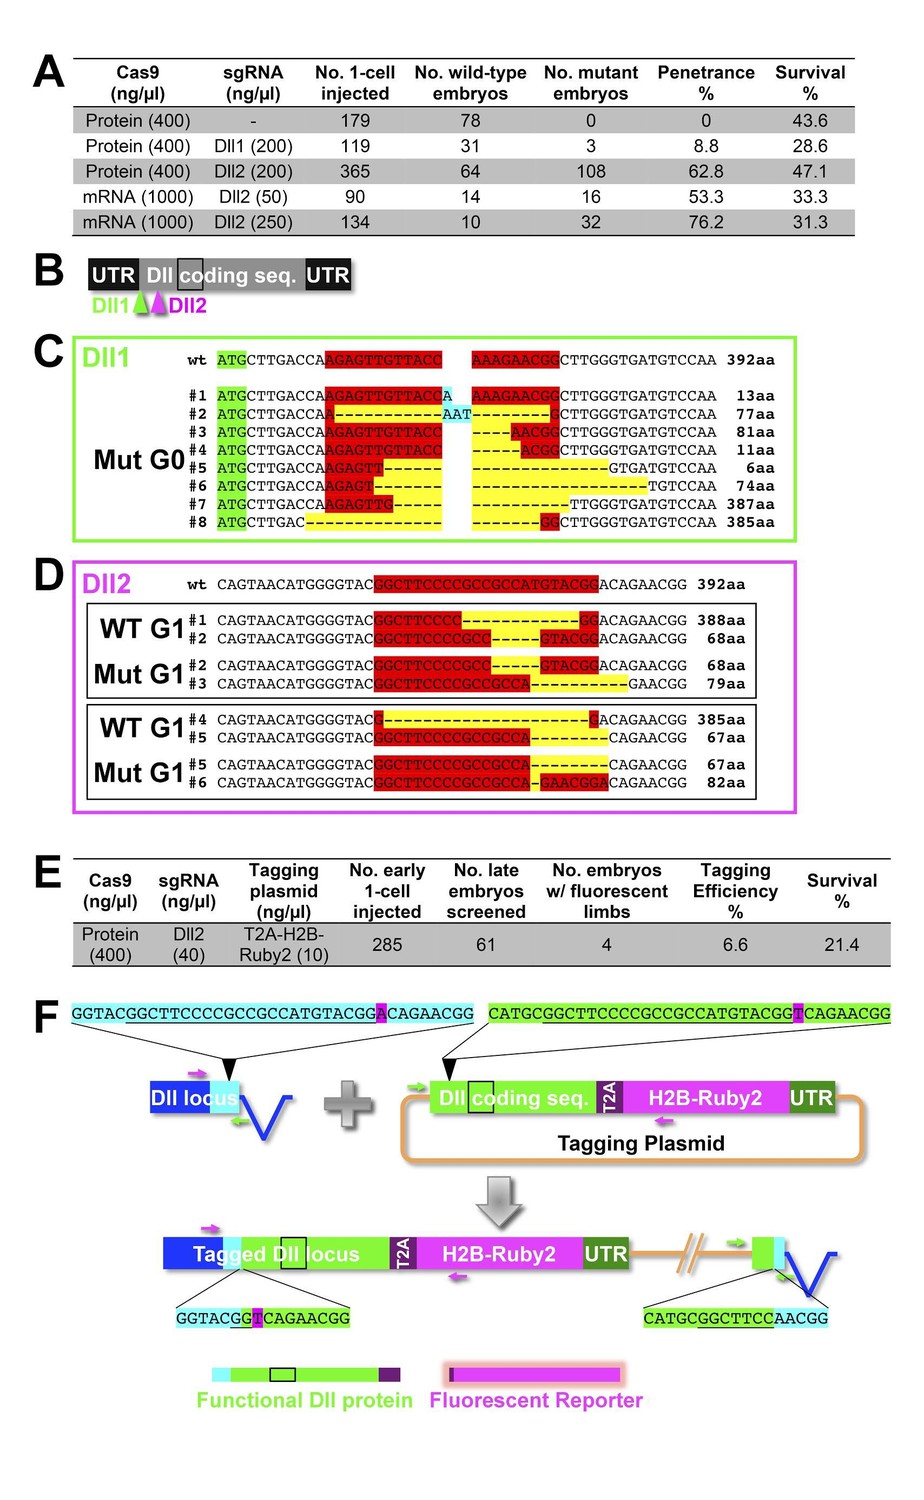
CRISPR experiments targeting the Distalless locus.
CRSIPR/Cas-based targeted genome editing in Parhyale. (A) Summary of gene knock-out experiments. (B) Illustration of the targeted PhDll-e (Dll) cDNA showing the 5’ and 3’ untranslated regions (UTRs), the coding sequence with the homeodomain (black box) and the positions targeted by the two sgRNAs Dll1 and Dll2. (C) Genotyping of a mosaic mutant embryo (F0 generation) with truncated appendages that was injected with Cas9 protein and the Dll1 sgRNA (Dll1+PAM sequence in red). This animal carried multiple Dll alleles with deletions (in yellow) or insertions (in cyan) in the region targeted by Dll1 downstream of the start codon (in green). Most of these alleles likely encoded truncated non-functional proteins, while a few alleles likely encoded functional proteins missing a few aminoacids at the targeted region (putative number of aminoacids shown on the right). (D) Genotyping of wild-type and mutant embryos (F1 generation) from two separate crosses (top and bottom black boxes) of F0 animals injected with Cas9 protein and the Dll2 sgRNA (Dll2+PAM sequence in red). Each mutant F1 carried two non-functional Dll alleles encoding truncated proteins, while their wild-type siblings carried one functional allele and one non-functional allele (putative number of aminoacids shown on the right). (E) Summary of targeted gene knock-in based on the non-homologous end joining repair mechanism. (F) Schematic representation of the endogenous Dll locus with the non coding sequences shown in blue and the coding sequences in cyan (left), and of the tagging plasmid carrying a copy of the Dll coding sequence (in green), the T2A self-cleaving peptide (in purple), a fusion of the Parhyale histone H2B with the Ruby 2 monomeric red fluorescent protein (in magenta) and the Dll 3’UTR (in dark green). The Dll2+PAM sequences (underlined) and flanking sequences in the Dll locus and plasmid are shown in cyan and green, respectively. A single nucleotide substitution (A>T shown in magenta) right after the PAM sequence was introduced on purpose in the plasmid to discriminate the tagged sequence from the original one. The left and right junctions between the endogenous and inserted sequences were recovered by PCR from transgenic animals with fluorescent limbs using the indicated pairs of primers (magenta and green, respectively). The tagged Dll locus is likely encoding a functional Dll protein (with a small 7-aminoacid deletion in the region targeted by Dll2 and a stretch of T2A aminoacids in its C-terminus) and a nuclear fluorescent reporter (with the remaining T2A aminoacids in its N-terminus).
Tables
Table 1
Experimental resources. Available experimental resources in Parhyale and corresponding references.
| Experimental Resources | References |
|---|---|
| Embryological manipulations Cell microinjection, isolation, ablation | (Gerberding et al., 2002; Extavour, 2005; Price et al., 2010; Alwes et al., 2011; Hannibal et al., 2012; Rehm et al., 2009; Rehm et al., 2009; Kontarakis and Pavlopoulos, 2014; Nast and Extavour, 2014) |
| Gene expression studies In situ hybridization, antibody staining | (Rehm et al., 2009; Rehm et al., 2009) |
| Gene knock-down RNA interference, morpholinos | (Liubicich et al., 2009; Ozhan-Kizil et al., 2009) |
| Transgenesis Transposon-based, integrase-based | (Pavlopoulos and Averof, 2005; Kontarakis et al., 2011; Kontarakis and Pavlopoulos, 2014) |
| Gene trapping Exon/enhancer trapping, iTRAC (trap conversion) | (Kontarakis et al., 2011) |
| Gene misexpressionHeat-inducible | (Pavlopoulos et al., 2009) |
| Gene knock-outCRISPR/Cas | (Martin et al., 2015) |
| Gene knock-in CRISPR/Cas homology-dependent or homology-independent | (Serano et al., 2015) |
| Live imaging Bright-field, confocal, light-sheet microscopy | (Alwes et al., 2011; Hannibal et al., 2012; Chaw and Patel, 2012; Alwes et al., 2016) |
Table 2
Assembly statistics. Length metrics of assembled scaffolds and contigs.
| # sequences | N90 | N50 | N10 | Sum length | Max length | # Ns | |
|---|---|---|---|---|---|---|---|
| scaffolds | 133,035 | 14,799 | 81,190 | 289,705 | 3.63 GB | 1,285,385 | 1.10 GB |
| unplaced contigs | 259,343 | 304 | 627 | 1779 | 146 MB | 40,222 | 23,431 |
| hetero. contigs | 584,392 | 265 | 402 | 1038 | 240 MB | 24,461 | 627 |
| genic scaffolds | 15,160 | 52952 | 161,819 | 433836 | 1.49 GB | 1,285,385 | 323 MB |
Table 3
BAC variant statistics. Level of heterozygosity of each BAC sequence determined by mapping genomic reads to each BAC individually. Population variance rate represents additional alleles found (i.e. more than 2 alleles) from genomic reads.
| BAC ID | Length | Heterozygosity | Pop.Variance |
|---|---|---|---|
| PA81-D11 | 140,264 | 1.654 | 0.568 |
| PA40-O15 | 129,957 | 2.446 | 0.647 |
| PA76-H18 | 141,844 | 1.824 | 0.199 |
| PA120-H17 | 126,766 | 2.673 | 1.120 |
| PA222-D11 | 128,542 | 1.344 | 1.404 |
| PA31-H15 | 140,143 | 2.793 | 0.051 |
| PA284-I07 | 141,390 | 2.046 | 0.450 |
| PA221-A05 | 148,703 | 1.862 | 1.427 |
| PA93-L04 | 139,955 | 2.177 | 0.742 |
| PA272-M04 | 134,744 | 1.925 | 0.982 |
| PA179-K23 | 137,239 | 2.671 | 0.990 |
| PA92-D22 | 126,848 | 2.650 | 0.802 |
| PA268-E13 | 135,334 | 1.678 | 1.322 |
| PA264-B19 | 108,571 | 1.575 | 0.157 |
| PA24-C06 | 141,446 | 1.946 | 1.488 |
Table 4
Small RNA processing pathway members. The Parhyale orthologs of small RNA processing pathway members.
| Gene | Counts | Gen ID |
|---|---|---|
| Armitage | 2 | phaw_30_tra_m.006391 phaw_30_tra_m.007425 |
| Spindle_E | 3 | phaw_30_tra_m.000091 phaw_30_tra_m.020806 phaw_30_tra_m.018110 |
| rm62 | 7 | phaw_30_tra_m.014329 phaw_30_tra_m.012297 phaw_30_tra_m.004444 phaw_30_tra_m.012605 phaw_30_tra_m.001849 phaw_30_tra_m.006468 phaw_30_tra_m.023485 |
| Piwi/aubergine | 2 | phaw_30_tra_m.011247 phaw_30_tra_m.016012 |
| Dicer 1 | 1 | phaw_30_tra_m.001257 |
| Dicer 2 | 1 | phaw_30_tra_m.021619 |
| argonaute 1 | 1 | phaw_30_tra_m.006642 |
| arogonaute 2 | 3 | phaw_30_tra_m.021514 phaw_30_tra_m.018276 phaw_30_tra_m.012367 |
| Loquacious | 2 | phaw_30_tra_m.006389 phaw_30_tra_m.000074 |
| Drosha | 1 | phaw_30_tra_m.015433 |
Additional files
-
Source code 1
iPython Notebook for Parhyale genome assembly.
Includes bioinformatic processsing of raw read data, k-mer analysis, contig assembly, scaffolding and CEGMA cased representation analyis.
- https://doi.org/10.7554/eLife.20062.046
-
Source code 2
iPython Notebook for repeat analysis.
Includes repeat analysis of the Parhyale genome using Repeat Modeller and Repeat Masker.
- https://doi.org/10.7554/eLife.20062.047
-
Source code 3
iPython Notebook for transcriptome and annotation.
Parhyale transcriptome assembly, genome annotation and generation of canonical proteome dataset.
- https://doi.org/10.7554/eLife.20062.048
-
Source code 4
iPython Notebook for variant analysis.
Analysis of polymorphism in Parhyale using genome reads, transcriptome data and sanger sequenced BACs.
- https://doi.org/10.7554/eLife.20062.049
-
Source code 5
iPython Notebook of orthology analysis.
Protein orthology analysis between Parhyale and other species
- https://doi.org/10.7554/eLife.20062.050
-
Source code 6
iPython Notebook for RNA.
Analysis of microRNAs and putative lncRNAs in Parhyale.
- https://doi.org/10.7554/eLife.20062.051
Download links
A two-part list of links to download the article, or parts of the article, in various formats.
Downloads (link to download the article as PDF)
Open citations (links to open the citations from this article in various online reference manager services)
Cite this article (links to download the citations from this article in formats compatible with various reference manager tools)
The genome of the crustacean Parhyale hawaiensis, a model for animal development, regeneration, immunity and lignocellulose digestion
eLife 5:e20062.
https://doi.org/10.7554/eLife.20062


