A conserved bacterial protein induces pancreatic beta cell expansion during zebrafish development
- University of Oregon, United States
- Harvard T. H. Chan School of Public Health, United States
- The Broad Institute, United States
- Canadian Institute for Advanced Research, Canada
Figures
Figure 1
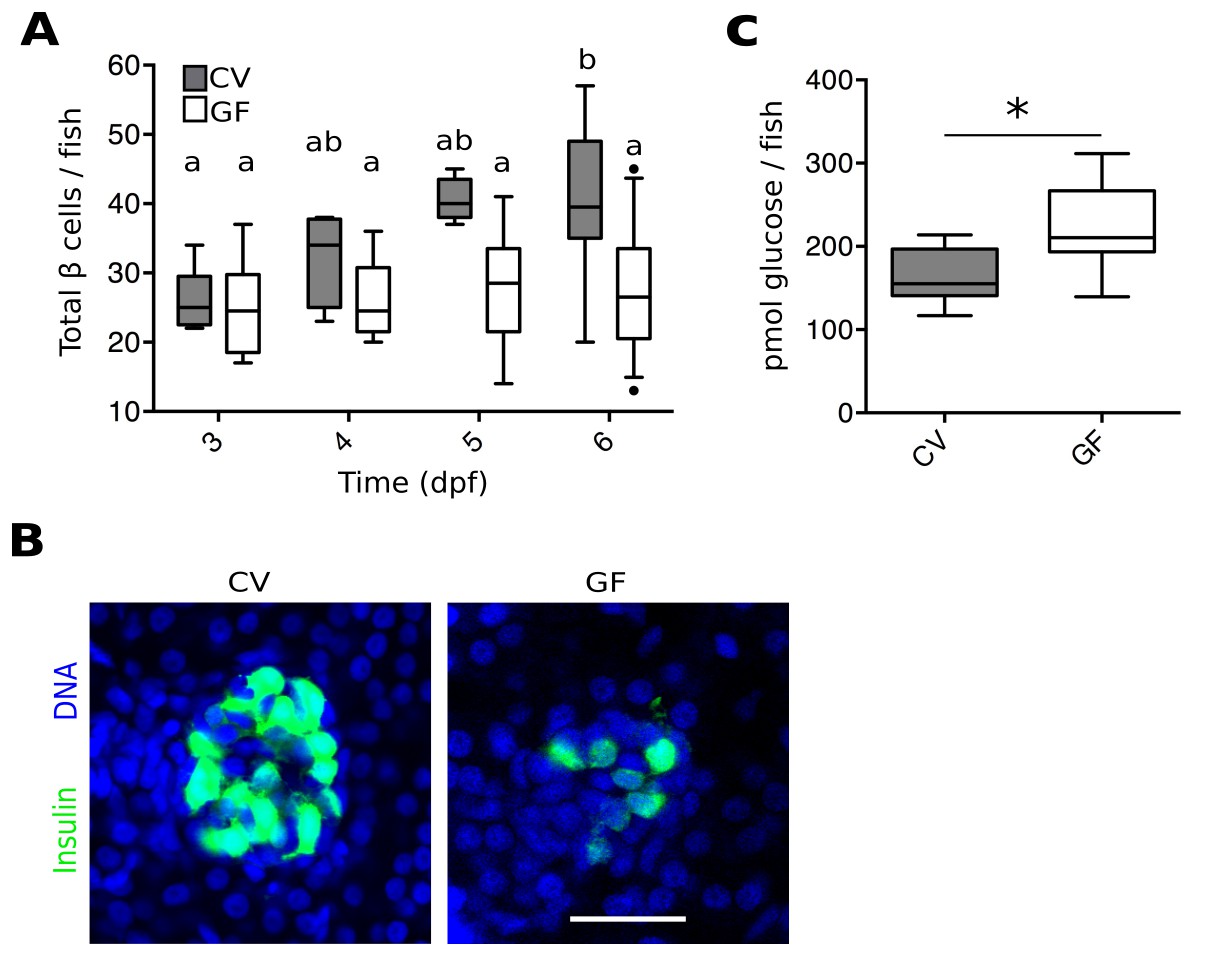
The microbiota are required for normal expansion of the larval β cell mass.
(A) Total number of β cells per larva in GF (white box plots) and CV (grey box plots) fish at 3, 4, 5 and 6 dpf. In this, and in all subsequent figures, CV data are shown in grey box plots, and GF data, or statistically similar treatment groups, are shown in white box plots. In all relevant panels and remaining figures, box plot whiskers represent the 95% confidence interval of the data set. Single factor ANOVA indicates that gnotobiology of the fish was significant in determining the number of β cells present (F7=9.01, p=1.45e−8). Labels a, ab and b indicate the results of post hoc means testing (Tukey). The difference between GF and CV cell counts became significant at 6 dpf (t=−5.91, p<0.001). (B) Representative 2D slices from confocal scans through the primary islets of 6 dpf CV and GF Tg(-1.0insulin:eGFP) larvae. Each slice is taken from the approximate center of the islet structure. Insulin promoter expressing β cells are in green and nuclei are blue. Scale bar = 40 μM. (C) The average amount of glucose (pmol) per larva aged 6 dpf (* t17=−3.65, p<0.01).
-
Figure 1—source data 1
Quantifications and statistical analysis of larval β cells corresponding to Figure 1A.
Exact values of N, mean, median, SD, and SEM are reported in the source data file and are highlighted in yellow, magenta, blue, green, and cyan, respectively.
- https://doi.org/10.7554/eLife.20145.004
-
Figure 1—source data 2
Quantifications and statistical analysis of 6 dpf larval free glucose levels corresponding to Figure 1C.
Exact values of N, mean, median, SD, and SEM are reported in the source data file and are highlighted in yellow, magenta, blue, green, and cyan, respectively.
- https://doi.org/10.7554/eLife.20145.005
Figure 2
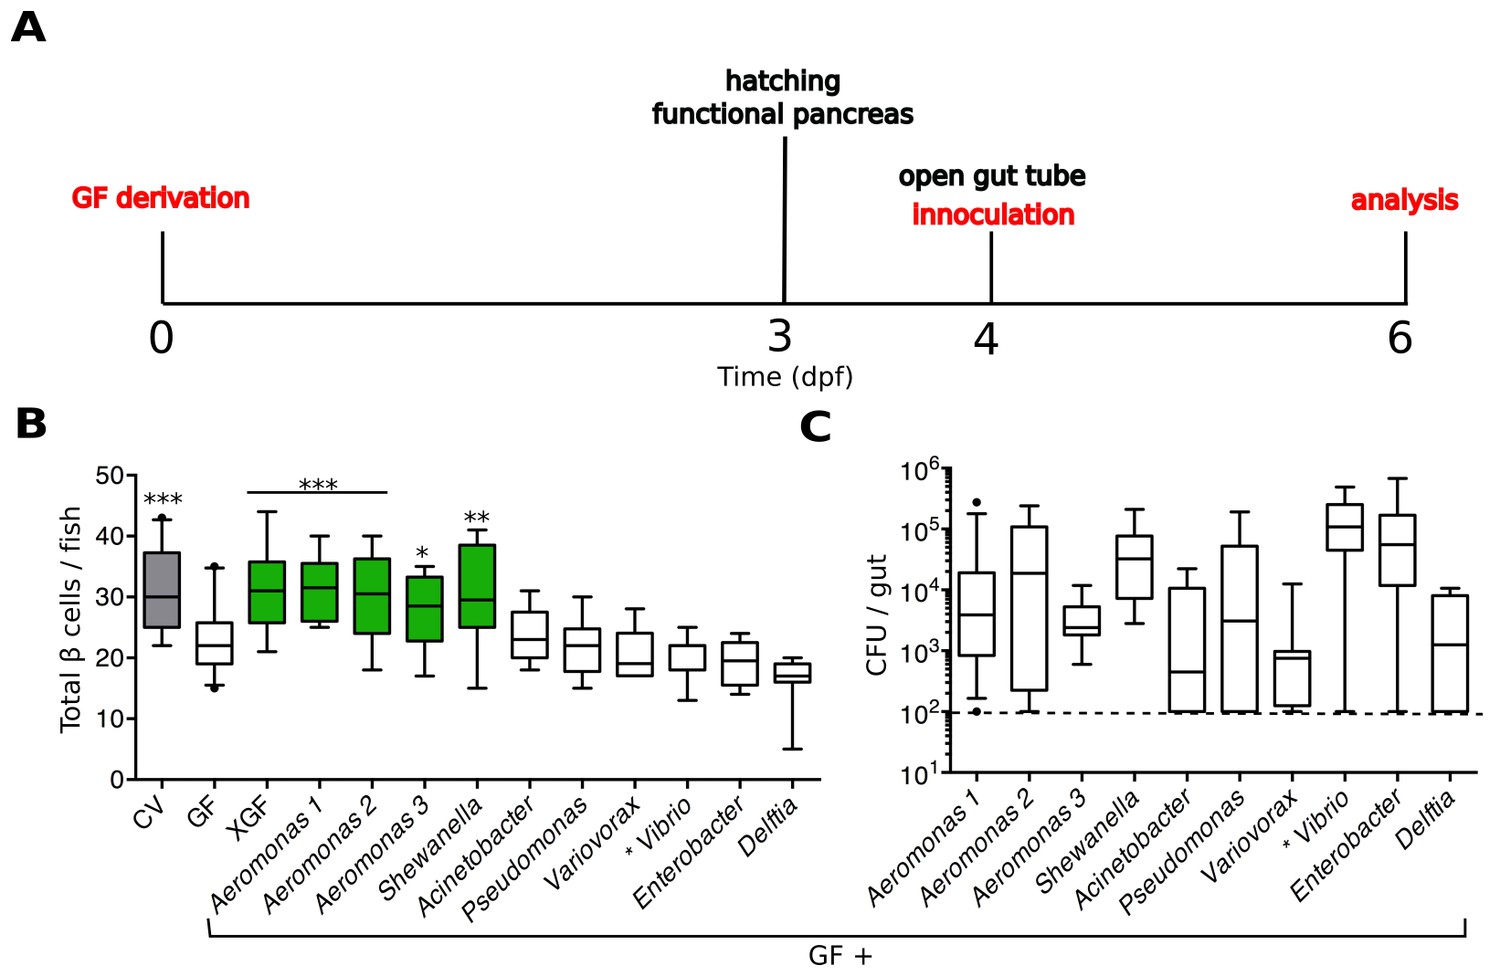
Specific bacterial members of the zebrafish microbiota are sufficient to rescue normal expansion of the GF β cell mass.
(A) Experimental timeline for all subsequent zebrafish experiments, unless stated otherwise.Experimental manipulations are denoted by red text. Important zebrafish developmental events are denoted by black text. (B) Quantification of β cells in CV, GF and GF larvae treated at 4 dpf with either non-sterile tank water (XGF) or mono-associated with a specific bacterial strain. Bacterial mono-associations are labeled by genus. Different Aeromonas sp are labeled with a number (1, 2 or 3). *p<0.05, **p<0.01, ***p<0.001: Denotes treatment that is significantly different than GF by Tukey analysis. Additionally, here and in all subsequent figures, significant data sets (p<0.05 when compared to GF) are also highlighted as green box plots. (C) Bacterial isolates of the zebrafish gut and related strains are capable of forming mono-associations with larvae from 4 to 6 dpf. Quantification of the colony forming units (CFUs) per gut for each bacterial strain, assayed after 48-hr exposure to GF larvae. Dashed line denotes the limit of detection.
-
Figure 2—source data 1
Quantifications and statistical analysis of larval β cells corresponding to Figure 2B.
Exact values of N, mean, median, SD, and SEM are reported in the source data file and are highlighted in yellow, magenta, blue, green, and cyan, respectively.
- https://doi.org/10.7554/eLife.20145.007
Figure 3 with 1 supplement
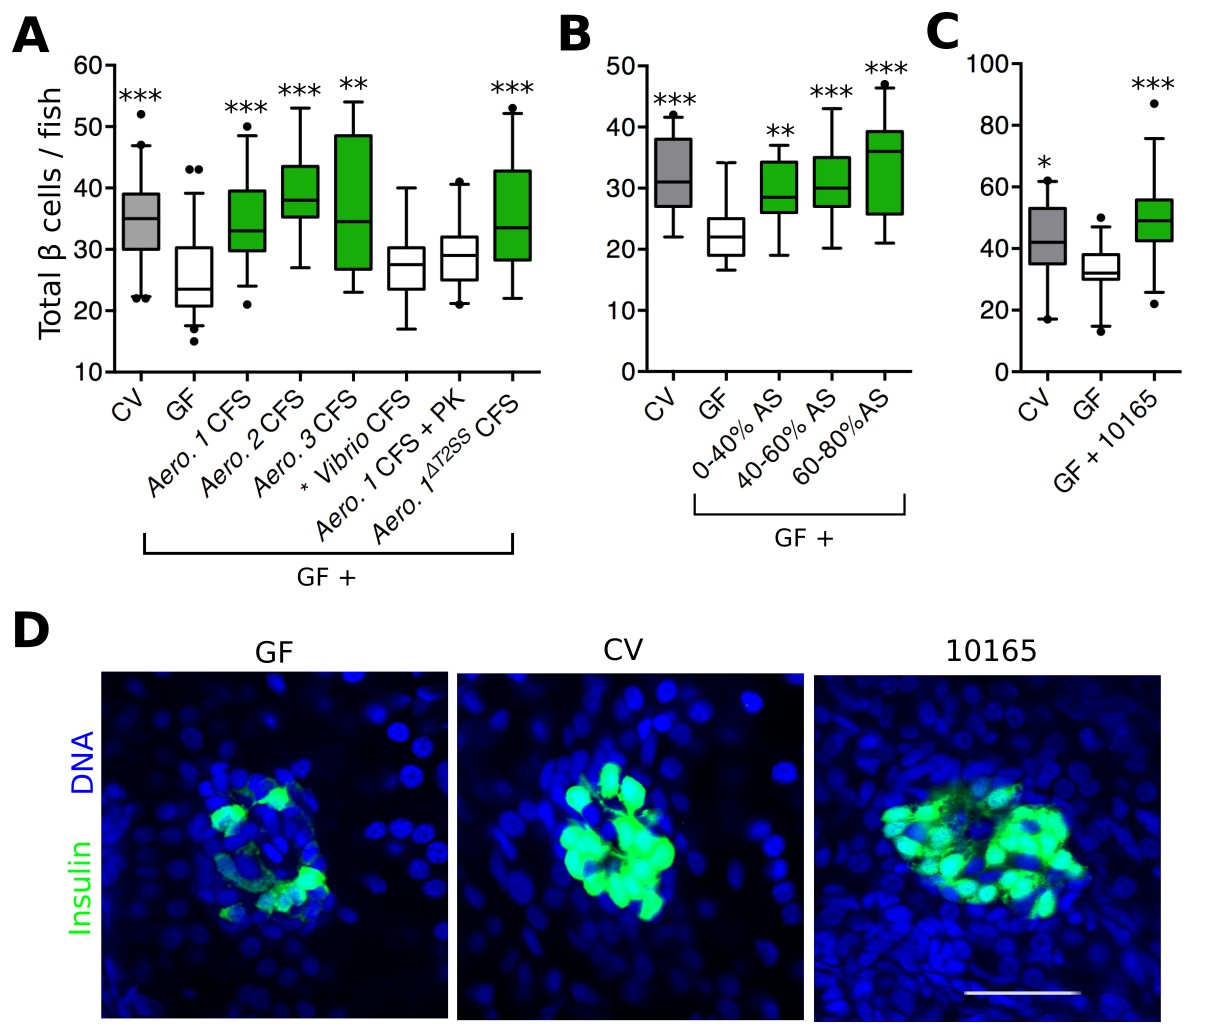
Aeromonas secretes a factor that rescues normal expansion of the GF β cell mass.
(A) Total β cell numbers in GF, CV and GF fish treated at 4 dpf with different cell free supernatant (CFS) samples. 'Aero.' refers to bacteria of the genus Aeromonas, with each number (1, 2, 3) denoting a separate species. '+ PK' indicates proteinase K addition to the CFS sample prior to treatment. *p<0.05, **p<0.01, ***p<0.001: Denotes treatment that is significantly different than GF by Tukey analysis. (B) Total β cell numbers in CV, GF and GF fish treated at 4 dpf with separate ammonium sulfate fractions (% AS) prepared from the Aeromonas 1ΔT2SS CFS. Note that the 60–80% ammonium sulfate fraction resulted in the greatest increase in β cell numbers. (C) Total β cells in GF, CV and GF fish treated with purified protein. 10165 represents purified protein from the M001_10165 locus. (D) Representative 2D slices from confocal scans through the primary islets of GF, CV and 10165 protein treated Tg(-1.0insulin:eGFP) 6 dpf larvae. Insulin promoter expressing β cells are shown in green and nuclei are blue. Scale bar = 40 μM.
-
Figure 3—source data 1
Quantifications and statistical analysis of larval β cells corresponding to Figures 3A.
Exact values of N, mean, median, SD, and SEM are reported in the source data file and are highlighted in yellow, magenta, blue, green, and cyan, respectively.
- https://doi.org/10.7554/eLife.20145.009
-
Figure 3—source data 2
Quantifications and statistical analysis of larval β cells corresponding to Figure 3B.
- https://doi.org/10.7554/eLife.20145.010
-
Figure 3—source data 3
Quantifications and statistical analysis of larval β cells corresponding to Figure 3C.
- https://doi.org/10.7554/eLife.20145.011
Figure 3—figure supplement 1
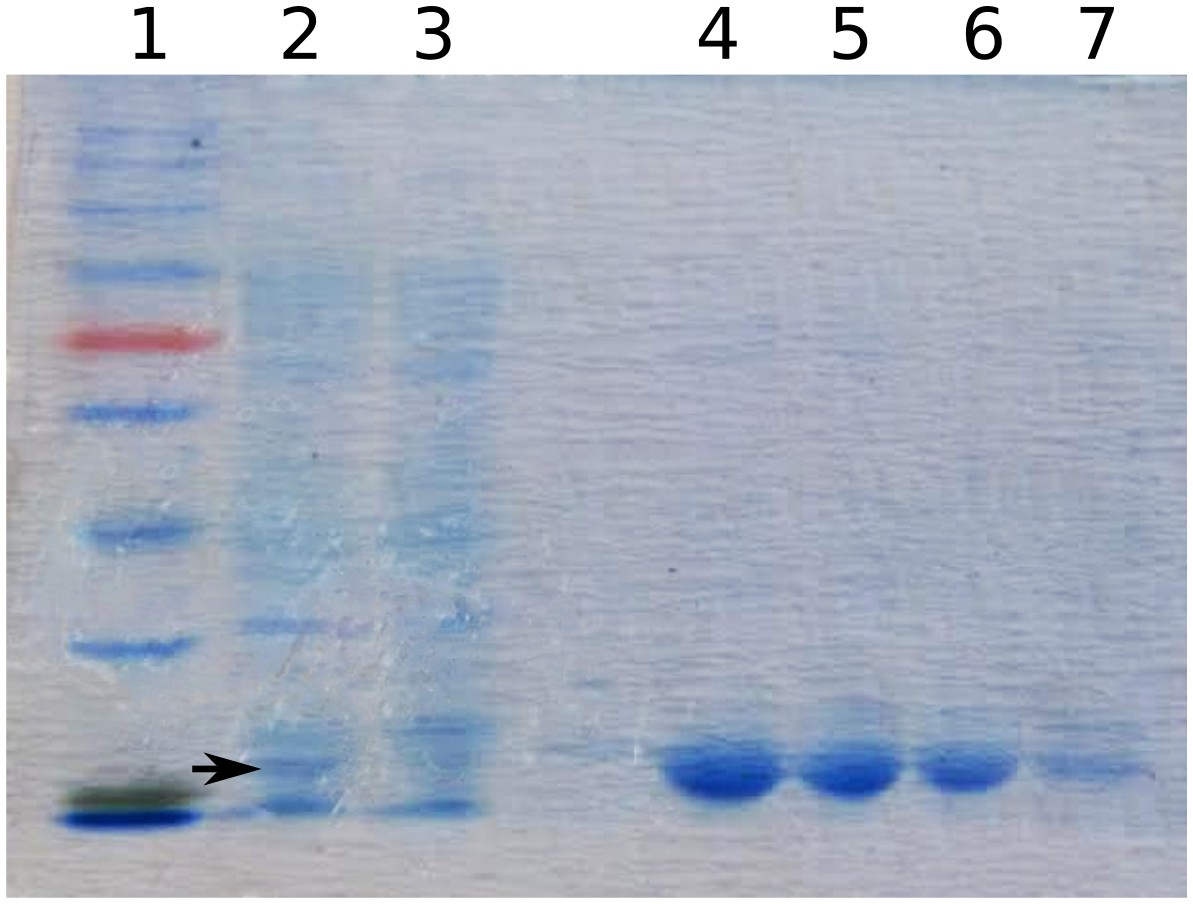
10165 (BefA) protein purification.
SDS-page gel image showing subsequent steps in the purification of BefA (black arrowhead) from E. coli cell lysate; lane 1: ladder, lane 2: cell lysate after IPTG induction, lane 3: supernatant from cell lysate after addition of nickel beads, lanes 4-7: elutions of BefA from beads.
Figure 4 with 1 supplement

BefA is required for Aeromonas to induce GF β cell expansion.
(A) Quantification of the colony forming units (CFUs) per gut in GF fish mono-associated (MA) with either wild type (WT) or mutant (△befA) A. veronii strains for 48 hr. Dashed line denotes the limit of detection (B) Total β cells in GF fish that have been mono-associated with △befA, treated with CFS from either WT or △befA, treated with purified BefA, or have been inoculated with a combination of these. **p<0.01, ***p<0.001: Denotes treatment that is significantly different than GF by Tukey analysis.
-
Figure 4—source data 1
Quantifications and statistical analysis of larval β cells corresponding to Figure 4B.
Exact values of N, mean, median, SD, and SEM are reported in the source data file and are highlighted in yellow, magenta, blue, green, and cyan, respectively.
- https://doi.org/10.7554/eLife.20145.014
Figure 4—figure supplement 1
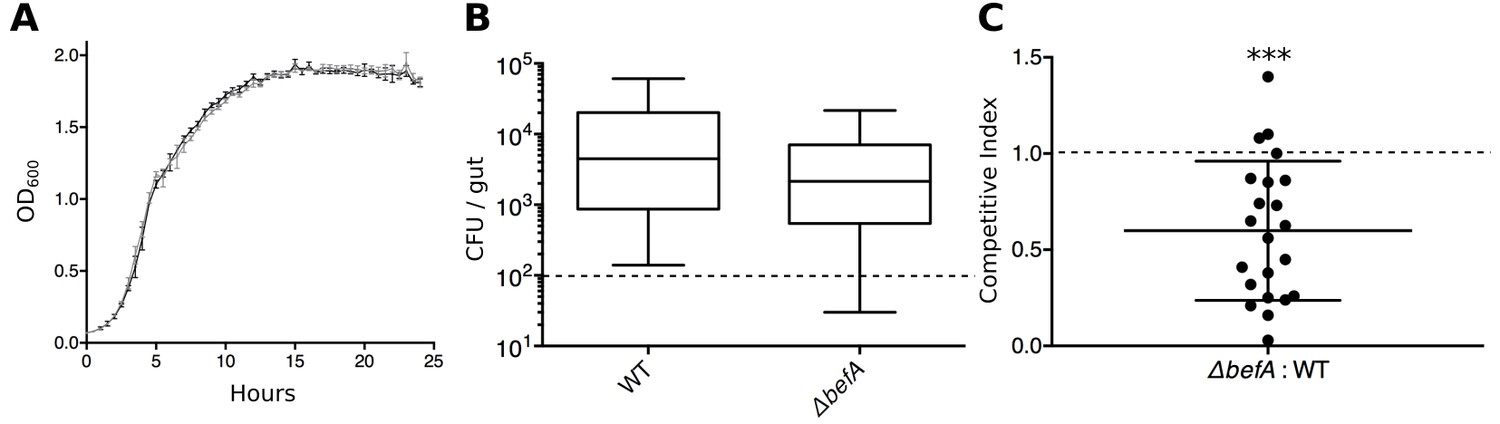
BefA confers a colonization advantage in the larval zebrafish gut.
(A) Growth rates of A. veroniiWT (black trace) and A. veroniiΔbefA (grey trace) in vitro. Density measurements (OD600) were taken every half hour for 25 hours on three replicate cultures grown in Lauria broth. (B) Resulting CFU’s of A. veroniiWT (WT) and A. veroniiΔbefA (ΔbefA) within the 6dpf larval gut after inoculation with a 1:1 ratio of each strain at 4 dpf. Dashed line denotes the limit of detection. (C) Competitive index (CI) calculation for data within panel B. CI value was calculated for each fish (n=22) by dividing the ratio of mutant to WT bacteria within each gut by 6 dpf, divided by the ratio of mutant to WT bacteria used to inoculate the fish at 4 dpf. A one-sample t-test indicates that the mean CI value is significantly less than 1 (dashed line) (***t21=−3.21, p<0.0001.) A CI value of 1 is expected if no competition exists.
Figure 5 with 1 supplement
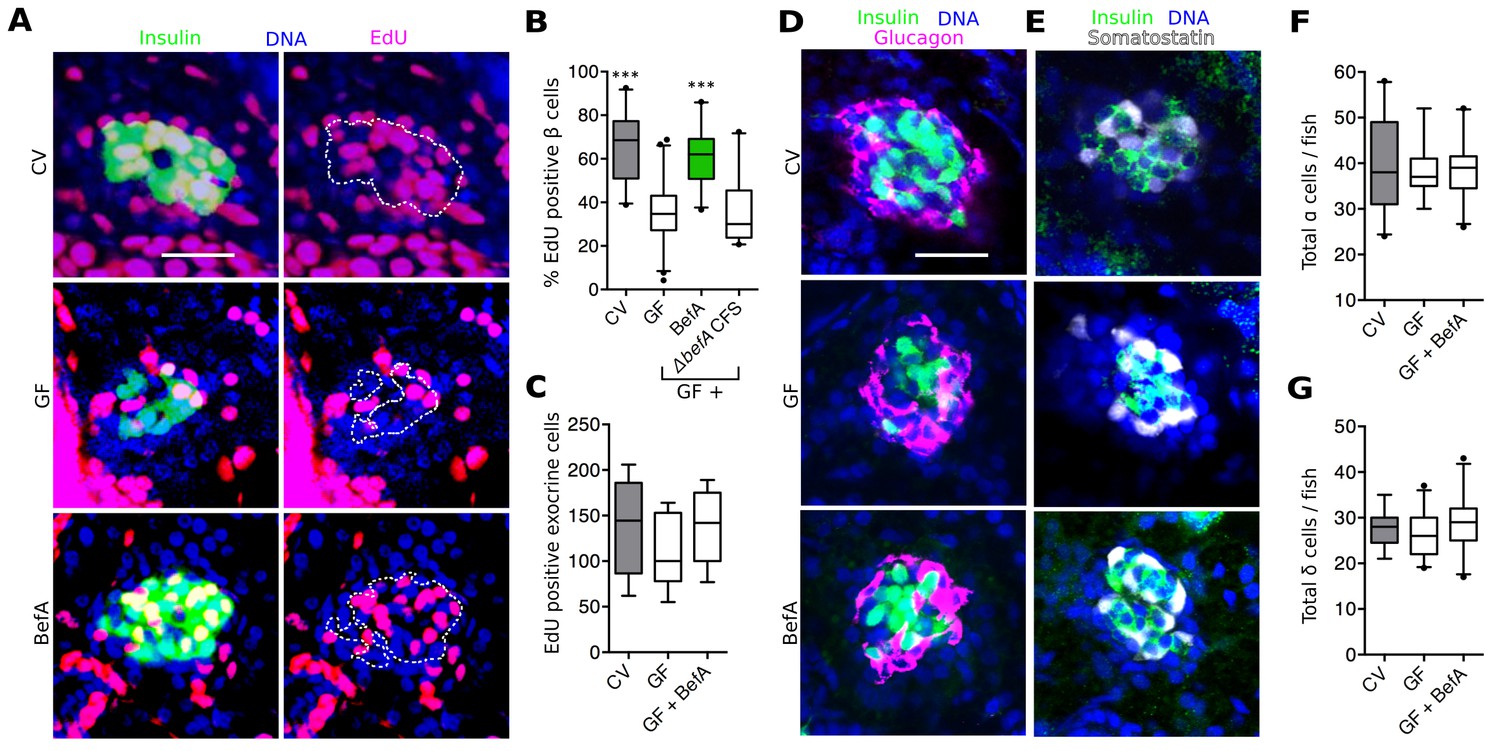
BefA facilitates β cell mass expansion through proliferation.
(A, D & E) Representative 2D slices from confocal scans through the primary islets of GF, CV and BefA (10165) protein treated 6 dpf larvae. Scale bars = 40 μM. (A) Insulin promoter expressing β cells are shown in green, all nuclei are blue, and EdU containing nuclei are magenta. Left hand panels are a merge of all three markers. For ease of resolving cells that are double positive for both insulin and EdU, the right hand panels show the location of insulin outlined by white dashed lines. (B) Percentage of EdU positive β cells in CV, GF or GF treated with either purified BefA or CFS from A. veroniiΔbefA cultures (△befA CFS). ***p<0.001: Denotes treatment that is significantly different than GF by Tukey analysis. (C) Total EdU positive exocrine cells quantified from the approximate central longitudinal plane of the pancreas in each fish. (D) Insulin promoter expressing β cells are shown in green, all nuclei are blue, and α cells, stained with anti-glucagon antibody are magenta. (E) Somatostatin promoter expressing δ cells are shown in white, all nuclei are blue, and β cells stained with anti-insulin antibody are outlined in green. (F) Total α cells in GF, CV and GF fish treated with BefA. (G) Total δ cells in GF, CV and GF fish treated with BefA.
-
Figure 5—source data 1
Quantifications and statistical analysis of proliferation of larval β cells corresponding to Figure 5B.
Exact values of N, mean, median, SD, and SEM are reported in the source data file and are highlighted in yellow, magenta, blue, green, and cyan, respectively.
- https://doi.org/10.7554/eLife.20145.017
Figure 5—figure supplement 1
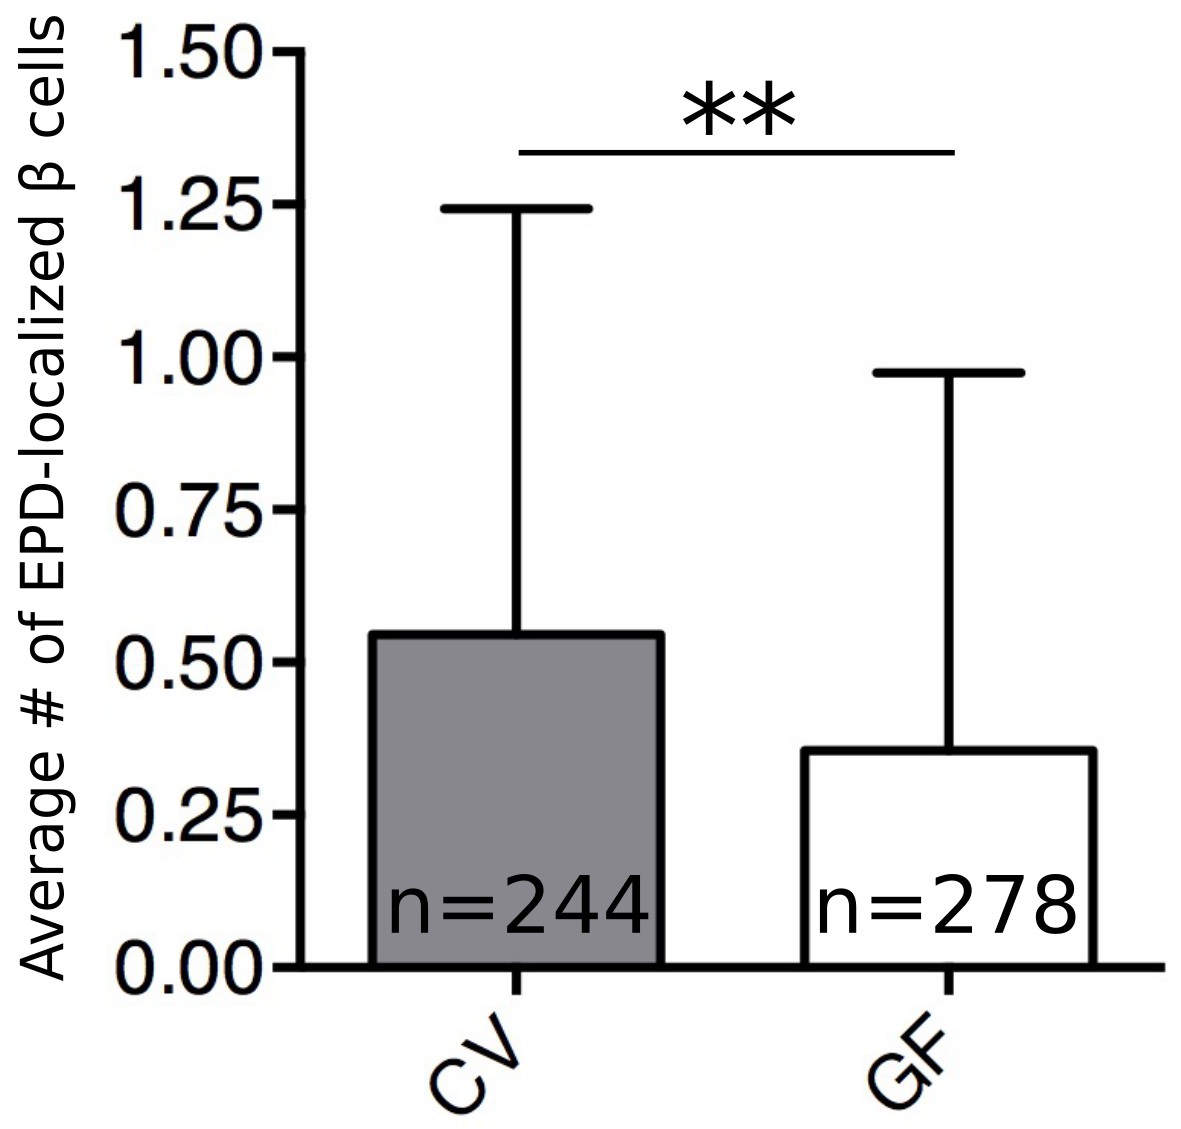
The microbiota increase β cell neogenesis from the EPD.
Quantification of EDP localized insulin expressing cells per animal in 6 dpf CV and GF larvae.Error bars represent the standard deviation. **t520=3.28, p=0.0011.
Figure 6 with 1 supplement
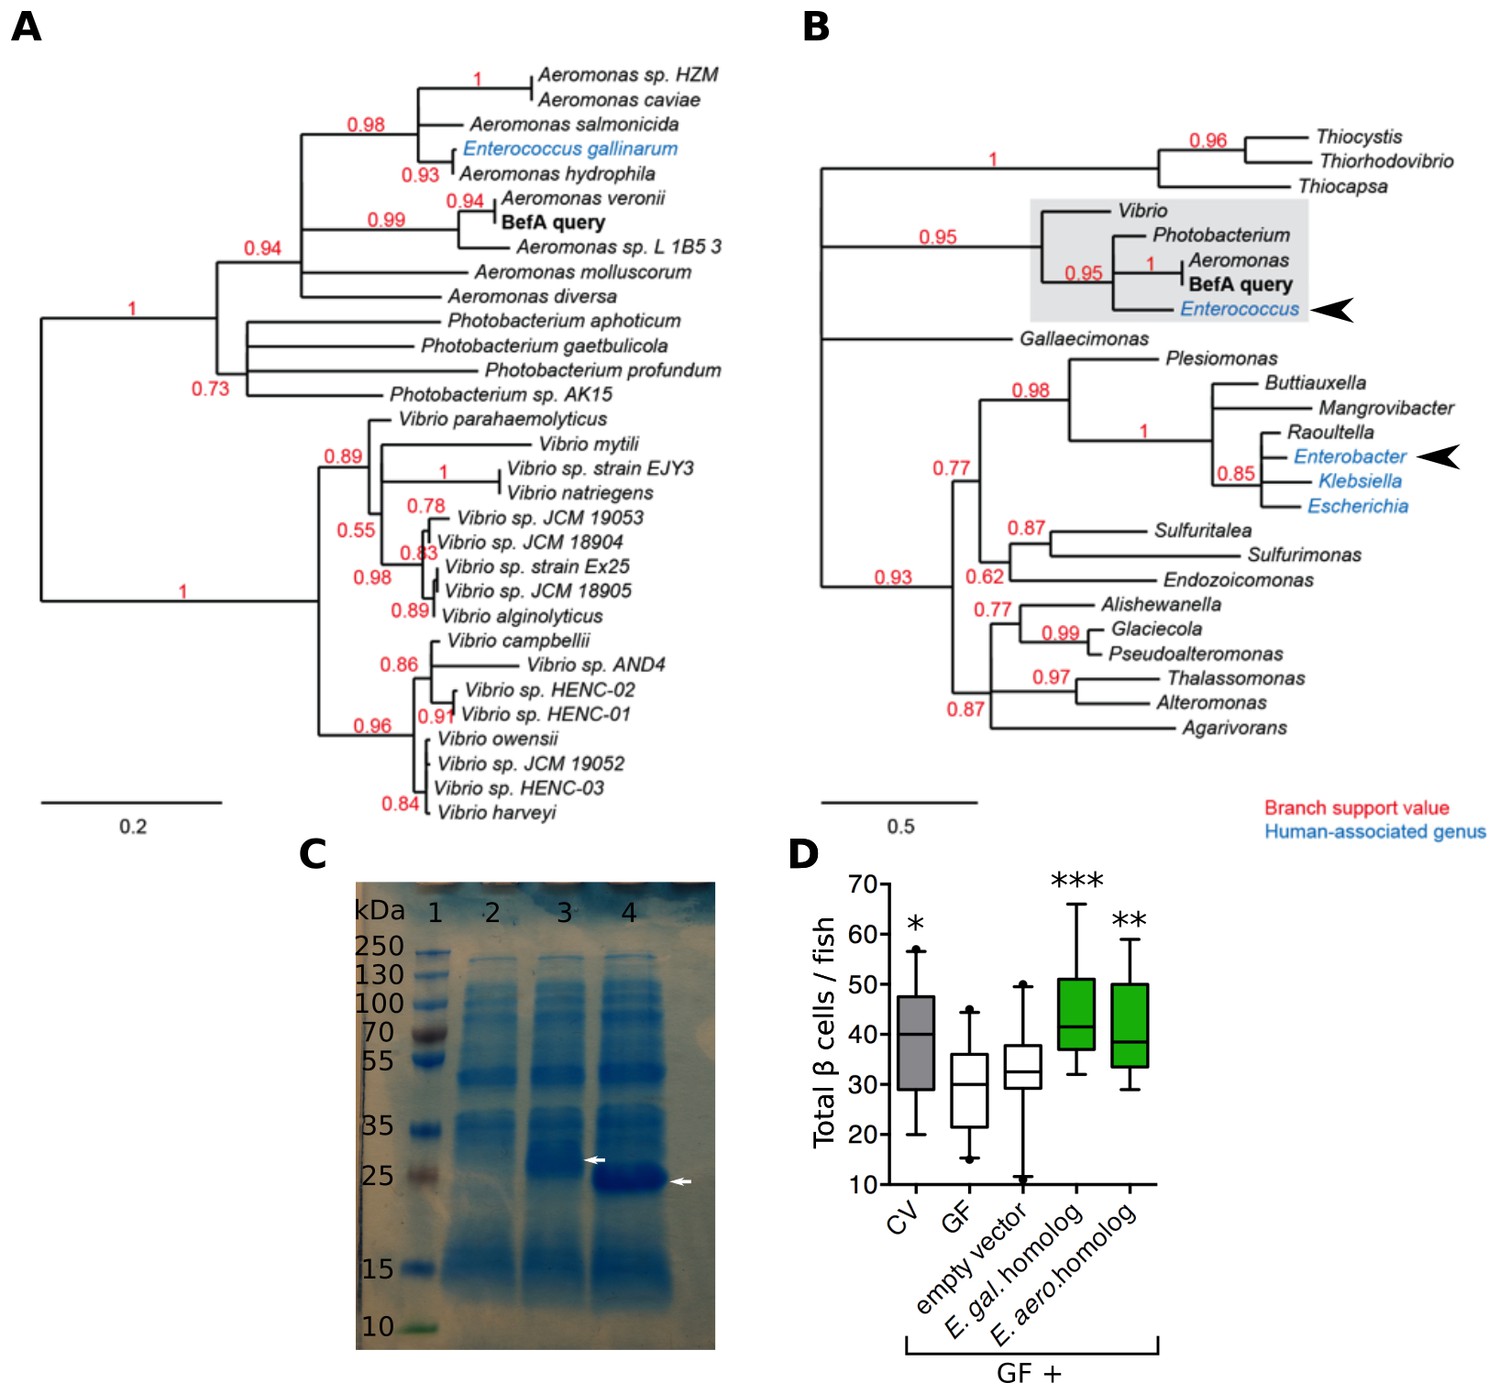
Homologs of BefA encoded in the human microbiome have conserved function in zebrafish.
(A) Close homologs of BefA across microbial species. Each species is represented by its closest BefA homolog, with a minimum allowed amino acid sequence identity of 50% (relative to the query sequence). Notably, the Enterococcus gallinarum homolog clusters among homologs from the Aeromonas genus, which is evidence of a possible lateral gene transfer event. (B) A view of the BefA phylogeny including more distant homologs (sequence identity >20%) and grouped by genus. The portion of the tree represented in A is contained in the light gray box. In both panels, red numbers indicate branch support (values closer to 1 are better supported); branches with support values <0.5 have been collapsed. Blue clades indicate genera that were associated with humans in metagenomes produced during the Human Microbiome Project (HMP). Black arrowheads indicate genera tested for functional conservation in panel D. Scale bars indicate amino acid substitutions per amino acid site. (C) SDS-page gel: 1 = ladder, 2 = CFS from induction of E. coli BL21 carrying an empty vector, 3 = CFS from induction of E. coli BL21 carrying vector with an Enterococcus gallinarum homolog, estimated size of 29 kDa, lane 4 = CFS from induction of E. coli BL21 carrying vector with Enterobacter aerogenes homolog, estimated size of 21 kDa. White arrows indicate induced proteins. (D) Total β cells in CV, GF and GF fish that have been treated with either induced BL21 E. coli supernatant dominated by the homologous BefA protein encoded from Enterococcus gallinarum (E. gal. homolog) and Enterobacter aerogenes (E. aero. homolog), or induced supernatant from an empty vector control. *p<0.05, **p<0.01, ***p<0.001: Denotes treatment that is significantly different than GF by Tukey analysis.
-
Figure 6—source data 1
Quantifications and statistical analysis of larval β cells corresponding to Figure 6D.
Exact values of N, mean, median, SD, and SEM are reported in the source data file and are highlighted in yellow, magenta, blue, green, and cyan, respectively.
- https://doi.org/10.7554/eLife.20145.020
Figure 6—figure supplement 1
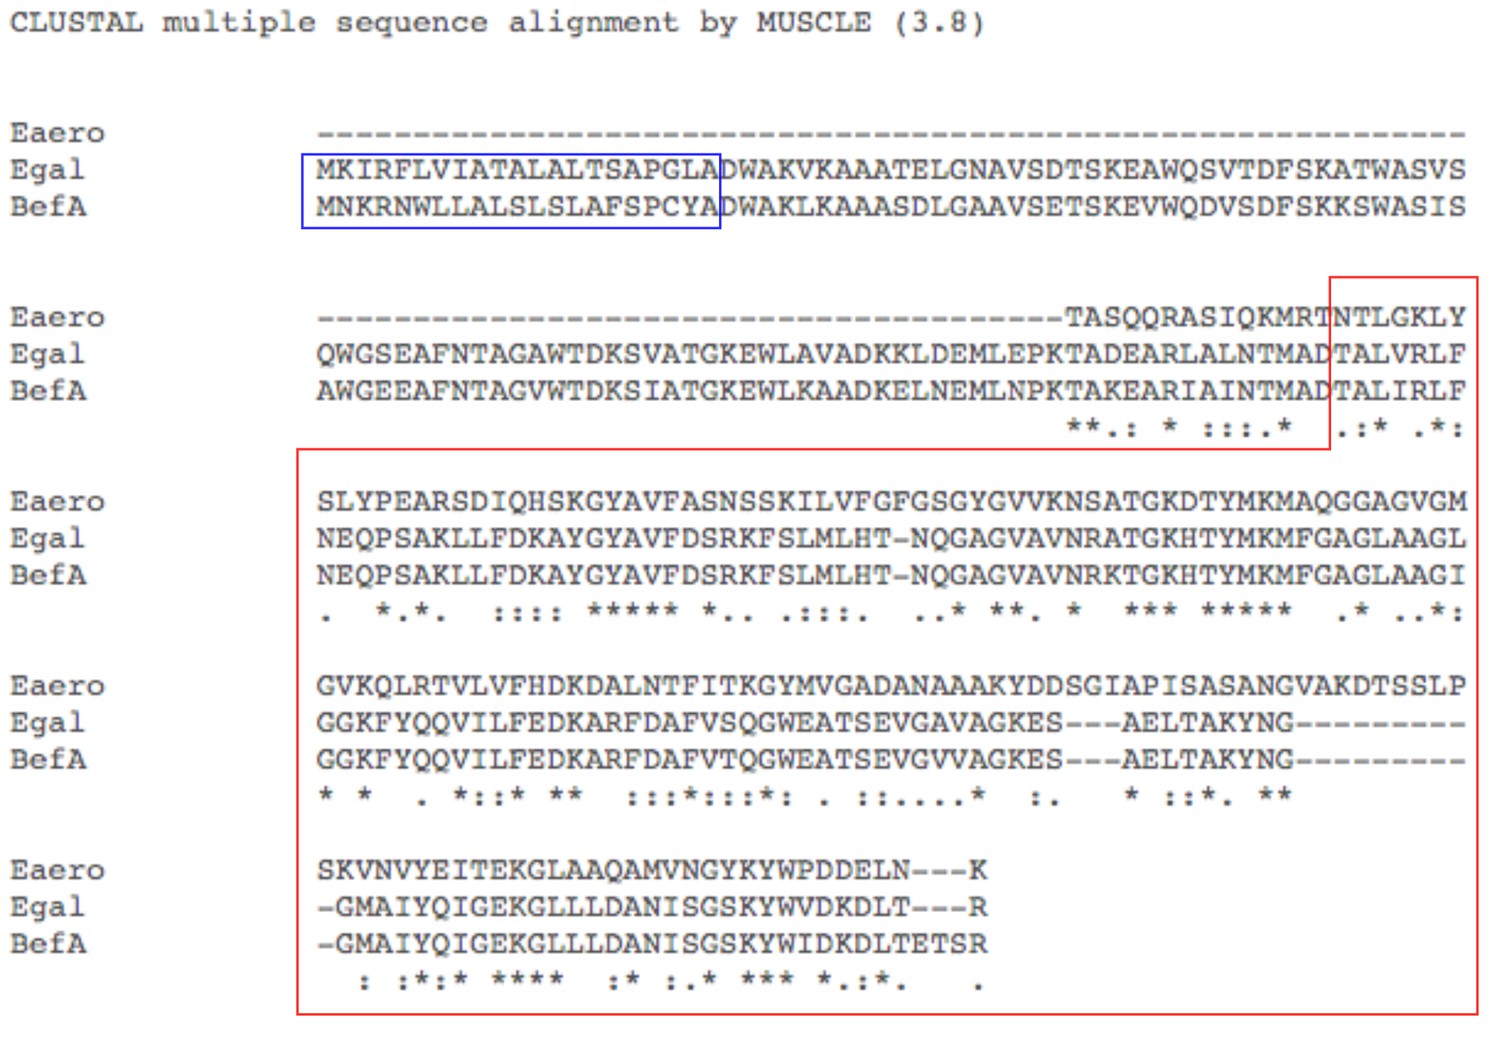
Amino acid sequence alignment of BefA and functionally conserved homologs.
Amino acid sequence alignment by MUSCLE.Egal = Enterococcus gallinarum homolog sequence, Eaero = Enterobacter aerogenes homolog sequence, and BefA = original Aeromonas veronii HM21 BefA sequence. Red box contains predicted SYLF domain. Blue box indicates predicted secretion peptides.
Additional files
-
Supplementary file 1
Mass spectrometry: Aeromonas CFS inventory.
Relative abundance of protein species (spectral count) within the 60–80% ammonium sulfate fraction of the A. veroniiΔT2SS CFS. BefA is listed in bold and highlighted in green (uncharacterized protein).
- https://doi.org/10.7554/eLife.20145.022
Download links
A two-part list of links to download the article, or parts of the article, in various formats.
Downloads (link to download the article as PDF)
Open citations (links to open the citations from this article in various online reference manager services)
Cite this article (links to download the citations from this article in formats compatible with various reference manager tools)
A conserved bacterial protein induces pancreatic beta cell expansion during zebrafish development
eLife 5:e20145.
https://doi.org/10.7554/eLife.20145


