The heritability of multi-modal connectivity in human brain activity
- University of Oxford, United Kingdom
- University of Warwick, United Kingdom
- University of Nottingham, United Kingdom
- Washington University, United States
Figures
Figure 1 with 6 supplements
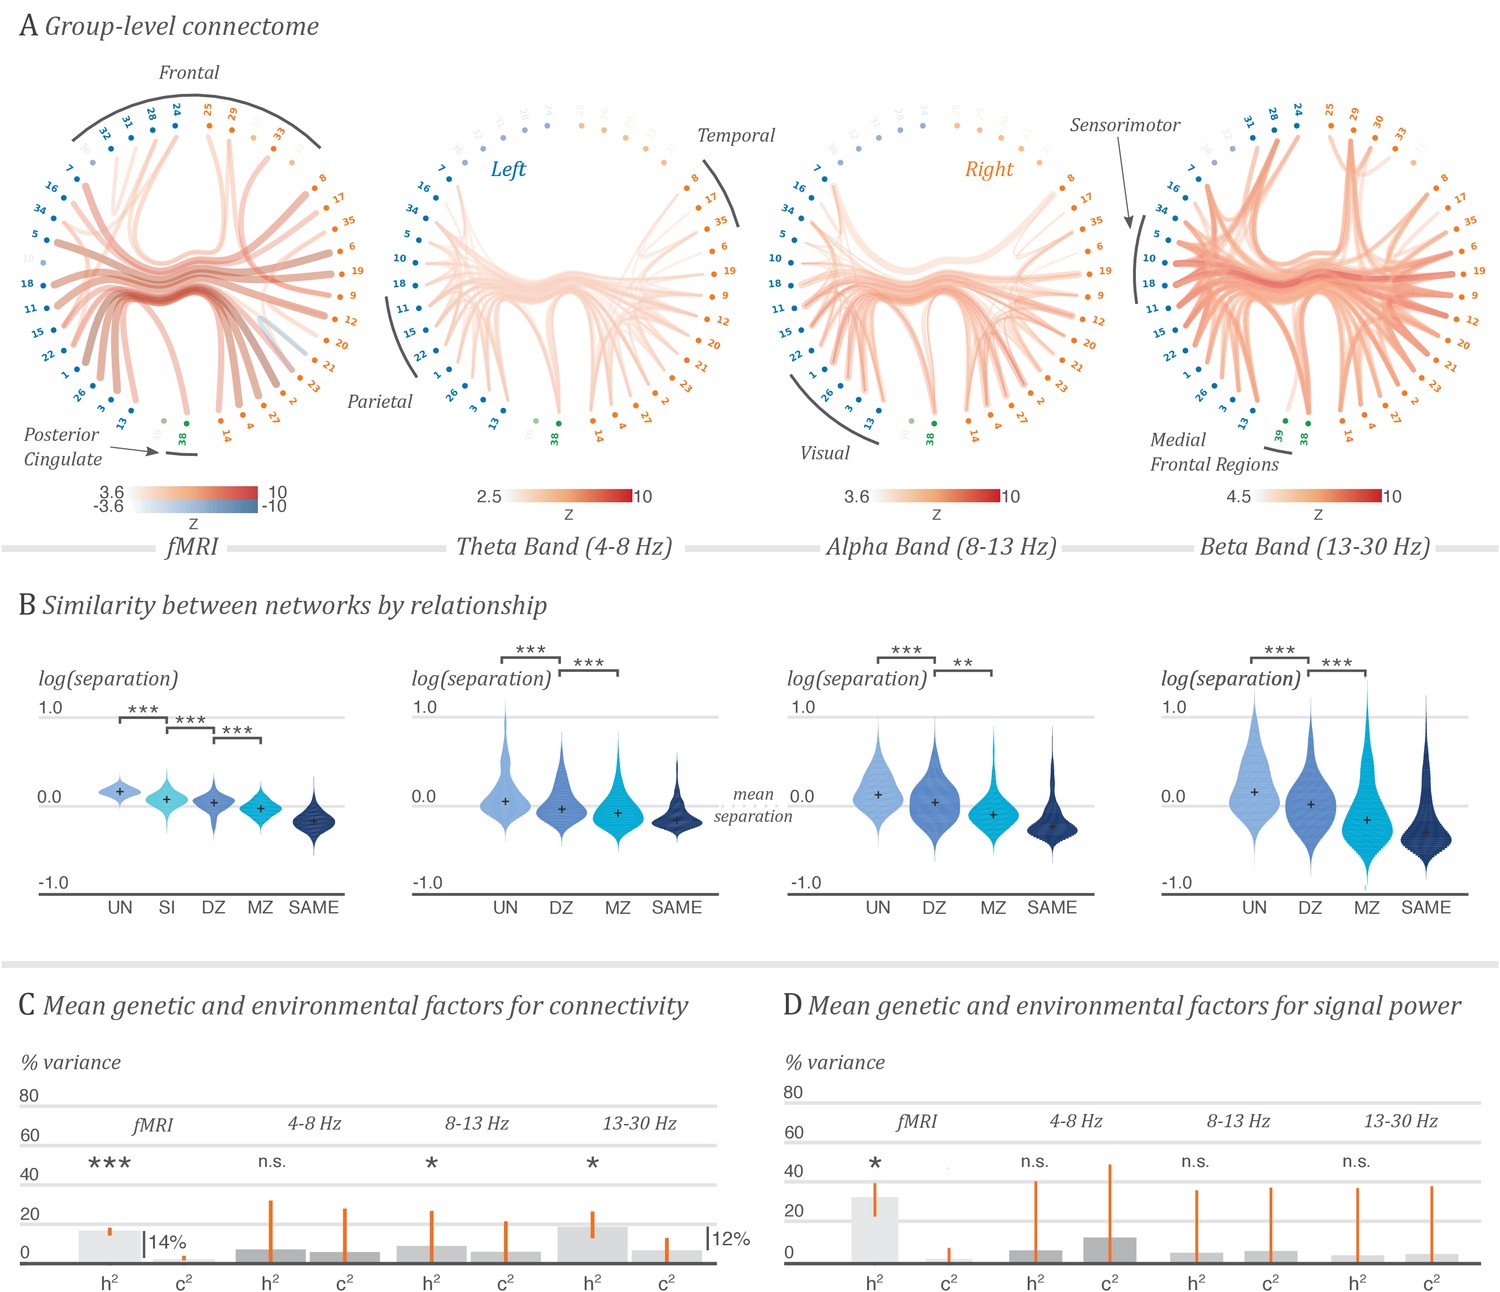
Contribution of genetic factors to functional connectivity outweighs that of the environment shared between twins.
A. Grand average functional connectome for fMRI and for the theta, alpha and beta MEG oscillatory bands. The coloured edge maps show group-average network matrices for correlations in oscillatory amplitude in each band, and partial correlations in BOLD response, thresholded for visualisation. Nodes are annotated by cortical region, and labelled in Supplementary file 1. 3D renderings of these connectomes are shown in Figure 1—videos 1 to 4. B. Similarity of pairs of network matrices, separated by the relationship status of each pair. Subjects with a shared environment, and a greater proportion of shared genetics, have more similar organisation of neuronal coupling. Violin plots show distributions of distance values between pairs of network matrices estimated from single resting-state recording sessions, on a logarithmic scale relative to the mean network separation over all pairings, for pairs of unrelated subjects (UN), siblings (SI), dizygotic twin pairs (DZ), monozygotic twin pairs (MZ) and for repeated sessions with the same subject (SAME). C. Average genetic and shared environmental contributions to the variability of functional connectivity. The bar charts show the mean genetic component (heritability, ) and mean shared environment component () from a variance decomposition model fitted on each network edge, with 95% bootstrapped confidence intervals on the mean. Annotations indicate the difference in contribution between genes and the shared or developmental environment. The values of and are expressed as proportions of the total variance. The difference between their total and unity is , the remaining environmental and measurement noise component. D. Average genetic and shared environmental contributions to the variability of oscillatory power, or BOLD response, in each ROI. Stars indicate significant differences in mean value for each of the displayed comparisons: ***p<0.001; **p<0.01; *p<0.05; n.s., not significant. The non-parametric p-values were computed by permutation and corrected for multiple comparisons over the 21 tests performed.
Figure 1—figure supplement 1
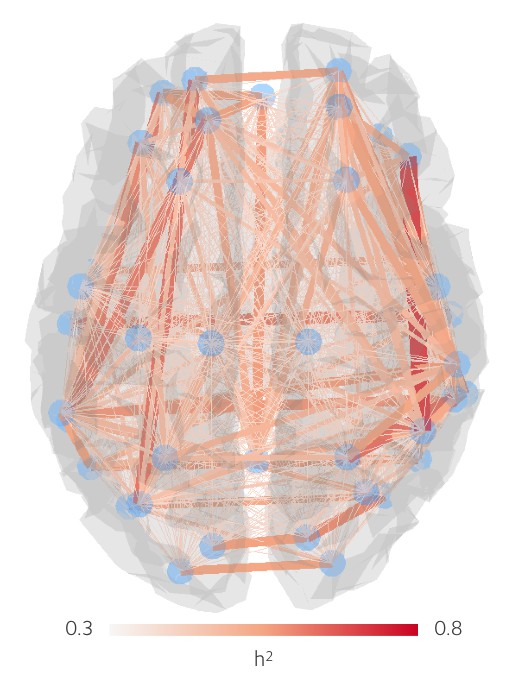
Heritabilities of fMRI connection strengths.
Parameter estimates for the influence of additive genetics, , on each individual network connection, for partial correlations in BOLD time courses derived from each ROI.
Figure 1—figure supplement 2
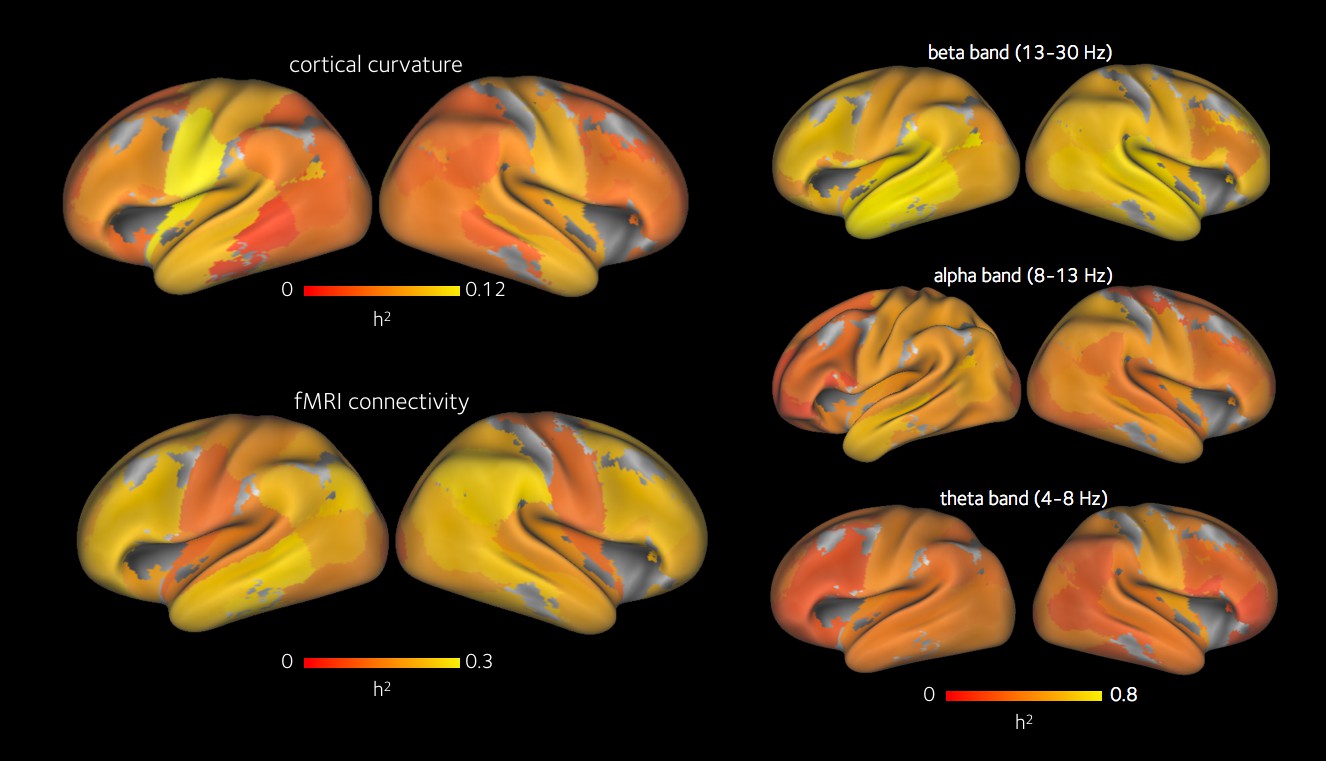
Heritability of cortical curvature, and spatial profile of the heritability of functional connections.
Top left: mean heritability of cortical curvature within each ROI. Bottom left: heritability of each fMRI network connection, averaged onto each relevant ROI. Right, top to bottom: heritability of each MEG network connection in beta, alpha and theta bands, averaged onto each relevant ROI.
Figure 1—video 1
Animated rendering of the fMRI grand-mean network matrices shown in Figure 1A.
https://doi.org/10.7554/eLife.20178.005
Figure 1—video 2
Animated rendering of the theta band (4–8 Hz) grand-mean network matrices shown in Figure 1A.
https://doi.org/10.7554/eLife.20178.006
Figure 1—video 3
Animated rendering of the alpha band (8–13 Hz) grand-mean network matrices shown in Figure 1A.
https://doi.org/10.7554/eLife.20178.007
Figure 1—video 4
Animated rendering of the beta band (13–30 Hz) grand-mean network matrices shown in Figure 1A.
https://doi.org/10.7554/eLife.20178.008
Figure 2
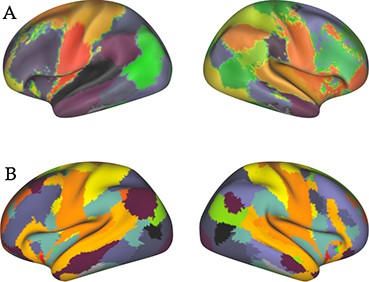
Regions of interest used for functional connectivity estimation.
(A) Primary parcellation of 39 contiguous clusters, identified from a resting-state 100-dimensional group-ICA decomposition of fMRI data from the first 200 subjects of the HCP project. (B) The 15-dimensional fMRI ICA parcellation computed by the HCP as part of the S900 data release.
Figure 3
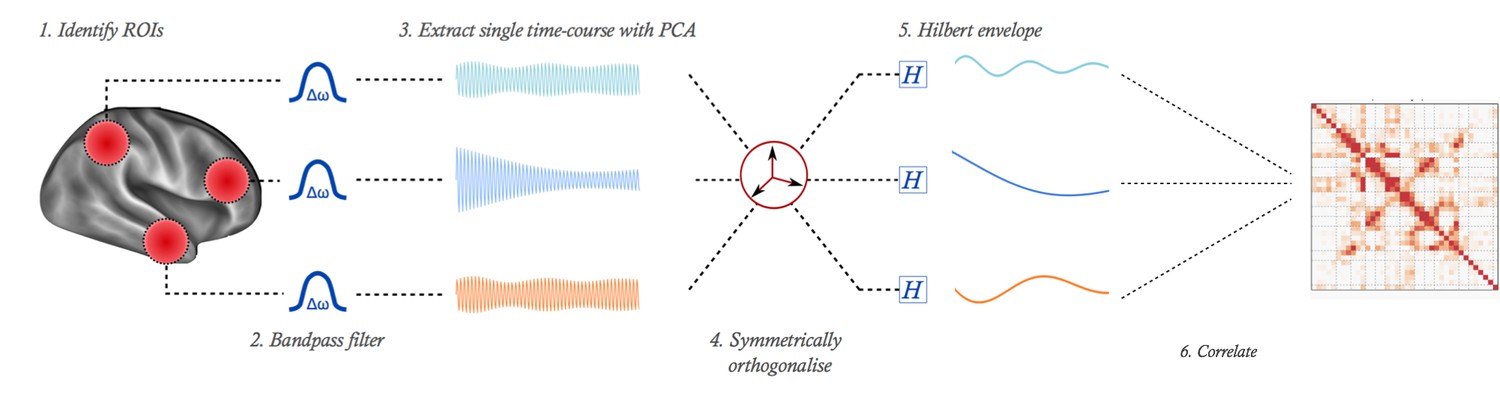
Illustration of pipeline for MEG functional connectivity estimation.
From a whole-brain source-reconstruction, a single time-course is extracted to represent each ROI. These time-courses are bandpass filtered, then orthogonalised to remove shared signal which is potentially attributable to spatial leakage effects. The power envelope of each time-course is computed, then correlated to form the network matrix.
Additional files
-
Supplementary file 1
Index of ROI numbers.
- https://doi.org/10.7554/eLife.20178.011
-
Supplementary file 2
Parameter estimates and 95% confidence intervals for the mean genetic and shared environmental contributions to the observed phenotypic variability in functional connectivity and signal power, using the 39-dimensional parcellation derived from high-dimensional ICA on fMRI data.
- https://doi.org/10.7554/eLife.20178.012
-
Supplementary file 3
-values for permutation-based significance tests performed for the strength of genetic factors, both before and after a false discovery rate correction for multiple comparisons over the 21 tests performed in this article.
- https://doi.org/10.7554/eLife.20178.013
-
Supplementary file 4
Parameter estimates and 95% confidence intervals for the mean genetic and shared environmental contributions to the observed phenotypic variability in functional connectivity and signal power, using the 15-dimensional ICA parcellation from fMRI data.
- https://doi.org/10.7554/eLife.20178.014
-
Supplementary file 5
Correlations over ROIs, with permutation-based -values, between the average heritability of cortical curvature in each ROI and the average heritability of connections from each ROI. A lack of strong positive correlations suggests that any heritability in cortical curvature is not driving the heritability observed in functional connection strengths. -values are given both uncorrected, and after a false discovery rate correction for multiple comparisons over the 21 tests performed in this article.
- https://doi.org/10.7554/eLife.20178.015
Download links
A two-part list of links to download the article, or parts of the article, in various formats.
Downloads (link to download the article as PDF)
Open citations (links to open the citations from this article in various online reference manager services)
Cite this article (links to download the citations from this article in formats compatible with various reference manager tools)
The heritability of multi-modal connectivity in human brain activity
eLife 6:e20178.
https://doi.org/10.7554/eLife.20178


