A locally-blazed ant trail achieves efficient collective navigation despite limited information
- Weizmann Institute of Science, Israel
- CNRS and University Paris Diderot, France
- INRIA and University Paris Diderot, France
Figures
Figure 1 with 2 supplements

Scent mark detection.
(A) A typical recruitment run. The first recruiter deposits a sequence of pheromone marks (blue dots) that span an entire path between the food (ring) and the nest. Briefly thereafter, other ants are recruited (see Figure 1—figure supplement 1) either from the surrounding area or from the nest, showing high attraction to the original scent trail. The trajctories of several such recruited ants, as they move towards the food item, are depicted by black lines. (B) The speed time-series of the recruiting ant depicted in panel (A). Blue dots indicate marking events. (C) A side view of a typical marking event characterized by both a lowering of the gaster (shortening of the vertical yellow line) and reversal in the ant’s speed (magenta). See also Figure 1—figure supplement 2 and Video 2. (D) Normalized ion count Gas-Chromatography-mass-Spectrometry in the region of undecane for marking ants, control ants and blank. (E) A box-plot representation of the area beneath the undecane peak displayed in (D). Asterisks denote p-value<0.0001 Kolmogorov-Smirnov test for non-equal areas between transport samples (N = 6 experiments) and grouped blank and control samples (N = 12 experiments). (F) Marking positions during cooperative transport. The marks were produced by multiple ants over a 1200 cm2 area during 265 s. Full line denotes the trajectory of the load (ring) during the same time period. Color codes for elapsed time since the beginning of motion. Red bars denote 2 cm.
Figure 1—figure supplement 1

Recruitment.
The number of ants in a 10 × 10 cm square around a food item before and during the progression of recruitment events (N = 10, mean±SEM). All data sets are aligned with the first marking event of the first recruiter ant (green line) and to the moment of transport initiation (blue line). This allows a better overlay of recruitment events that naturally differ in their time of initiation and recruitment rate (e.g., due to different initial distance from the nest), thus revealing the characteristic profile of the recruitment process.
Figure 1—figure supplement 2
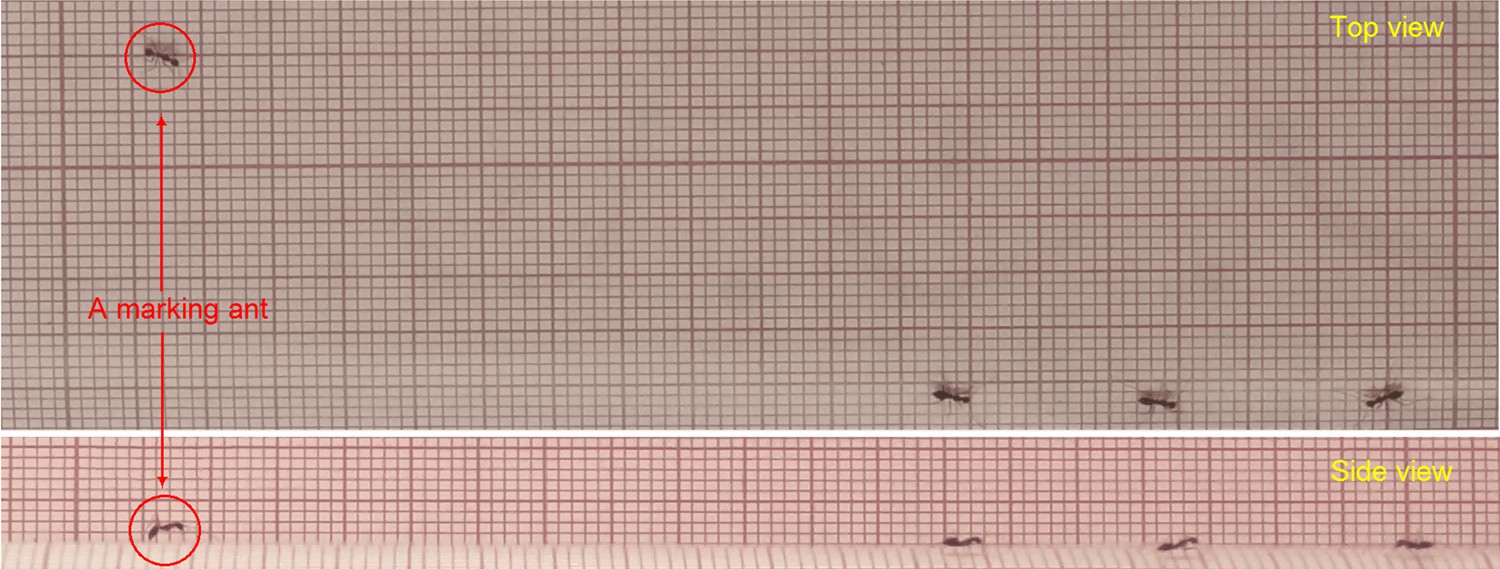
Verification of marking identification.
The marking behavior was simultaneously recorded from both the top- and the side-view. The detection of the marking behavior, based on the ants speed profile extracted from the top-view images, was then verified against the side-view video by observing the ant touches the ground with the tip of its gaster.
Figure 2
Following scent marks.
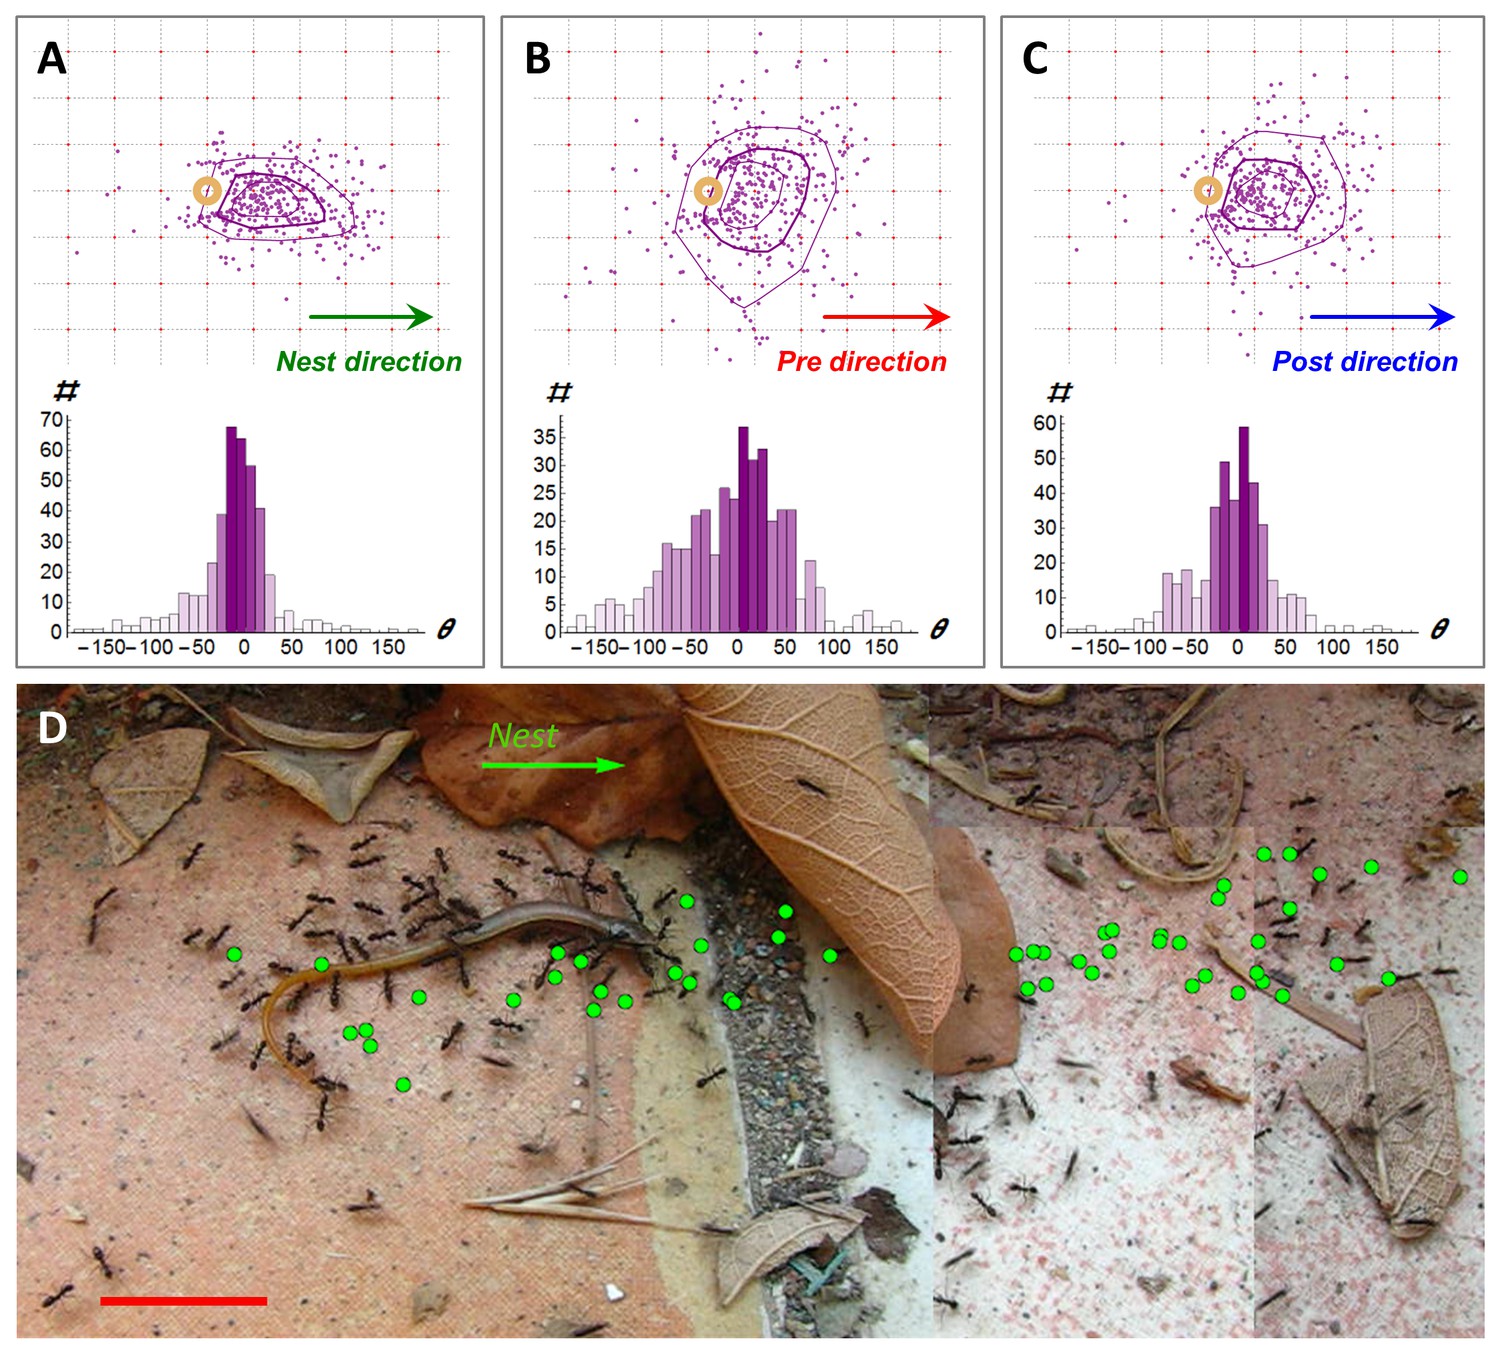
(A-C). Distribution of marking events (N = 408) during a specific example of 113 cm of cooperative transport. Upper panels show the spatial distribution of scent marks (purple dots) locations, upon marking, in a moving frame of reference that is attached to the center of the transported load. The x-axis of this reference frame points towards the nest (a) or in the direction of the load movement in the 2 s that immediately proceed (b) or follow (c) the time this mark was deposited. Purple lines indicate quartile polytopes. Bottom panels: Angular distribution of the same data points. (D) Cooperative transport of a large prey item in a natural environment. Green dots denote scent marks. Red bars denote 2 cm.
Figure 3 with 2 supplements
A new kind of ant trail.
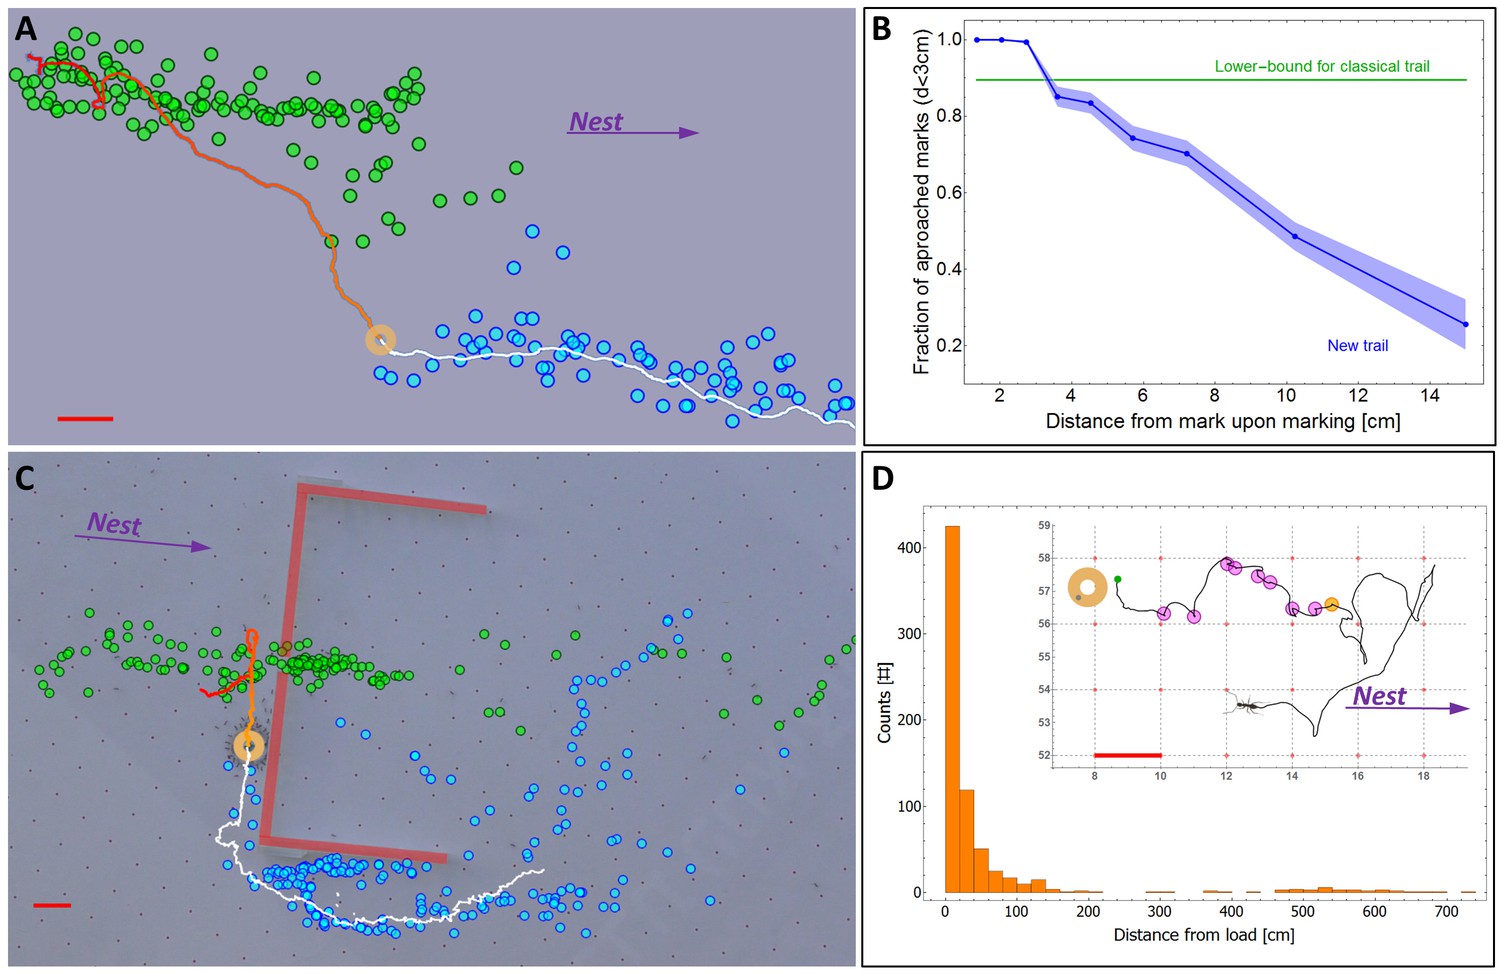
(A) In an obstacle-free environment, the load loses the scent trail which then reforms in front of it. Green dots indicate the position of scent marks produced before the load reached the position indicated on the image (ring). Blue dots indicate scent marks laid after this time. Solid line marks the load’s trajectory. (B) The probability that the load eventually approaches (to less than 3 cm) a scent mark as a function of the distance between them at the moment of marking. For comparison, the green line depicts the corresponding curve for a classical ant trail (see Figure 3—figure supplement 1) (C) Cooperative transport while bypassing an obstacle (thick red lines) with a slit. Load position and marking colors as in panel (a). (D) Distribution of single ant marking bout lengths defined as the distance between the load and the furthest mark in a marking sequence. The inset shows a typical marking bout of nine marks (discs). Furthest mark is denoted in orange. Red bars denote 2 cm.
Figure 3—figure supplement 1
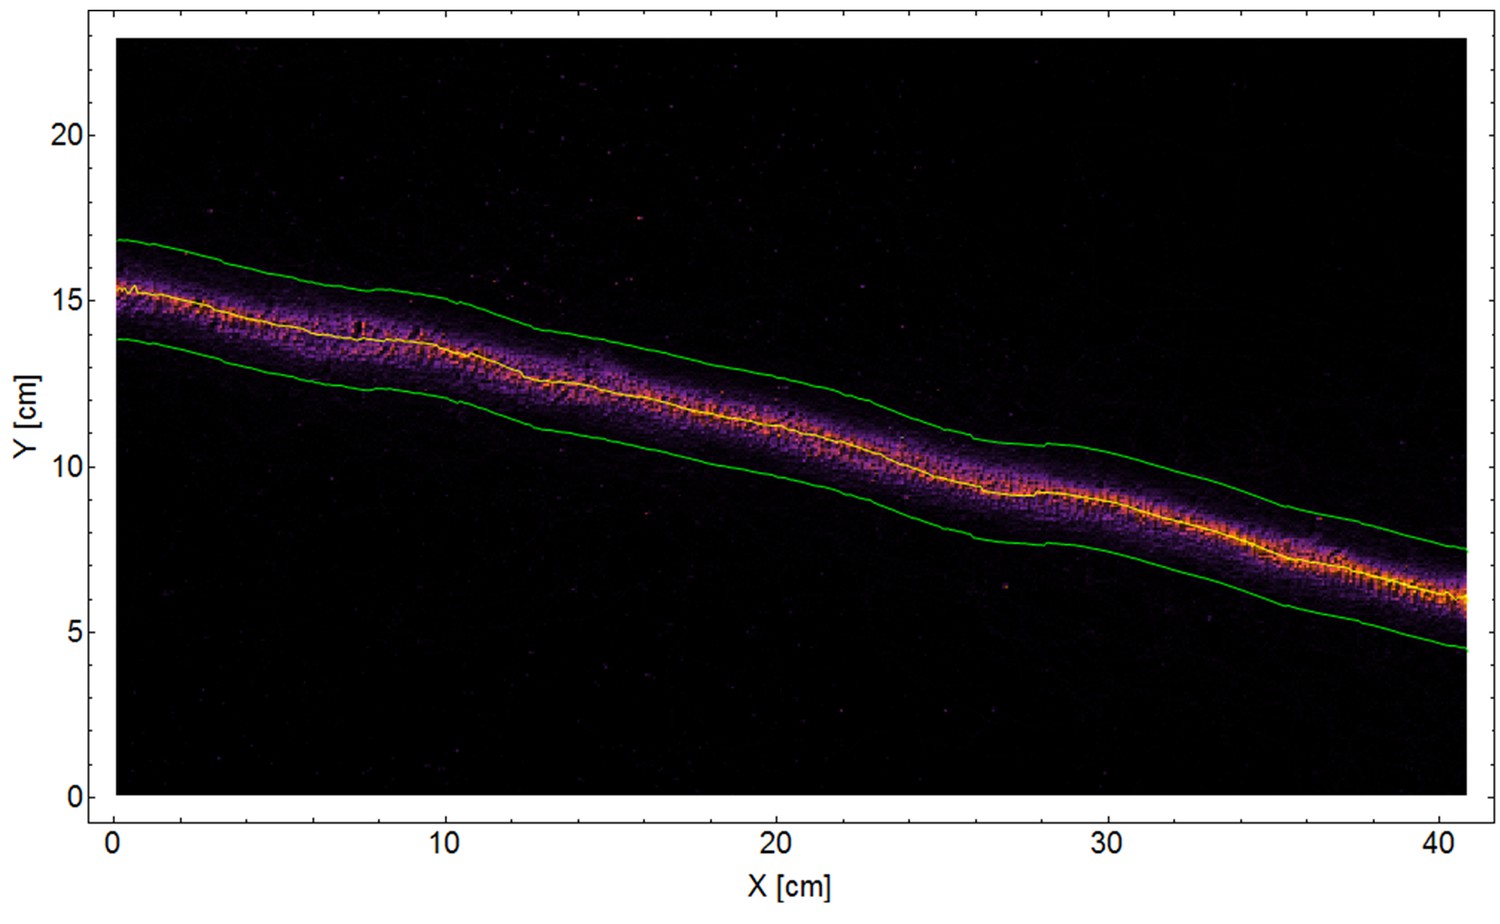
Classical trail.
A 2D density plot of a 42 cm segment from a classical trail of the polydomous P. longicornis connecting two nests. The ants show high fidelity to the marked trail. A 3 cm wide stripe, bounded by green lines, around the center of trail (yellow line) was used in order to estimate a lower bound to the deviation of carrier ants from marks deposited in various distances (the green line in Figure 3B).
Figure 3—figure supplement 2
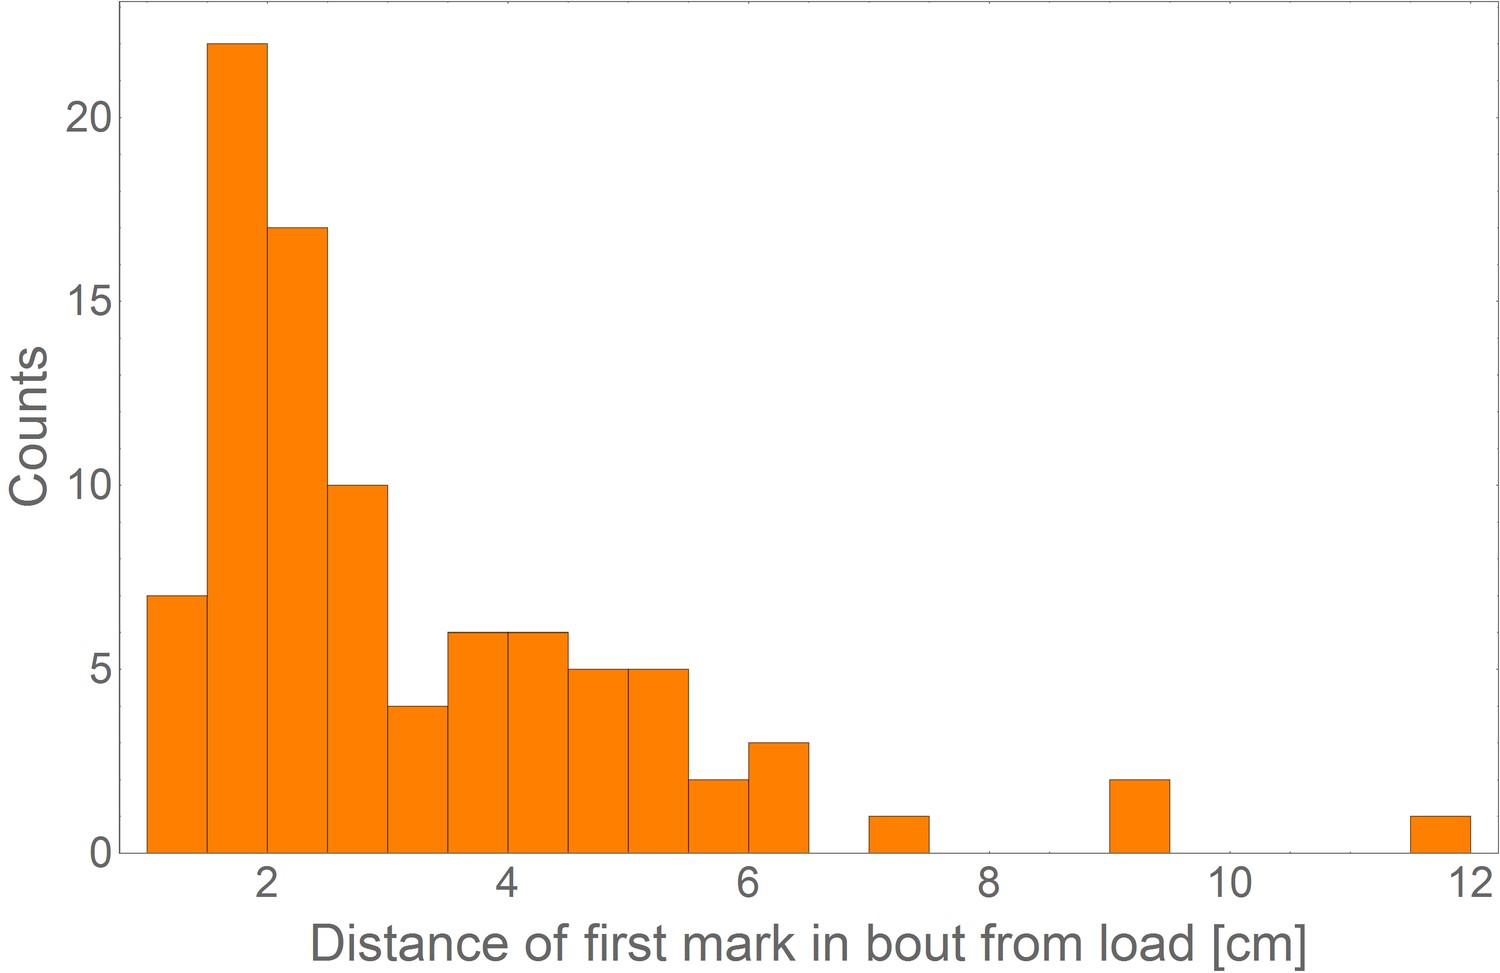
Distance of first mark in bout from load.
A distribution of the distance of the first mark in bout from the load (N = 91) showing that the ants originate their marking sequence near the load (mean = 3.1 cm, SD = 1.9 cm).
Figure 4 with 1 supplement
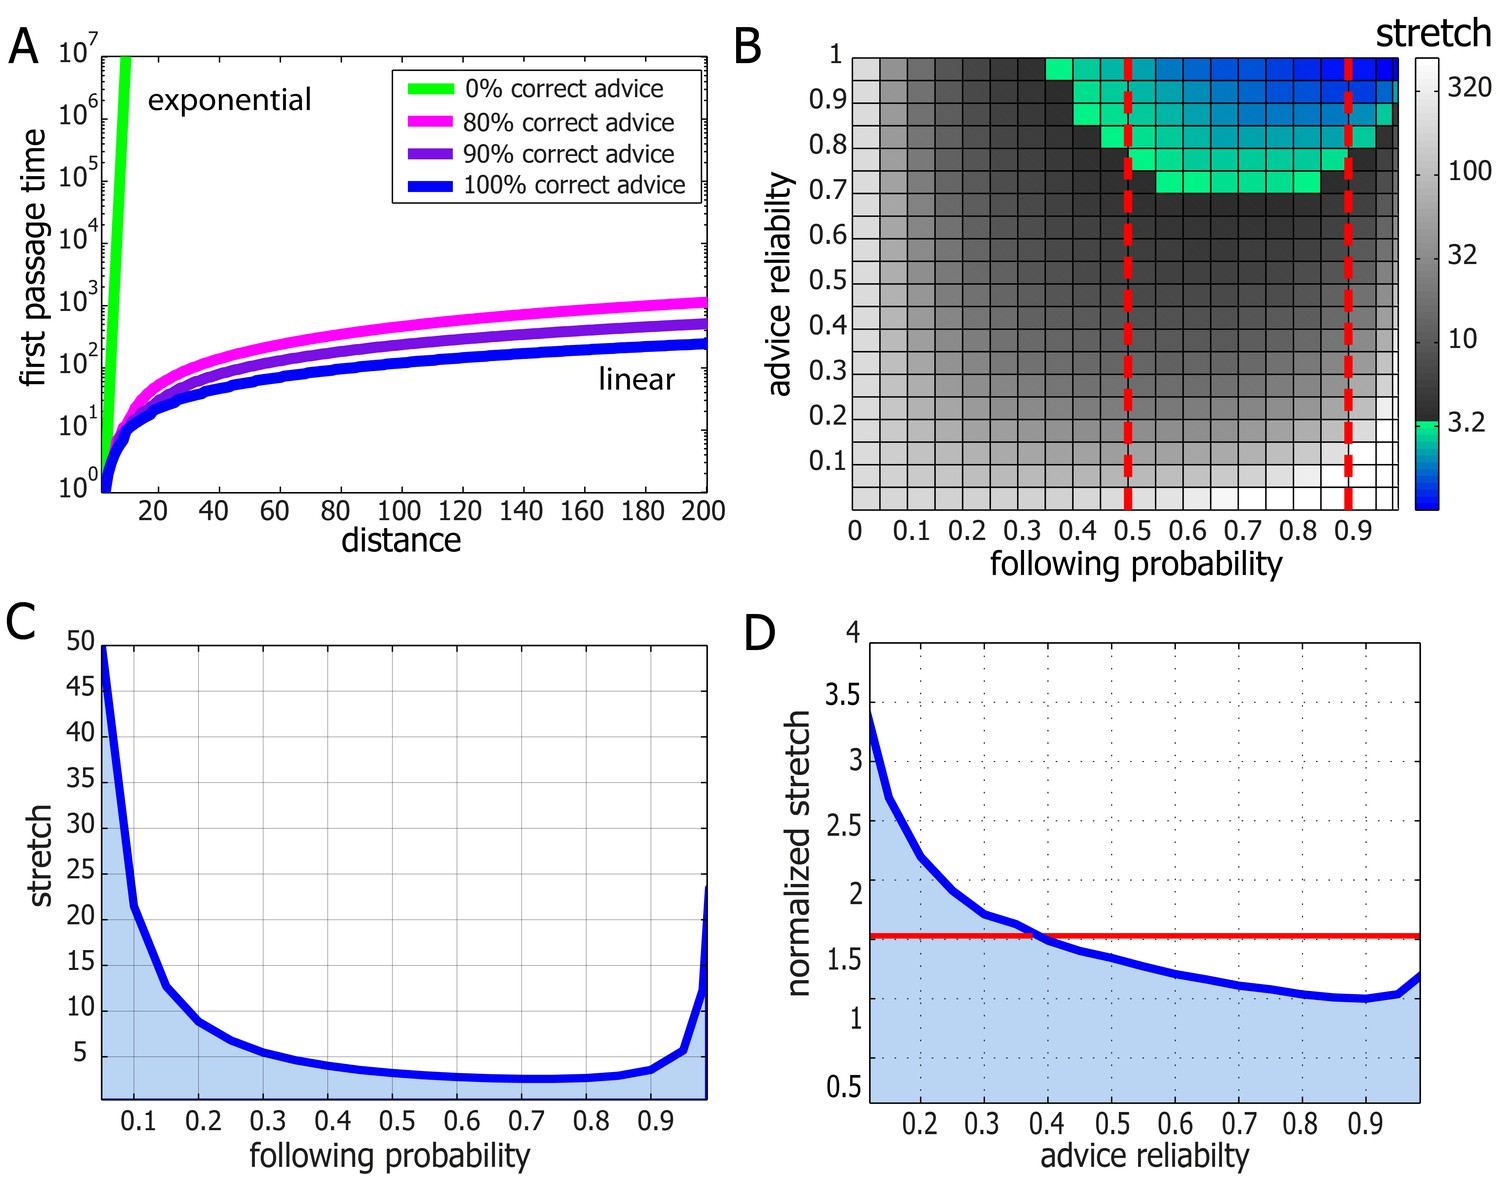
Performance and robustness of Probabilistic Following – simulation results.
(A) Median first passage times of an agent performing Probabilistic Following on a line using a following parameter of 0.8. Different plots signify different reliability of advice. When advice is all or mostly correct (blue, purple, and magenta curves), the agent achieves fast, linear passage times (for a linear scale plot see Figure 4—figure supplement 1). When all advice points in the wrong direction passage times are exponential (linear green line in this logarithmic plot). (B) Stretch (see Materials and methods) of paths on a 2D grid for the full range of environmental advice reliability and the agent's probability of following the advice. The colored zone signifies stretch values that are under 3.2. Following probabilities between 0.5 and 0.9 (dashed red lines) are adequate for a large range of environmental values. (C) Stretch values for an advice reliability of 0.7 as a function of the agent's probability of following the advice. The local maxima near the edges indicate the poor performance of both a random walk (left-hand side) and a perfect following (right-hand side) strategy. The shallow minimum in between these indicates the lack of need for fine tuning to achieve near-optimal navigation times. (D) The stretch of an agent with a probability of 0.8 of following advice at a particular value of advice reliability (x-axis) normalized by the stretch of an agent which uses the optimal following probability for this particular environment. The value of one at an environmental reliability of 0.9 indicates that the agent with 0.8 following probability is the optimal at this environment. This same agent exhibits near-optimal performance (i.e. deviates from the optimum by less than a factor of 1.5, red line) for the full range of environmental reliability values over 0.4.
Figure 4—figure supplement 1

Median first passage times of an agent performing Probabilistic Following on a line.
The data is identical to that presented in Figure 4A but, here, the y-axis is on a linear scale. Thin lines represent linear fits.
Figure 5 with 2 supplements
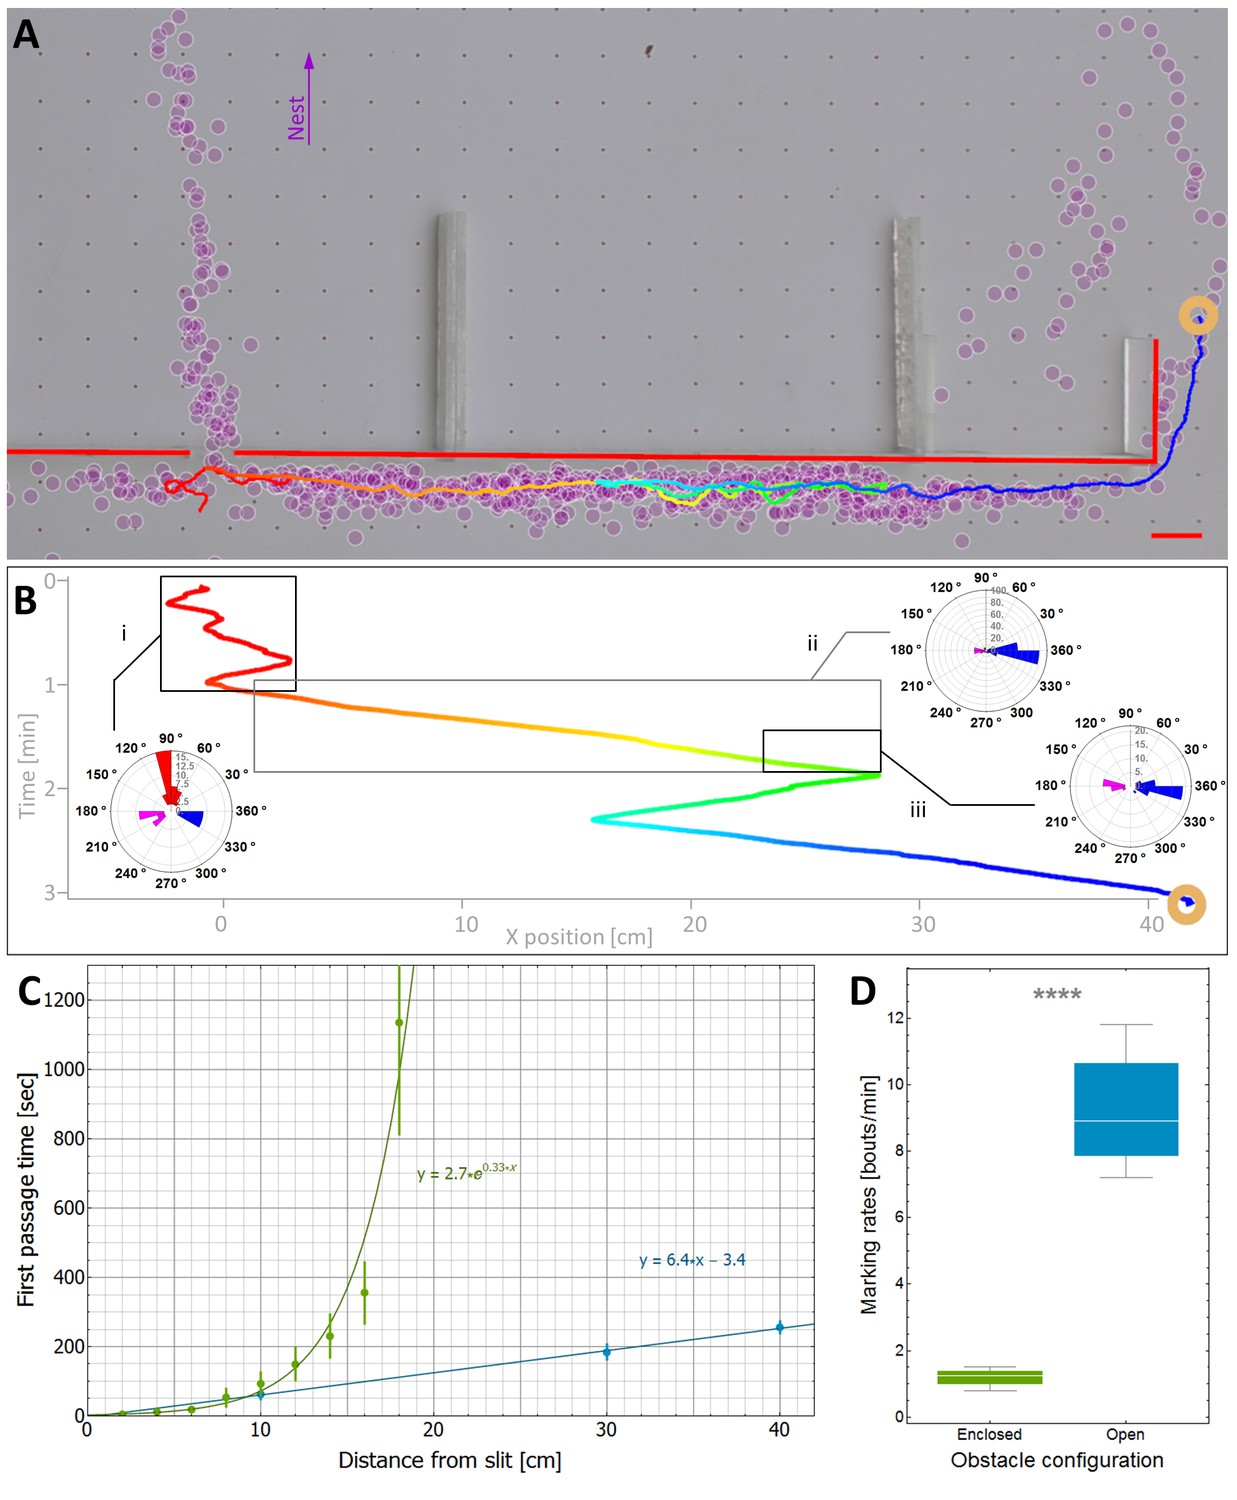
Efficiency and limitations of the locally-blazed trail.
(A-B) A trajectory of a transported load (ring) while it moves around an 80 cm block with a slit at its center. Color code depicts temporal progression, these panels are spatially aligned along the horizontal axis. (A) 3205 marks (discs) identified during this transport, show a marking preference towards the nest (purple arrow) or along the walls. Short red scale bar denotes 2 cm. (B) X coordinate of the load as a function of time. Polar histograms present the scent marks density towards the nest (red), to the left (magenta) or to the right (blue), during three phases along the trajectory: (i) While the load was close to the slit, (ii) While moving to the right until the reversal point and (iii) in the last 5 cm just before the load reaches the same turning point. (C) The mean time to first reach a given distance from the slit along the obstacle walls is shown for both open- (Light blue) and enclosed-configurations (Green) with their corresponding best fit. The two obstacle configurations are illustrated in Figure 5—figure supplement 1. The log transformation of the data for the enclosed block, given in Figure 5—figure supplement 2, reveals exponential dynamics. (D) The marking rates along the obstacle walls are given for the two obstacle configurations. Asterisks denote p-value<10-6.
Figure 5—figure supplement 1
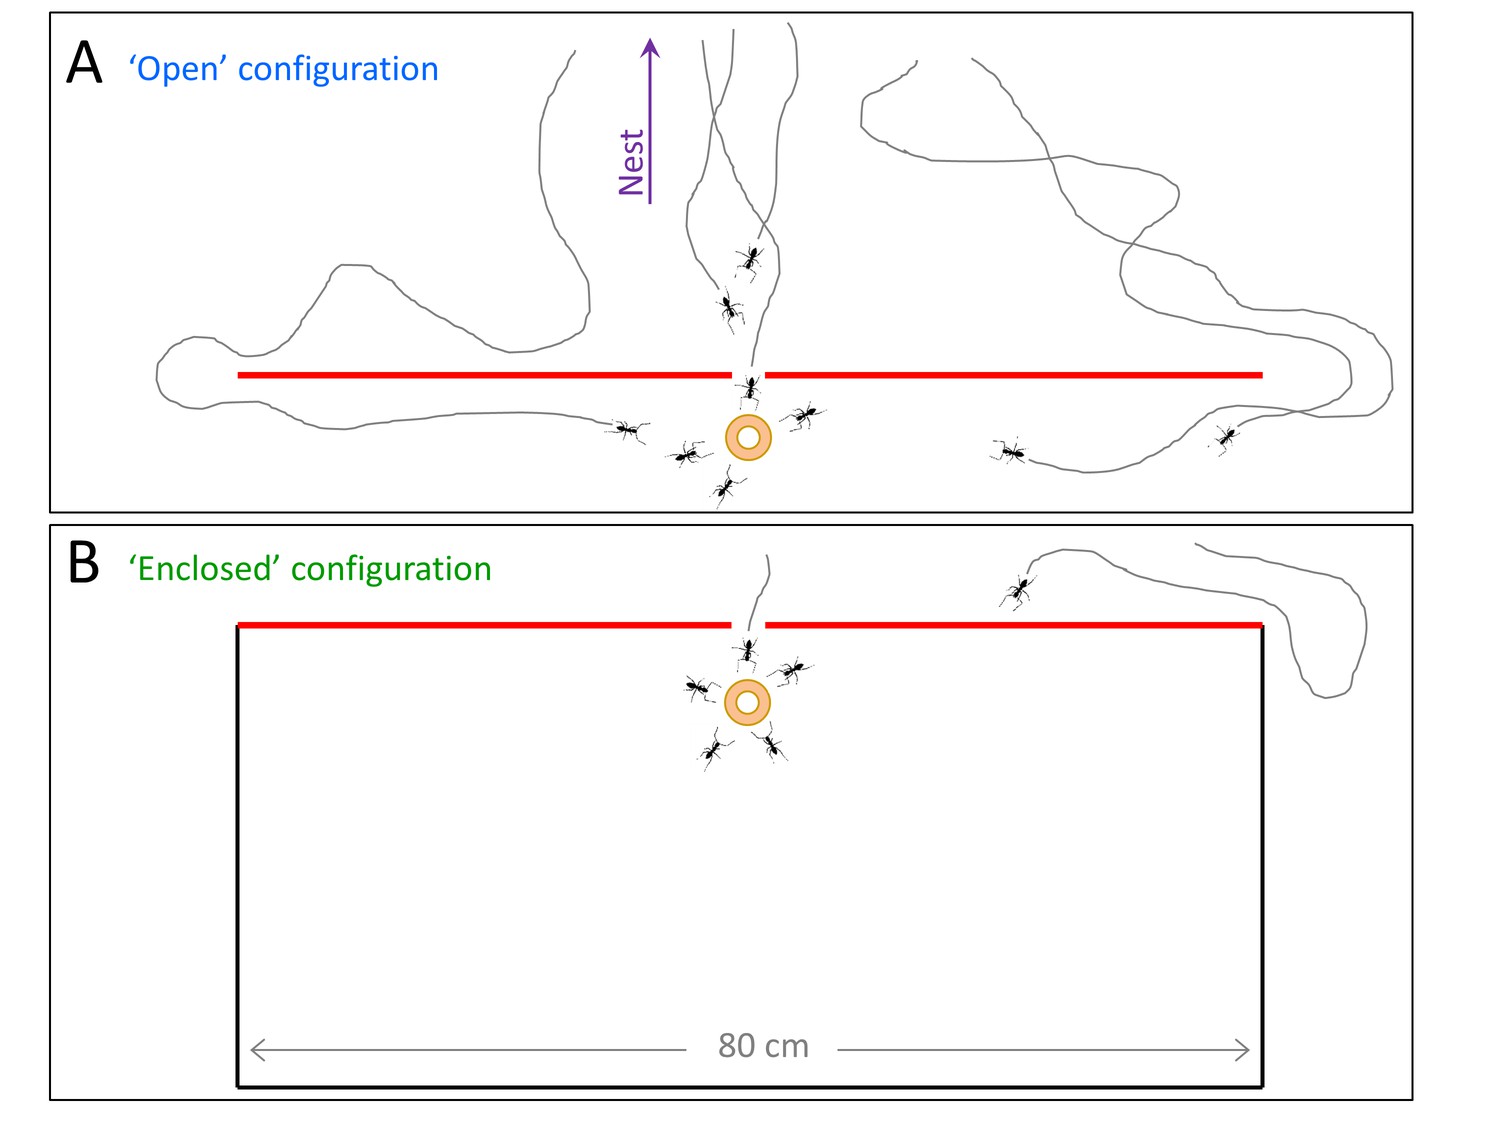
Two obstacle configurations.
Both obstacles are flat and have a slit at their center which was pointed in the direction of the nest. The slit is large enough to allow for free motion of ants but not the load. The ‘open’ configuration (A, blue) allows for ant passage through the slit but also via the longer detour from either left and right. The ‘enclosed’ configuration (B, green) allows for ant passage through the slit only. This configuration we used to collect the data presented in Figure 5C–D (using a matching color code).
Figure 5—figure supplement 2
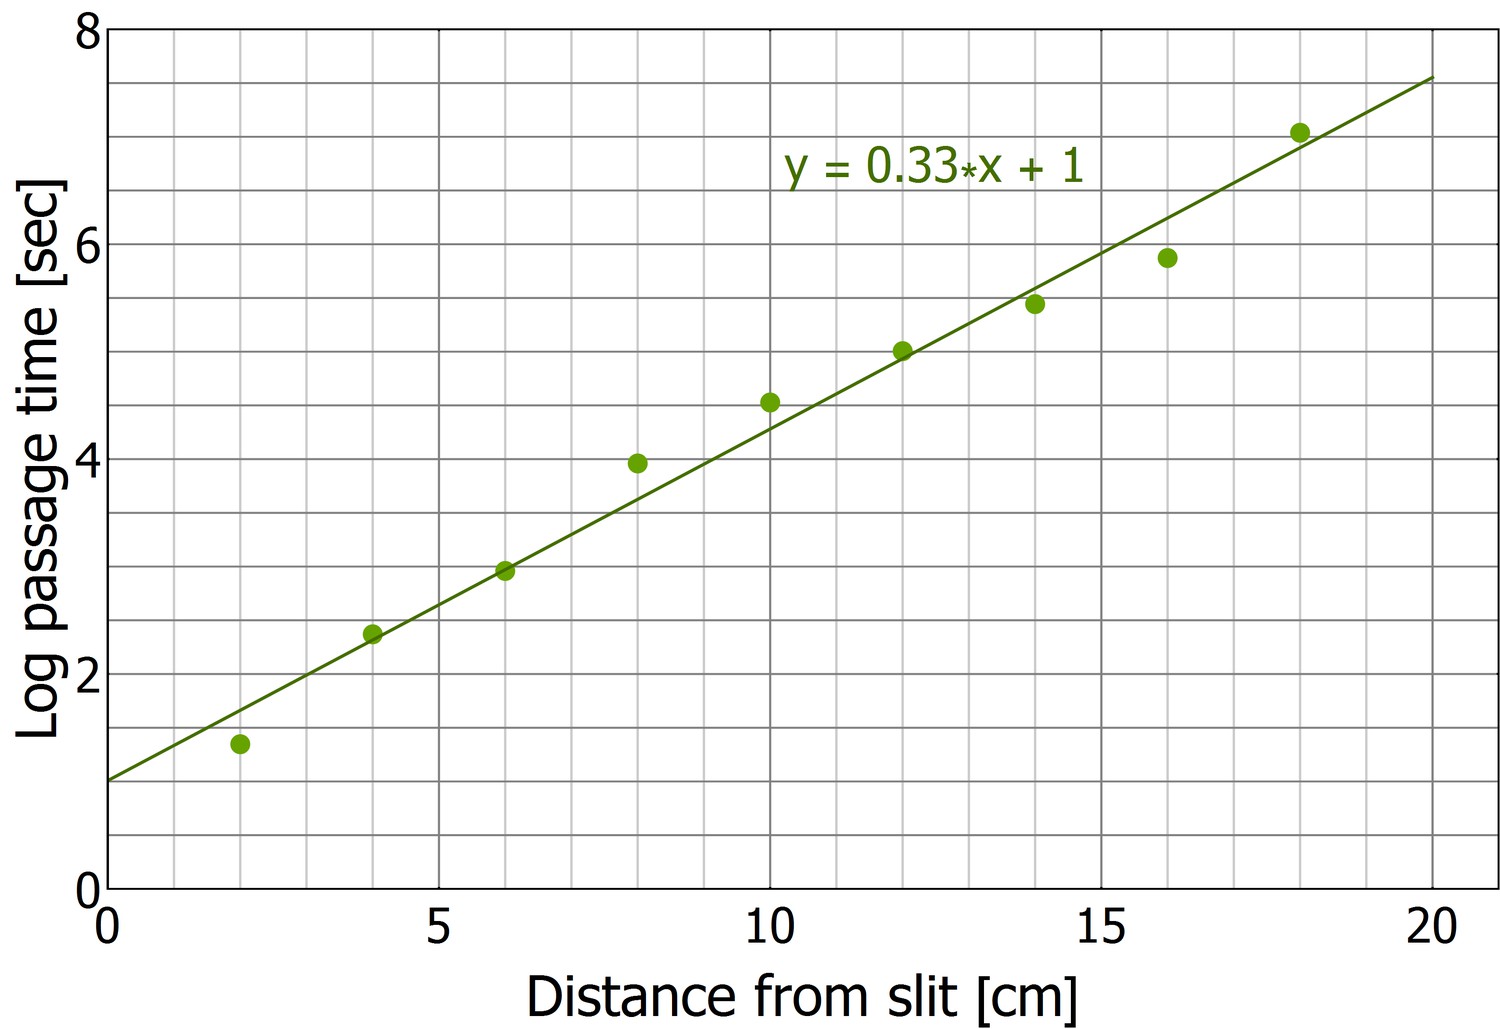
First passage time in collective motion directed against the scent marks.
This figure presents the ‘enclosed’ configuration data as in Figure 5C with in a semi-logarithmic plot.
Videos
Video 1
Marking behavior.
A side close-up view of a recruiter ant as she lays three pheromone marks. Movie slowed down four times.
Video 2
Verification of marking identification.
Ants were recorded from both top (a) and side (b) view simultaneously. The detection of the marking behavior, based on the ants speed profile (c) that was extracted from the top-view video, was then verified by observing frames at which the tip of the ant’s gaster touches the surface as visible in the side view video.
Video 3
Verification of marking identification including speed signature.
Speed profiles that were determined as candidates for marking events were further confirmed by a human observer against the raw video, where more subtle movements that are lost in the automatic tracking can be detected. This video shows a single marking event slowed down three times.
Video 4
Dynamic scent map of first recruiting ant.
This video depicts the first ant that found the food and initiated recruitment back to the nest. Purple discs pinpoint the times and locations of the scent marks deposited by this ant. The radius of the discs is proportional to the time that had passed since the marking event. This video is slowed down four times.
Video 5
Dynamic scent map during recruitment and cooperative transport.
An animation, based on actual scent-marks data, of a recruitment phase followed by cooperative transport. For clarity, this video depicts the load and laid marks (as in Video 4) but not the participating ants. As in all other recruitment occurrences, the recruiting ant marked all the way towards the nest in a relatively straight line. In this video a mobile camera was used, and the frame was restricted by the field of view of the camera, showing an area of 20 cm × 15 cm around the load, at any given moment. All marks by all ants within this field of view are depicted in the animation, with the radius of the disc specifying the elapsed since the marking event. Conversely, any marking behavior that occurred outside the frame is not represented. The video is sped up twelve times.
Video 6
Scale differences between ants and load.
Ants that cooperatively carry a large seed encounter a fallen leaf. The ants can easily pass over and under the obstacle while the carried load cannot.
Additional files
-
Supplementary file 1
Definitions, proofs, and calculations pertaining to the theoretical model.
- https://doi.org/10.7554/eLife.20185.021
Download links
A two-part list of links to download the article, or parts of the article, in various formats.
Downloads (link to download the article as PDF)
Open citations (links to open the citations from this article in various online reference manager services)
Cite this article (links to download the citations from this article in formats compatible with various reference manager tools)
A locally-blazed ant trail achieves efficient collective navigation despite limited information
eLife 5:e20185.
https://doi.org/10.7554/eLife.20185


