Blood transcriptome based biomarkers for human circadian phase
- University of Surrey, United Kingdom
Figures
Figure 1
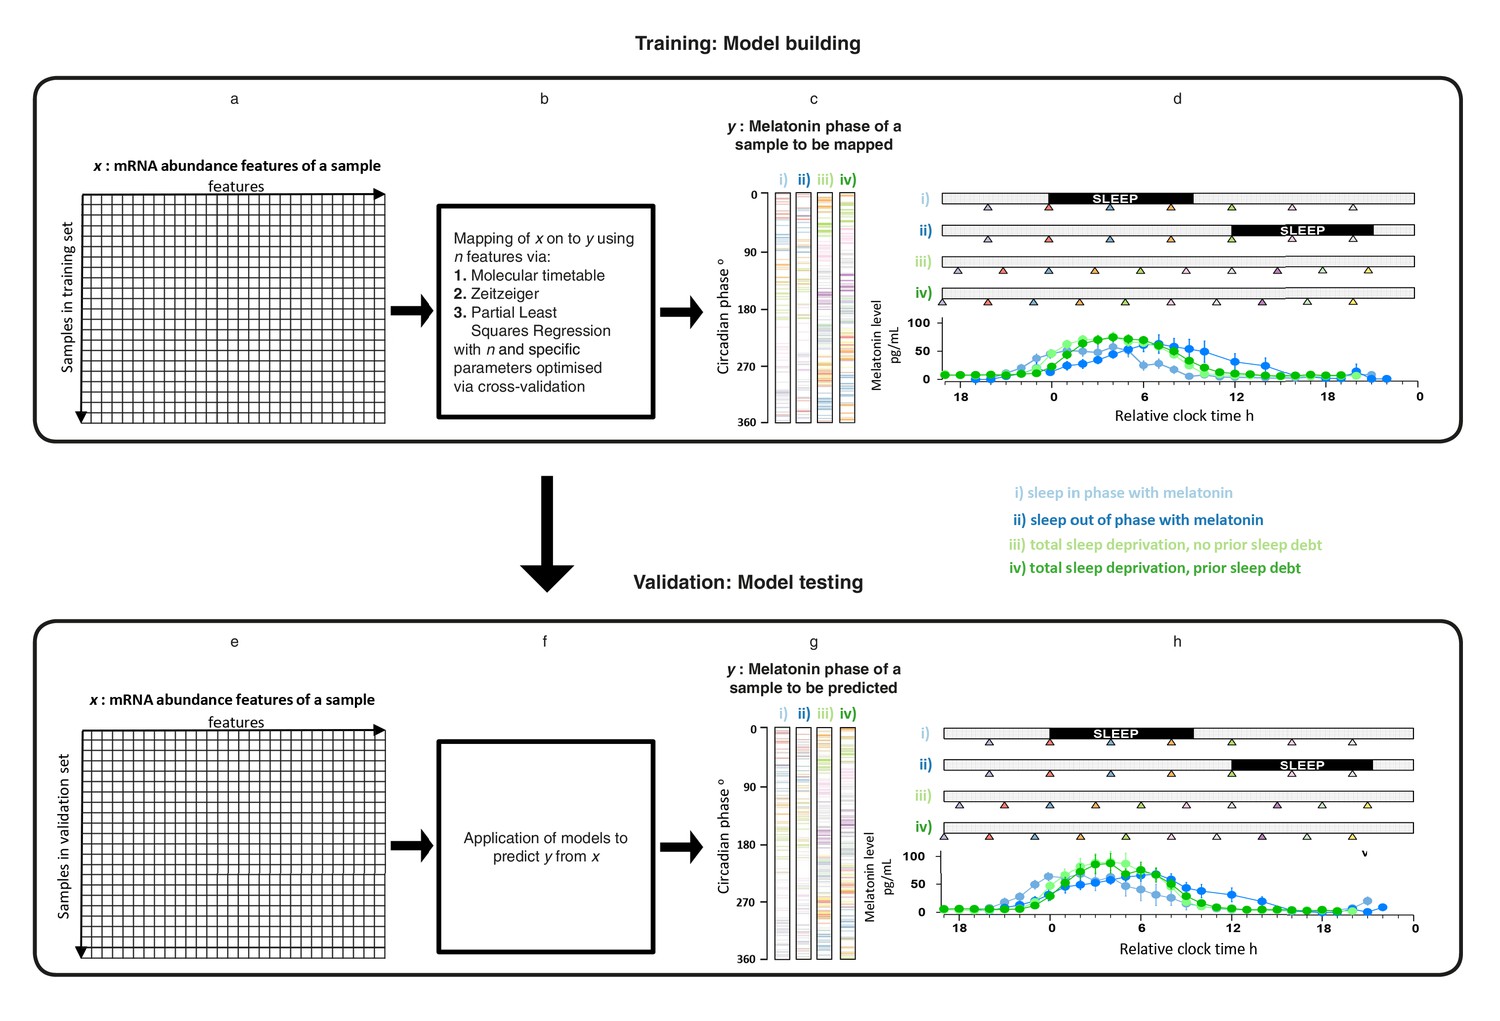
Development and validation of models for predicting melatonin phase from transcriptomic samples.
mRNA abundance and melatonin data from 53 participants collected in four conditions (panels c, d, g and h) were partitioned into two groups: a training set (329 mRNA samples from 26 participants) to build the model and a validation set (349 mRNA samples from 27 participant). For each participant in each condition, hourly melatonin samples (closed circles in plots represent the average melatonin profile of participant in a given experimental condition) and multiple transcriptomic samples (colored triangles) separated by 3 (conditions i and ii) or 4 hr (conditions ii and iv) were collected. Based on a participants’ melatonin profile, each transcriptomic sample for that participant was assigned a circadian phase and plotted separately for each of the conditions (panels c, g). The coloring of circadian bars in panels c and g correspond to the coloring of the transcriptomic sampling time-point triangles in panels d, h. For example, the third mRNA sample (blue triangle) in condition iv was on average taken just before the onset of melatonin (dark green melatonin profile) and the blue horizontal bars in condition iv panel of panel c therefore are located around 300 degrees. This shows the distribution of circadian phases obtained at each sampling point across participants in the training and validation set. These data were used to construct and evaluate the Molecular timetable, Zeitzeiger and Partial Least Square Regression (PLSR) based models. We mapped the melatonin phase y (panels c, g) onto the transcriptomic profile comprising x features in the training set (panels a, e). Parameters to build the model were selected by performing leave-one-participant-out cross-validation of the training set (panel b). The final trained model was applied to the validation set for assessing the overall performance of the model (panel f).
Figure 2 with 4 supplements
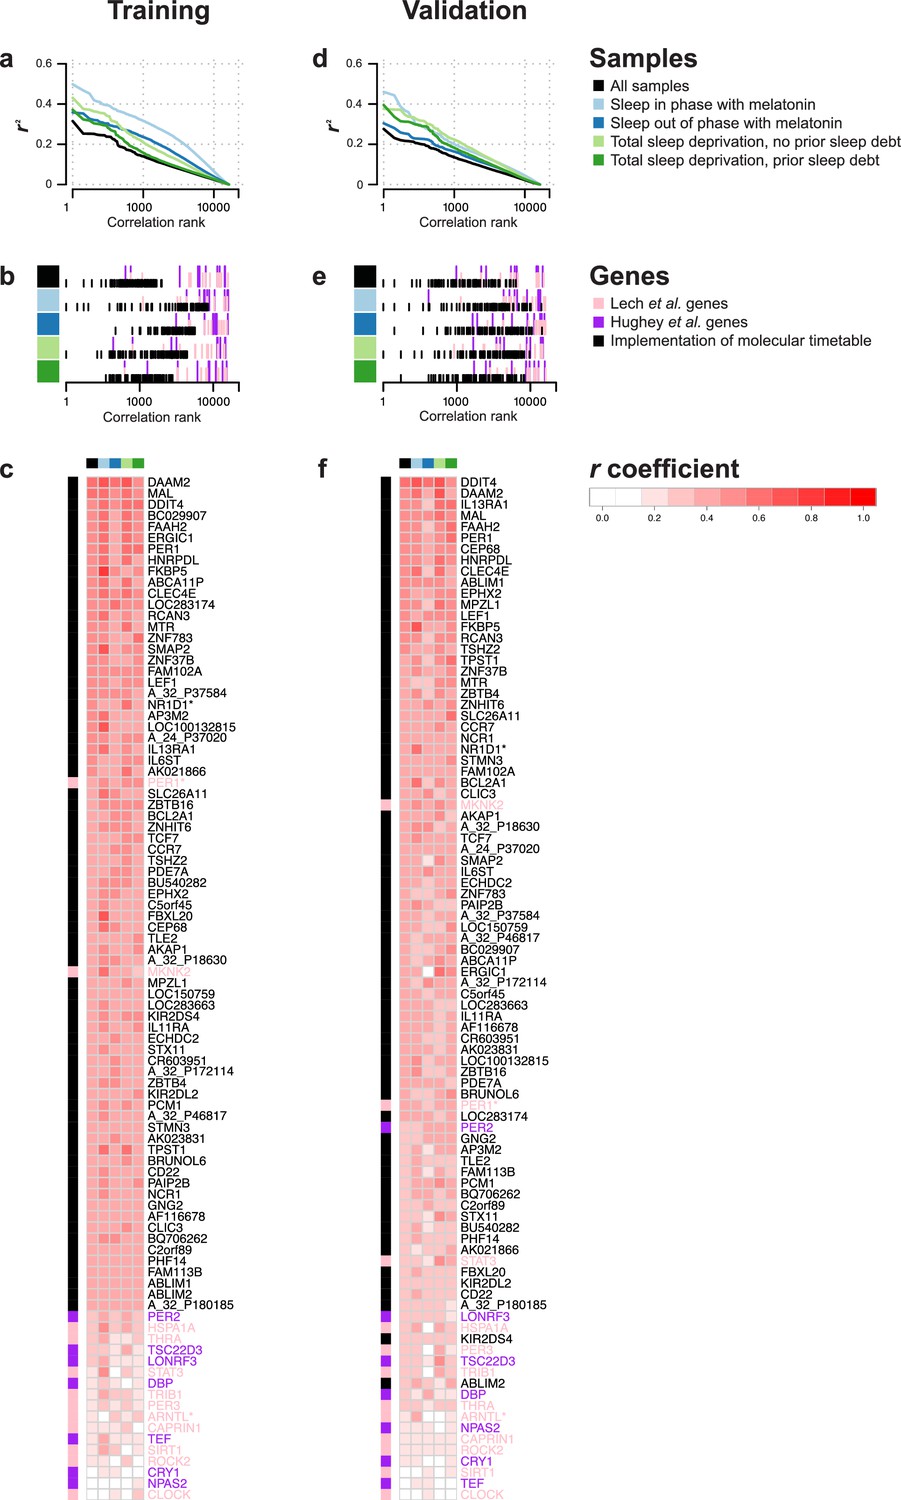
Rhythmicity in the conditions and identification of molecular timetable genes.
(a, d) Square of correlation value (r2) vs. rank of correlation as a measure of overall 24 hr rhythmicity in the transcriptome, separately and across conditions. For each transcript, the correlation with a cosine wave was computed, squared and the entire transcriptome was then rank-ordered separately for each conditions and across conditions. (b, e) Rank of the correlation of phase marker genes from different phase marker lists across conditions (indicated by color panel to the left) for participants in the training (b) and validation set (e). First, correlations of all ~26K features were ranked separately for conditions and training and validation set and then the rank of identified phase marker genes was identified and plotted. (c,f) Heatmap of r values of correlation between a 24 hr cosine wave and mRNA abundance profiles of a feature(s) targeting a gene identified as a phase marker by our molecular timetable, and the circadian phase marker genes published in Lech et al. (2016) and Hughey et al. (2016). Correlations were computed separately for each of the four conditions (indicated by the color panel at the top of the heatmap) and all conditions combined for the training (c) or validation set (f). Rows in the heatmap are ordered based on the correlation column for the ‘all conditions’ dataset, that is, the column indicated with black. Data source files: Figure 2—source data 1.
-
Figure 2—source data 1
Source data file for generating panels in Figure 2.
- https://doi.org/10.7554/eLife.20214.004
Figure 2—figure supplement 1
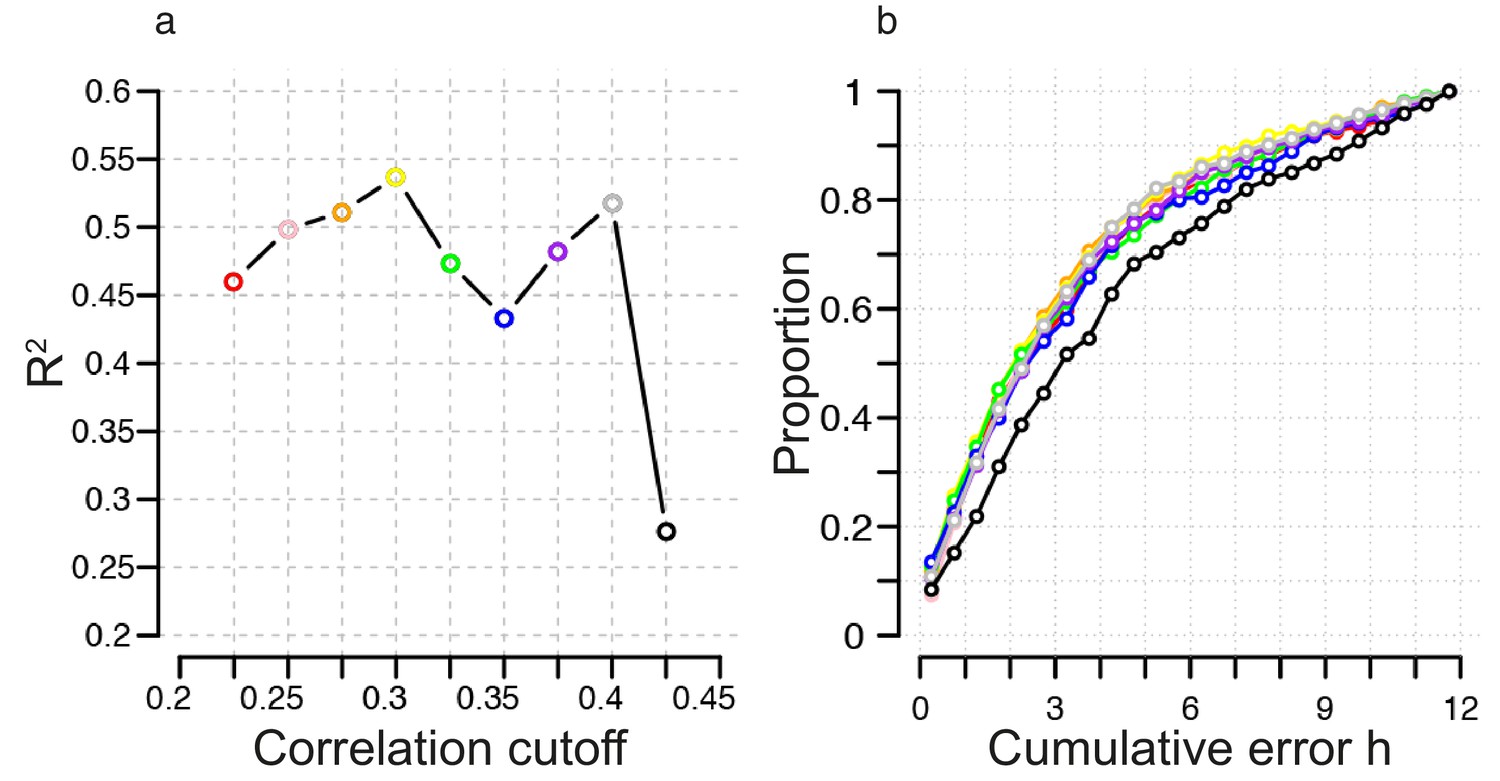
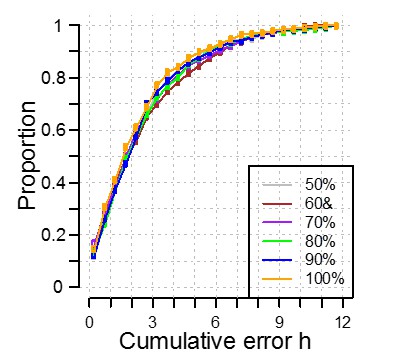
Identification of correlation cutoff threshold for the construction of a molecular timetable.
(a) Effect of cutoff threshold on performance of molecular timetable models constructed using genes meeting a particular threshold. Performance assessed by R2 values following leave-one-participant-out cross-validation of the training set. (b) Performance quantified as the proportion of samples vs. cumulative error for each constructed model following leave-one-participant-out cross-validation of the training set (colors correspond to the threshold colors in panel a).
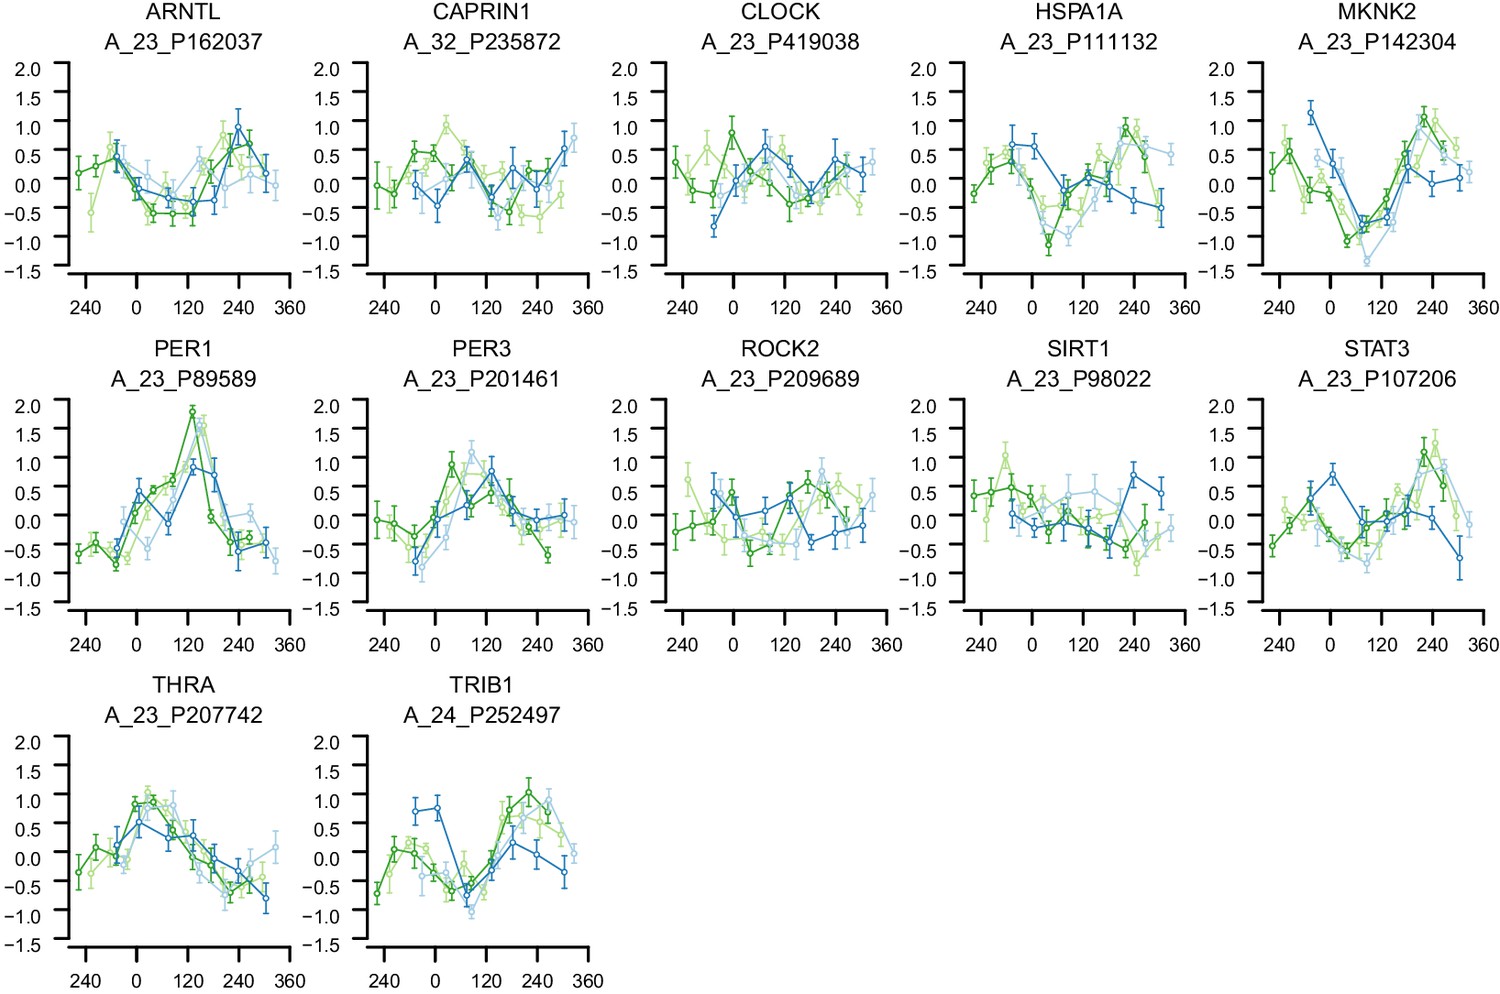
Figure 2—figure supplement 2
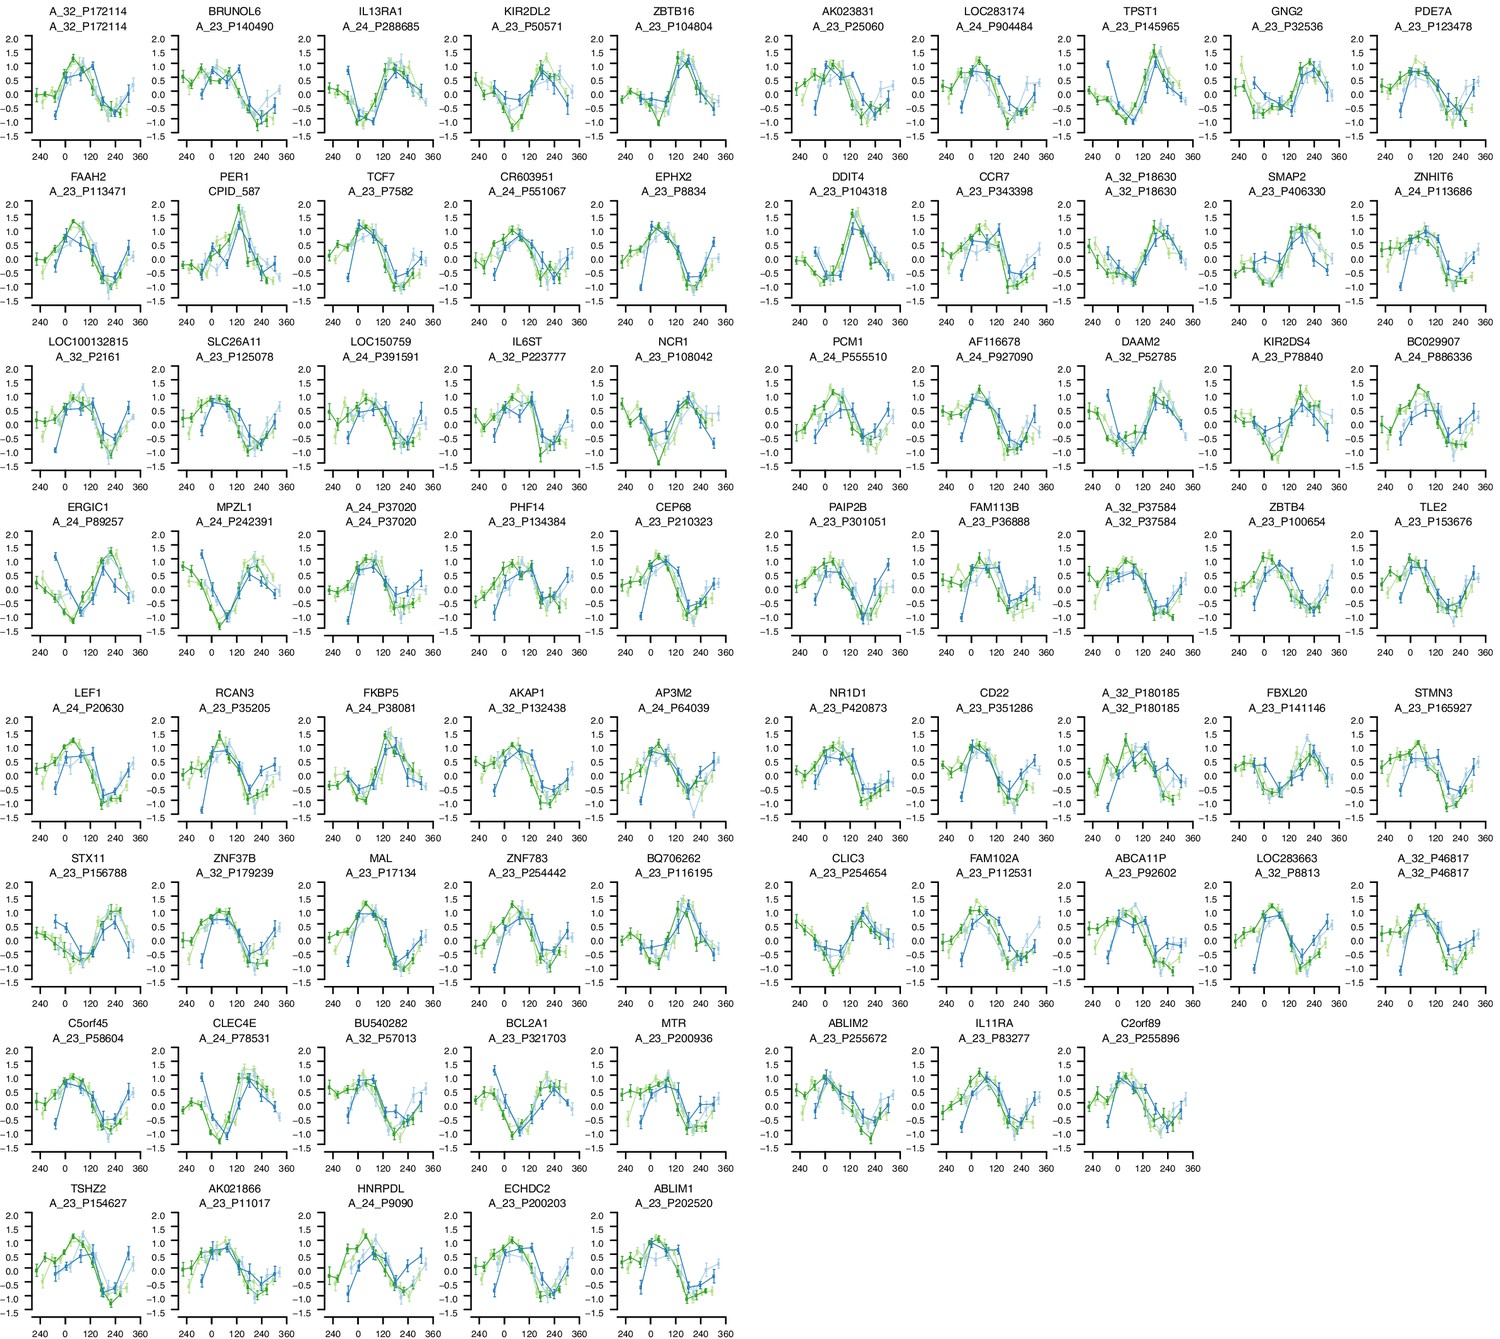
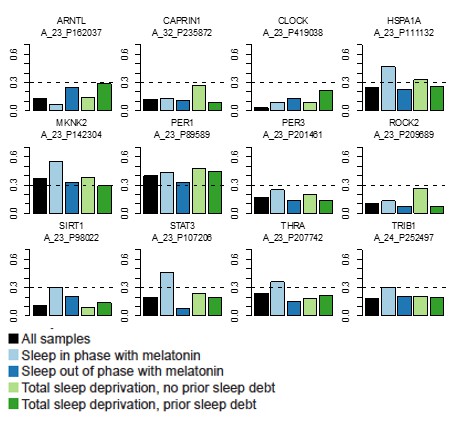
mRNA abundance profiles for genes belonging to the phase marker gene list generated by our implementation of the molecular timetable model.
Data are shown separately for the four conditions. Color of lines correspond to that in Figure 1 of the main text; Light blue: ‘sleep in phase with melatonin’, Dark blue: ‘sleep out of phase with melatonin’, Light green: ‘total sleep deprivation, no prior sleep debt’, and Dark green: ‘total sleep deprivation, prior sleep debt’. Title of each sub-plot denotes the probe and gene name for which the temporal profile is shown. x-axis of each sub-plot corresponds to circadian phase in degrees, where zero degrees corresponds to Dim Light Melatonin Onset (DLMO). y-axis indicates the Z-scored mRNA abundance. Average time course calculated from aligned (by DLMO) participant mRNA abundance profiles, with error bars indicating Standard Error. Data shown for participants belonging to the training set only.
Figure 2—figure supplement 3
mRNA abundance profiles for genes belonging to the phase marker gene list published in (Lech et al., 2016).
Data are show separately for the four conditions. Color of lines correspond to that in Figure 1 of the main text; Light blue: ‘sleep in phase with melatonin’, Dark blue: ‘sleep out of phase with melatonin’, Light green: ‘total sleep deprivation, no prior sleep debt’, and Dark green: ‘total sleep deprivation, prior sleep debt’. Title of each sub-plot denotes the probe and gene name for which the temporal profile is shown. x-axis of each sub-plot corresponds to circadian phase in degrees, where 0 degrees corresponds to Dim Light Melatonin Onset (DLMO). y-axis the Z-scored mRNA abundance. Average time course calculated from aligned (by DLMO) participant mRNA abundance profiles, with error bars indicating Standard Error. Data shown for participants belonging to the training set only.
Figure 2—figure supplement 4
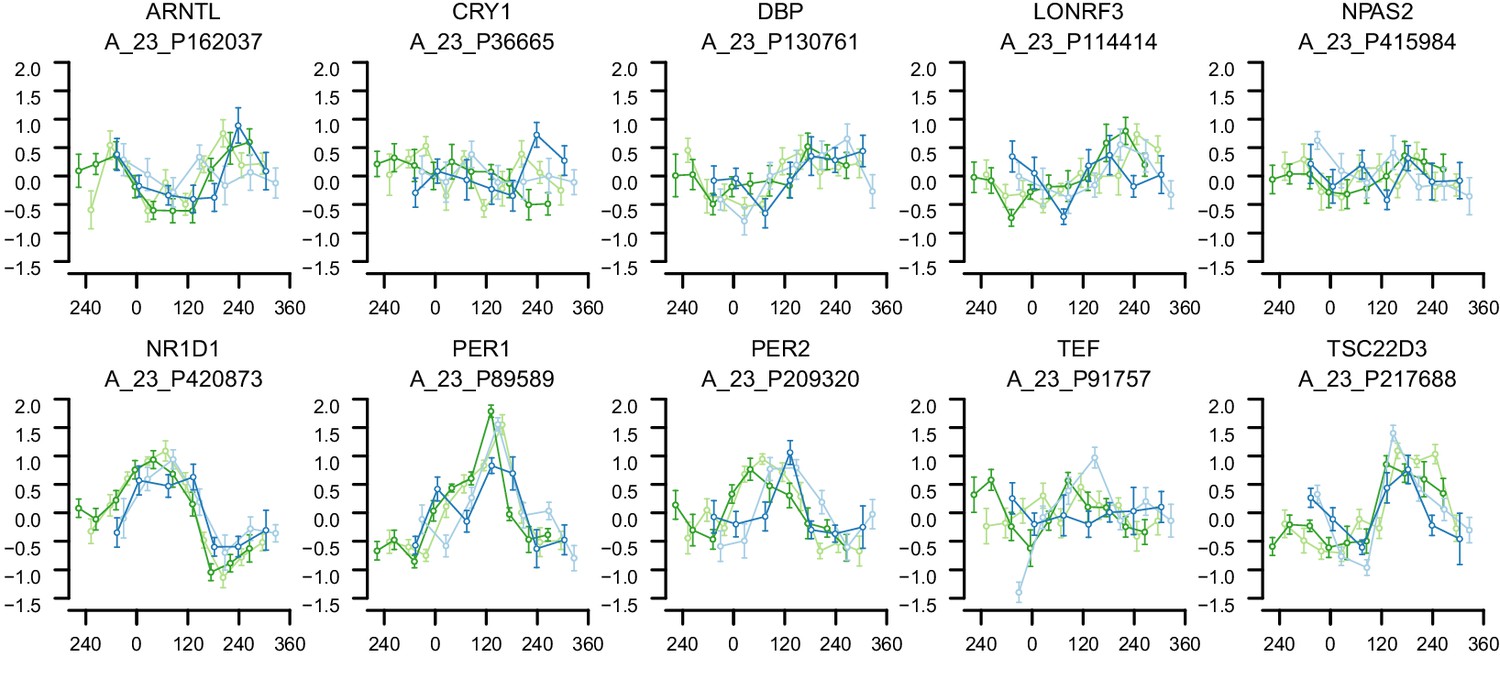
mRNA abundance profiles for genes belonging to the phase marker gene list published in (Hughey et al., 2016).
Data are shown separately for the four conditions. Color of lines correspond to that in Figure 1 of the main text; Light blue: ‘sleep in phase with melatonin’, Dark blue: ‘sleep out of phase with melatonin’, Light green: ‘total sleep deprivation, no prior sleep debt’, and Dark green: ‘total sleep deprivation, prior sleep debt’. Title of each sub-plot denotes the probe and gene name for which the temporal profile is shown. x-axis of each sub-plot corresponds to circadian phase in degrees, where zero degrees corresponds to Dim Light Melatonin Onset (DLMO). y-axis the Z-scored mRNA abundance. Average time course calculated from aligned (by DLMO) participant mRNA abundance profiles, with error bars indicating Standard Error. Data shown for participants belonging to the training set only.
Figure 3 with 5 supplements
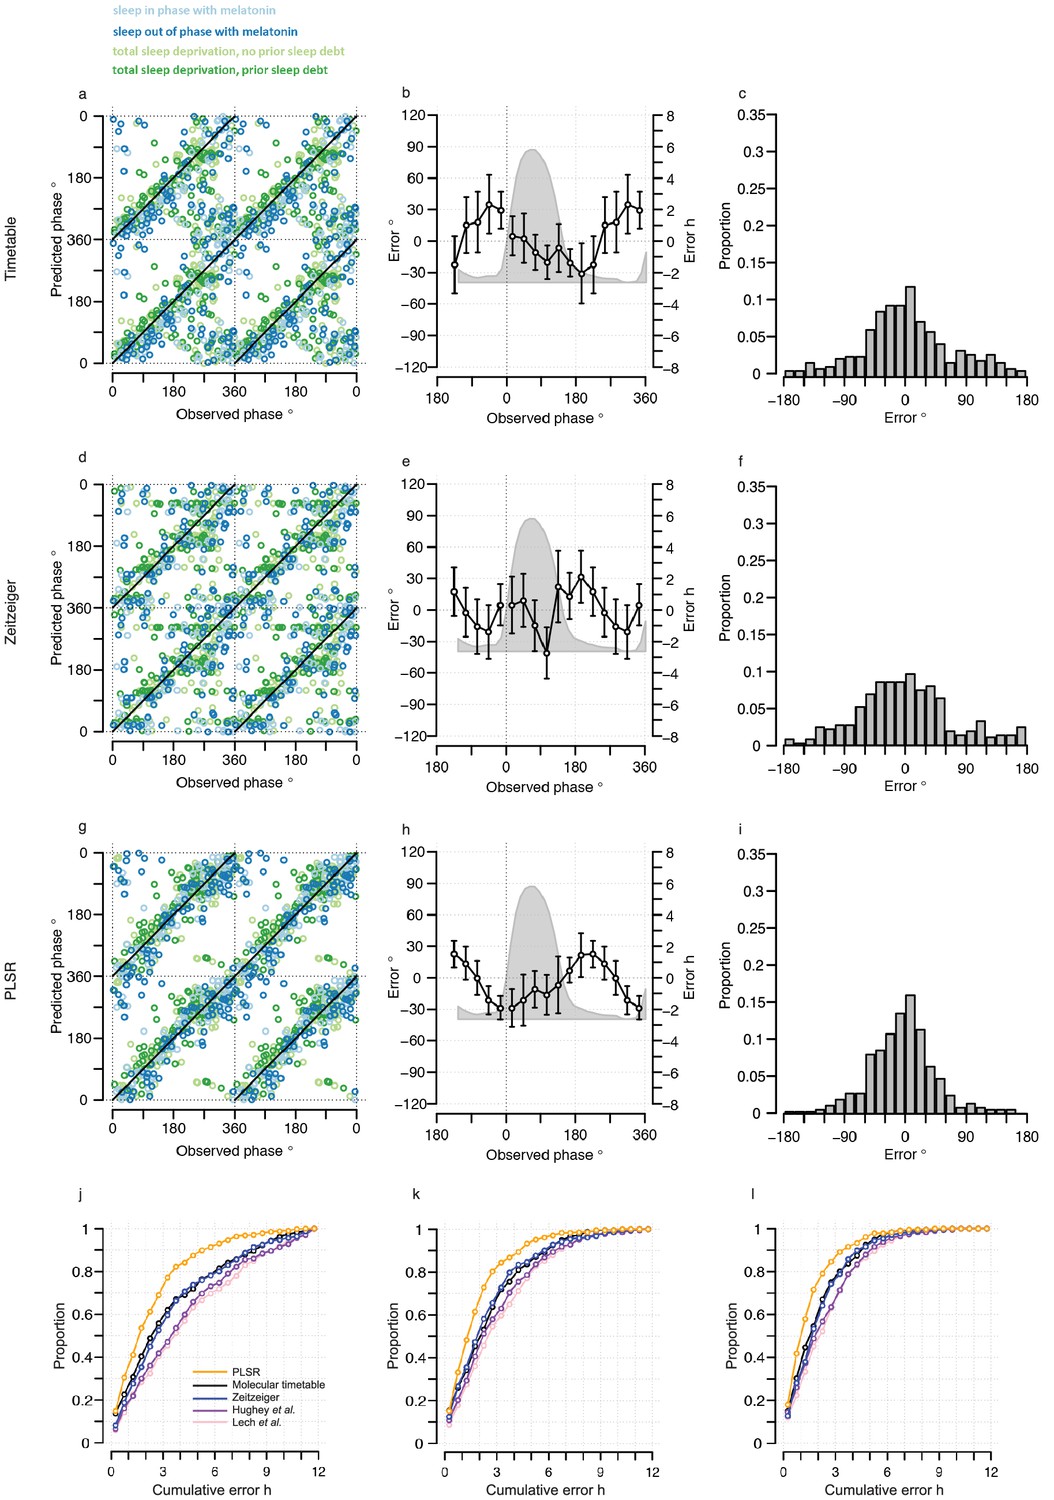
Performance of one-sample models derived from the training set when used to predict circadian phase in the validation set.
(a, d and g) Predicted circadian phase of a blood sample vs. the observed melatonin phase for each sample in the validation set for the one-sample molecular timetable model (a), the one-sample Zeitzeiger model (d) and the one-sample PLSR-based model (g). Circadian phase 0 corresponds to the onset of the melatonin rhythm, which across conditions occurred on average at 23:30 ± 15 min (across all conditions and the training and validation data sets). Please note that the data are double-plotted. The line of unity represents perfect prediction. (b, e and h) Average (mean) error and 95% confidence intervals of the mean error per 30o, that is 120 min, for each 30° circadian phase bins across the circadian cycle, for each of the models. The grey area plot represents the average melatonin profile. Panels (c, f and i) frequency distribution of errors. Errors were sorted into 15o, that is, 60 min bins for each model. For each of the models, the mode of the distribution is near 0, but the width of the distribution varies across models. (j) Proportion of predictions based on one sample vs. cumulative error as a measure of overall performance. (k) Proportion of predictions based on two consecutive samples vs. cumulative two sample average error as a measure of overall performance. (l) Proportion of predictions based on three consecutive samples vs. cumulative three sample average error as a measure of overall performance. Data source file Figure 3—source data 1.
-
Figure 3—source data 1
Source data file for generating panels in Figure 3.
- https://doi.org/10.7554/eLife.20214.010
Figure 3—figure supplement 1
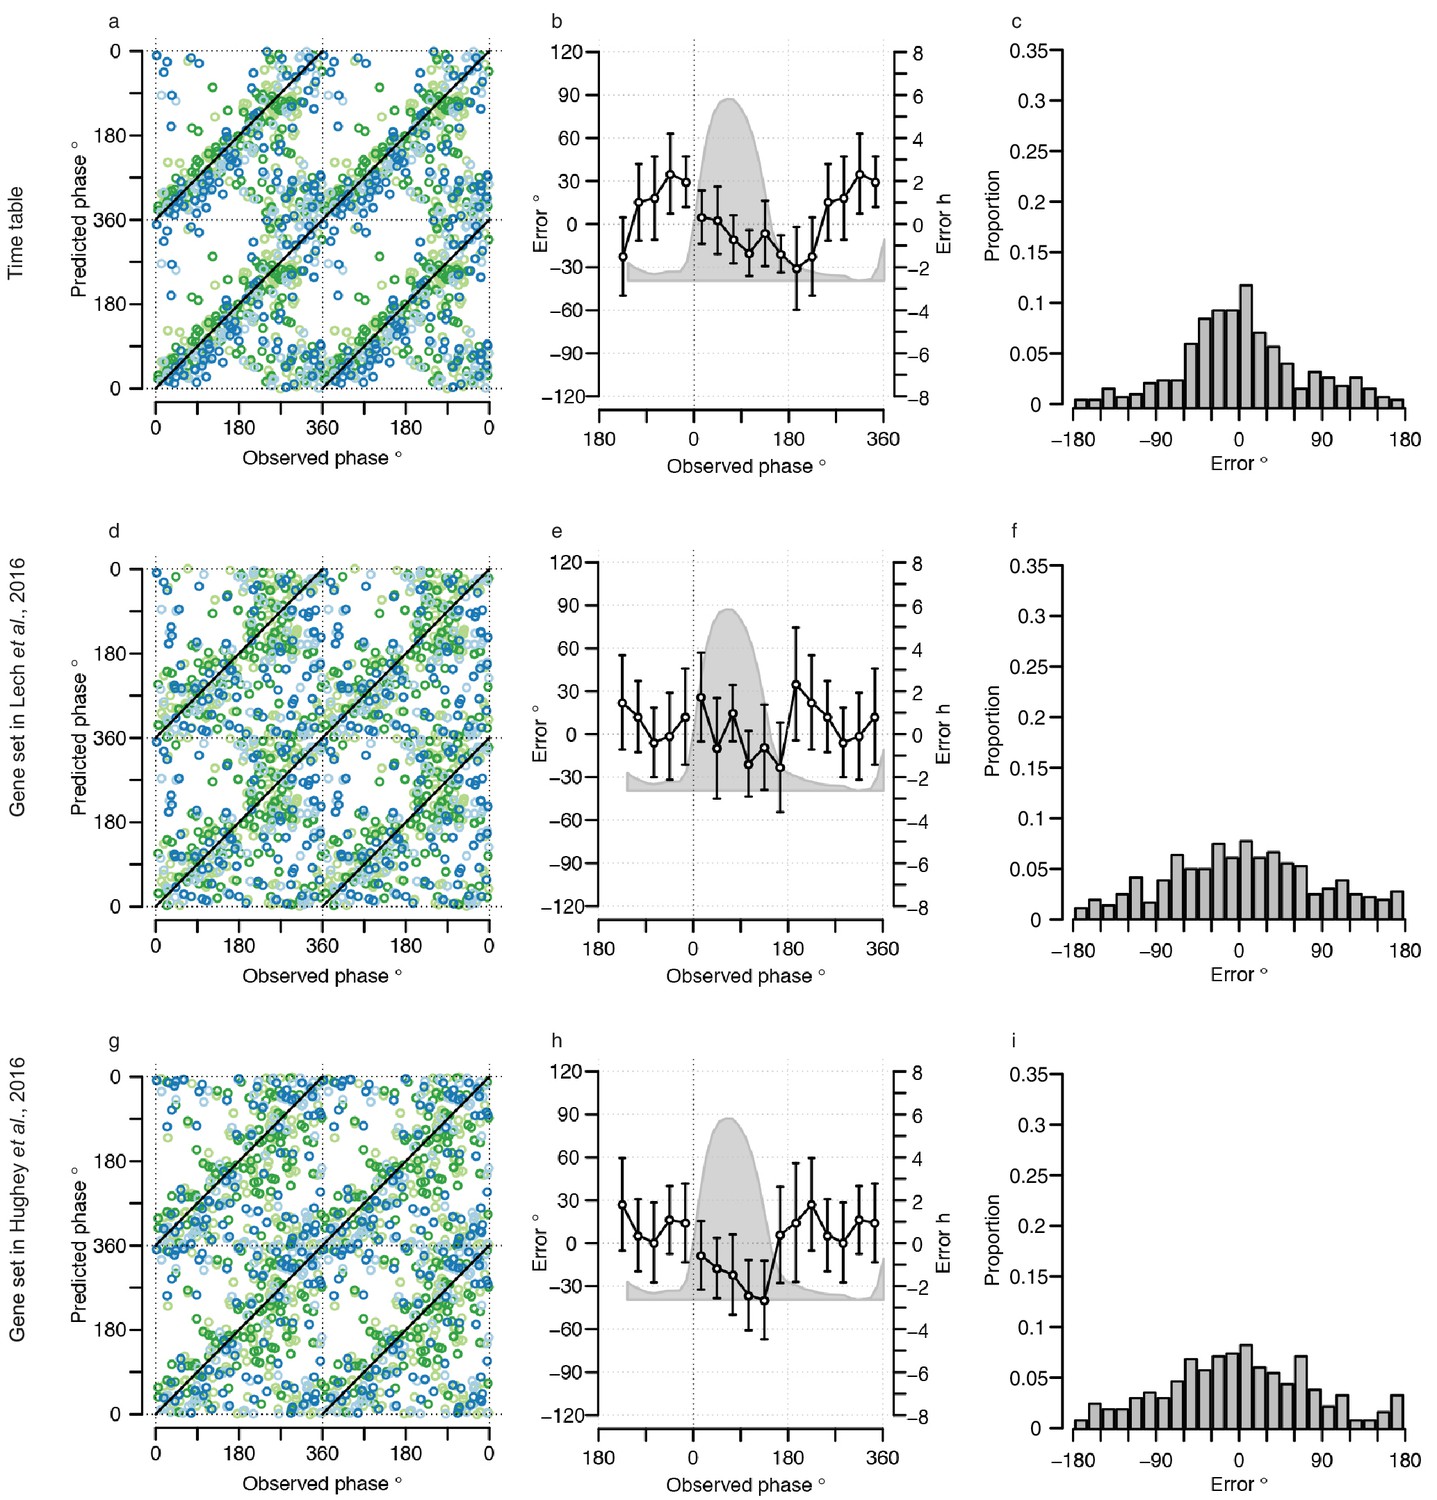
Performance of one-sample molecular timetable models when used to predict the circadian phase of samples in the validation set.
Color of lines correspond to that in Figure 1 of the main text; Light blue: ‘sleep in phase with melatonin’, Dark blue: ‘sleep out of phase with melatonin’, Light green: ‘total sleep deprivation, no prior sleep debt’, and Dark green: ‘total sleep deprivation, prior sleep debt’. Panels (a, d and g) predicted circadian phase vs. experimentally observed circadian phase for each sample in the validation set for our one-sample molecular timetable model (a), molecular timetable constructed from the genes published in Lech et al. (2016) (d), molecular timetable constructed from the genes published in Hughey et al. (2016) (g). Data are double plotted. (b, e and h) Average (mean) error and 95% confidence intervals of the mean error per 30o, that is, 120 min, for each 30°Circadian phase bins across the circadian cycle, for each of the models. The grey area plot represents the average melatonin profile. (c, f and i) Frequency distribution of errors. Errors were sorted into 15o, that is, 60 min bins, for each model. For each of the models, the mode of the distribution is near 0 but the width of the distribution varies across models.
Figure 3—figure supplement 2
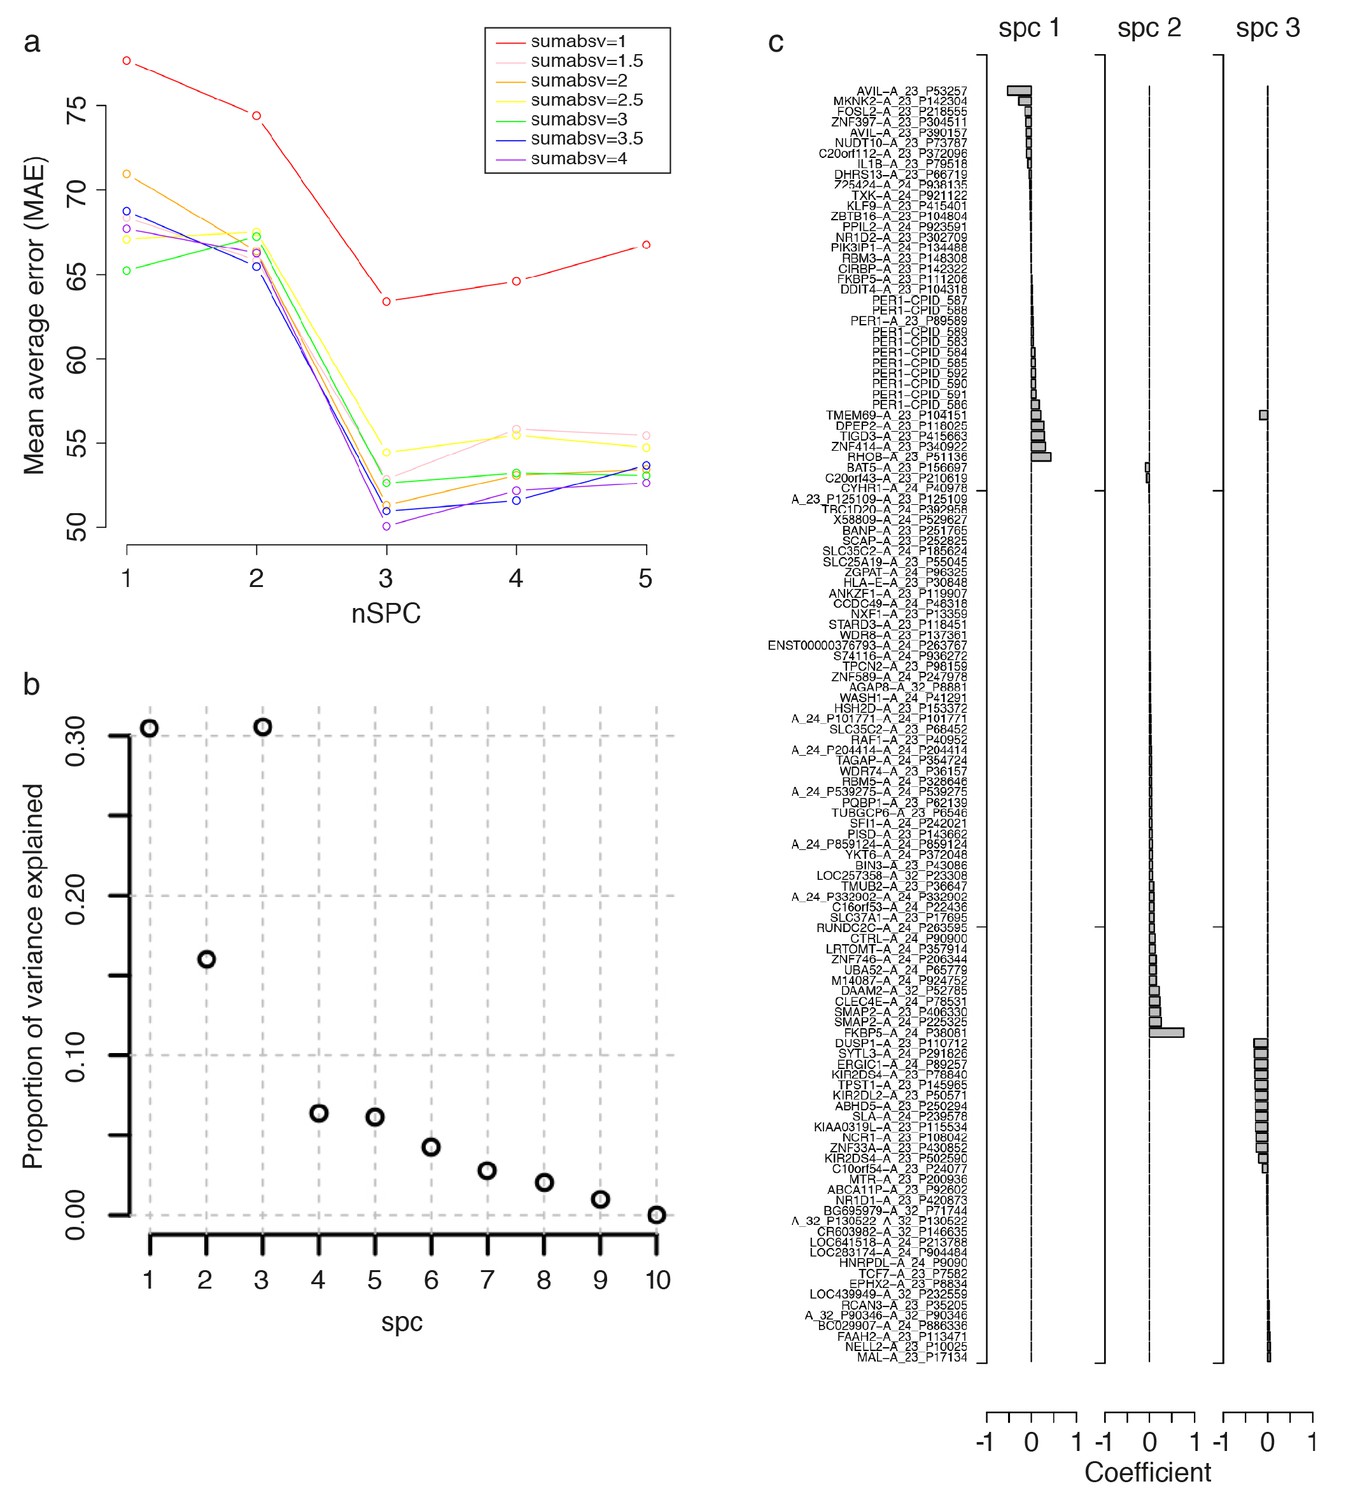
Parameter selection for constructing a Zeitzeiger based model.
To build a Zeitzeiger predictor, given a training data set, there are two parameters that need to be optimized: ‘sumabsv’, which controls the number of features to be used, and ‘nSPC’, which controls the number of principal components that best describe (explain) the variance in mRNA abundance, measured by features, over time. The performance of differing combinations of sumabsv and nSPC were assessed using cross-validation (see Materials and methods). Panel a shows the change in performance, measured by mean average error (MAE), between the predicted and true circadian phase of samples in the training set, of the sumabsv input parameter of the Zeitzeiger algorithm across different nSPC values. The sumabsv value (4) resulting in the smallest MAE is optimal. Panel b shows the proportion of variance explained of differing values of the nSPC input parameter when sumabsv = 4. The nSPC value (3) giving the highest proportion of variance explained is optimal. (c) mRNA abundance features identified for the construction of the final Zeitzeiger model, using the parameters sumabsv = 4 and nSPC = 3. Bar chart represents the contribution (i.e. weight, [coefficient on x-axis]) of a feature to each of the three components spc1, spc2 and spc2. Note that there are multiple, different features (probes) that target a gene on the microarray platform we have used (e.g. multiple CPID probes targeting PER3; see GEO [Barrett et al., 2013; Accession number: GPL15331]).
Figure 3—figure supplement 3
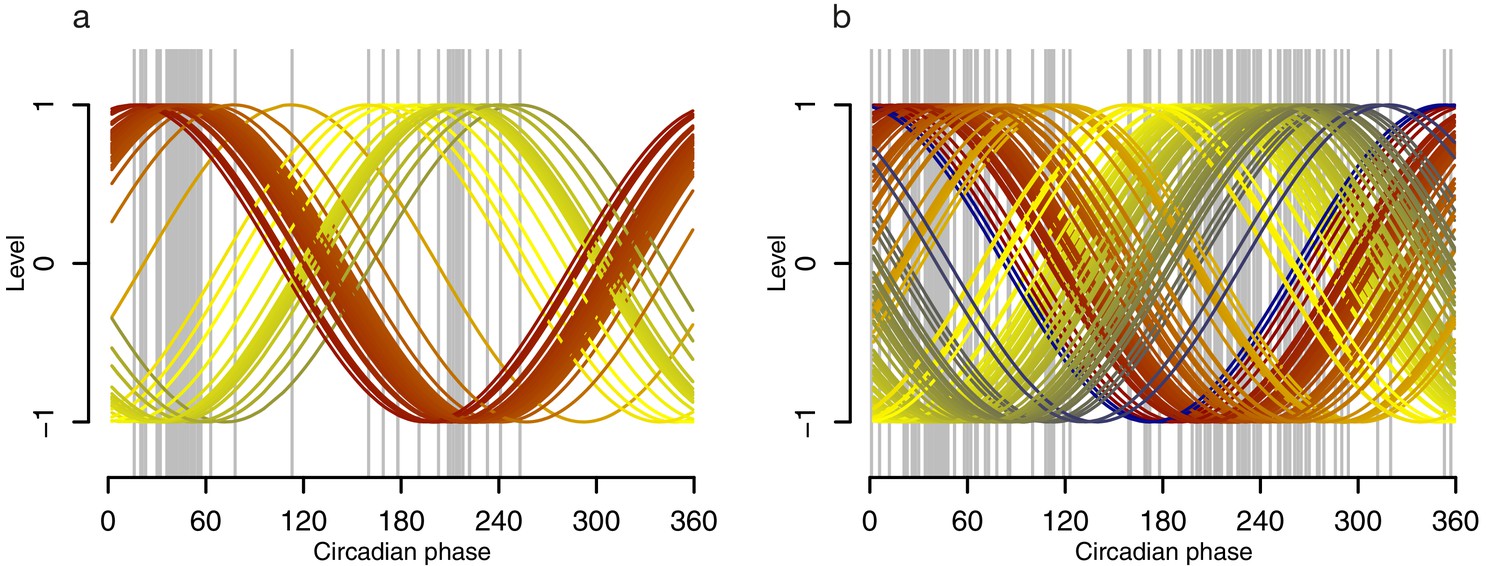
Phase profiles of genes in the phase marker lists for the molecular timetable and Zeitzeiger models.
Grey lines indicate the circadian phase of a gene’s maxima when Z-scored, where the number of grey lines equals the number of genes (features) used to construct the model, either the molecular timetable (a) or the Zeitzeiger model (b). Colored lines represent cosine waves with a given (gene’s) phase, with a gradient of red to blue via yellow that is cosine waves with lower phases are colored in red, cosine waves with higher phases are colored in blue.
Figure 3—figure supplement 4
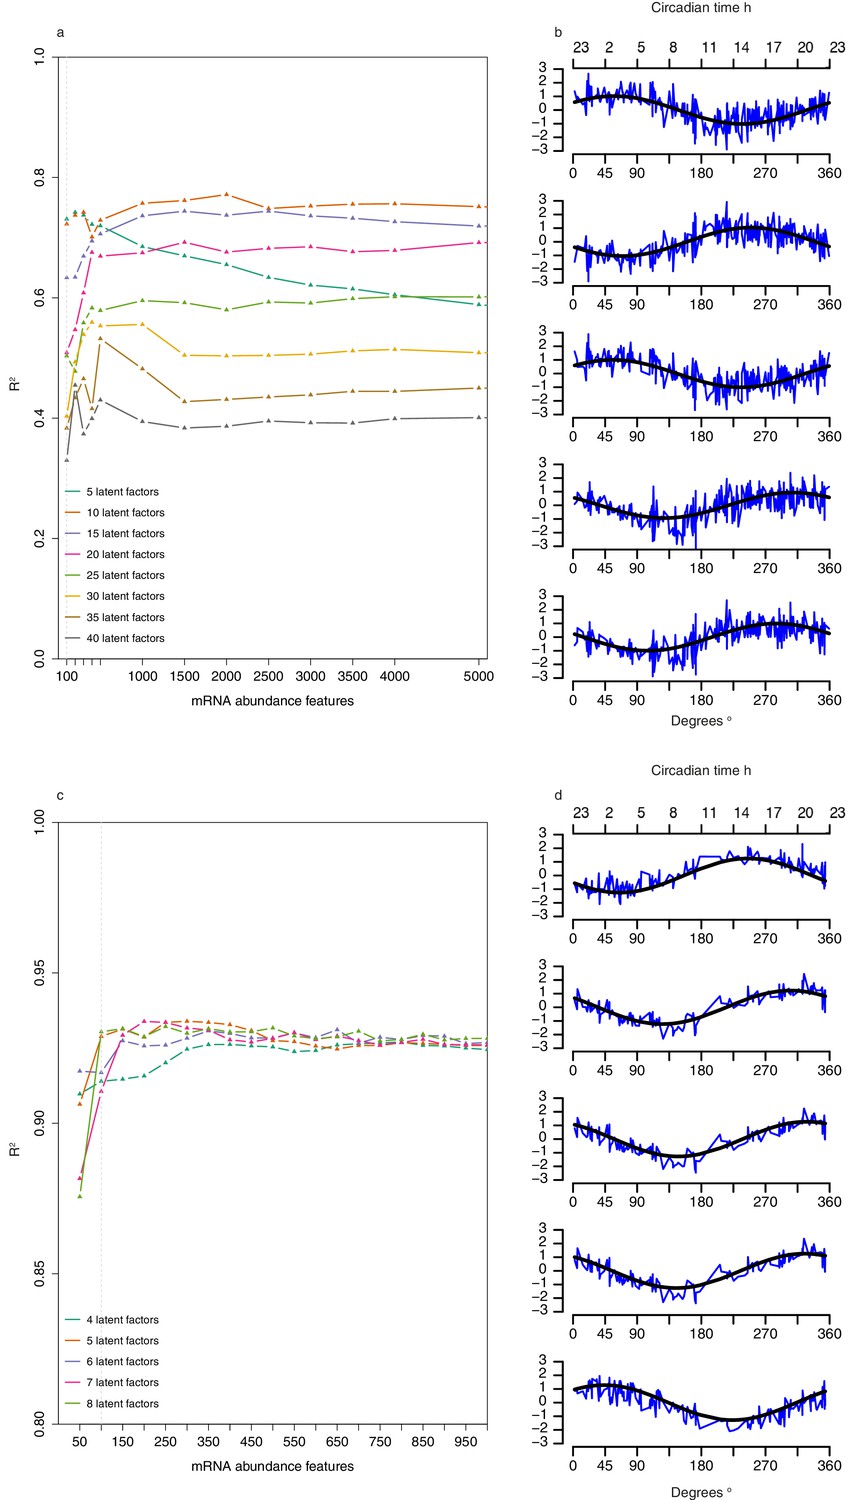
Selection of number of abundance features and latent factors and pseudo time-course of latent factor scores for Partial Least Squares Regression (PLSR)-based models.
(a) Leave-one-participant-out cross-validation performance of one-sample PLSR models applied to training set when using different combinations of n mRNA abundance features and T latent factors. (b) Pseudo-time course of latent factor scores for each of the five latent factors used to build the one-sample PLSR-based model; x-axis comprises the 329 samples in the training set ordered by their true circadian phase vs. y-axis of corresponding z-scored latent factor score (a linear combination of the 100 feature values used to generate the model multiplied by the corresponding latent factor loadings [weights]) for the sample. Black line represents the fitted cosine wave to the pseudo time-course. (c) Leave-one-participant-out cross-validation performance of two-sample differential mRNA abundance PLSR models applied to training set when using different combinations of n mRNA abundance features and T latent factors. (d) Pseudo-time course of factor scores for each of the five latent factors used to build the two-sample differential PLSR-based model; x-axis comprises the 163 paired samples in the training set ordered by their true circadian phase vs y-axis of corresponding z-scored latent factor score (a linear combination of the 100 feature values used to generate the model multiplied by the corresponding latent factor loadings [weights]) for the sample. Black line represents the fitted cosine wave to the pseudo time-course.
Figure 3—figure supplement 5
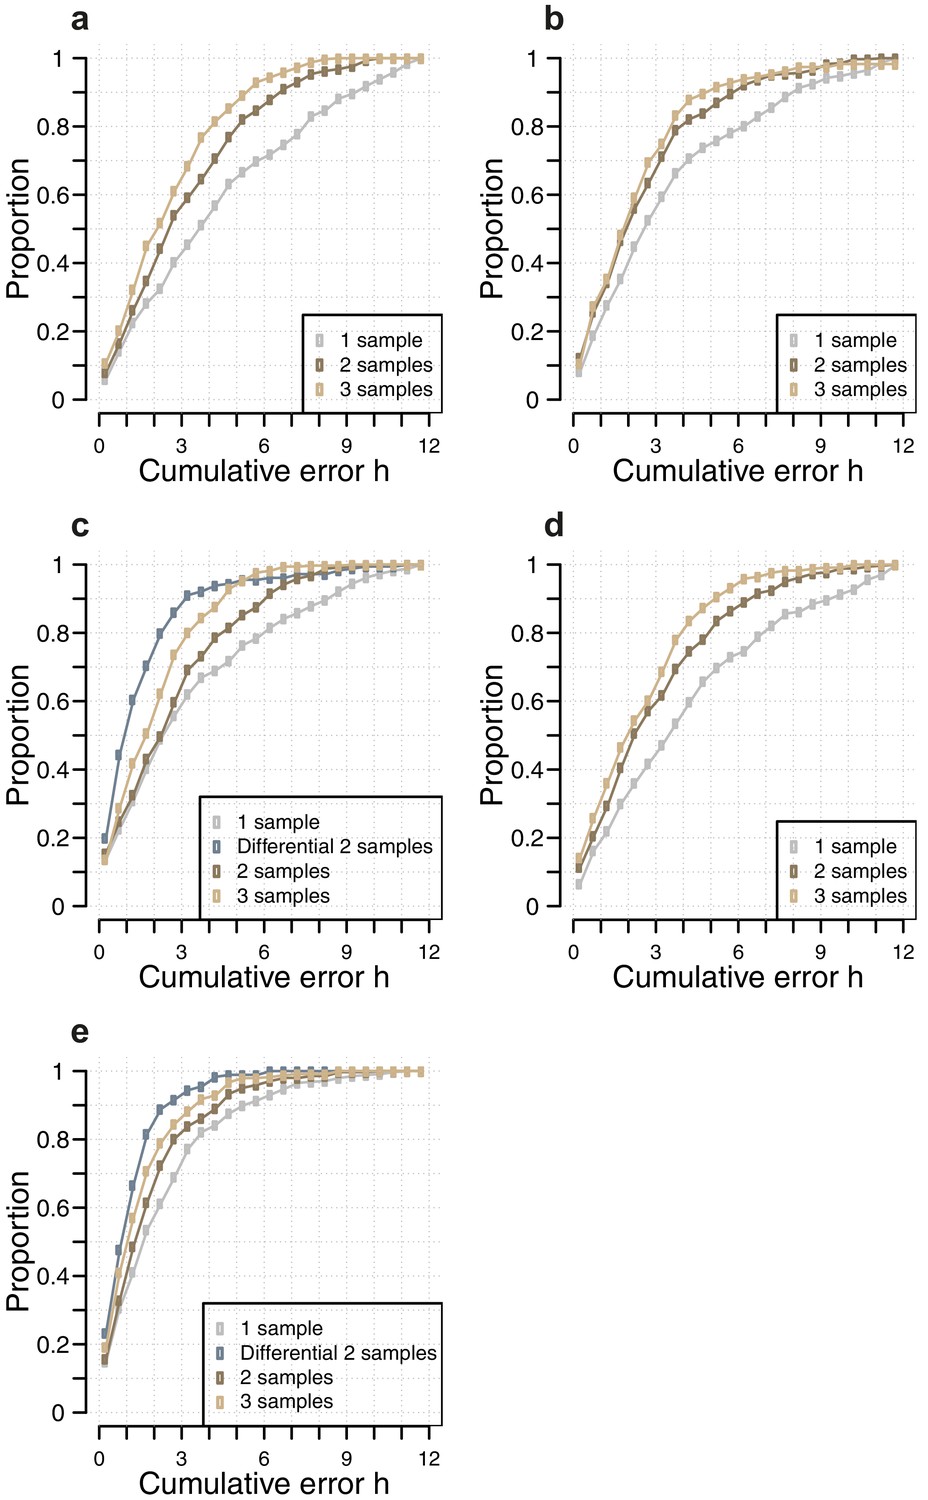
Comparison of the number of samples used as input vs, accuracy for each circadian phase prediction method.
Difference in model performance, as measured by the proportion of predictions vs. cumulative error, when using a given number of samples (one sample, two consecutive samples, three consecutive samples, two sample differential, see Materials and methods), as input for each circadian phase prediction method. (a) Molecular timetable method using the genes published in (Lech et al., 2016); (b) Molecular timetable method using the genes published in (Hughey et al., 2016); (c) Molecular timetable method using the set of 73 features derived from this study; (d) Zeitzeiger method using the set of 107 features derived from this study; (e) PLSR method using the 100 features identified by our one-sample approach (for the one, two and three samples) and 100 features identified by our two-sample differential approach (for the two-sample differential).
Figure 4
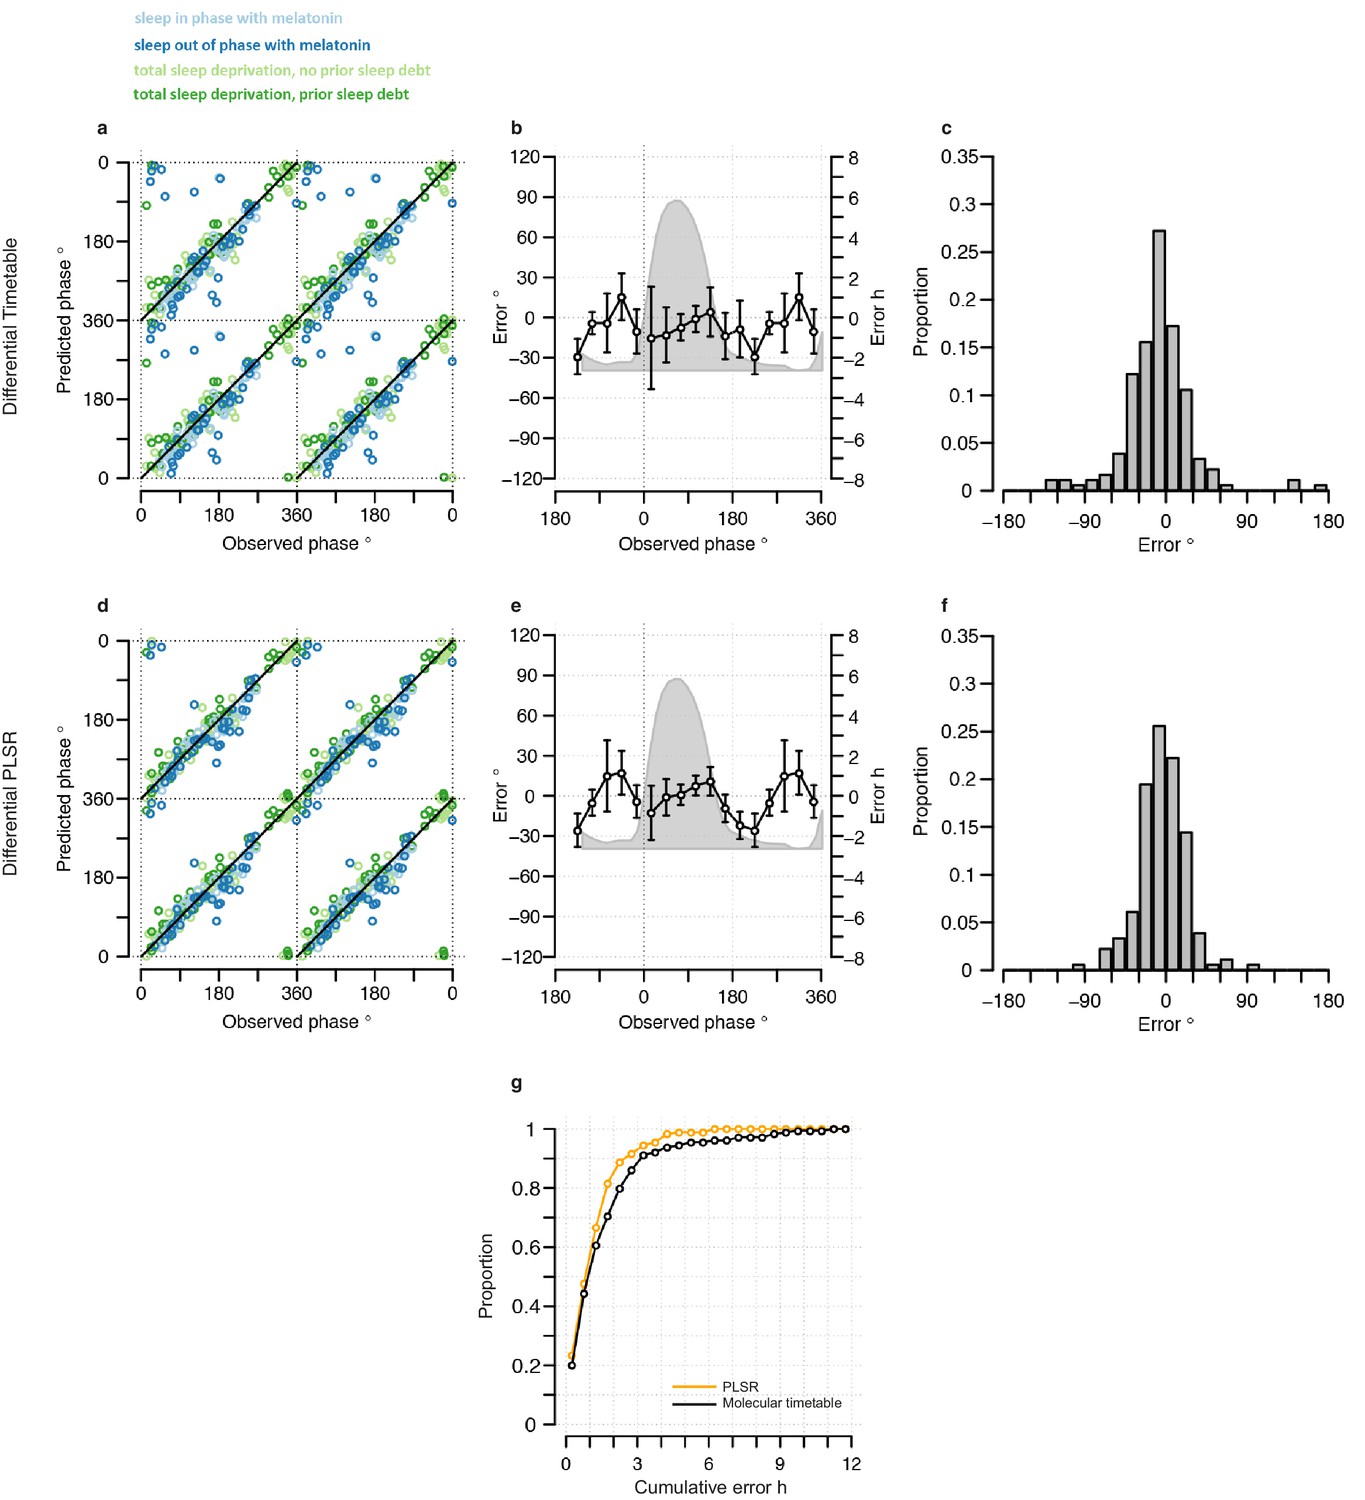
Performance of two-sample differential mRNA abundance-based models when used to predict the circadian phase in the validation set.
(a and d) Predicted circadian phase of a blood sample vs. the observed circadian melatonin phase for each sample in the validation set for the two-sample differential molecular timetable model (a) and the two-sample differential PLSR-based model (d). Data are double-plotted. (b and e) Average (mean) error and 95% confidence intervals of the mean error per 30o, that is, 120 min, for each 30° circadian phase bins across the circadian cycle, for each of the models. The grey area plot represents the average melatonin profile. (c and f) Frequency distribution of errors. Errors were sorted into 15o, that is, 60 min bins, for each model. For each of the models, the mode of the distribution is near 0, but the width of the distribution varies across models. (g) Performance of the differential PLSR (orange), and the differential molecular timetable method (black) quantified by proportion of samples vs. cumulative error. Data source file Figure 4—source data 1.
-
Figure 4—source data 1
Source data file for generating panels in Figure 4.
- https://doi.org/10.7554/eLife.20214.018
Figure 5 with 1 supplement
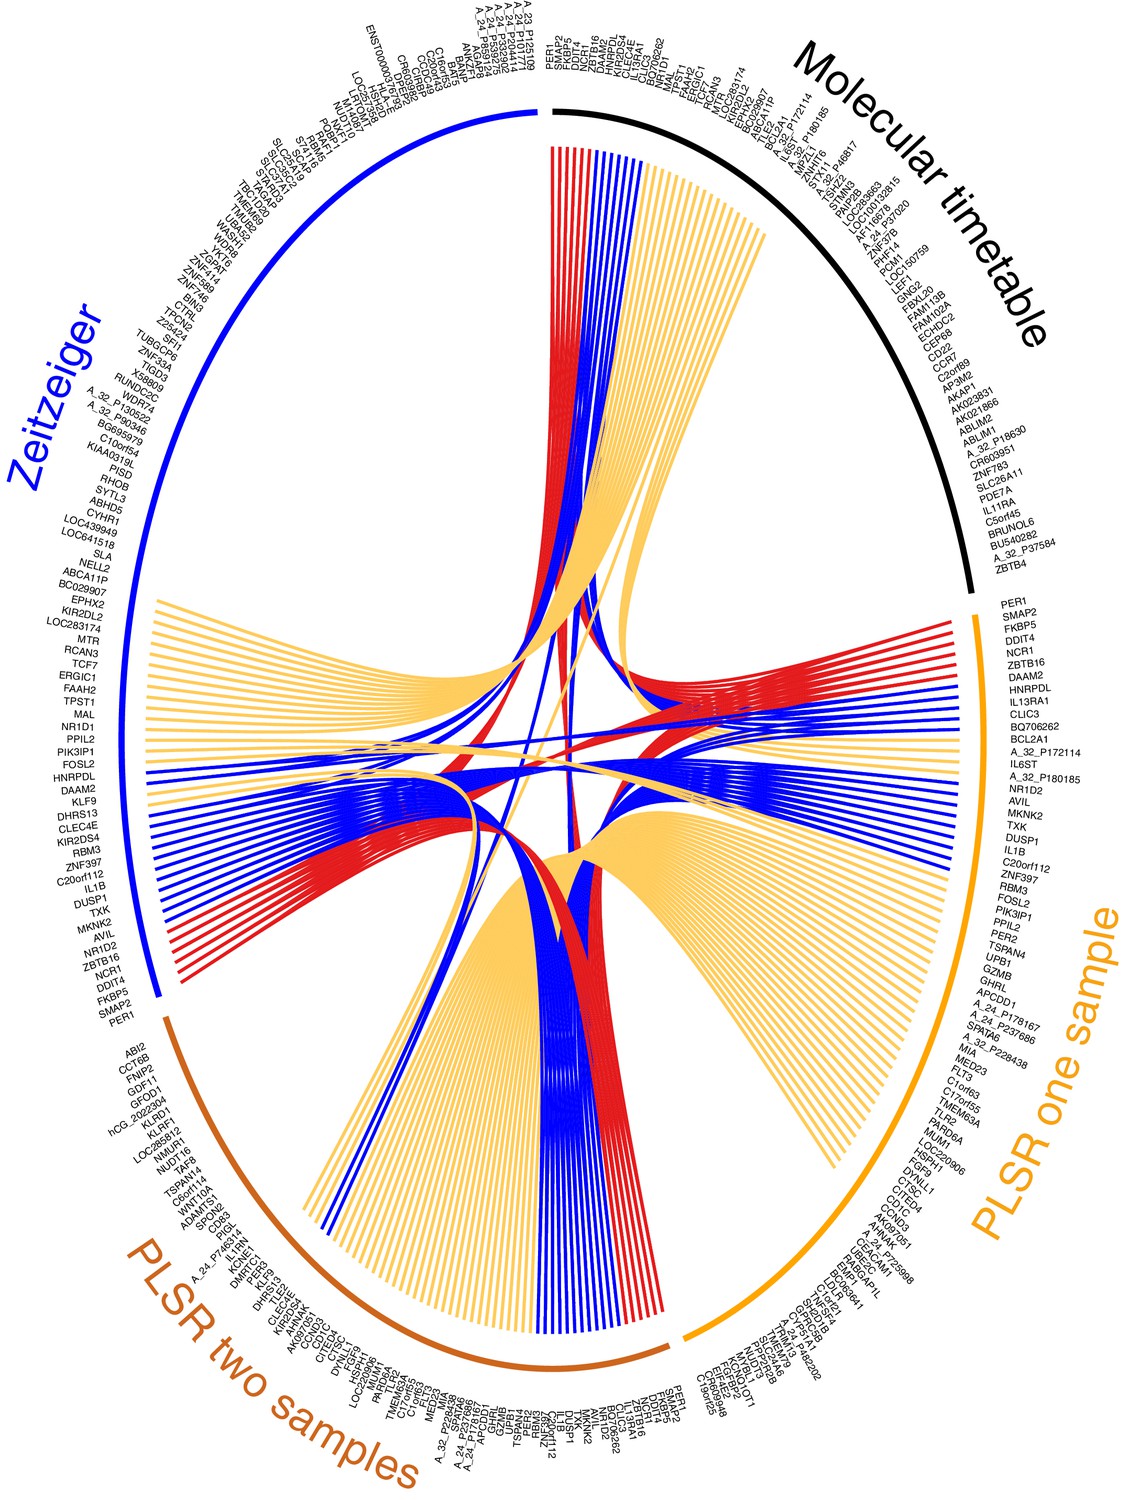
Circos plot for visual comparison of lists of biomarkers forming the generated circadian phase prediction models.
Circular tracks from outside in; (1) Name of model being compared (Molecular timetable, Zeitzeiger, PLSR one-sample, PLSR two-sample differential), where all models are constructed from the same training set. The color of the model name corresponds to the color of the bar in track 3. (2) Unique HGNC Gene symbols or probe identifiers for features from which the specified model (adjacent track 1 and 3) are created; (3) Color bar indicating the model (Black= Molecular timetable, Orange = PLSR one-sample, Dark orange = PLSR two-sample differential, Blue = Zeitzeiger). Inner arcs represent the overlap between models. Genes present in two models are linked by yellow arcs; genes present in three models are linked by blue arcs; and genes present in all models are linked by red arcs. Figure generated using the R package OmicCircos (Hu et al., 2014).
Figure 5—figure supplement 1
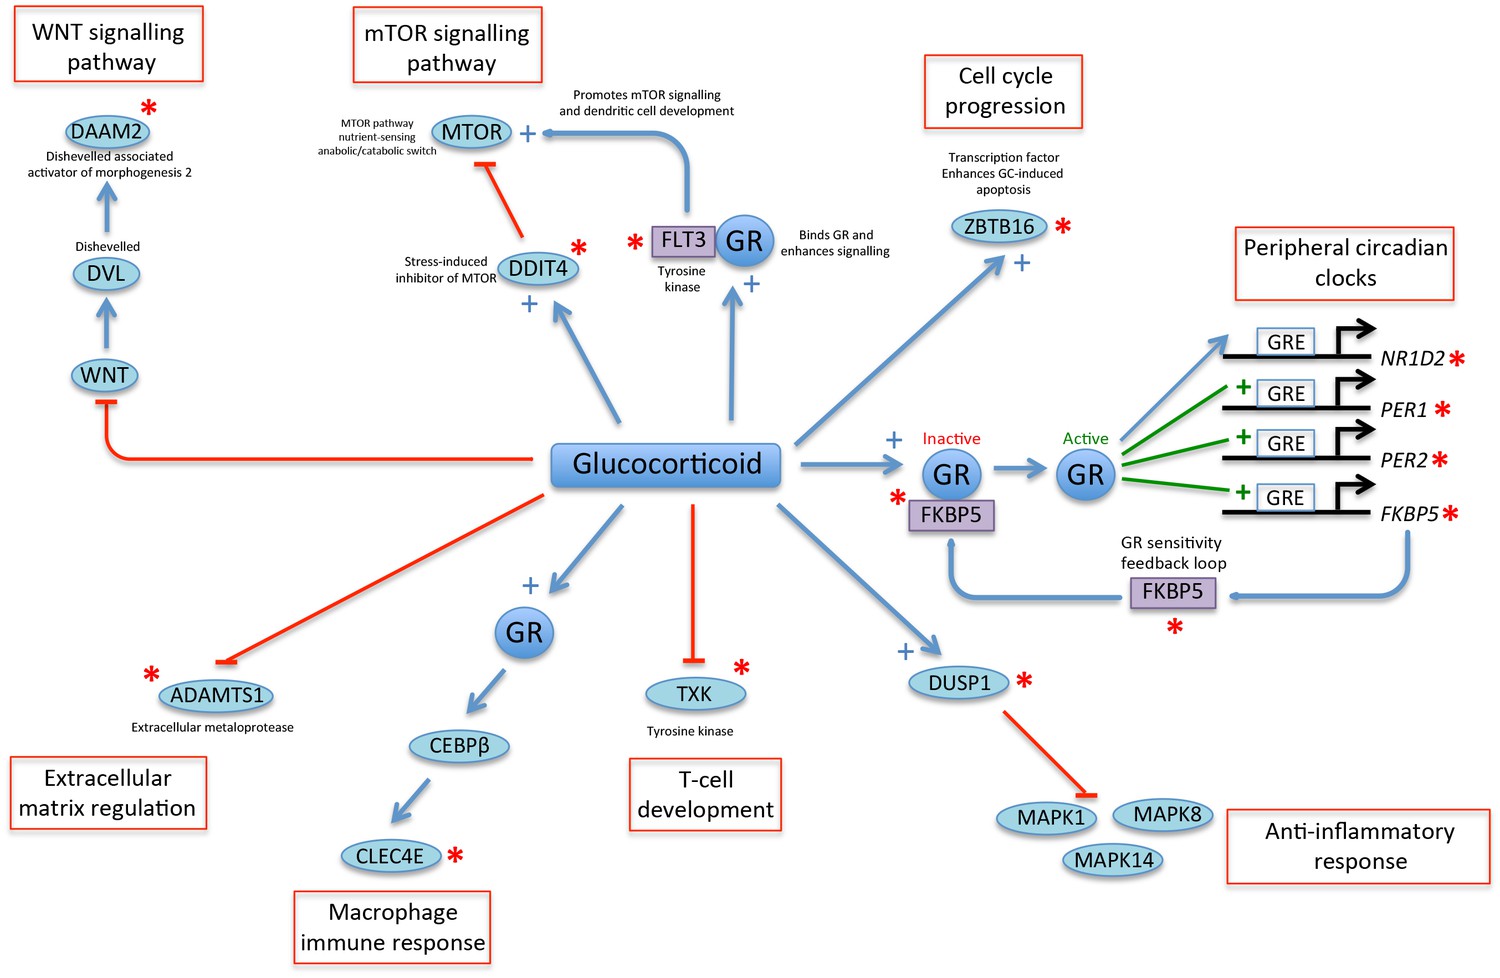
A glucocorticoid-driven network links many of the top-ranked PLSR genes.
Twelve of the top-25 ranked genes in the PLSR onesample and PLSR two-sample differential models (indicated by a red asterisk) are linked in a network that is driven by glucocorticoid signaling. Glucocorticoid (GC) acting via glucocorticoid receptors (GR) has been shown to stimulate the expression of thousands of genes in human peripheral blood (Menke et al., 2012). GR is inactive when it is bound by a group of chaperone molecules that includes FKBP5 (Park et al., 2007). Active GR binds to GC response elements (GRE) in the promoters and induces the expression of GC-regulated genes, which include peripheral circadian clock genes such as PER1 and PER2 (Cuesta et al., 2015; So et al., 2009; Leliavski et al., 2015), but also in many other genes such as FKBP5 (Park et al., 2007). GR can also induce the rhythmic expression of NR1D2 (So et al., 2009). GC induces the expression of the phosphatase DUSP1 (Shah et al., 2014), which supresses the inflammatory response by inhibiting MAP kinases (Abraham and Clark, 2006). GC down-regulates the expression of the tyrosine kinase TXK, which regulates T-cell development (Petrillo et al., 2014). GR increases the activity of CEBPB (Berg et al., 2005), which is a transcription factor whose expression is increased during macrophage differentiation and mediates the expression of inflammatory mediators including CLEC4E (Akagi et al., 2010). GC reduces the expression of the metalloproteinase ADAMTS1 that regulates extracellular matrix function (Wong et al., 2016). GC inhibits WNT signaling (Naito et al., 2015). DAAM2 binds to and stabilizes DVL enhancing WNT signaling during cell development (Lee and Deneen, 2012). The MTOR signaling pathway senses nutrient stress and interacts with components of the WNT signaling pathway (Inoki et al., 2006). DDIT4 is a repressor of MTOR (Gordon et al., 2015) and is transcriptionally up-regulated by GC in response to stress and fasting (Polman et al., 2012; McGhee et al., 2009). FLT3 is a tyrosine kinase that binds to GR and potentiates its signaling (Asadi et al., 2008). FLT3 also regulates dendritic cell development by activating mTOR signaling (Chen et al., 2010). ZBTB16 is a transcriptional repressor that is enhanced by GC and regulates GC response genes and affects GC-induced apoptosis (Wasim et al., 2010, 2012).
Author response image 1
Author response image 2
Tables
Table 1
Performance of trained models when used to predict the circadian phase of samples in the validation set. NS indicates not significant.
| Average error (minutes) | Standard Deviation of Error (hours: minutes) | Circadian variation of error (P-value of ANOVA) | Proportion of samples with ≤2 hr error | R2 of predicted vs observed phase | |
|---|---|---|---|---|---|
| Genes-from (Lech et al., 2016) - one sample | 15 | 5:32 | NS | 28% | 0.28 |
| Genes-from (Hughey et al., 2016) - one sample | −2 | 5:23 | <0.01 | 30% | 0.32 |
| Timetable - one sample | 9 | 4:38 | <0.01 | 40% | 0.49 |
| Zeitzeiger - one sample | −0.4 | 4:44 | NS | 36% | 0.47 |
| Partial Least Square Regression - one sample | −18 | 3:17 | NS | 54% | 0.74 |
| Genes-from (Lech et al., 2016) - two samples | 20 | 4:05 | 0.05 | 35% | 0.60 |
| Genes-from (Hughey et al., 2016) - two samples | −0.65 | 3:58 | 0.03 | 41% | 0.63 |
| Timtable - two samples | 11 | 3:38 | <0.01 | 43% | 0.69 |
| Zeitzeiger - two samples | -2 | 3:36 | NS | 47% | 0.69 |
| Partial Least Square Regression - two samples | −16 | 2:39 | NS | 62% | 0.83 |
| Genes-from (Lech et al., 2016) - three samples | 24 | 3:21 | 0.05 | 45% | 0.73 |
| Genes-from (Hughey et al., 2016) - three samples | 8 | 3:19 | NS | 47% | 0.74 |
| Timetable - three samples | -3 | 2:46 | <0.01 | 51% | 0.82 |
| Zeitzeiger - three samples | 4 | 3:03 | NS | 49% | 0.78 |
| Partial Least Square Regression - three samples | −11 | 2:15 | NS | 71% | 0.88 |
| Timetable - Differential two samples | −33 | 2:28 | NS | 71% | 0.78 |
| Partial Least Square Regression-Differential two samples | −18 | 1:41 | NS | 82% | 0.90 |
Additional files
-
Supplementary file 1
Comparison of phase marker lists.
(A) Correlation r values and relative rank of correlation value for genes in phase marker lists. Maximum correlation for a gene is based on the maximum correlation between the temporal profile of a feature targeting that gene and a cosine wave. Temporal profiles were constructed independently for each condition and across all conditions. Rank of a gene is based on the distribution of maximum r values for a specific condition. Columns in the file; (A) Probe name; (B) Gene Symbol (or probe name if no gene is assigned); (C) Binary values identifying a gene as present (1) or absent (0) in the list of genes forming the molecular timetable model generated here; (D) Binary values identifying a gene as present (1) or absent (0) in the list of genes forming the model of (Lech et al., 2016); (E) Binary values identifying a gene as present (1) or absent (0) in the list of genes forming the model of (Hughey et al., 2016); (F) Binary values identifying a gene as present (1) or absent (0) in the list of genes forming the Zeitzeiger model generated here; (G) The maximum correlation r value of a gene across all four conditions used in this study; H) The maximum correlation r value of a gene in the condition ‘sleep in phase with melatonin’; (I) The maximum correlation r value of a gene in the condition ‘sleep out of phase with melatonin’; (J) The maximum correlation r value of a gene in the condition ‘total sleep deprivation, no prior sleep debt’; (K) The maximum correlation r value of a gene in the condition ‘total sleep deprivation, prior sleep debt’; (L), (M), (N), (O), and (P) provide the ranking of the correlation r value in the corresponding condition(s) of columns (G), (H), (I), (J) and (K) respectively. (B) Comparison of gene lists derived from different phase marker models and/or analyses. Genes identified in at least one of the gene lists discussed in this work (as indicated by the key within the file). A value of 1 indicates presence in the list, a value of 0 indicates absence. (C) Features (probes) and corresponding gene symbols for the one-sample PLSR model. (D) Features (probes) and corresponding gene symbols for the two-sample differential PLSR model.
- https://doi.org/10.7554/eLife.20214.021
-
Supplementary file 2
Results table for Functional enrichment analysis of feature lists and latent factors for both the one-sample and two-sample differential PLSR-based models.
Functional enrichment analysis outputs from using the Webgestalt functional enrichment analysis tool.
- https://doi.org/10.7554/eLife.20214.022
-
Supplementary file 3
Demographic information for the participants within the training and validation data sets.
- https://doi.org/10.7554/eLife.20214.023
Download links
A two-part list of links to download the article, or parts of the article, in various formats.
Downloads (link to download the article as PDF)
Open citations (links to open the citations from this article in various online reference manager services)
Cite this article (links to download the citations from this article in formats compatible with various reference manager tools)
Blood transcriptome based biomarkers for human circadian phase
eLife 6:e20214.
https://doi.org/10.7554/eLife.20214


