Successful transmission and transcriptional deployment of a human chromosome via mouse male meiosis
- University of Cambridge, United Kingdom
- Addenbrooke’s Hospital, United Kingdom
- University of Oxford, United Kingdom
- Stanford University School of Medicine, United states
- Stanford University School of Medicine, United States
- Science for Life Laboratory, Karolinska Institute, Sweden
Figures
Figure 1 with 2 supplements
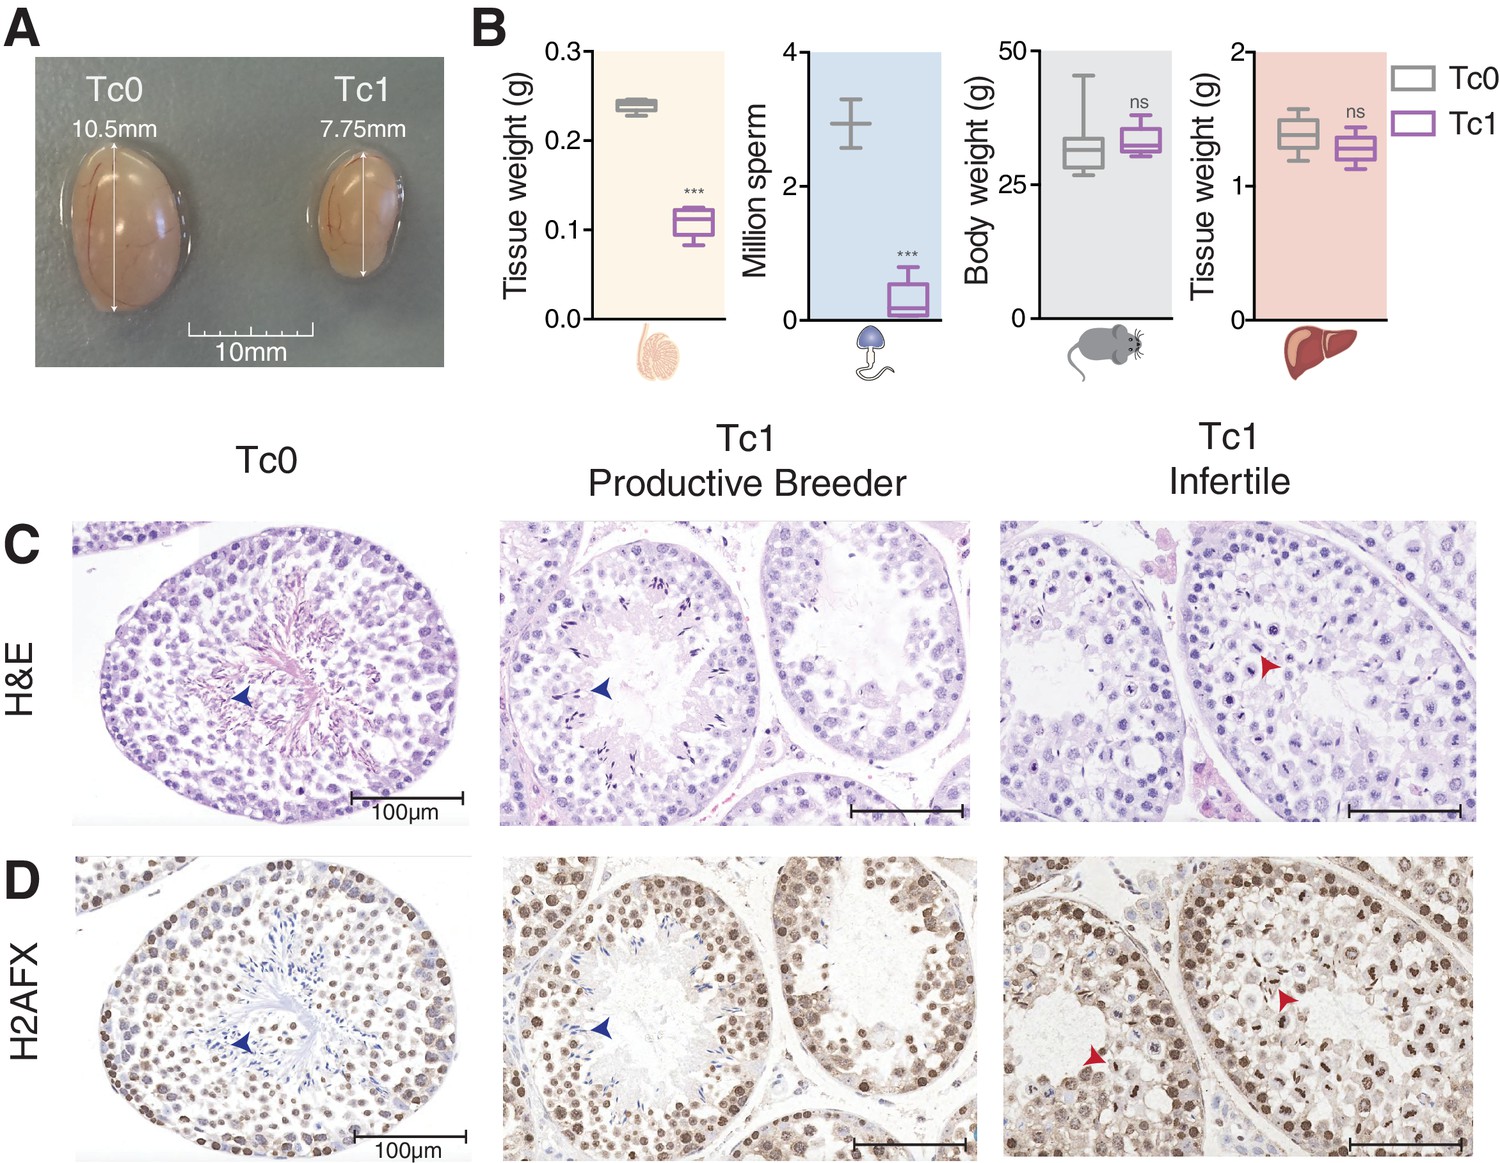
Male mice carrying human chromosome 21 show subfertility phenotypes.
(A) Comparison of testis size from 12-week-old Tc0 and Tc1 littermates. (B) Testis weight, sperm count, body weight and liver weight from Tc0 and Tc1 mice. Five mice of each genotype aged between 12–14 weeks were used for tissue and body weight measurements. Sperm samples were from mice aged between 16–32 weeks, and were counted for 2 Tc0 and 5 Tc1 animals. Statistical analysis was a student’s t-test (p<0.0001). Photomicrographs of testis tissue sections from adult Tc0 and Tc1 mice stained with H&E (C) and IHC with anti-γH2AFX antibody (D) original magnification 20x. Blue arrowheads indicate mature sperm, red arrowheads indicate failure in chromosome segregation. Infertile males did not produce any offspring over 6 month period kept with the same female.
Figure 1—figure supplement 1

Tc1 mouse testes have histological abnormalities that interfere with proper spermatogenesis.
(A) Seminiferous tubules were classified from photomicrographs of Tc1 testes tissue sections stained by H and E as follows: Grade I: normal spermatogenesis; Grade II: mild hypo-spermatogenesis (all germ cell stages present but visible meiotic disruption and suboptimal frequency of spermatozoa); Grade III: severe hypo-spermatogenesis (all germ cell stages present including occasional spermatozoa); Grade IV: maturation arrest (incomplete spermatogenesis, not beyond the spermatocyte stage). Original magnification 20x. (B) Percentage of tubules per grade is shown for individual Tc0 and Tc1 males. (C) A (rare) example of Grade III tubules in a wild-type Tc0 mouse, compared with a (common) Grade III example in Tc1 males. Tc1 males frequently show defects in chromosome segregation during meiosis I (red arrowheads).
Figure 1—figure supplement 2
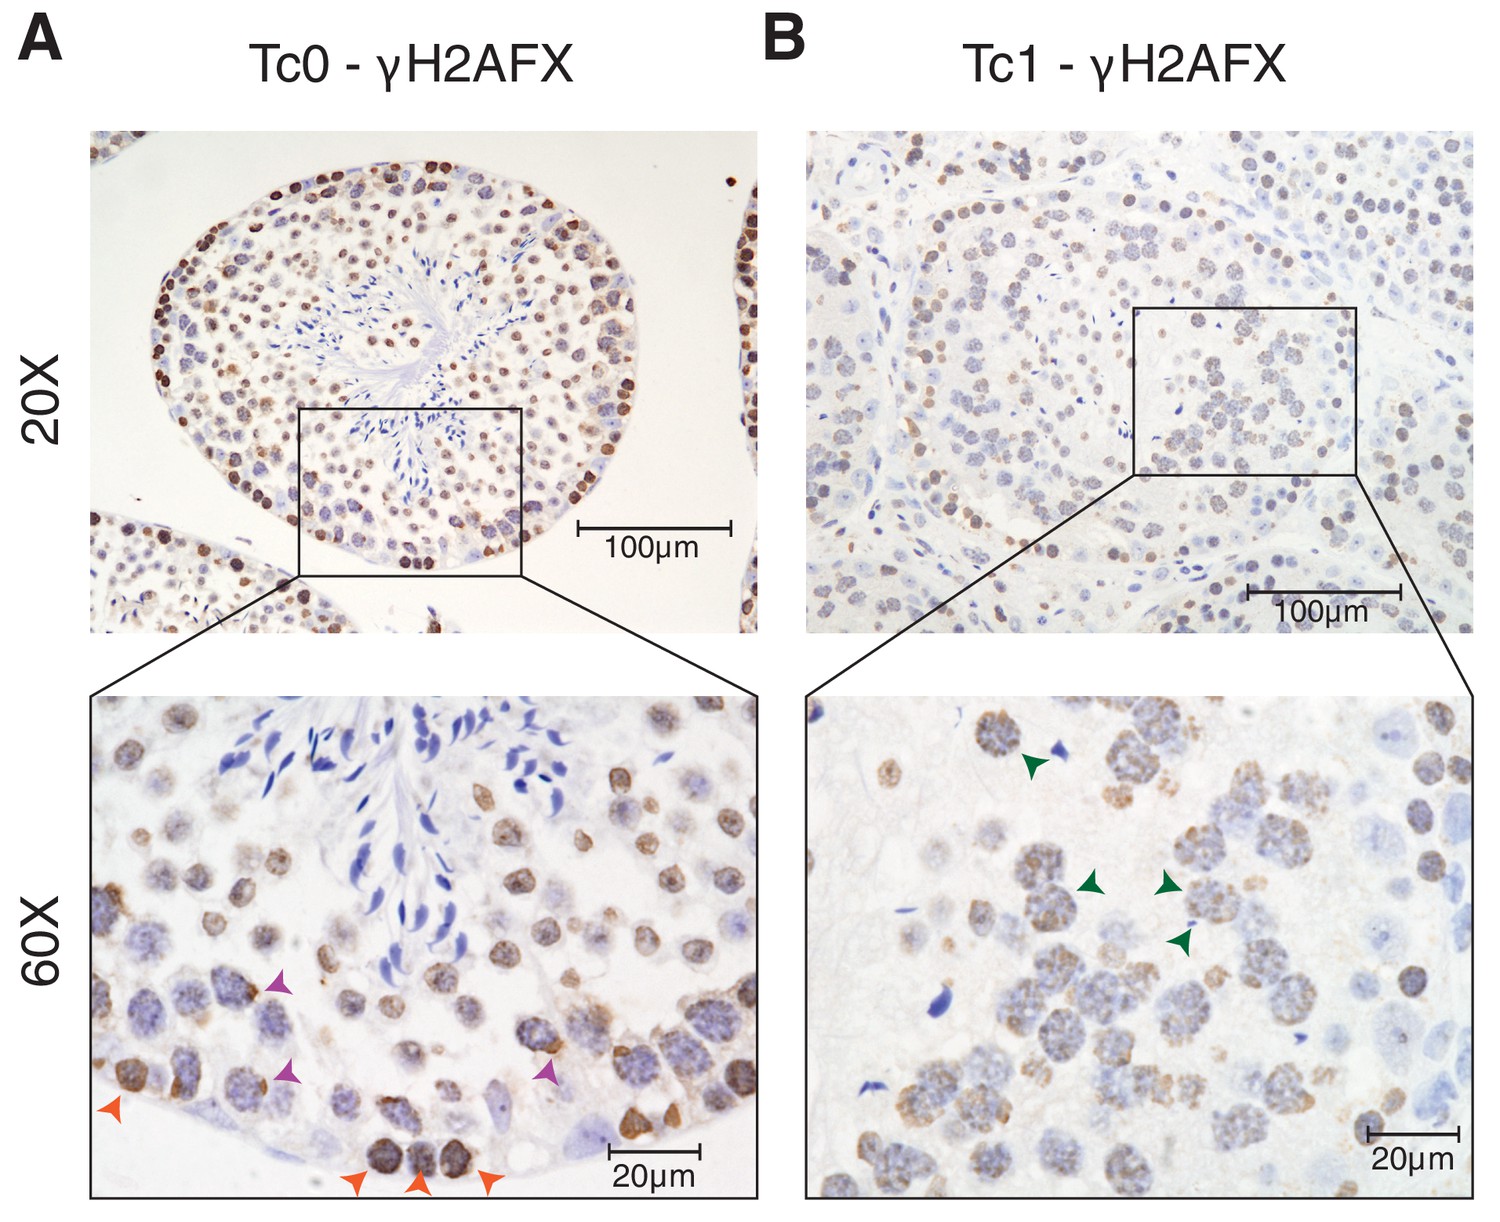
γH2AFX staining of Tc1 male testes shows a higher number of double strand breaks persisting into the pachytene stage of meiosis when compared to wild-type Tc0 littermates.
(A) Photomicrographs of testis tissue with IHC against γH2AFX in wild-type testes shows homogenous nuclear distribution in leptotene cells (orange arrowheads), indicative of double strand breaks during meiotic recombination. In pachytene cells, γH2AFX becomes restricted to a single foci, which includes the X and Y chromosomes (purple arrowheads) (Hamer, 2002). (B) γH2AFX in Tc1 testes shows a similar distribution across leptotene cells but fails to be restricted to a single loci in numerous pachytene spermatocytes (green arrowheads).
Figure 2 with 2 supplements
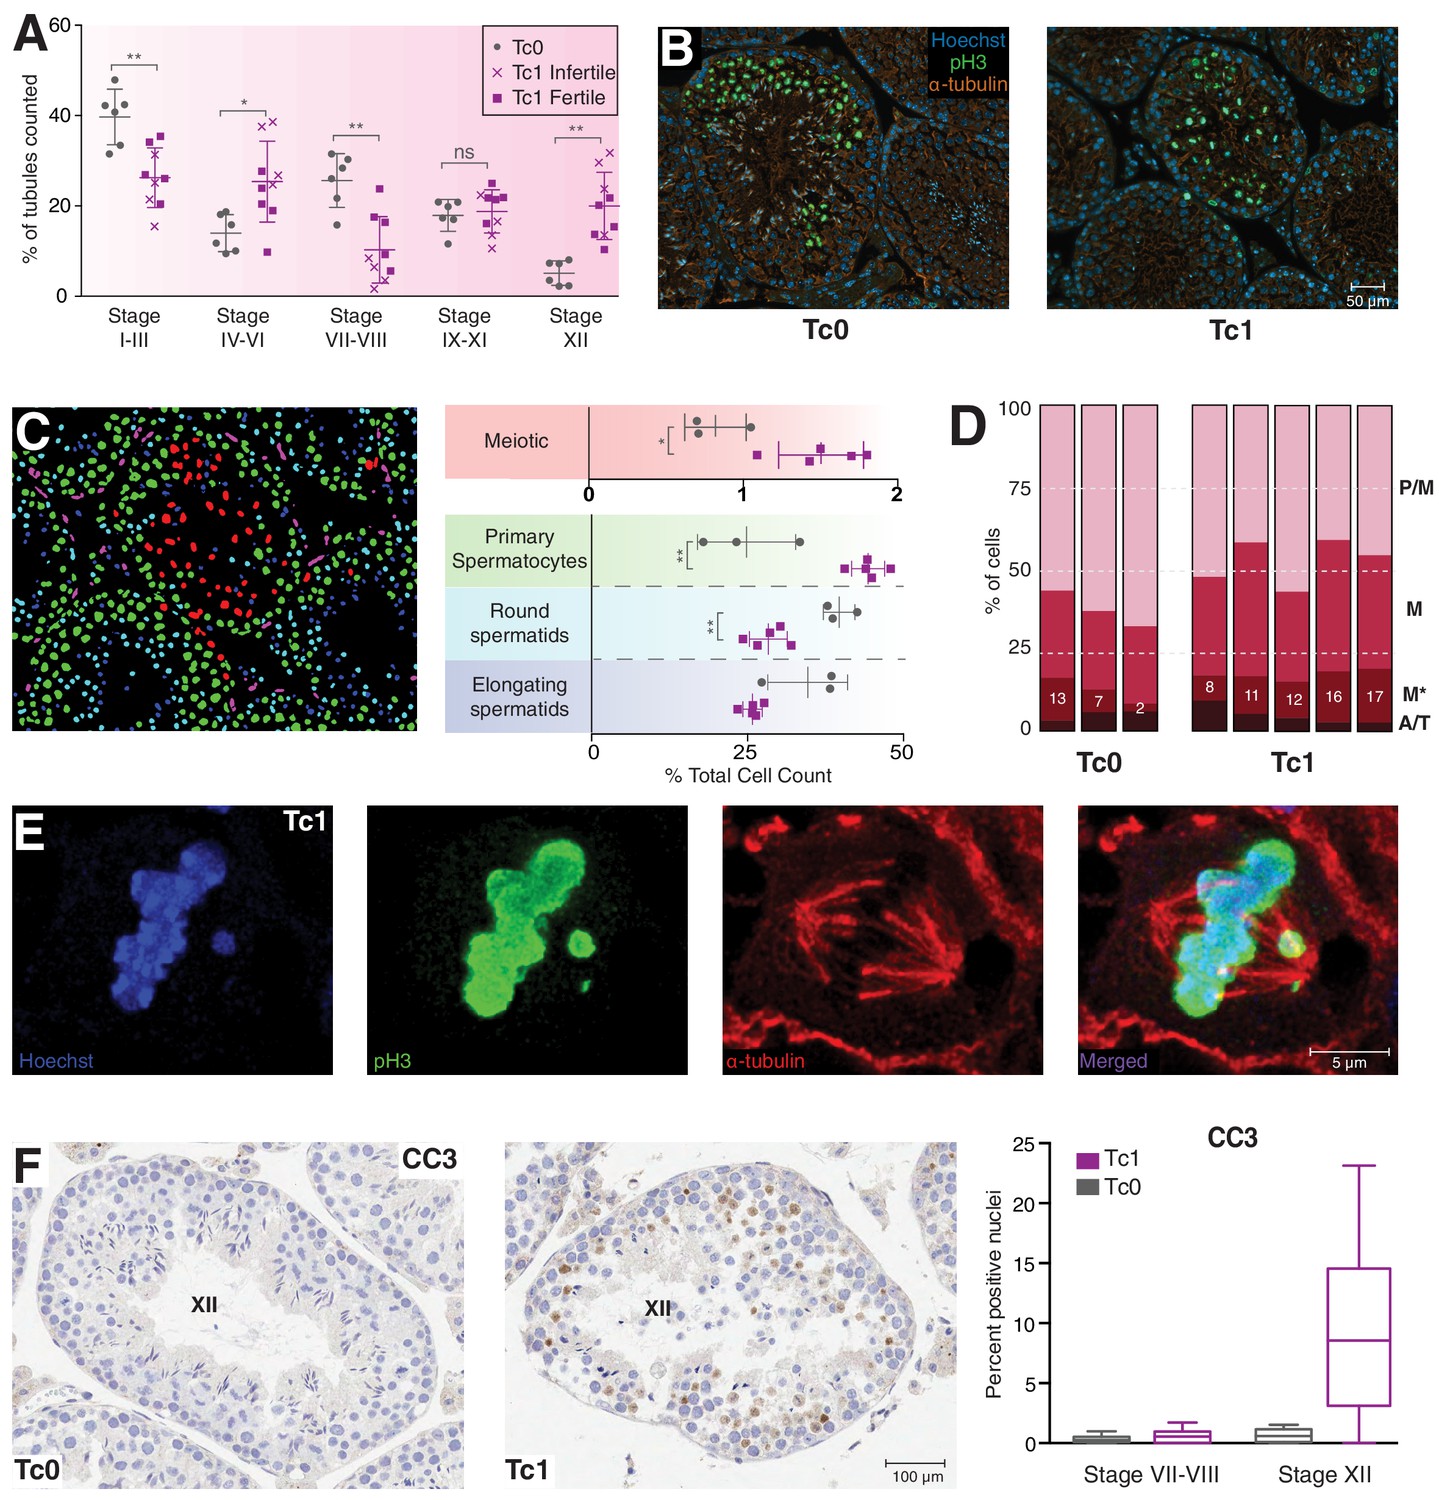
Meiosis in Tc1 males arrests at metaphase I and shows congression defects.
(A) Percentage of tubules per spermatogenic stage are shown for individual Tc0 and Tc1 males. Infertile males did not produce offspring over a six month period kept with the same female. Statistical analysis was a student’s t-test (*p<0.05; **p<0.005). (B) Representative immunofluorescent images of stage XII tubules from Tc0 and Tc1 animals stained with Hoechst in blue, anti-phospho histone H3 on serine 10 (pH3) in green, anti-α-tubulin in red. (C) An illustration using the Tc1 tubule presented in (B) of the annotation generated by the interactive learning algorithm which was used to quantify different cell populations from all animals to generate the % cell counts shown. Cells of the germinal epithelium (purple), 4N spermatocytes (green), meiotic cells (red) as well as round spermatids (light blue) and elongating spermatids (dark blue) were quantified for each individual animal. Statistical analysis was a student’s t-test (*p<0.05; **p<0.005). (D) Manual quantification of the percentage of cells in different meiotic stages (pro-metaphase (P/M), metaphase (M) abnormal metaphase (M*), ana- and telophase (A/T) for individual animals. (E) Representative confocal image of a Tc1 metaphase cell with congression defect. Scale bar is 5 μm. (F) Representative tissue sections from Tc0 and Tc1 testes stained with anti-CC3 (cleaved caspase-3) antibody. Original magnification 20x; scale bar is 100 μm. Nuclei positive for cleaved caspase-3 were quantified in epithelial stage VII-VII and stage XII tubules.
Figure 2—figure supplement 1
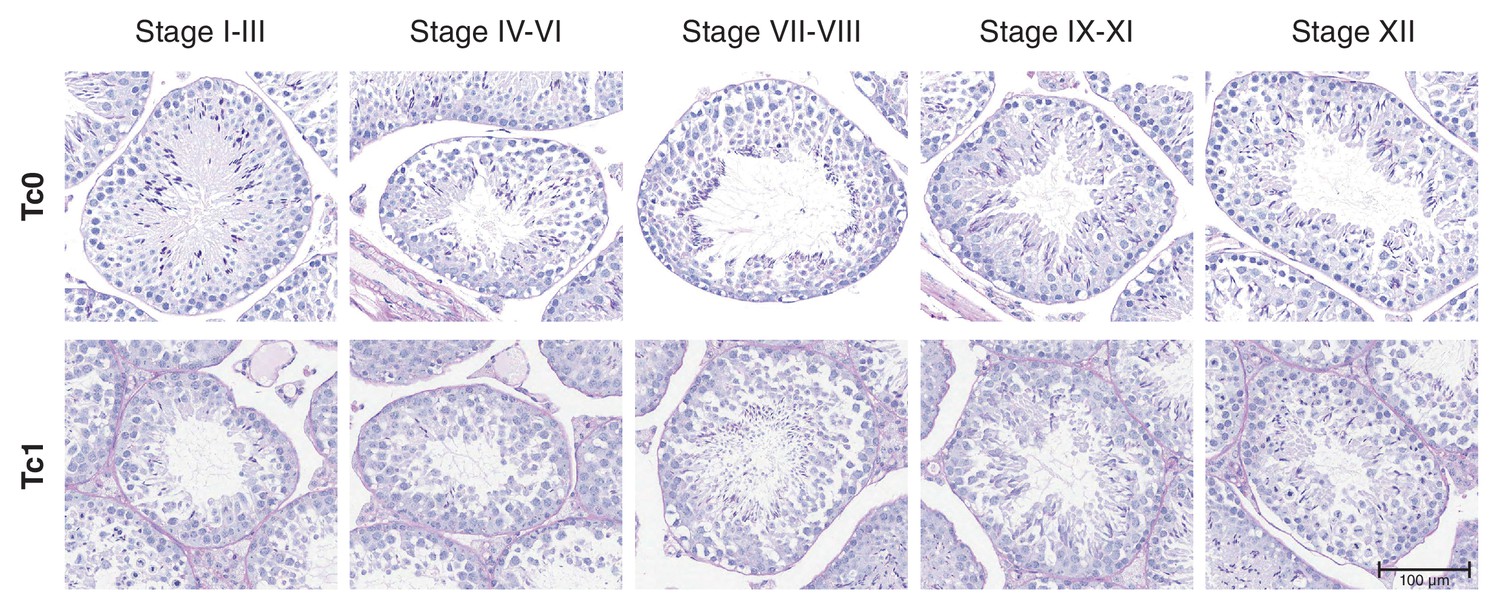
Staging of seminiferous tubules in Tc0 and Tc1 animals on periodic acid schiff (PAS)-stained tissue sections.
Seminiferous tubules were staged from photomicrographs of PAS stained tissue sections from wild-type and Tc1 testes. Staging was performed according to a binary decision key (Meistrich and Hess, 2013): Stage I-III: two generations of spermatids are present but no acrosome cap is visible over the nucleus of round spermatids; Stage IV-VI: two generations of spermatids are present and acrosomic system forms a cap over the nucleus of round spermatids; Stage VII-VIII: two generations of spermatids are present with elongating spermatids lining the lumen; Stage IX-XI: only one generation of spermatids is present but no visible meiotic figures or secondary spermatocytes; Stage XII: only one generation of spermatids is present and spermatocytes display meiotic figures.
Figure 2—figure supplement 2

Quantification of different cell populations and identification of meiotic cells in seminiferous tubules
(A–B) Representative mark-up images of seminiferous tubules after interactive learning-based cell type identification using ilastik (Sommer et al., 2011) for Tc0 and Tc1 testes. Manual training on snapshots from both genotypes allowed identification of five different cell types, including germinal epithelial cells (purple), primary spermatocytes (green), meiotic cells (red), round spermatids (light blue) and elongating spermatids (dark blue). White squares illustrate snapshots for which corresponding immunofluorescent images are shown in Figure 2B. (C–D) Representative high-resolution confocal images of tissue sections from Tc0 and Tc1 animals stained for pH3 and α-tubulin by immunofluorescence. Tc1 snapshot shows a pro-metaphase cell (P/M), a normal metaphase cell (M) as well as a metaphase cell with congression defect (white arrowhead).
Figure 3 with 4 supplements
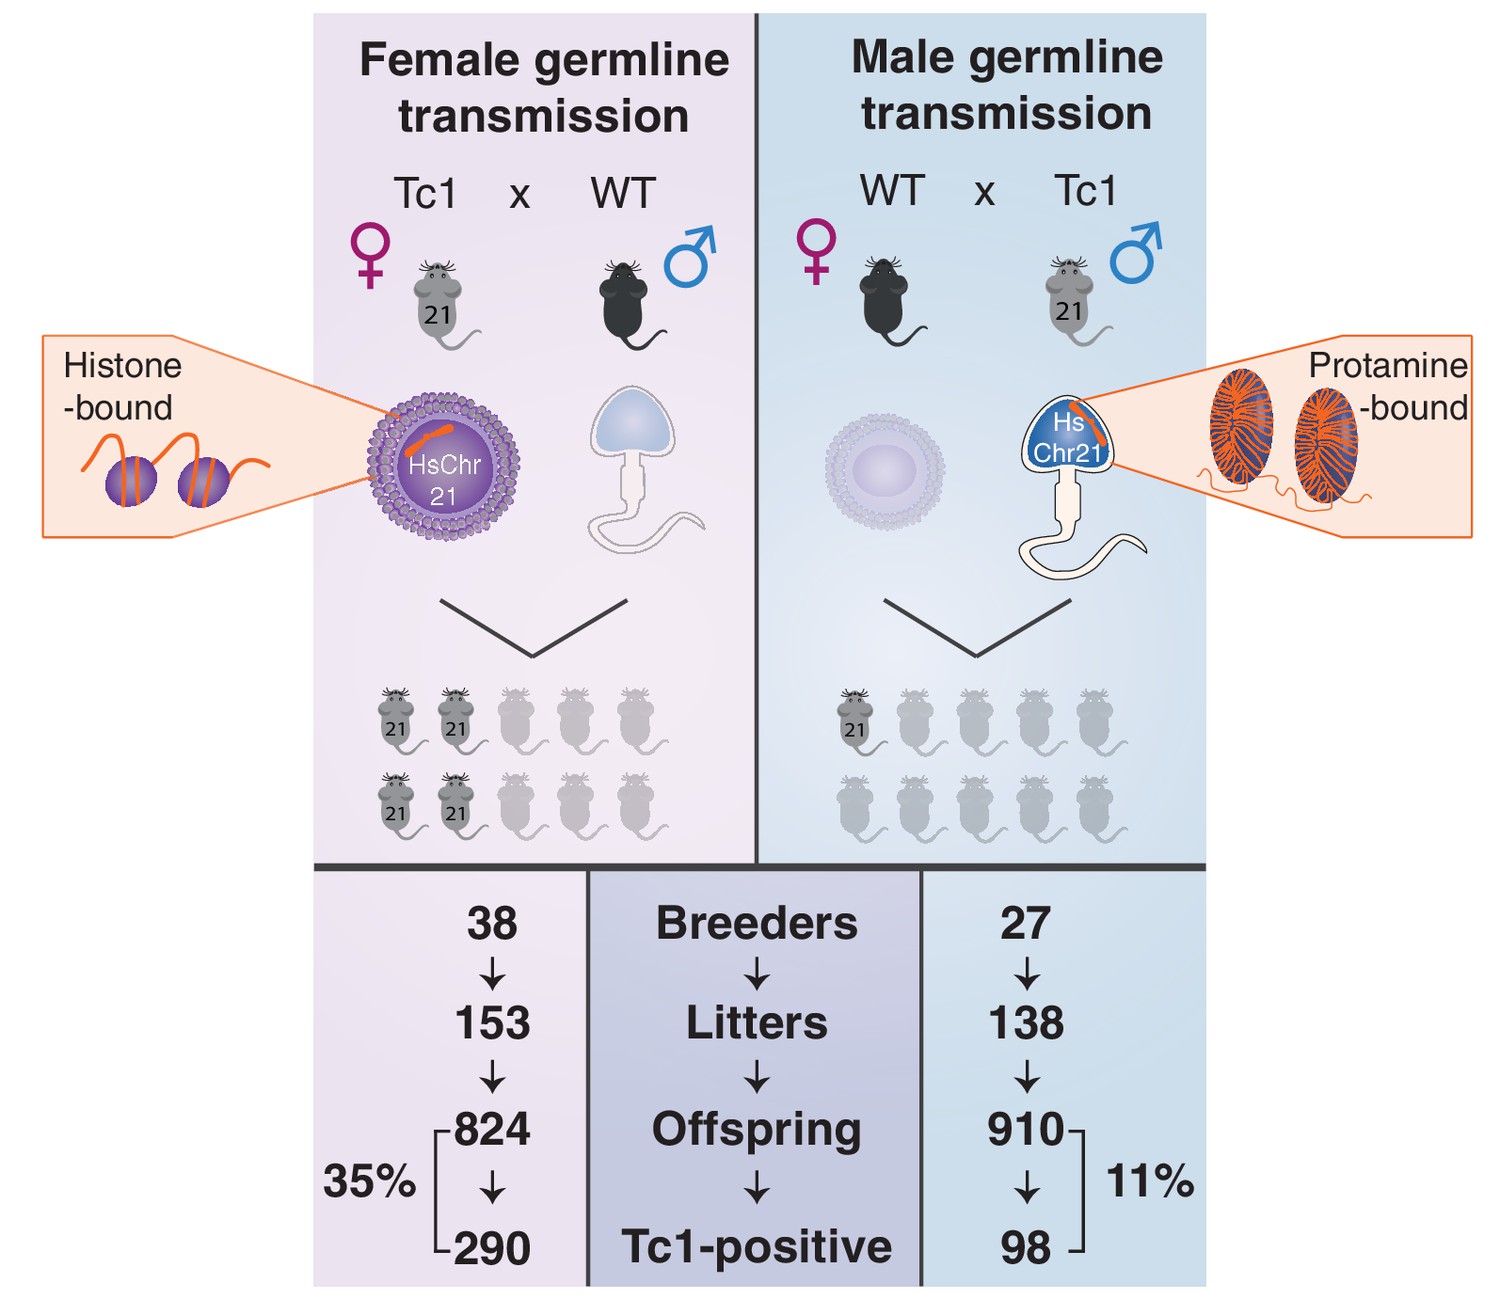
Male germline transmission of human chromosome 21 is a third as efficient as female germline transmission.
Oogenesis (left, top panel) can allow the transmission of epigenetic information deposited on retained maternal histones, whereas the majority of histones are replaced by protamines during spermatogenesis (right, top panel). Germline transmission of the full aneuploid chromosome HsChr21 was successful using male Tc1 mice as transmitters, but at a substantially reduced frequency compared with female transmission via eggs (11% versus 35%).
Figure 3—figure supplement 1
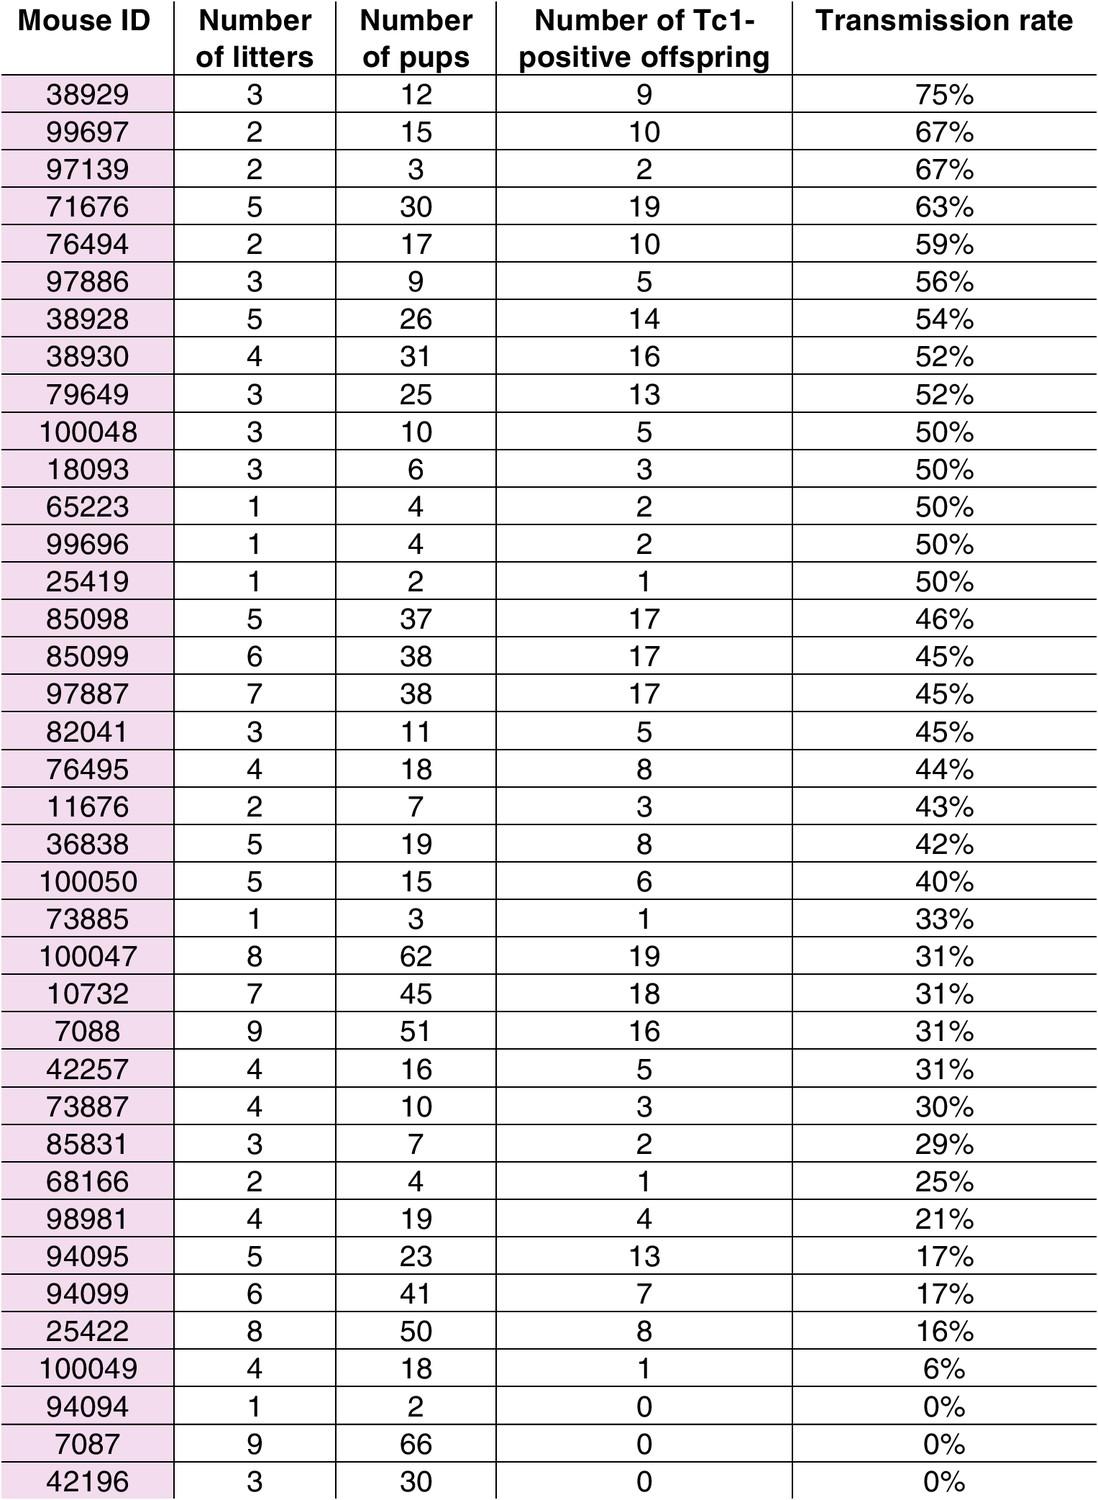
Transmission rates of aneuploid human chromosome 21 when passaged by the eggs of breeding Tc1-positive females.
https://doi.org/10.7554/eLife.20235.009
Figure 3—figure supplement 2
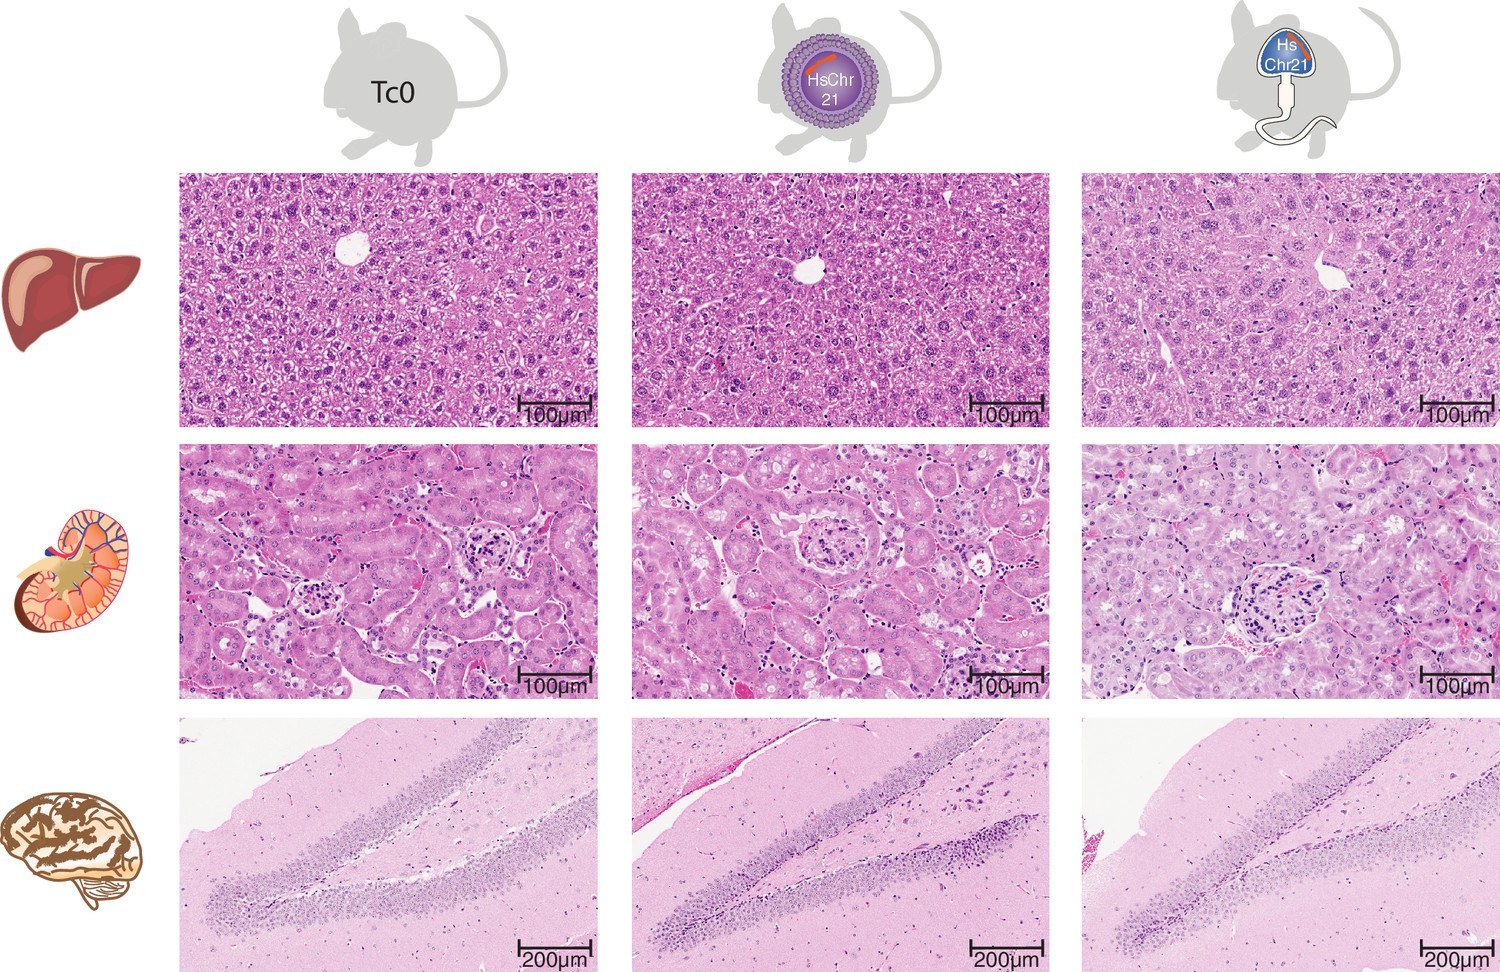
Histology across multiple somatic tissues in wild-type mice and female and male germline-derived Tc1 mice.
H and E stained tissue sections reveals no histological differences in hepatic nor renal tissue between female- and male-germline-derived offspring and wild-type mice (Original magnification 20x). Brain tissue sections demonstrated the previously described hippocampal phenotype associated with Down syndrome (Lorenzi and Reeves, 2006), notably reduced granule cells in the dentate gyrus, however there was no difference in severity between female and male germline-derived offspring (original magnification).
Figure 3—figure supplement 3
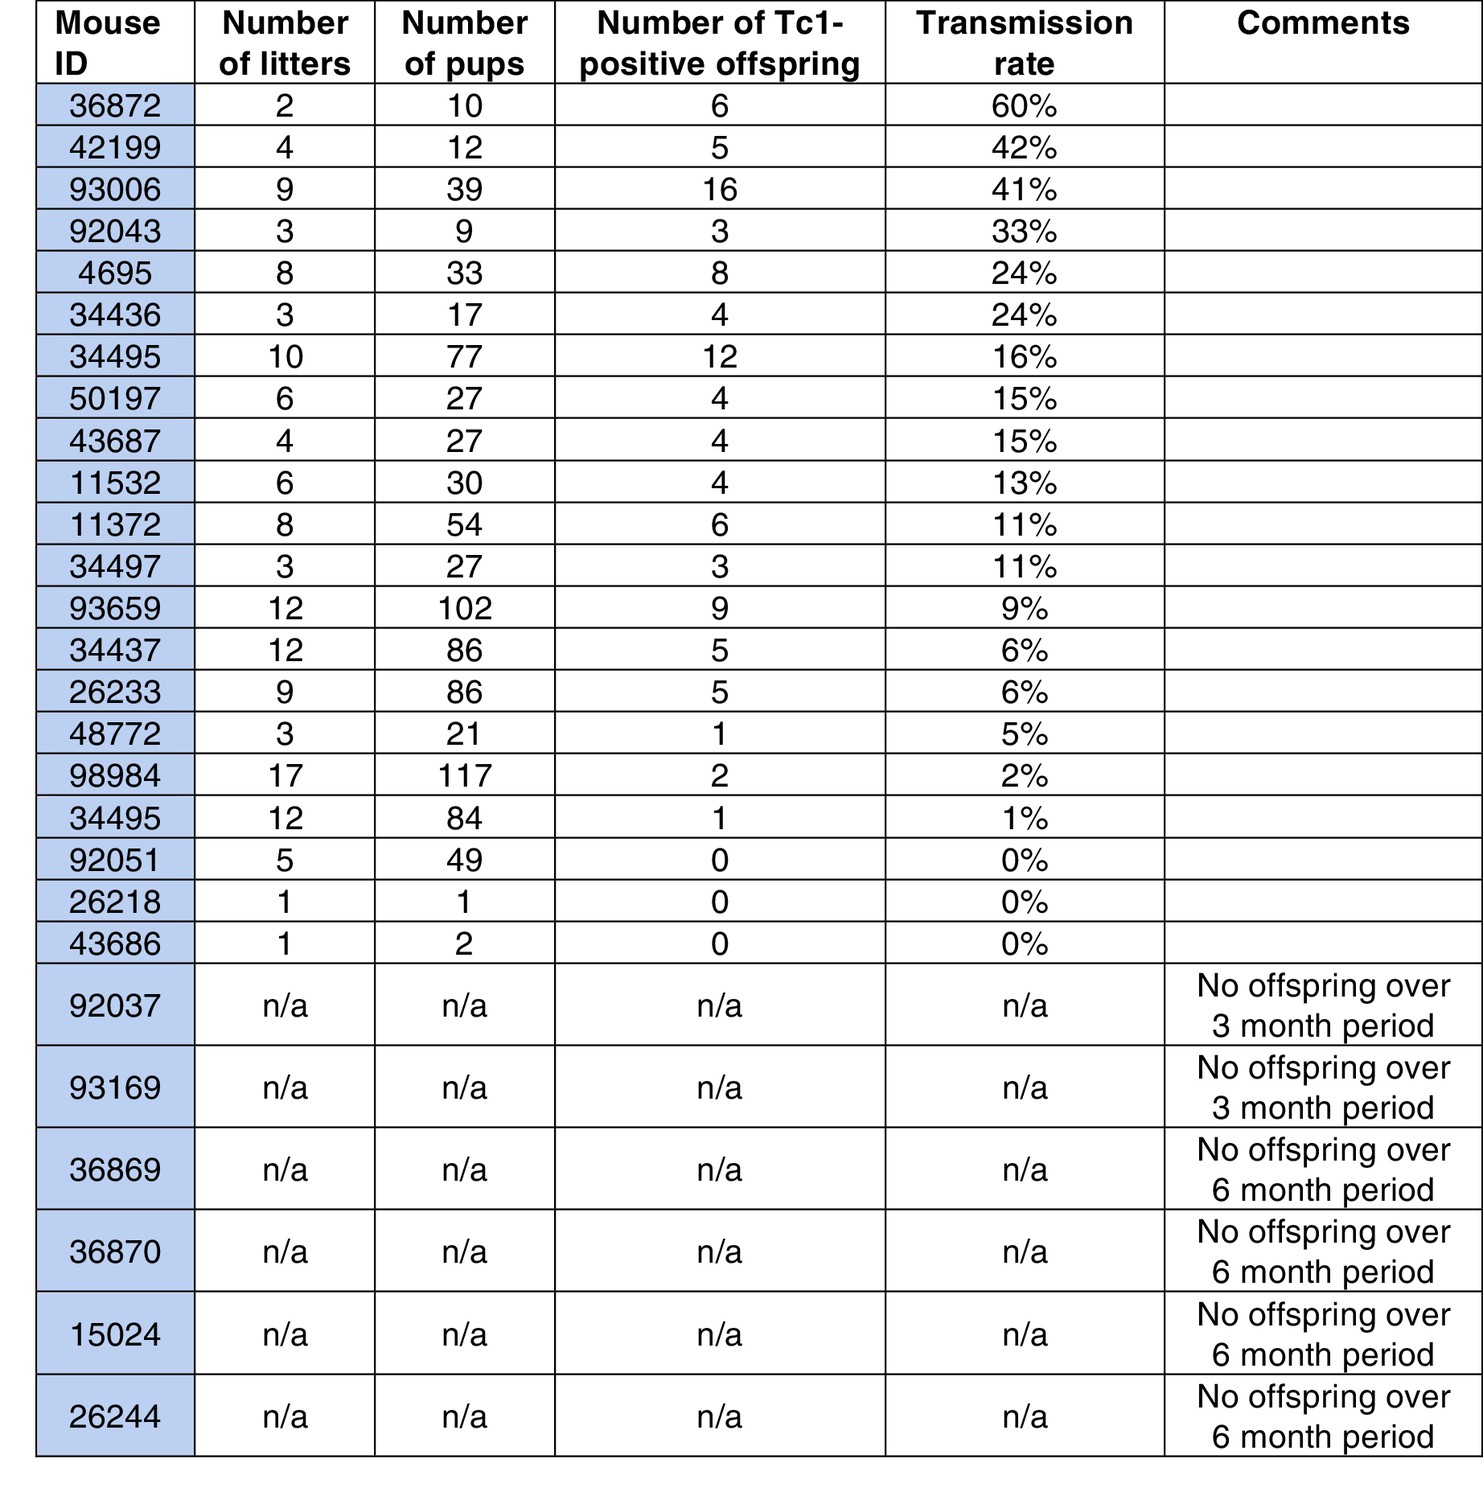
Transmission rates of aneuploid human chromosome 21 when passaged by the sperm of breeding Tc1-positive males.
https://doi.org/10.7554/eLife.20235.011
Figure 3—figure supplement 4
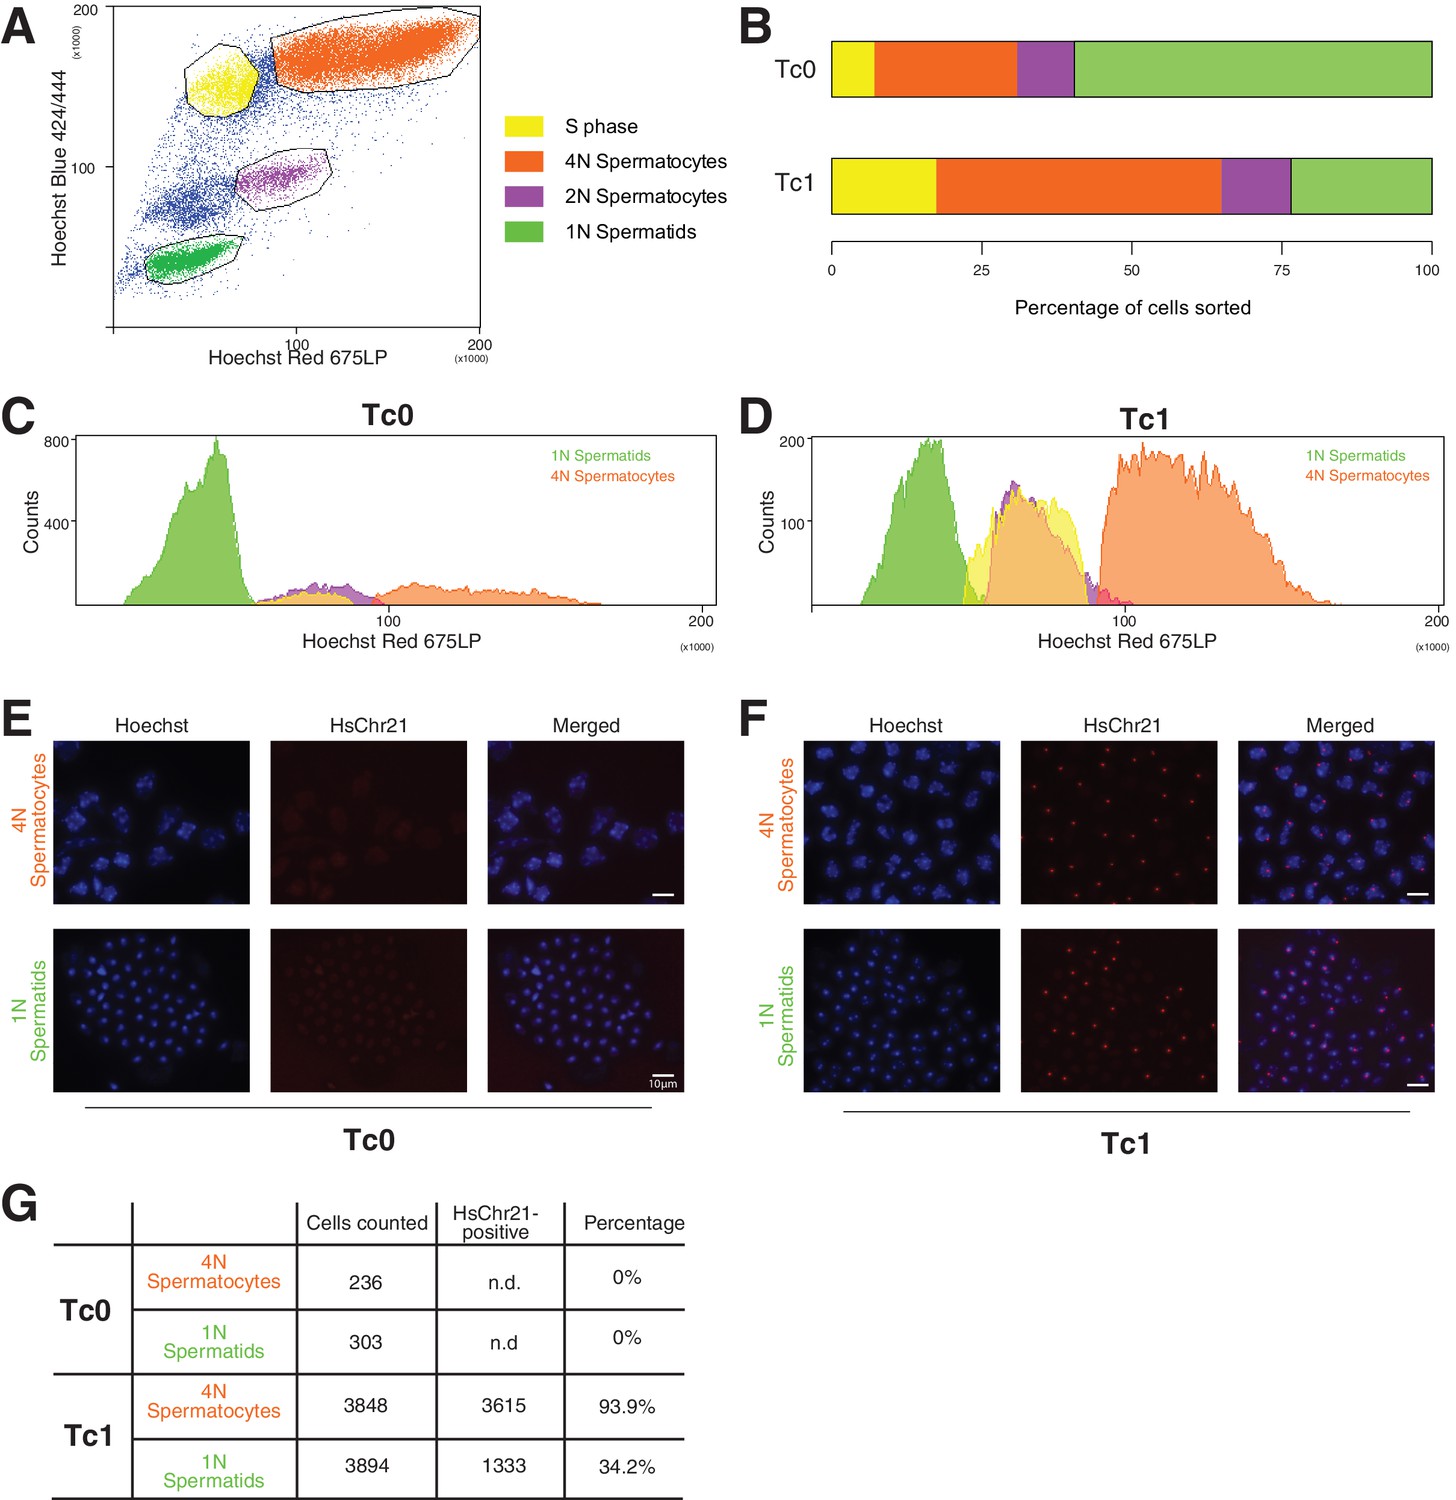
Genotyping of meiotic cells from Tc1 males showed a high percentage of aneuploid haploid cells.
(A) Cells were gated based on their Hoechst Red versus Hoechst Blue emission profile to distinguish spermatogonia (unmarked cell population), cells undergoing S phase (yellow), primary (4N) spermatocytes (orange), secondary spermatocytes (purple), haploid spermatids (green). (B–D) Tc1 males have a relative increase of primary spermatocytes and a decrease in haploid spermatids. (E–F) Fluorescent in-situ hybridization with human chromosome-21-specific probe in sorted cell populations. (G) Quantification of the percentage of cells stained positive for chromosome 21 in Tc1 animals. No specific signal was detected in Tc0 animals.
Figure 4 with 1 supplement
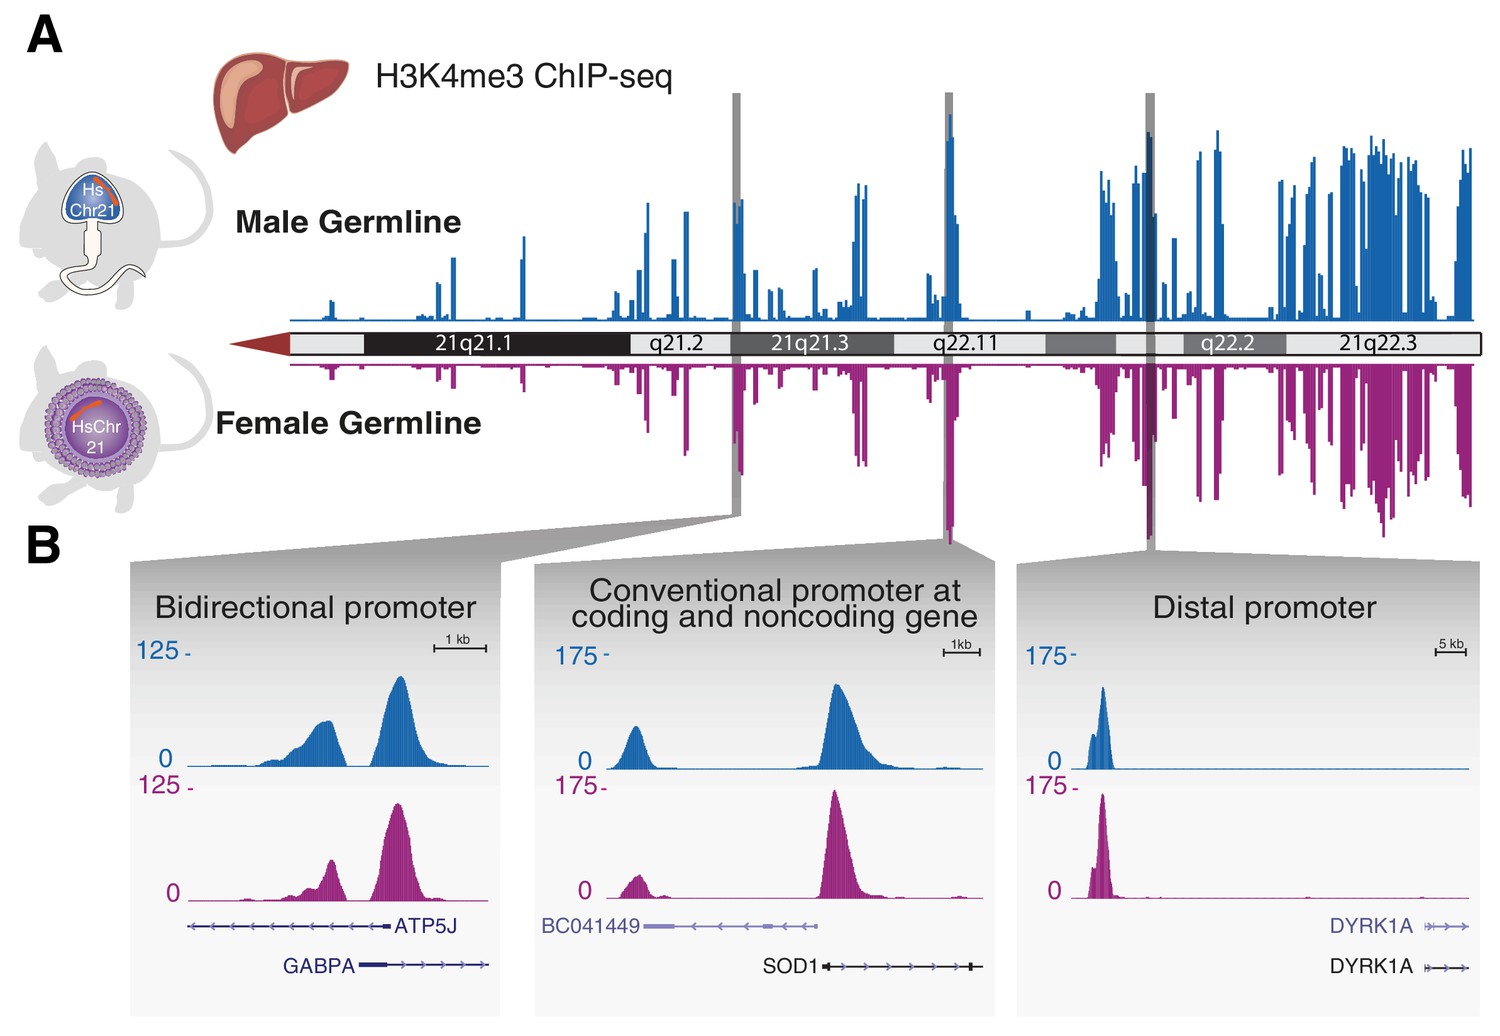
Transcription initiation across aneuploid human chromosome 21 in terminally differentiated liver is unaffected by the differing epigenetic handling during spermatogenesis or oogenesis.
(A) The occupancy of H3K4me3, which reports transcription initiation locations, is shown as an enrichment track across the q arm of human chromosome 21 from livers of Tc1 mice derived from aneuploid sperm (blue) or eggs (purple). (B) Transcription initiation patterns at diverse promoter types on human chromosome 21 are indistinguishable between male and female germline transmission.
Figure 4—figure supplement 1
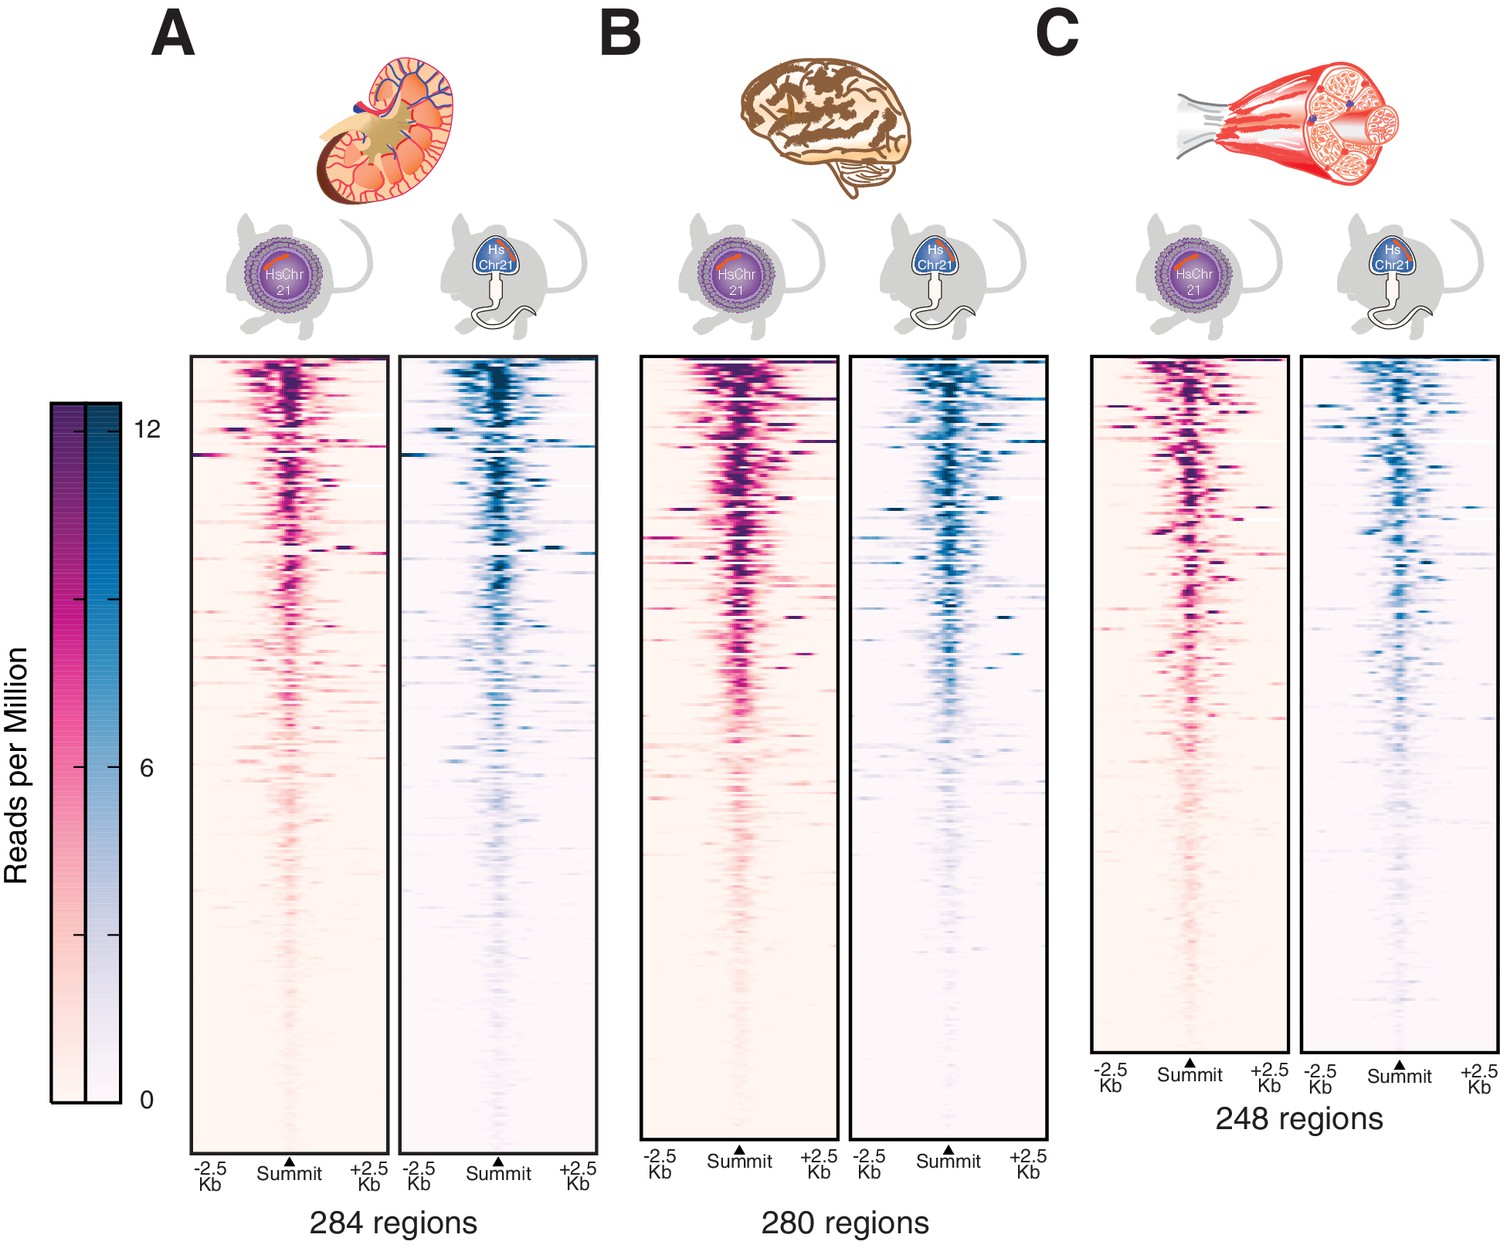
Transcription initiation is accurately established across multiple somatic tissues after male germline transmission.
H3K4me3 was profiled genome-wide as a marker for transcription initiation across multiple tissues including (A) kidney, (B) brain and (C) muscle. The active regions on human chromosome 21 are shown as heatmaps of ChIP-Seq intensities in reads per million with control reads subtracted. Each row represents a 5 kb window around a H3K4me3 peak summit, and regions are sorted by descending signal strength in tissues from the female germline passaged Tc1 mice.
Figure 5
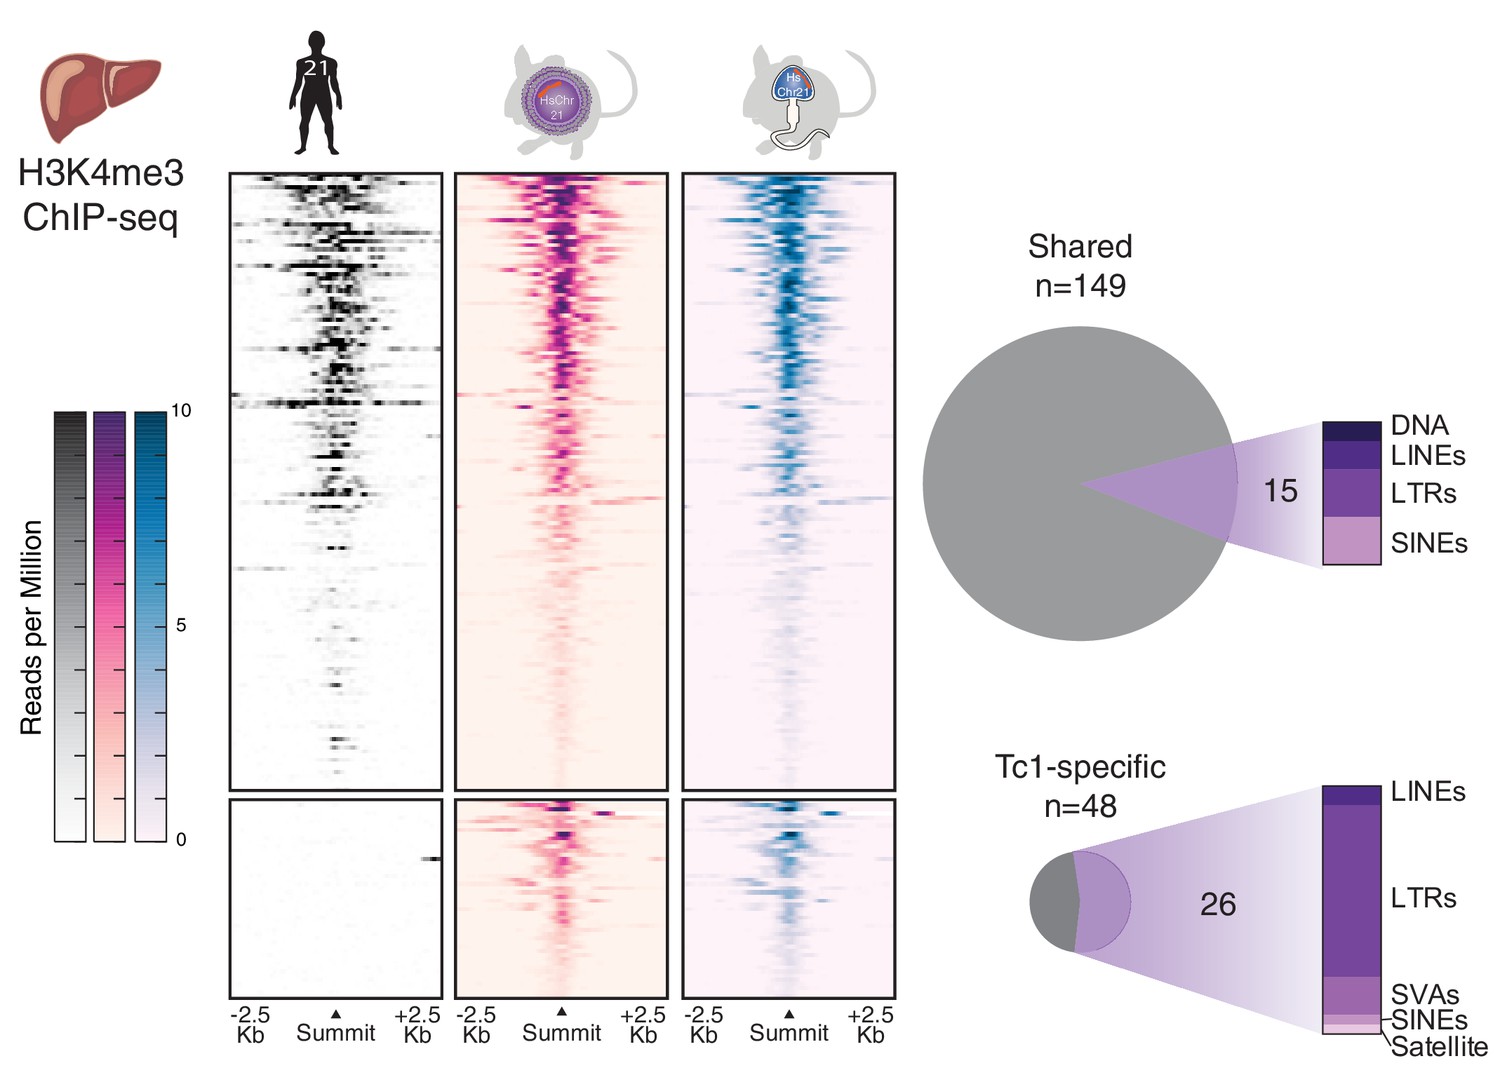
Comparison of transcription initiation between human and Tc1 mouse reveals that male germline passage does not unmask novel human repetitive elements in derived mouse somatic tissues.
Differential binding analysis of transcription initiation locations between human and Tc1 mouse liver reveals Tc1 mouse-specific sites, which were indistinguishable by germline passage. No entirely novel male-germline sites were identified. Regions in heatmaps are sorted by descending signal strength, each row representing a 5 kb window centered on H3K4me3 peak summits. More than half of the mouse-specific sites are found at human repetitive elements.
Figure 6 with 1 supplement
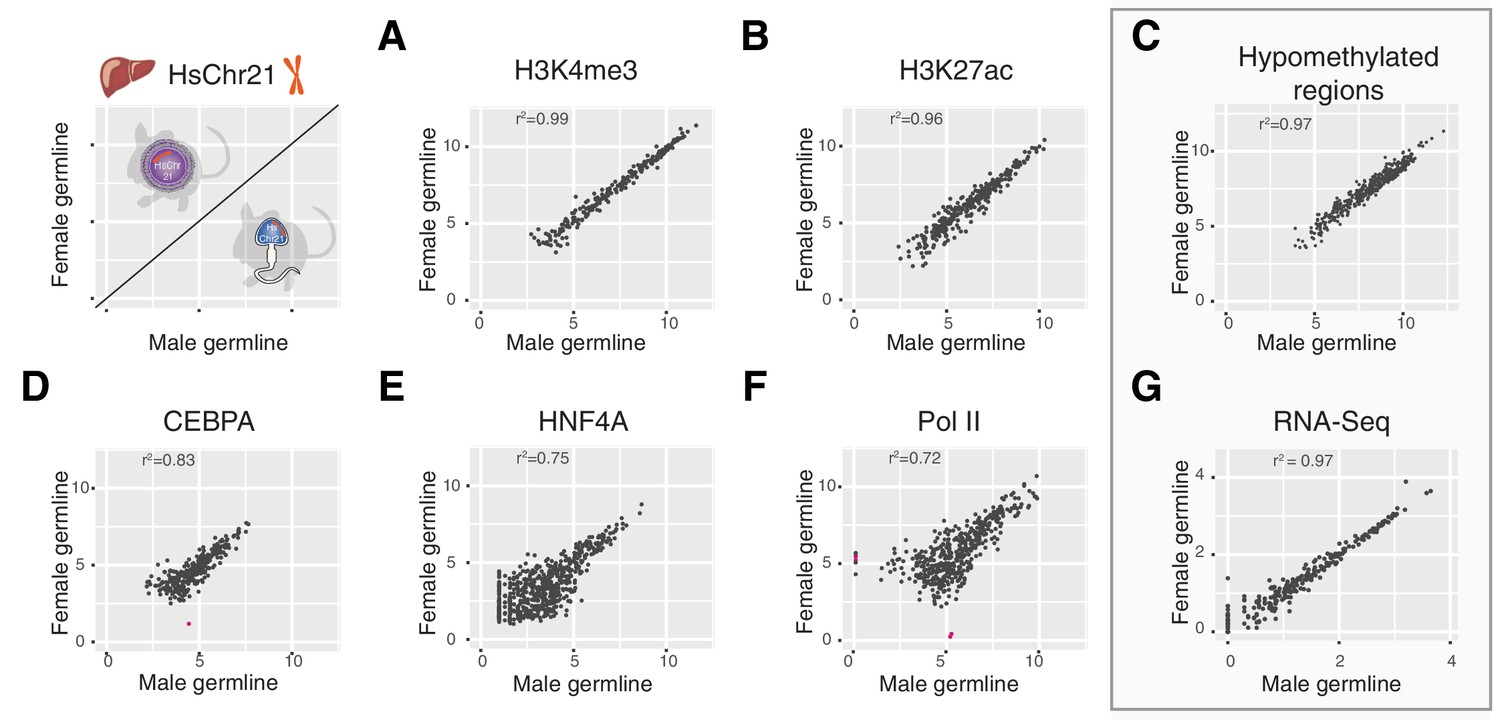
Multiple layers of transcription and transcriptional control across human chromosome 21 are indistinguishable between Tc1 mice whether derived from aneuploid eggs or sperm.
Comparison of ChIP-Seq mean read concentration (log2) across human chromosome 21 in livers of female and male germline transmitted offspring for (A) H3K4me3 (transcription initiation), (B) H3K27ac (enhancer activity), (D) CEBPA (tissue-specific transcription factor), (E) HNF4A (tissue-specific transcription factor) and (F) RNA polymerase II. Differentially bound sites are highlighted in pink (fold change >2.5, FDR <0.1). Pearson correlation was applied to analyse the correlation. (C) Comparison of genome hypomethylation patterns between male and female germline offspring profiled by BioCAP-sequencing (log2 read count). (G) Differential gene expression analysis of RNA-Seq in liver between male and female germline-derived offspring (log10 mean expression).
Figure 6—figure supplement 1
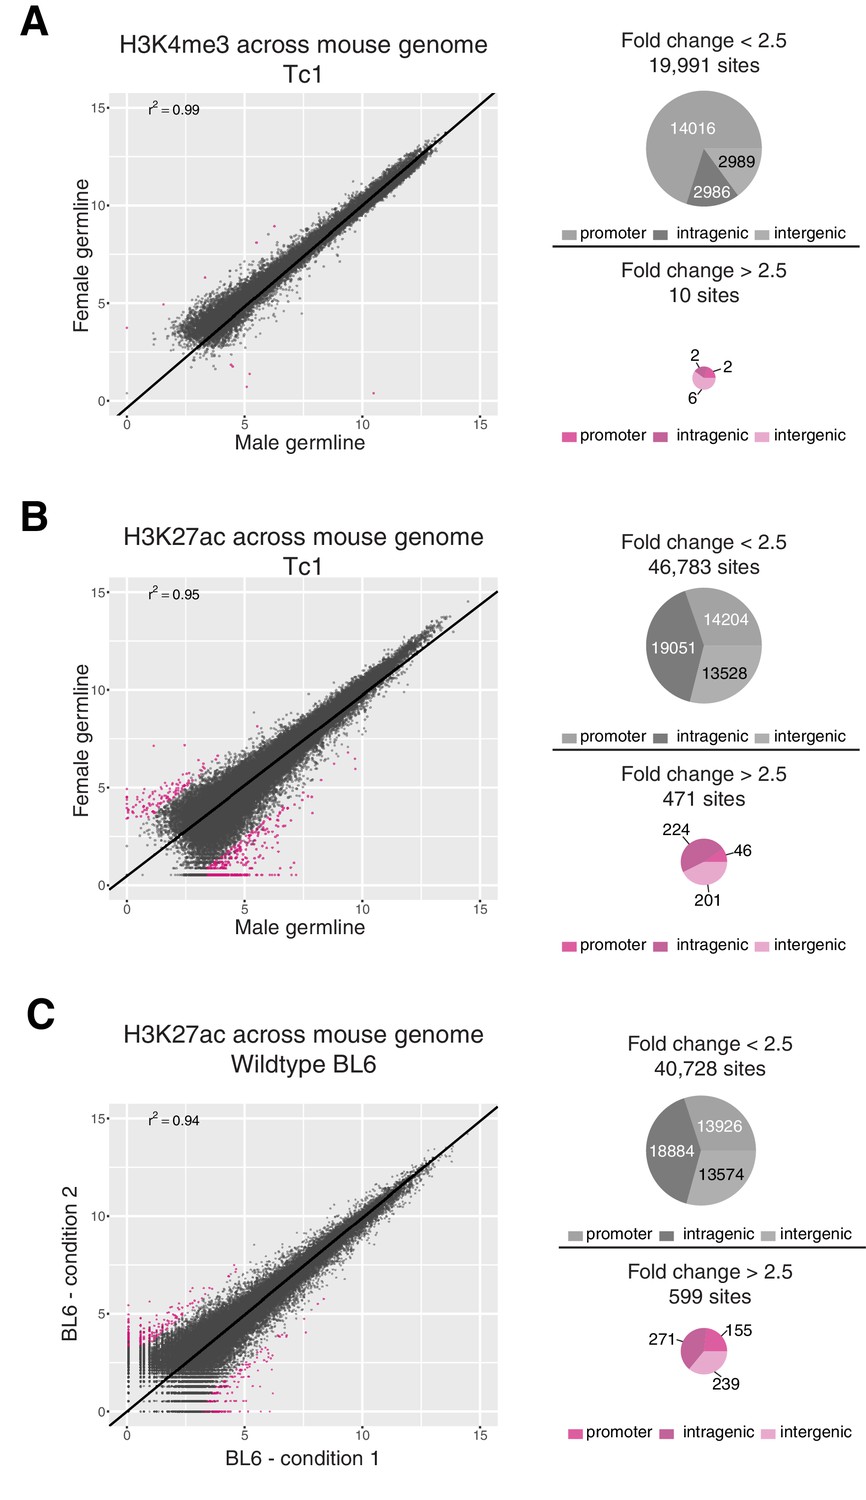
Differential binding analysis for H3K4me3 and H3K27ac across the mouse genome in Tc1 and BL6 mice.
Differential binding analysis (DBA) was performed across the entire mouse genome to estimate the level of technical noise to be expected for a given factor. Identified regions were annotated as promoter, intragenic, and intergenic using compEpiTools R-package (Kishore et al., 2015). (A) Only ten regions showed differences in H3K4me3 occupancy between female and male germline-derived Tc1 mice with a fold change greater than 2.5 (FDR < 0.1), all of which were low-intensity. (B) Across the entire mouse genome, 471 regions (~1% of the 47,000 total) enriched for H3K27ac showed differences between female and male germline-derived Tc1 mice with a fold change greater than 2.5. Most of these 471 regions showed higher signal intensity in male germline-derived offspring. (C) To estimate the expected background for ChIP assays, four biological replicates of H3K27ac in livers of BL6 wild-type mice were randomly assigned to two conditions to mirror the male-female germline experiment. Comparison of these two randomly assigned H3K27ac experiments identified 599 sites with a fold change greater than 2.5 (FDR <0.1) that were evenly distributed around the diagonal.
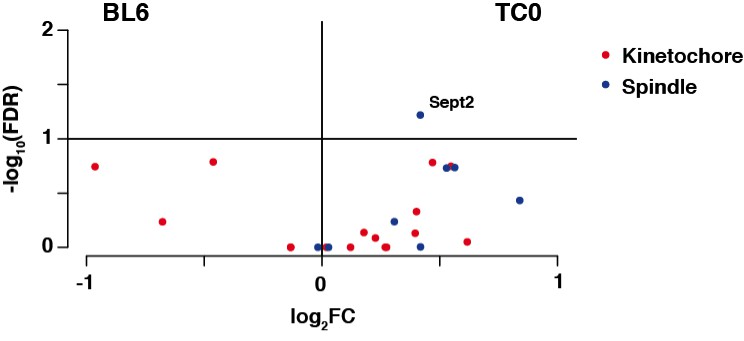
Author response image 1
Download links
A two-part list of links to download the article, or parts of the article, in various formats.
Downloads (link to download the article as PDF)
Open citations (links to open the citations from this article in various online reference manager services)
Cite this article (links to download the citations from this article in formats compatible with various reference manager tools)
Successful transmission and transcriptional deployment of a human chromosome via mouse male meiosis
eLife 5:e20235.
https://doi.org/10.7554/eLife.20235


