Radial glia regulate vascular patterning around the developing spinal cord
- Max Planck Institute for Heart and Lung Research, Germany
- University of Massachusetts Medical School, United States
- University of Muenster, Germany
- Max Planck Institute for Molecular Biomedicine, Germany
Figures
Figure 1 with 1 supplement

Physical proximity between the end-feet of spinal cord radial glia and extraneural vessels during development.
(A) Lateral view of a 154 hpf Tg(kdrl:ras-mcherry);TgBAC(gfap:gfap-EGFP) trunk. The region inside the dashed line corresponds to the 10 somites where all analyses and quantifications were performed. Scale bar, 200 µm. (B–B”) High magnification images of a Tg(kdrl:ras-mcherry);TgBAC(gfap:gfap-EGFP) trunk at 154 hpf. End-feet of radial glia and ISVs or VTAs are physically adjacent. ISVs: intersegmental vessels, VTAs: vertebral arteries. Scale bar, 100 µm. (C–C’) High magnification confocal single-plane images of 154 hpf Tg(kdrl:ras-mcherry);TgBAC(gfap:gfap-EGFP) trunk section counterstained with DAPI. Radial glia end-feet lie in close proximity to ISVs (C’). Scale bars, 20 µm. (D–D”) 60 hpf Tg(gfap:EGFP);TgBAC(gfap:gal4ff);Tg(UAS:mcherry-NTR) trunk spinal cord section. EGFP+ radial glia and mCherry+ cells are largely co-localized. Scale bar, 20 µm. (E–E”) 60 hpf TgBAC(gfap:gal4ff);Tg(UAS:mcherry-NTR) trunk spinal cord section immunostained for HuC/HuD (green). EGFP+ neurons and mCherry+ cells are largely segregated. Scale bar, 20 µm. (F) Time course of nitroreductase (NTR)/metronidazole (Mtz)-mediated cell ablation of radial glia for the panels (G–I”). (G) 30 hpf TgBAC(gfap:gfap-EGFP);TgBAC(gfap:gal4ff);Tg(UAS:mcherry-NTR) trunk. TgBAC(gfap:Gfap-EGFP) expression and TgBAC(gfap:gal4ff);Tg(UAS:mCherry-NTR) expression are observed in the spinal cord in an overlapping manner. SC: spinal cord. Scale bar, 100 µm. (H–H” and I–I”) 82 hpf TgBAC(gfap:gfap-EGFP);TgBAC(gfap:gal4ff);Tg(UAS:mcherry-NTR) trunk after treatment with DMSO (H–H”) or 2 mM Mtz (I–I”) starting at 30 hpf. Unlike DMSO-treated fish that show strong co-expression of TgBAC(gfap:Gfap-EGFP) and TgBAC(gfap:gal4ff);Tg(UAS:mCherry-NTR) in their spinal cord, Mtz-treated fish show a dramatic reduction of this co-expression. Scale bar, 100 µm.
Figure 1—figure supplement 1
Characterization of radial glia or neuronal ablation by the NTR/Mtz-mediated cell ablation method.
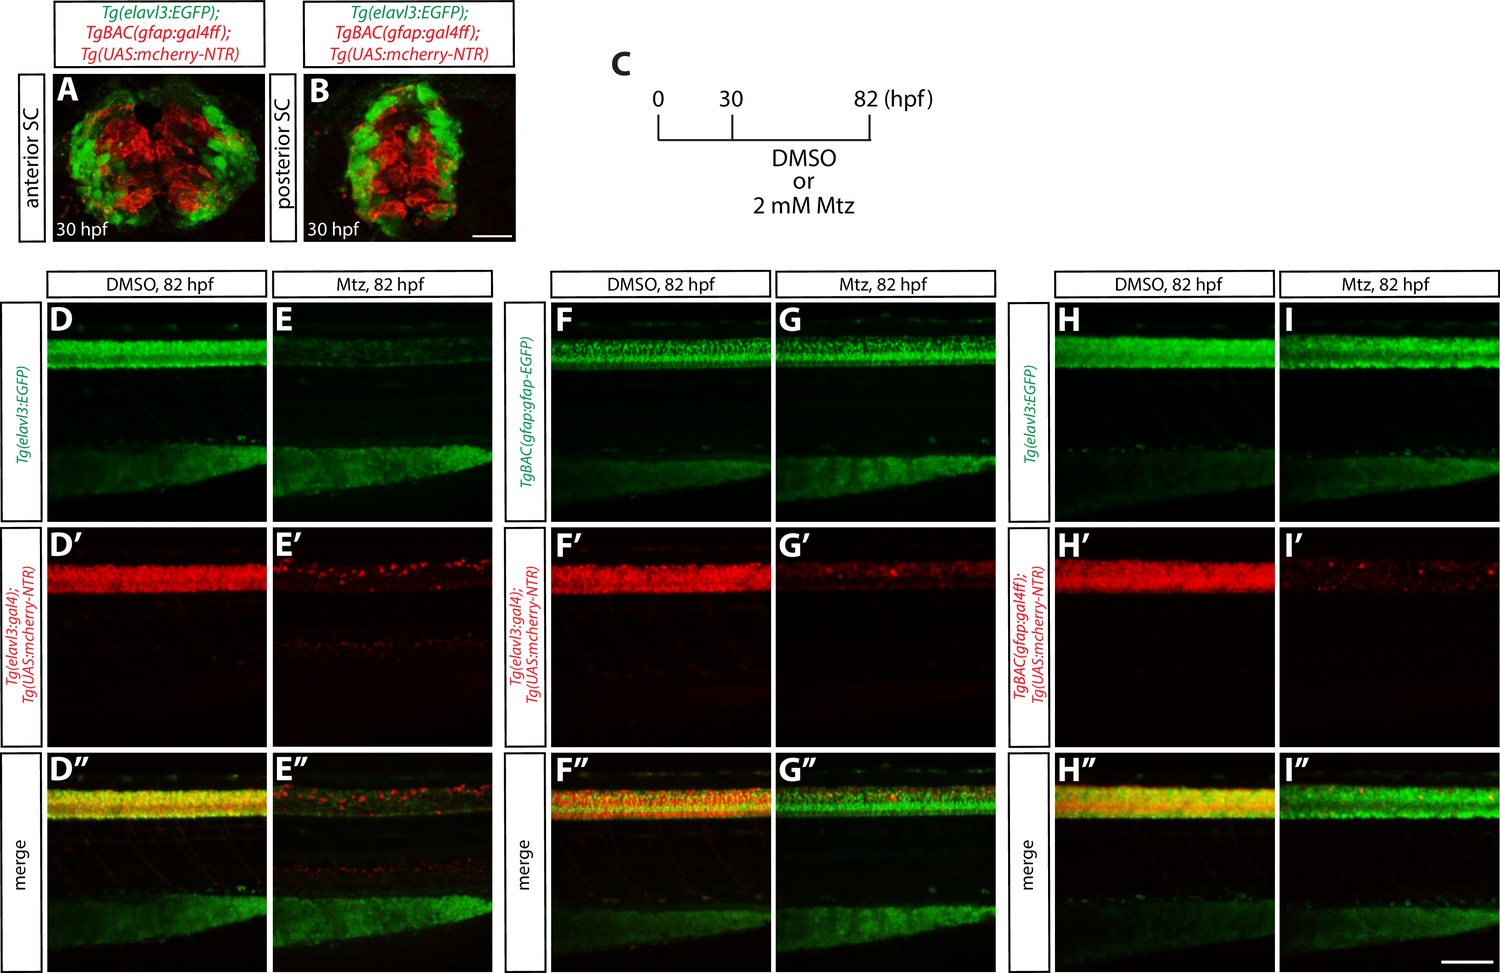
(A and B) 30 hpf Tg(elavl3:EGFP);TgBAC(gfap:gal4ff);Tg(UAS:mcherry-NTR) trunk sections at the level of the anterior (A) or posterior (B) SC. EGFP+ neurons and mCherry+ radial glia are largely segregated. Scale bar, 20 µm. (C) Experimental time course of NTR/Mtz-mediated ablation for the panels (D–I”). (D–D” and E–E”) 82 hpf Tg(elavl3:EGFP);Tg(elavl3:gal4);Tg(UAS:mcherry-NTR) trunks after treatment with DMSO (D–D”) or 2 mM Mtz (E–E”) starting at 30 hpf. Unlike DMSO-treated fish that show strong co-expression of Tg(elavl3:EGFP) and Tg(elavl3:gal4);Tg(UAS:mCherry-NTR) in their spinal cord, Mtz-treated fish show a dramatic reduction of this co-expression. (F–F” and G–G”) 82 hpf TgBAC(gfap:gfap-EGFP);Tg(elavl3:gal4);Tg(UAS:mcherry-NTR) trunks after treatment with DMSO (F–F”) or 2 mM Mtz (G–G”) starting at 30 hpf. Mtz-treated fish show a dramatic reduction of Tg(elavl3:gal4);Tg(UAS:mCherry-NTR) expression in their spinal cord, however, TgBAC(gfap:Gfap-EGFP) expression appears unaffected as compared to DMSO-treated fish. (H–H” and I–I”) 82 hpf Tg(elavl3:EGFP);TgBAC(gfap:gal4ff);Tg(UAS:mcherry-NTR) trunks after treatment with DMSO (H–H”) or 2 mM Mtz (I–I”) starting at 30 hpf. Mtz-treated fish show a dramatic reduction of TgBAC(gfap:gal4ff);Tg(UAS:mCherry-NTR) expression in their spinal cord, and Tg(elavl3:EGFP) expression is also slightly reduced as compared to DMSO-treated fish that show strong expression of both TgBAC(gfap:gal4ff);Tg(UAS:mCherry-NTR) and Tg(elavl3:EGFP) expression in their spinal cord. Scale bar, 100 µm.
Figure 2 with 1 supplement
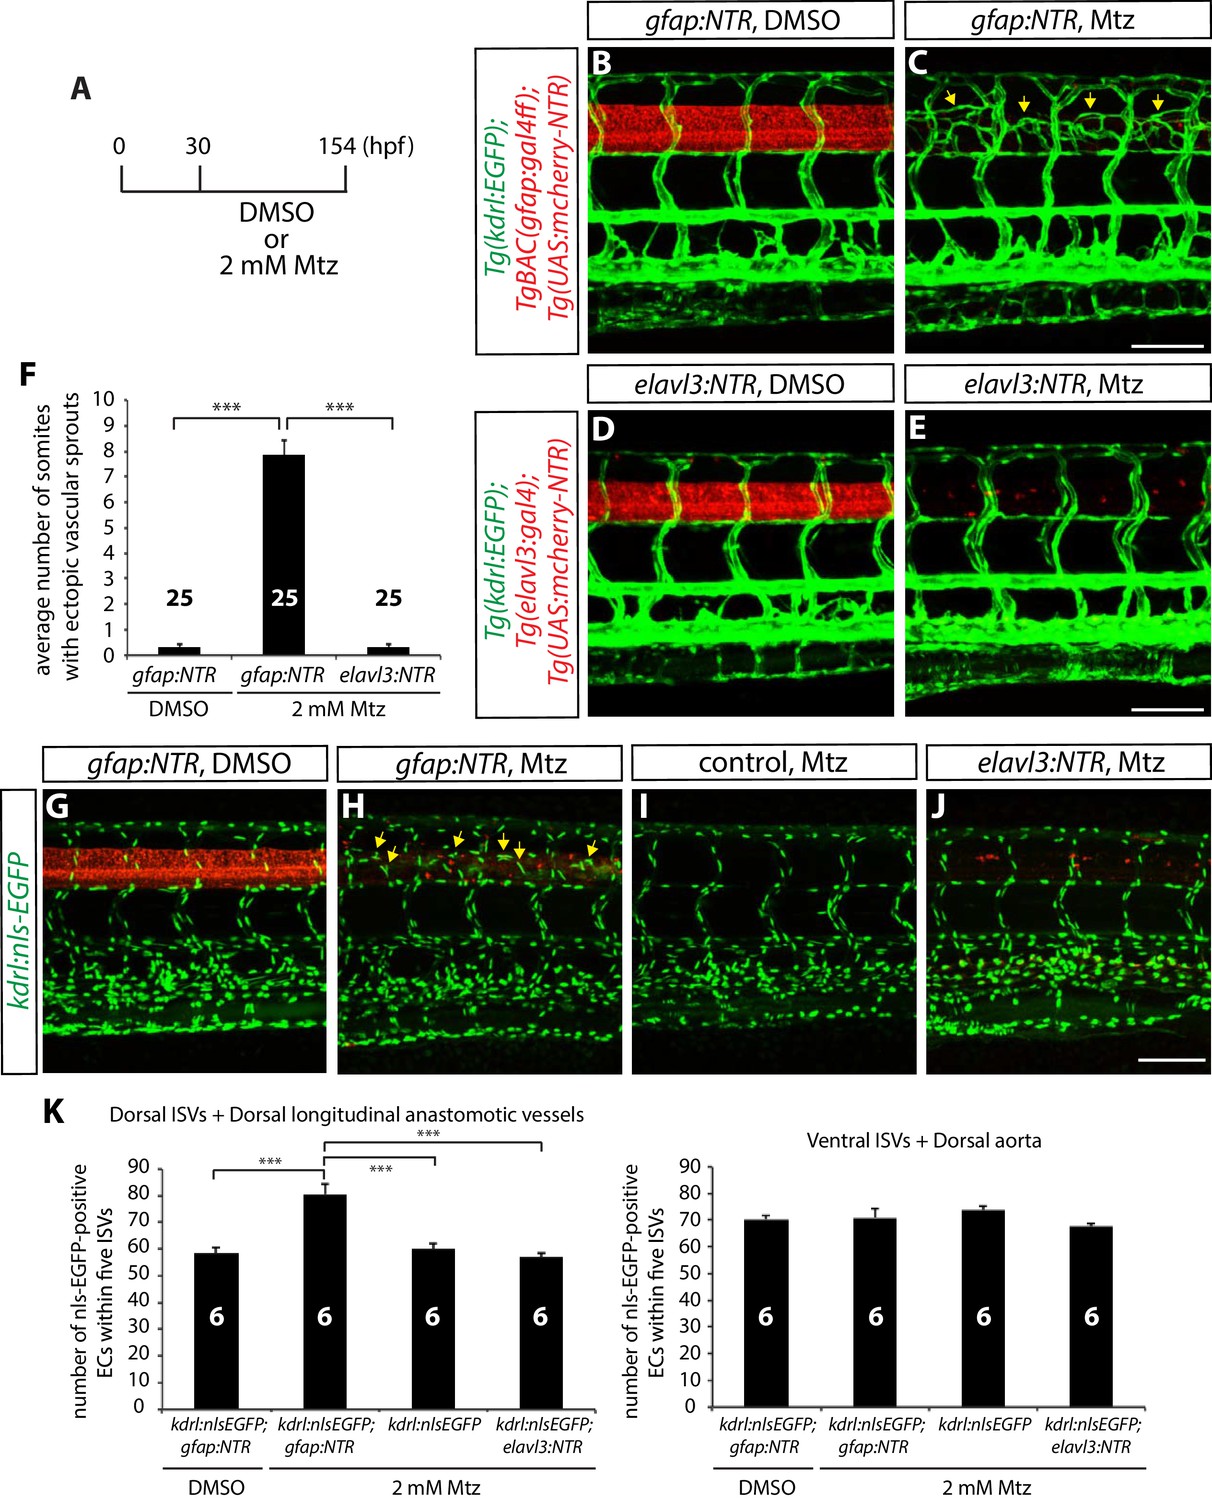
Genetic ablation of CNS radial glia in embryos leads to excessive sprouting and an increased number of dorsal trunk vascular ECs around the spinal cord.
(A) Experimental time course for the panels (B–F). (B–E) 154 hpf TgBAC(gfap:gal4ff);Tg(UAS:mcherry-NTR);Tg(kdrl:EGFP) (B and C) and Tg(elavl3:gal4);Tg(UAS:mcherry-NTR);Tg(kdrl:EGFP) (D and E) trunks after treatment with DMSO (B and D) or 2 mM Mtz (C and E) between 30 and 154 hpf. Genetic ablation of radial glia, but not of neurons, leads to ectopic vessel sprouting in the dorsal part of the trunk (yellow arrows, C). Scale bars, 100 µm. (F) Quantification of average number of somites that showed ectopic blood vessels (10 somites examined per animal; 25 animals examined per condition). This quantification was performed at 154 hpf; fish after radial glia ablation show a dramatic increase in the number of somites with ectopic blood vessels. (G–J) 154 hpf TgBAC(gfap:gal4ff);Tg(UAS:mcherry-NTR);Tg(kdrl:nls-EGFP) (G and H), Tg(kdrl:nls-EGFP) (I) and Tg(elavl3:gal4);Tg(UAS:mcherry-NTR);Tg(kdrl:nls-EGFP) (J) trunks after treatment with DMSO (G) or 2 mM Mtz (H–J) between 30 and 154 hpf. Radial glia-ablated fish show ectopic ECs in the dorsal part of the trunk (yellow arrows, H). Scale bar, 100 µm. (K) Quantification of nls-EGFP+ EC number within 5 ISVs (6 animals examined per condition). Radial glia ablation leads to an approximately 30% increase in EC number in the dorsal part of the trunk (left panel), whereas no significant differences in EC number were observed in the ventral part of the trunk (right panel). See also Figure 2—source data 1 for quantification. In all panels, values represent means ± SEM (*** indicates p<0.001 by one-way analysis of variance (ANOVA) followed by Tukey’s HSD test).
-
Figure 2—source data 1
Quantification of EC number in the dorsal and ventral part of trunks.
Animals were treated with DMSO or 2 mM Mtz between 30 and 154 hpf, and quantification was performed at 154 hpf (6 animals examined per condition). The number of ECs was counted in the dorsal part of trunks, including the dorsal ISVs, the VTAs, and the DLAVs. The number of ECs was counted in the ventral part of trunks, including the ventral ISVs and the DA.
- https://doi.org/10.7554/eLife.20253.006
Figure 2—figure supplement 1

Microglia, macrophages, pericytes, and/or neutrophils do not modulate trunk vascular patterning.
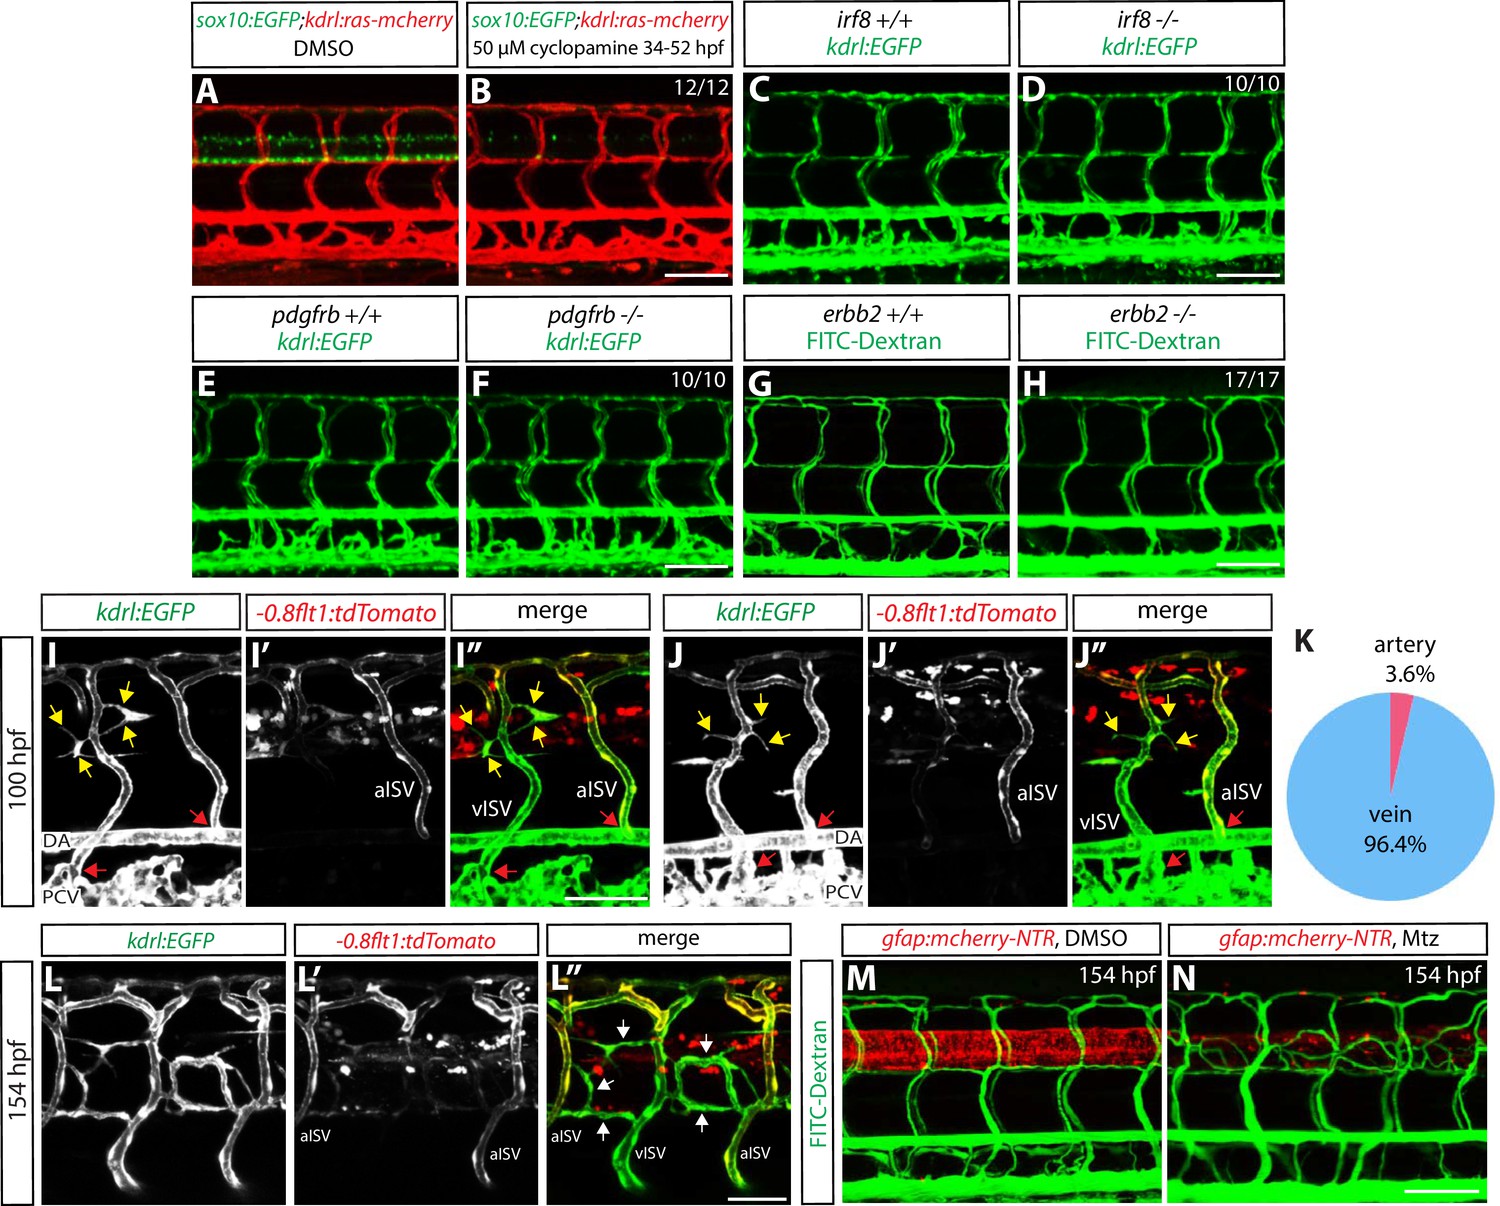
(A–C) 154 hpf TgBAC(gfap:gal4ff);Tg(UAS:mcherry-NTR);Tg(kdrl:EGFP) irf8+/+ (A), irf8+/- (B), and irf8-/- (C) trunk vasculature visualized by Tg(kdrl:EGFP) expression. Animals were treated with 2 mM Mtz between 30 and 54 hpf. Ectopic vessels after radial glial ablation emerge similarly in irf8+/+, irf8+/-, and irf8-/- fish. Scale bar, 100 µm. (D) Quantification of average number of somites that showed ectopic blood vessels in irf8+/+, irf8+/-, and irf8-/- larvae (10 somites examined per animal; ≥12 animals examined per genotype). (E–G) 154 hpf TgBAC(gfap:gal4ff);Tg(UAS:mcherry-NTR);Tg(kdrl:EGFP) pdgfrb+/+ (E), pdgfrb+/- (F), and pdgfrb-/- (G) trunk vasculature visualized by Tg(kdrl:EGFP) expression. Animals were treated with 2 mM Mtz between 30 and 54 hpf. Ectopic vessels after radial glial ablation emerge similarly in pdgfrb+/+, pdgfrb+/-, and pdgfrb-/- fish. Scale bar, 100 µm. (H) Quantification of average number of somites that showed ectopic blood vessels in pdgfrb+/+, pdgfrb+/-, and pdgfrb-/- larvae (10 somites examined per animal; ≥11 animals examined per genotype). (I and J) 154 hpf TgBAC(gfap:gal4ff);Tg(UAS:mcherry-NTR);Tg(kdrl:EGFP) (I) and TgBAC(gfap:gal4ff);Tg(UAS:mcherry-NTR);Tg(kdrl:EGFP);Tg(mpx:gal4) (J) trunk vasculature visualized by Tg(kdrl:EGFP) expression. Animals were treated with 2 mM Mtz between 30 hpf and 154 hpf. Ectopic vessels after radial glial ablation emerge similarly in fish with or without the mpx:gal4 transgene. Scale bar, 100 µm. (K) Quantification of average number of somites that showed ectopic blood vessels in fish with or without the mpx:gal4 transgene (10 somites examined per animal; ≥17 animals examined per condition). In all panels, values represent means ± SEM.
Figure 3 with 2 supplements
Genetic ablation of CNS radial glia leads to selective over-sprouting of venous ISVs, and ablation of other CNS or PNS cell types does not cause this phenotype.
(A and B) 154 hpf Tg(sox10:EGFP);Tg(kdrl:ras-mcherry) trunks after treatment with DMSO (A) or 50 µM cyclopamine (B) between 34 and 52 hpf. The ectopic ISV sprouting phenotype observed after radial glia ablation is not found in fish treated with cyclopamine, which show a dramatically reduced number of spinal cord oligodendrocytes and oligodendrocyte precursor cells. Scale bar, 100 µm. (C and D) 154 hpf Tg(kdrl:EGFP) irf8+/+ (C) and irf8-/- (D) trunk vasculature. The ectopic ISV sprouting phenotype observed after radial glia ablation is not seen in irf8-/- fish. Scale bar, 100 µm. (E and F) 154 hpf Tg(kdrl:EGFP) pdgfrb+/+ (E) and pdgfrb-/- (F) trunk vasculature. The ectopic ISV sprouting phenotype observed after radial glia ablation is not seen in pdgfrb-/- fish. Scale bar, 100 µm. (G and H) 154 hpf erbb2+/+ (G) and erbb2-/- (H) trunk vasculature visualized by FITC-dextran microangiography. The ectopic ISV sprouting phenotype observed after radial glia ablation is not seen in erbb2-/- fish. Scale bar, 100 µm. (I–I” and J–J”) 100 hpf TgBAC(gfap:gal4ff);Tg(UAS:mcherry-NTR);Tg(kdrl:EGFP);Tg(-0.8flt1:tdTomato) fish that were treated with 2 mM Mtz starting at 30 hpf. Tg(-0.8flt1:tdTomato) expression labels arterial ISVs strongly and venous ISVs weakly (I’ and J’), and ectopic vessel sprouts after radial glia ablation derive from venous ISVs in most cases (yellow arrows). Red arrows point to ISVs’ connection sites with their axial vessels, namely the dorsal aorta (DA) and posterior cardinal vein (PCV), confirming the identity of aISVs and vISVs as revealed by the differential Tg(-0.8flt1:tdTomato) expression in these vessels. Scale bar, 50 µm. (K) Quantification after radial glia ablation of ectopic sprouts that derive from aISVs or vISVs at 100 hpf. A vast majority of the ectopic sprouts derive from vISVs (106 out of 110 ectopic sprouts derived from vISVs in 17 fish). (L–L”) High magnification images of a 154 hpf TgBAC(gfap:gal4ff);Tg(UAS:mcherry-NTR);Tg(kdrl:EGFP);Tg(-0.8flt1:tdTomato) trunk after radial glia ablation. The animal was treated with 2 mM Mtz between 30 and 154 hpf. Ectopic vessels in the dorsal trunk after radial glia ablation exhibit weak Tg(-0.8flt1:tdTomato) expression as vISVs do (white arrows, L”). Scale bar, 50 µm. (M and N) 154 hpf TgBAC(gfap:gal4ff);Tg(UAS:mcherry-NTR) larvae that were injected with FITC-Dextran nanocrystals. Animals were treated with DMSO (M) or 2 mM Mtz (N) between 30 and 154 hpf, and then injected with FITC-Dextran nanocrystals at 154 hpf. FITC-dextran nanocrystals that were injected into the common cardinal vein circulated and labeled the trunk vasculature as shown in the DMSO-treated larva (M). Ectopic blood vessels that emerged after radial glia ablation were labelled by FITC-dextran nanocrystals (N), showing that these ectopic vessels are part of the circulatory loop. Scale bar, 100 µm.
Figure 3—figure supplement 1
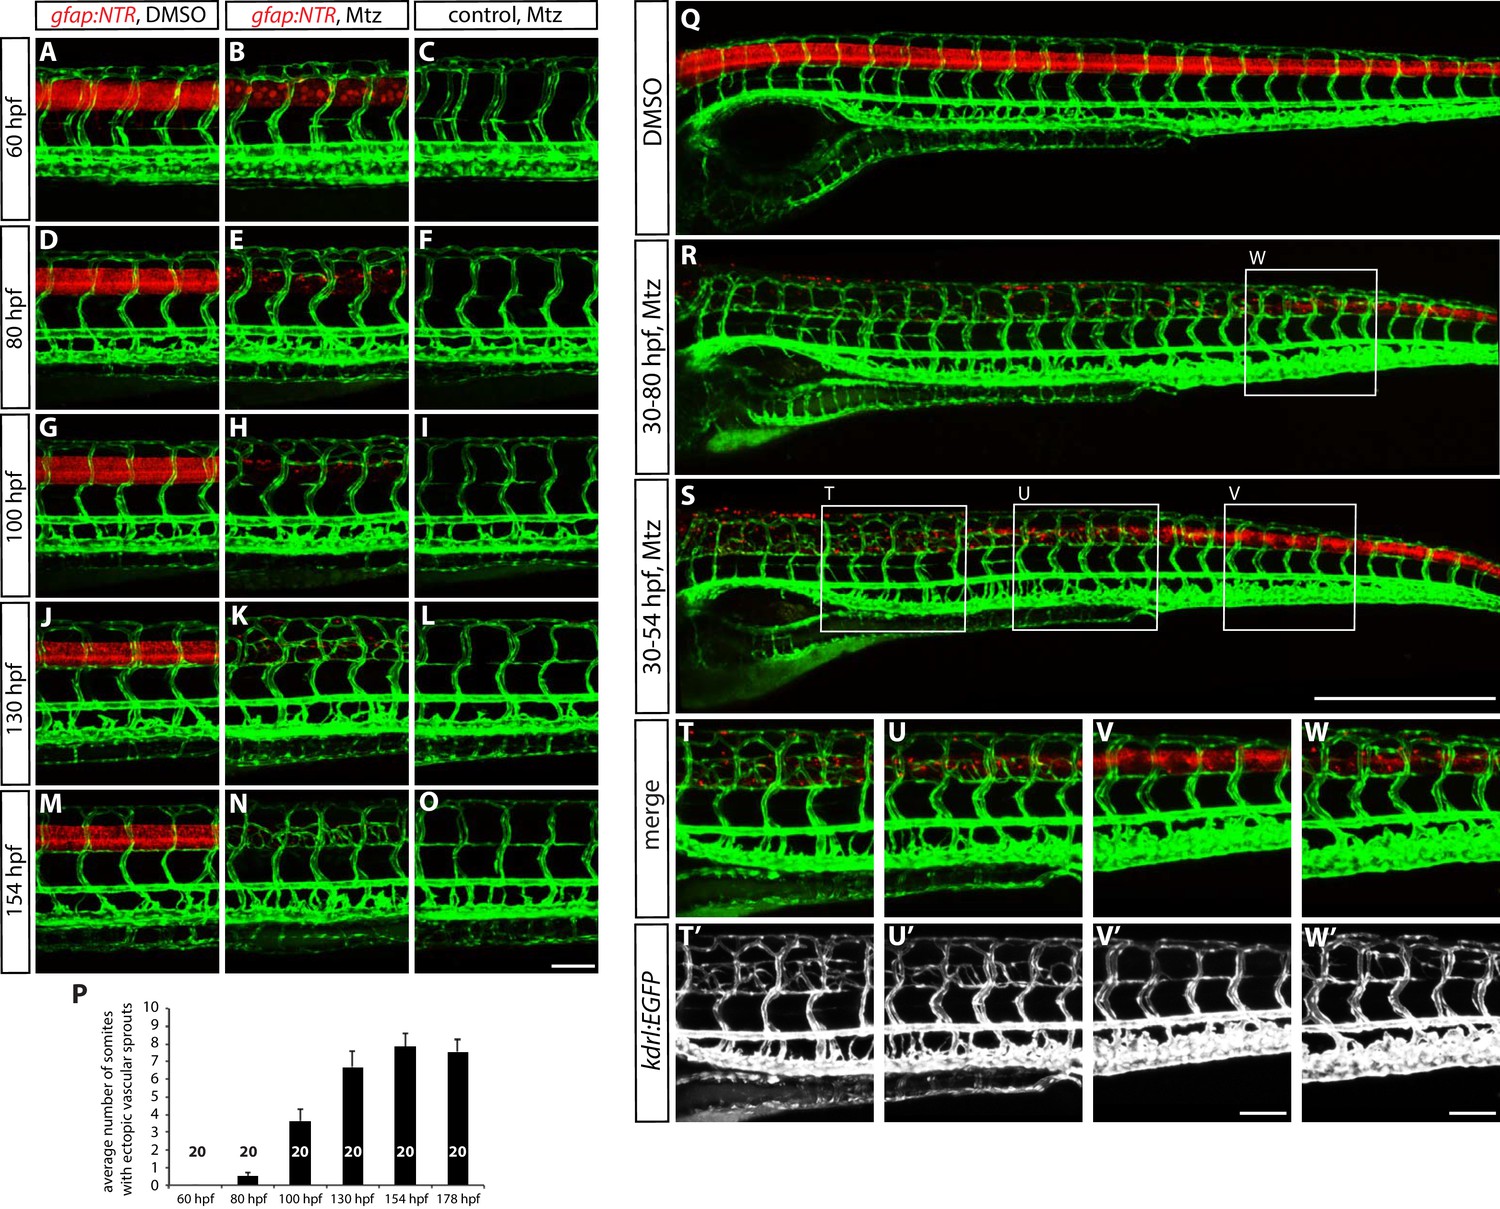
The time course of ectopic blood vessel growth after radial glia ablation, and the emergence of ectopic blood vessels in the trunk regions where radial glia are robustly ablated.
(A–O) TgBAC(gfap:gal4ff);Tg(UAS:mcherry-NTR);Tg(kdrl:EGFP) (A and B) and Tg(kdrl:EGFP) (C) trunks at different developmental stages. Animals were treated with DMSO (A) or 2 mM Mtz (B and C) between 30 and 54 hpf and then kept in egg water until confocal analysis. At 60 hpf (A–C), no ectopic vessels were observed in Mtz-treated TgBAC(gfap:gal4ff);Tg(UAS:mcherry-NTR) animals. Note that while TgBAC(gfap:gal4ff);Tg(UAS:mCherry-NTR) expression is significantly decreased in Mtz-treated TgBAC(gfap:gal4ff);Tg(UAS:mcherry-NTR) animals at this stage, some expression remains visible. At 80 hpf (D–F), when TgBAC(gfap:gal4ff);Tg(UAS:mCherry-NTR) expression is dramatically decreased in Mtz-treated TgBAC(gfap:gal4ff);Tg(UAS:mcherry-NTR) fish, ectopic sprouts between ISVs begin to appear. At 100 hpf (G–I) and 130 hpf (J–L), more and more ectopic sprouts have emerged between ISVs and fused with one another or with other ISVs. At 154 hpf (M–O) and later, a majority of the ectopic vessels have apparently fused with one another or with other ISVs and get stabilized in the dorsal part of the trunk. Scale bar, 100 µm. (P) Quantification of average number of somites that showed ectopic blood vessels at different stages of development after radial glia ablation (10 somites examined per animal; 20 animals examined per condition). Animals were treated with 2 mM Mtz between 30 and 54 hpf and then subject to confocal analysis. Values represent means ± SEM. (Q–S) 154 hpf TgBAC(gfap:gal4ff);Tg(UAS:mcherry-NTR);Tg(kdrl:EGFP) trunks treated with DMSO (Q), 2 mM Mtz between 30 and 80 hpf (R), or 2 mM Mtz between 30 and 54 hpf (S). Scale bar, 500 µm. (T–V and T’–V’) High magnification images of selected areas (outlined in white) of the trunk shown in S. Ectopic vessels emerged in the anterior (T and T’) and medial (U and U’) part of the trunk, where radial glia ablation was more efficient. However, ectopic vessels were not observed in the posterior part of the trunk (V and V’), where radial glia ablation was less efficient. Scale bar, 100 µm. (W and W’) High magnification images of a selected area (outlined in white) of the trunk shown in R. Under this ablation treatment condition, the posterior part of the trunk showed more efficient ablation of radial glia than in the one shown in panels (V and V’) and exhibited ectopic vessel sprouting. Scale bar, 100 µm.
Figure 3—figure supplement 2
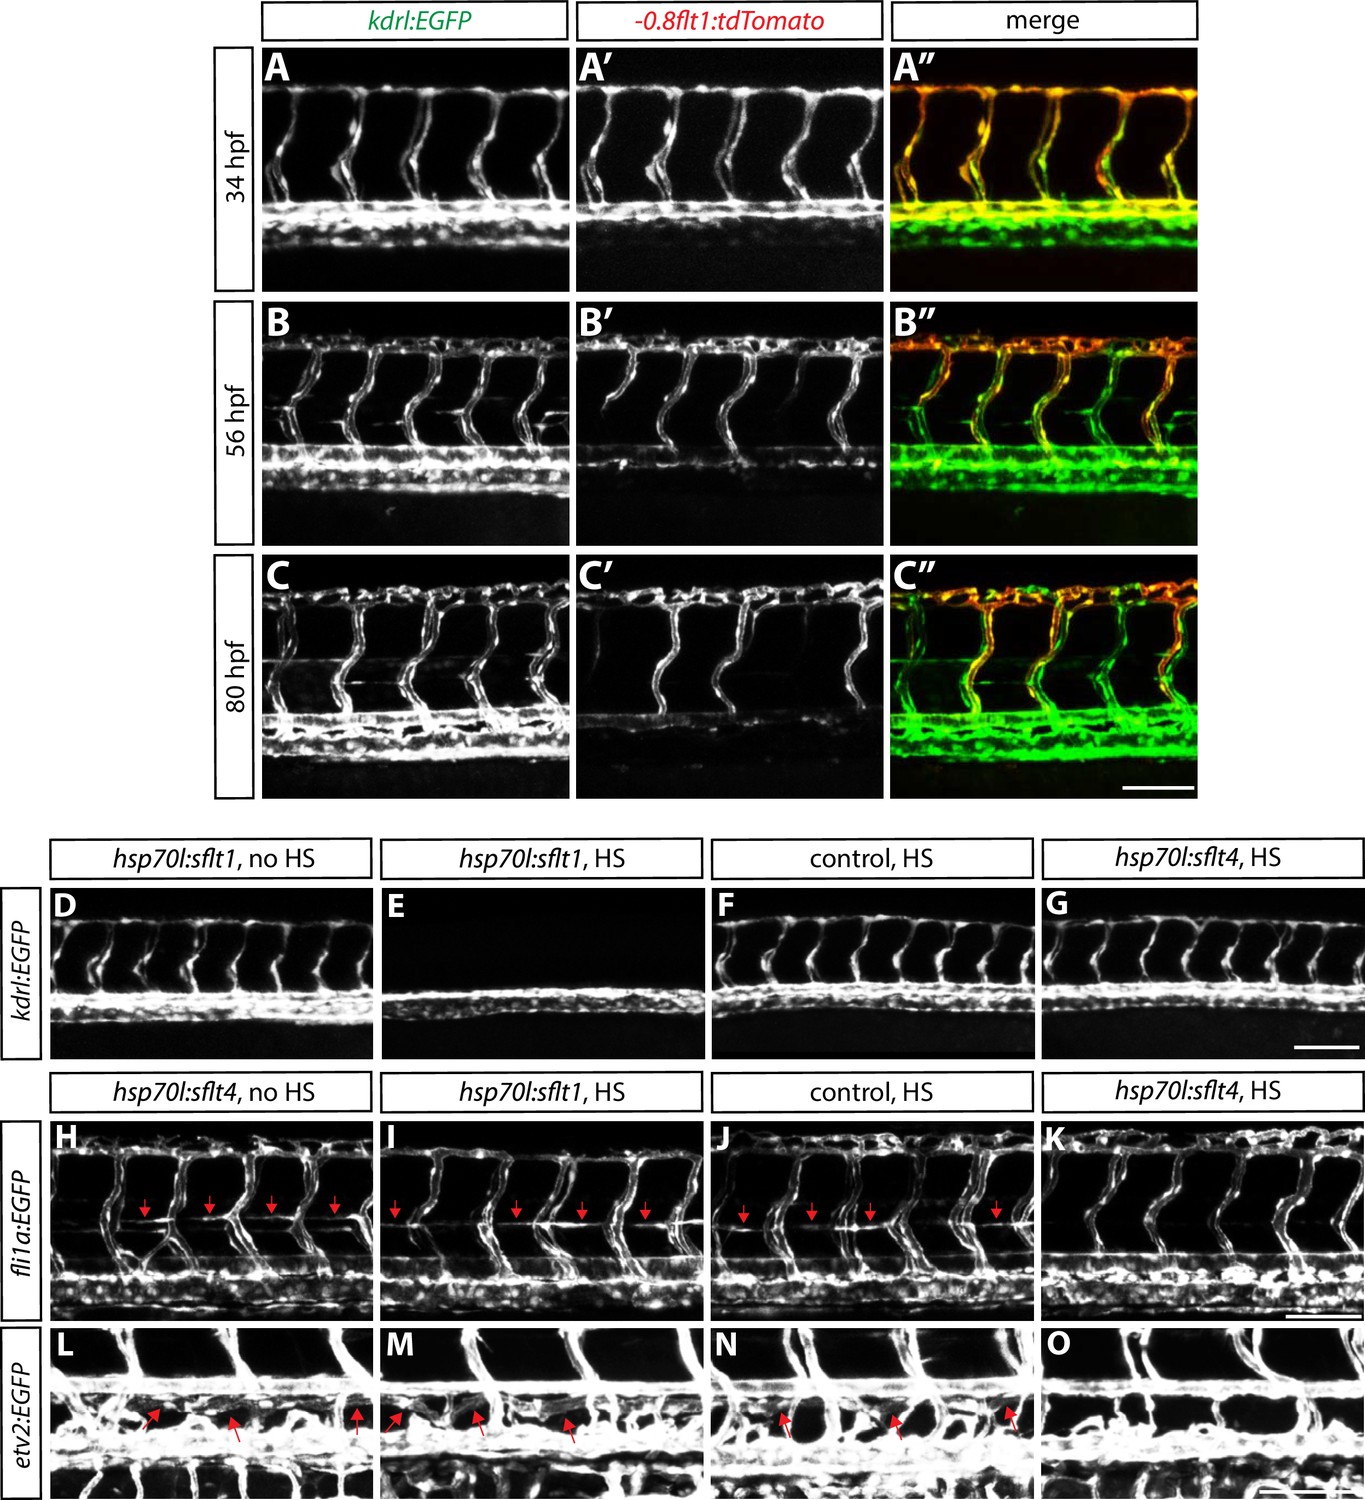
Characterization of Tg(-0.8flt1:tdTomato) expression during development, and validation of Tg(hsp70l:sflt1, cryaa:cerulean) and Tg(hsp70l:sflt4, cryaa:cerulean) lines.
(A–A”, B–B”, and C–C”) Confocal images of Tg(-0.8flt1:tdTomato);Tg(kdrl:EGFP) trunks at 34 (A–A”), 56 (B–B”), and 80 (C–C”) hpf. Tg(kdrl:EGFP) expression labels all the ISVs, whereas Tg(-0.8flt1:tdTomato) expression labels aISVs strongly and vISVs weakly at 80 hpf. Scale bar, 100 µm. (D–G) 32 hpf Tg(kdrl:EGFP);Tg(hsp70l:sflt1, cryaa:cerulean) (D and E), Tg(kdrl:EGFP) (F), and Tg(kdrl:EGFP);Tg(hsp70l:sflt4, cryaa:cerulean) (G) trunk vasculature visualized by Tg(kdrl:EGFP) expression. Animals were given no heat shock (D) or single heat shock at 20 hpf (E–G). Heat shock treated Tg(kdrl:EGFP);Tg(hsp70l:sflt1, cryaa:cerulean) animals show a loss of ISVs (E). Scale bar, 100 µm. (H–K) 60 hpf Tg(fli1a:EGFP);Tg(hsp70l:sflt4, cryaa:cerulean) (H and K), Tg(fli1a:EGFP) (J), and Tg(fli1a:EGFP);Tg(hsp70l:sflt1, cryaa:cerulean) (I) trunk vasculature visualized by Tg(fli1a:EGFP) expression. Animals were given no heat shock (H) or multiple heat shocks at 32, 40, and 50 hpf (I–K). Red arrows point to the parachordal chains (H–J), and heat shock treated Tg(fli1a:EGFP);Tg(hsp70l:sflt4, cryaa:cerulean) animals show a loss of the parachordal chains (K). Scale bar, 100 µm. (L–O) 7 dpf TgBAC(etv2:EGFP);Tg(hsp70l:sflt4, cryaa:cerulean) (L and O), TgBAC(etv2:EGFP) (N), and TgBAC(etv2:EGFP);Tg(hsp70l:sflt1, cryaa:cerulean) (M) trunk vasculature visualized by TgBAC(etv2:EGFP) expression. Animals were given no heat shock (L) or multiple heat shocks starting at 32 hpf and every 8–12 hr after that (M–O). Red arrows point to the thoracic duct (L–N), and heat shock treated TgBAC(etv2:EGFP);Tg(hsp70l:sflt4, cryaa:cerulean) animals show a loss of the thoracic duct (O). Scale bar, 100 µm.
Figure 4 with 1 supplement
Fish with reduced numbers of venous ISVs exhibit dramatically fewer ectopic sprouts after radial glia ablation.
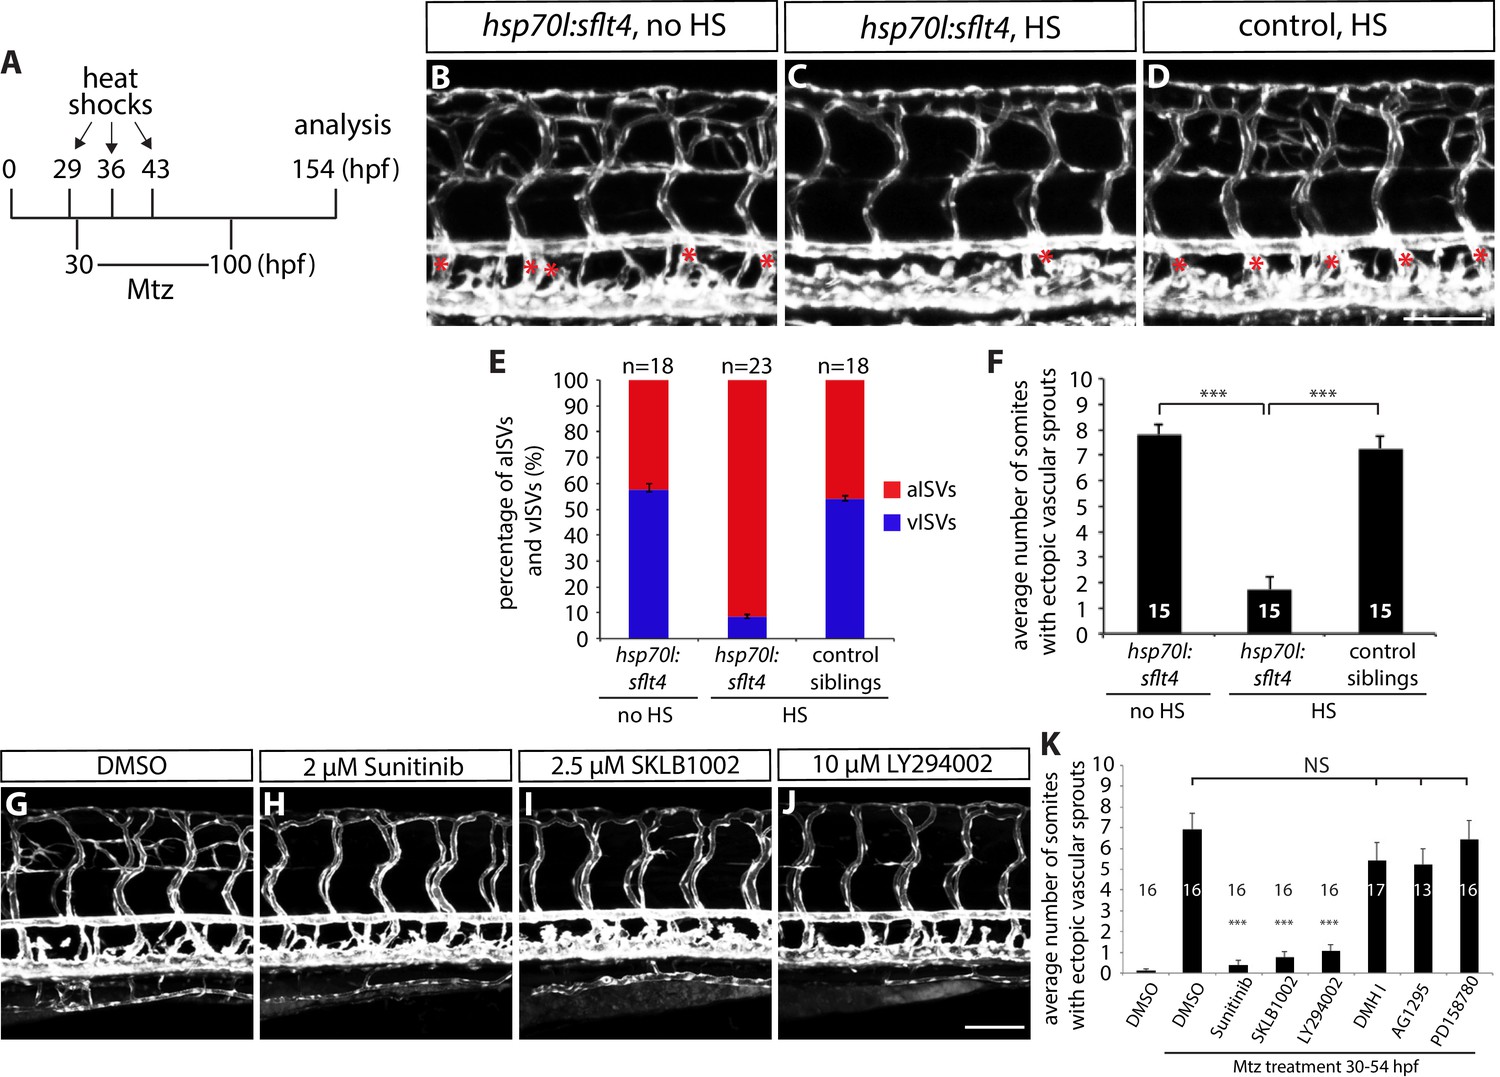
(A) Experimental time course for data shown in (B–F). (B–D) 154 hpf TgBAC(gfap:gal4ff);Tg(UAS:mcherry-NTR);Tg(kdrl:EGFP);Tg(hsp70l:sflt4, cryaa:cerulean) (B and C) and TgBAC(gfap:gal4ff);Tg(UAS:mcherry-NTR);Tg(kdrl:EGFP) (D) trunks after treatment with 2 mM Mtz between 30 and 100 hpf. Animals were subject to no heat shock (B) or multiple heat shocks at 29, 36, and 43 hpf (C and D). Red asterisks indicate vISVs, and inhibition of Vegfc/Vegfr3 signaling by overexpression of a soluble form of Flt4/Vegfr3 (sFlt4) dramatically reduced the number of vISVs (B–D). Under these conditions, significantly reduced ectopic ISV sprouting was observed after radial glia ablation (C). HS: heat shock. Scale bar, 100 µm. (E) Percentage of aISVs and vISVs in 154 hpf TgBAC(gfap:gal4ff);Tg(UAS:mcherry-NTR);Tg(kdrl:EGFP);Tg(hsp70l:sflt4, cryaa:cerulean) and TgBAC(gfap:gal4ff);Tg(UAS:mcherry-NTR);Tg(kdrl:EGFP) larvae that were given no heat shock or multiple heat shocks at 29, 36, and 43 hpf. See also Figure 4—source data 1 for quantification. (F) Quantification of average number of somites that showed ectopic blood vessels (10 somites examined per animal; 15 animals examined per condition). Ectopic vessel sprouting after radial glia ablation was dramatically reduced in the heat shocked TgBAC(gfap:gal4ff);Tg(UAS:mcherry-NTR);Tg(kdrl:EGFP);Tg(hsp70l:sflt4, cryaa:cerulean) larvae (which exhibit reduced numbers of vISVs). (G–J) 130 hpf TgBAC(gfap:gal4ff);Tg(UAS:mcherry-NTR);Tg(kdrl:EGFP) trunk vasculature visualized by Tg(kdrl:EGFP) expression. Animals were pre-treated with 2 mM Mtz between 30 and 54 hpf and then treated with DMSO (G), 2 µM Sunitinib (H), 2.5 µM SKLB1002 (I), or 10 µM LY294002 (J) between 54 and 130 hpf. As compared to DMSO, these chemicals significantly inhibited ectopic vessel sprouting after radial glia ablation. Scale bar, 100 µm. (K) Quantification of average number of somites that showed ectopic blood vessels in 130 hpf larvae that were treated with different chemicals after radial glia ablation (10 somites examined per animal). In all panels, values represent means ± SEM (*** indicates p<0.001 by one-way ANOVA followed by Tukey’s HSD test).
-
Figure 4—source data 1
Quantification of aISVs and vISVs number.
The number of aISVs and vISVs was quantified at 154 hpf in control and Tg(hsp70l:sflt4); Tg(kdrl:EGFP) fish, which were given no heat shock or multiple heat shocks at 29, 36, and 43 hpf. The 10 ISVs directly anterior to the anal opening on both sides of the body (total 20 ISVs) were used for quantification (18–23 animals examined per condition).
- https://doi.org/10.7554/eLife.20253.013
Figure 4—figure supplement 1
Genetic inhibition of Vegfr2, but not Vegfr3 or Bmp, signaling blocks ectopic vessel sprouting after radial glia ablation.
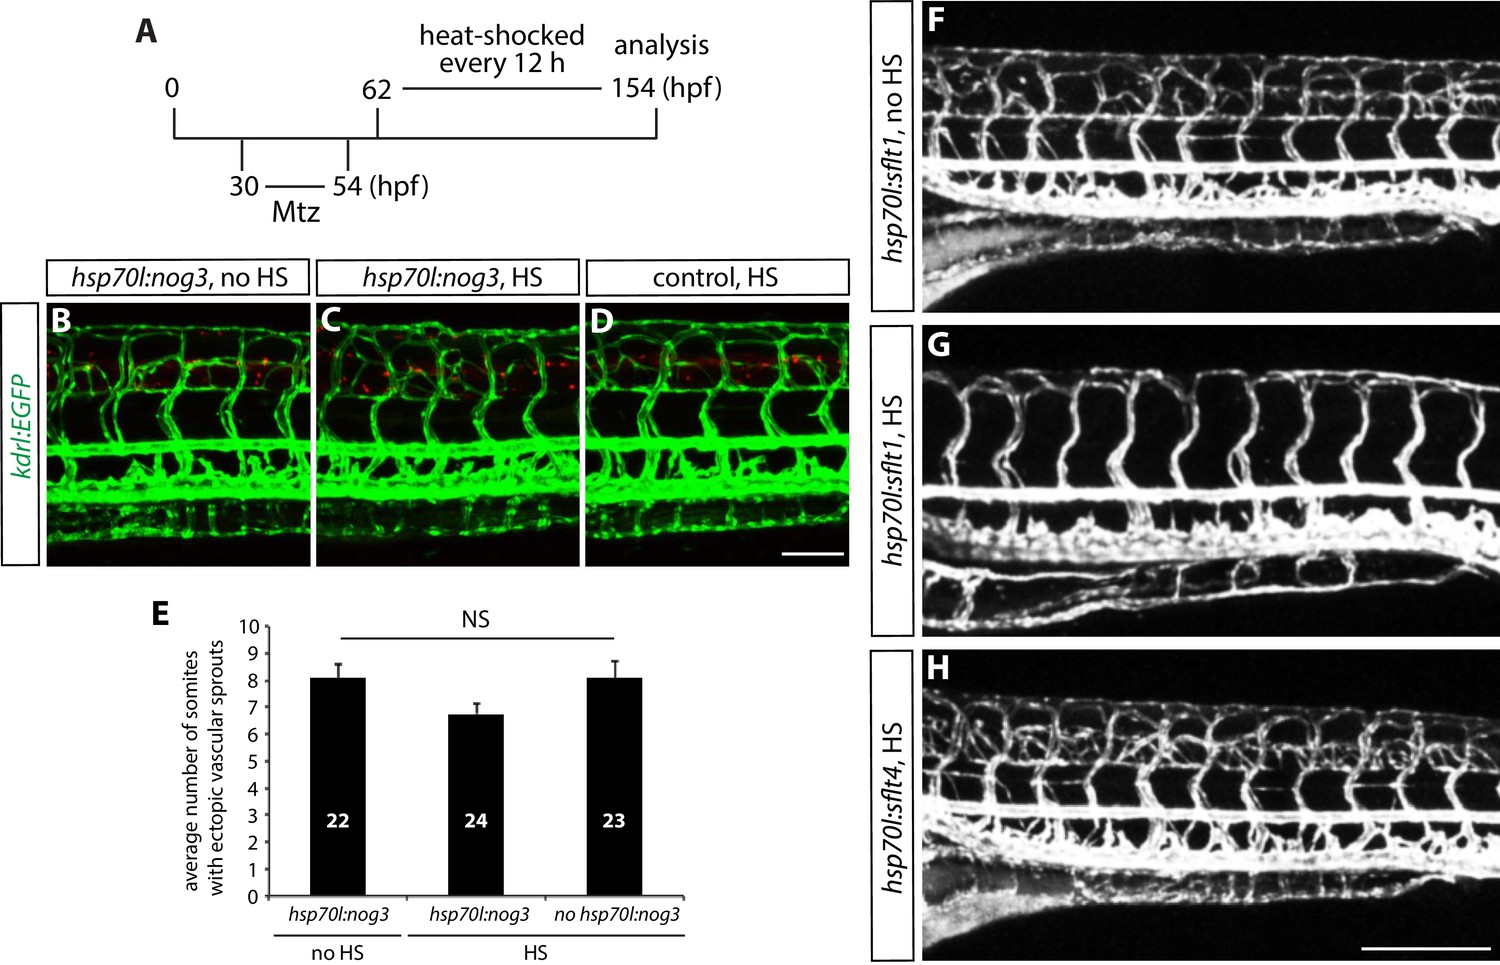
(A) Experimental time course for data shown in panels (B–H). (B–D) 154 hpf TgBAC(gfap:gal4ff);Tg(UAS:mcherry-NTR);Tg(kdrl:EGFP);Tg(hsp70l:nog3) (B and C) and TgBAC(gfap:gal4ff);Tg(UAS:mcherry-NTR);Tg(kdrl:EGFP) (D) trunk vasculature visualized by Tg(kdrl:EGFP) expression. Animals were treated with 2 mM Mtz between 30 and 54 hpf and then given no heat shock (B) or multiple heat shocks starting at 62 hpf and every 12 hr after that (C and D). Scale bar, 100 µm. (E) Quantification of average number of somites that showed ectopic blood vessels for the experiments shown in panels B–D (10 somites examined per animal; ≥22 animals examined per condition). Values represent means ± SEM. (F–H) 154 hpf TgBAC(gfap:gal4ff);Tg(UAS:mcherry-NTR);Tg(kdrl:EGFP);Tg(hsp70l:sflt1, cryaa:cerulean) (F and G), and TgBAC(gfap:gal4ff);Tg(UAS:mcherry-NTR);Tg(kdrl:EGFP);Tg(hsp70l:sflt4, cryaa:cerulean) (H) trunk vasculature visualized by Tg(kdrl:EGFP). Animals were treated with 2 mM Mtz between 30 and 54 hpf and then given no heat shock (F) or multiple heat shocks starting at 62 hpf and every 12 hr after that (G and H). Overexpression of sFlt-1, but not that of sFlt-4, blocks ectopic vessel sprouting after radial glia ablation. Scale bar, 200 µm.
Figure 5 with 1 supplement
sflt1 mutants exhibit ectopic venous ISV sprouting around the spinal cord.
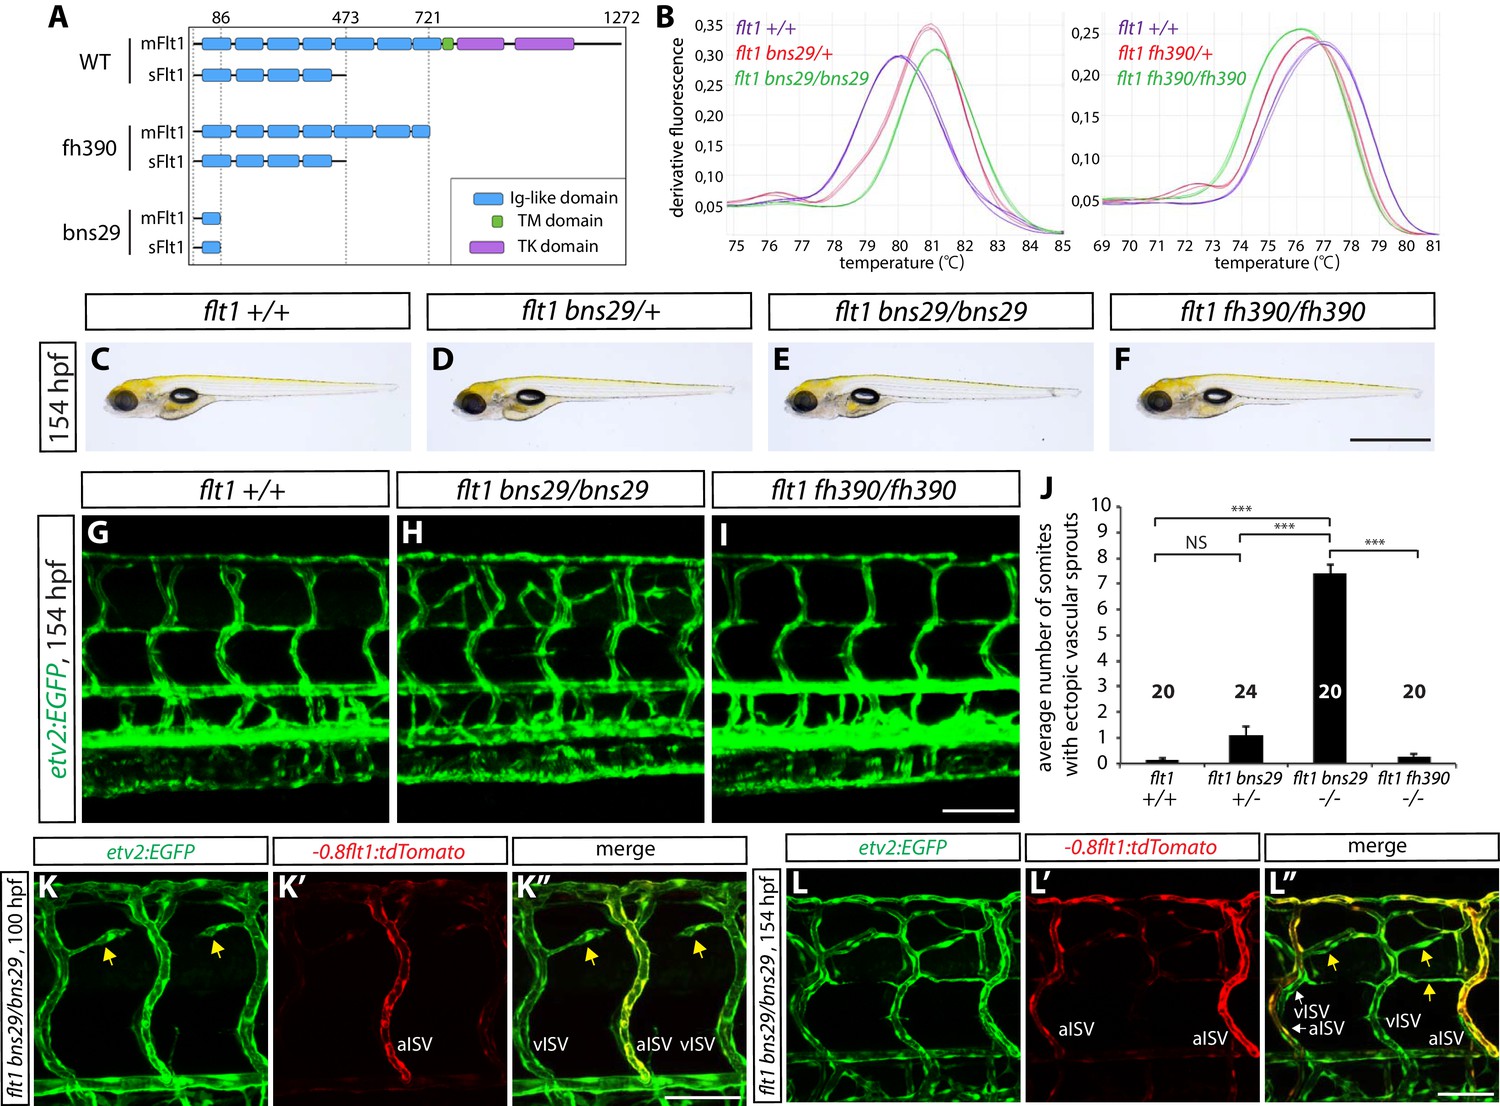
(A) Predicted domain structures of WT and mutant Flt1 (mFlt1 and sFlt1). (B) High resolution melt analysis used to determine the flt1bns29 (left panel) and flt1fh390 (right panel) genotypes. Melting curves for 3 independent fish of each genotype are shown. (C–F) Representative brightfield images of 154 hpf flt1+/+ (C), flt1bns29/+ (D), flt1bns29/bns29 (E), and flt1fh390/fh390 (F) larvae. Scale bar, 1 mm. (G–I) 154 hpf TgBAC(etv2:EGFP) flt1+/+ (G), flt1bns29/bns29 (H), and flt1fh390/fh390 (I) trunk vasculature. Ectopic vessel sprouting is observed in the dorsal trunk of flt1bns29/bns29 (H), but not flt1+/+ (G) or flt1fh390/fh390 (I), fish. Scale bar, 100 µm. (J) Quantification of average number of somites that showed ectopic blood vessels in flt1+/+, flt1bns29/+, flt1bns29/bns29, and flt1fh390/fh390 larvae (10 somites examined per animal; ≥20 animals examined per genotype). (K–K”) 100 hpf TgBAC(etv2:EGFP);Tg(-0.8flt1:tdTomato) flt1bns29/bns29 trunk vasculature visualized by TgBAC(etv2:EGFP) (K) and Tg(-0.8flt1:tdTomato) (K’) expression. Ectopic vessel sprouts in flt1bns29/bns29 fish derive from venous ISVs in most cases (yellow arrows). Scale bar, 50 µm. (L–L”) High magnification images of 154 hpf TgBAC(etv2:EGFP);Tg(-0.8flt1:tdTomato) flt1bns29/bns29 trunk vasculature. Ectopic vessels in the dorsal trunk exhibit weak Tg(-0.8flt1:tdTomato) expression as vISVs do (yellow arrows, L”). Scale bar, 50 µm. In all panels, values represent means ± SEM (*** indicates p<0.001 by one-way ANOVA followed by Tukey’s HSD test).
Figure 5—figure supplement 1
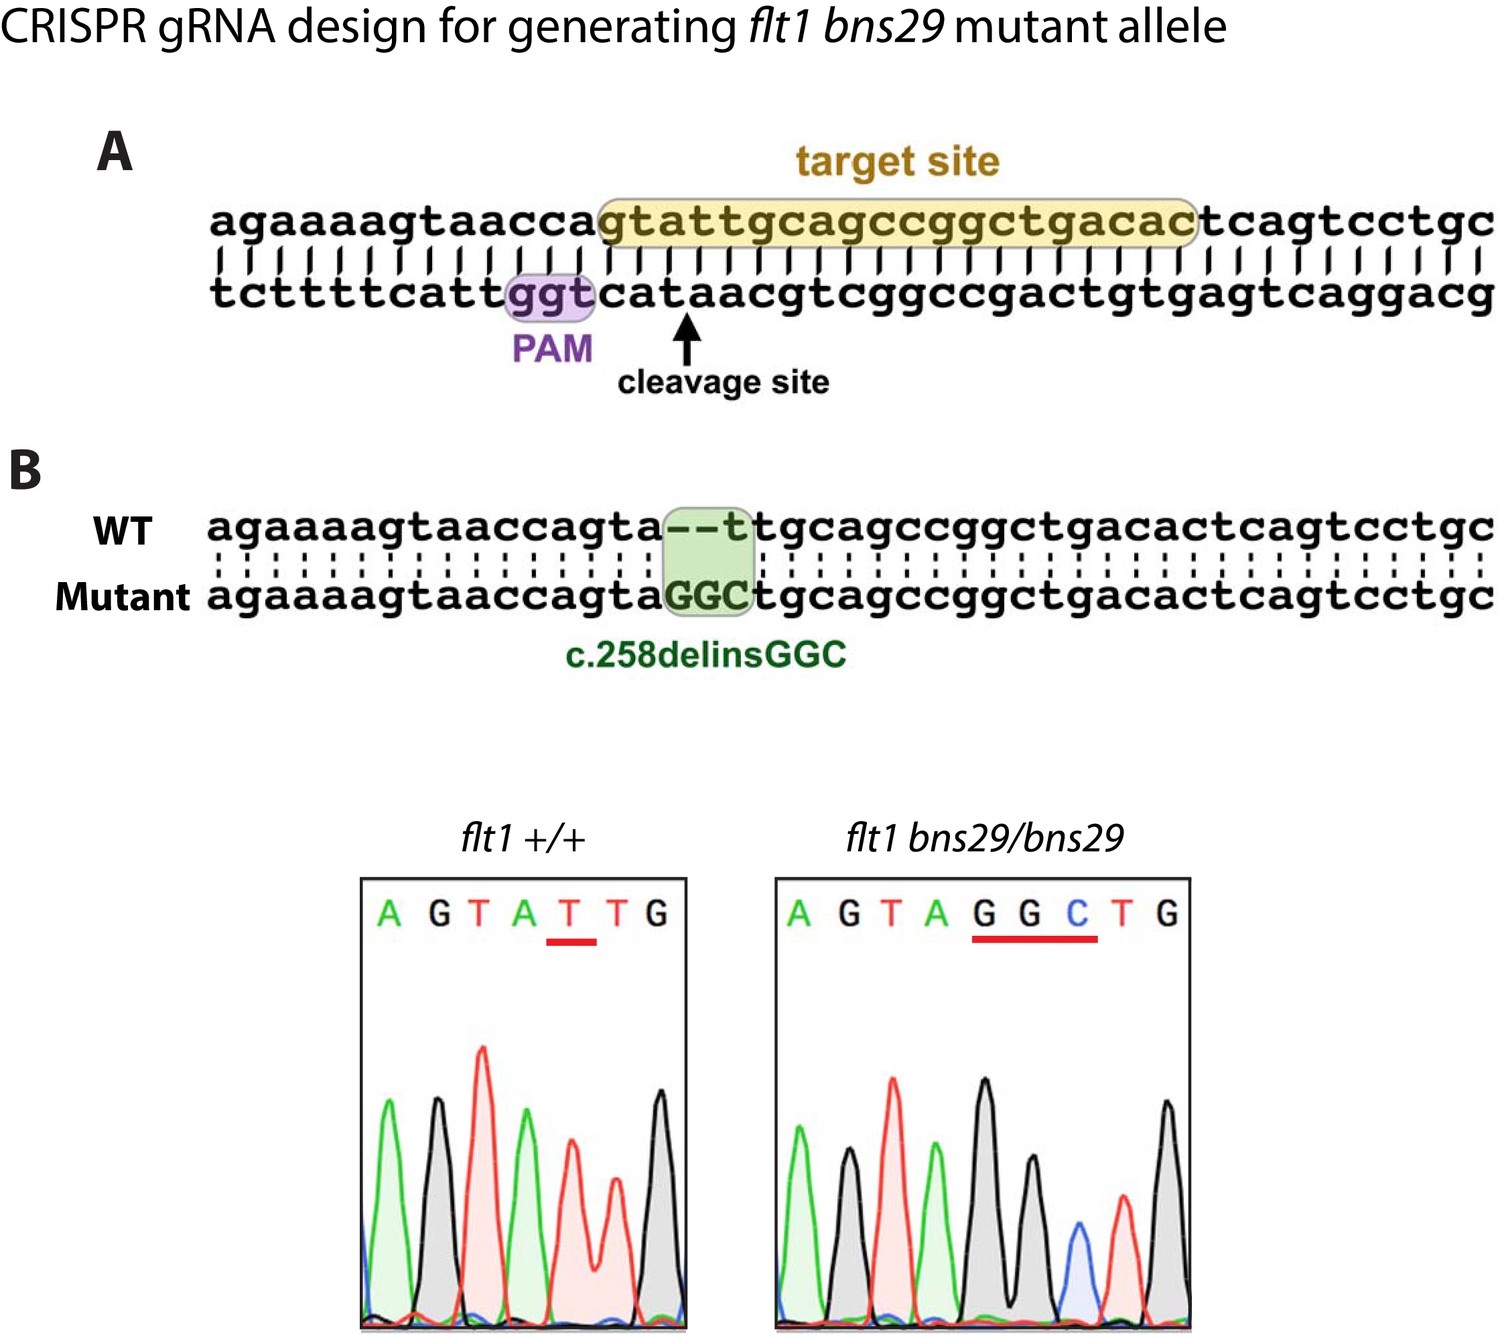
Generation of zebrafish flt1bns29 mutant allele.
(A) gRNA was designed to target sequences within exon 3 encoding part of the 1st Ig-like domain. The gRNA target site is highlighted in yellow, and the PAM site in purple. (B) Sequence alignment of part of exon 3 from the WT and flt1bns29/bns29 allele shows CRISPR-induced indels. One nucleotide deletion (t) and three nucleotide insertion (GGC) in flt1bns29/bns29 allele are confirmed by the sequence chromatograms of the PCR products generated using flt1+/+ and flt1bns29/bns29 adult fish genomic DNA as templates (red lines in the sequence chromatograms indicate the CRISPR-induced indels).
Figure 6
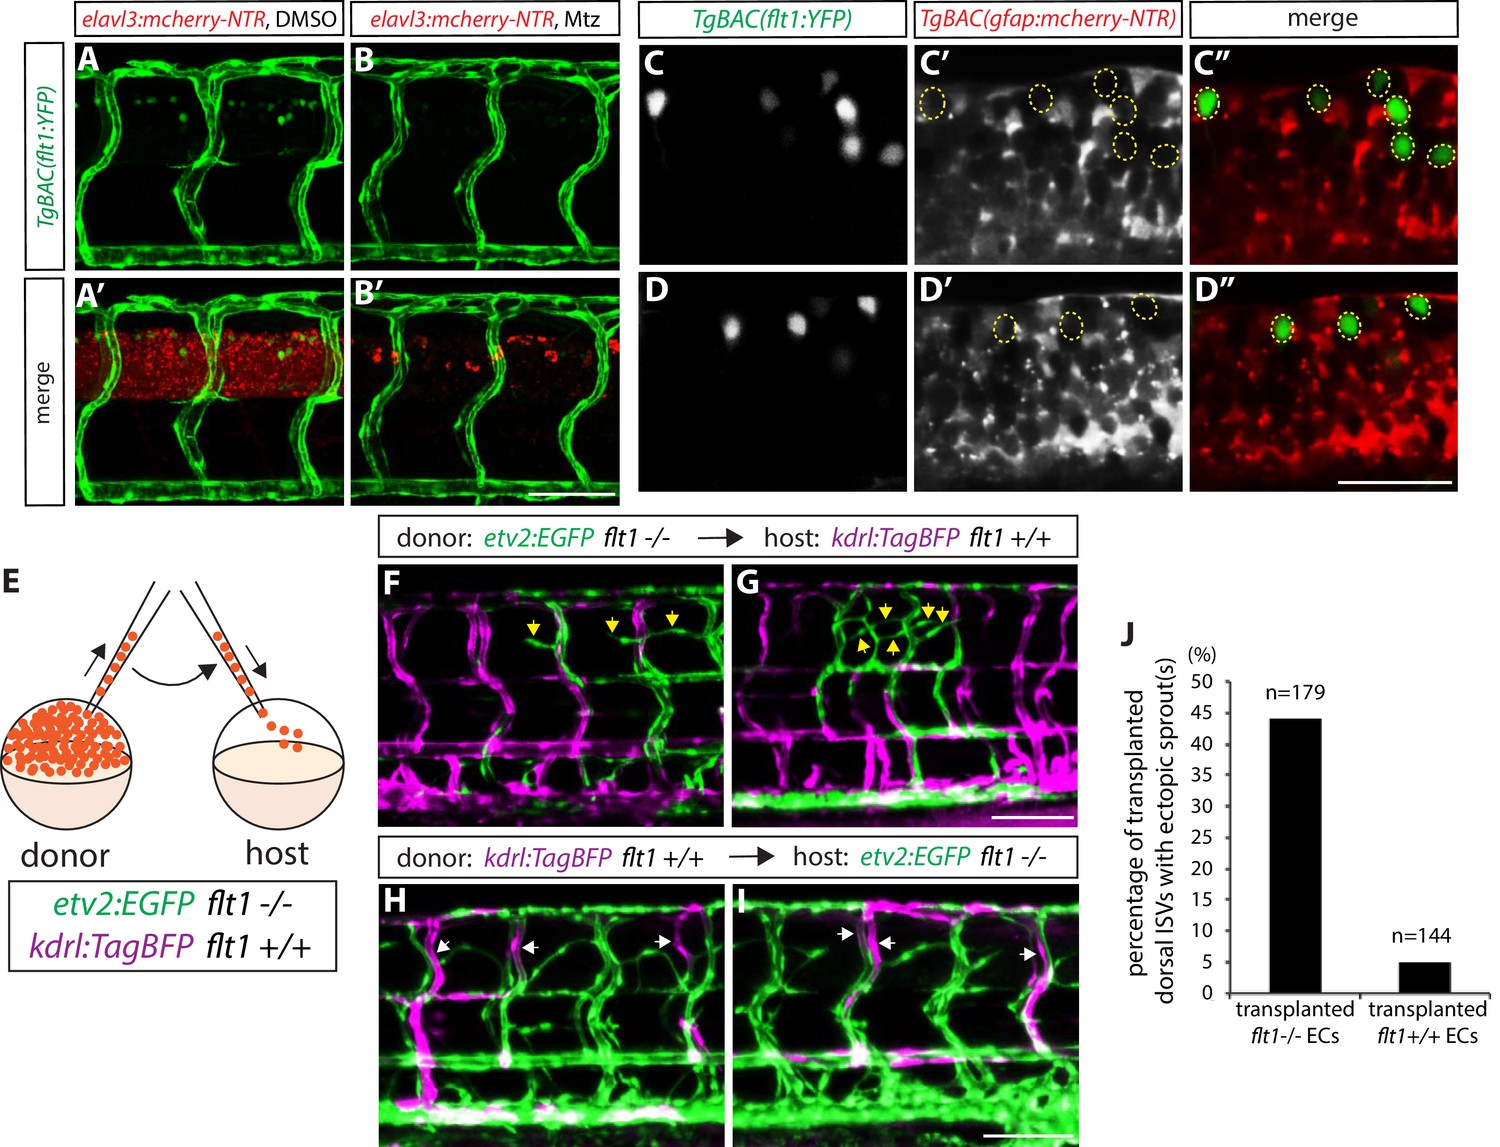
sFlt1 function in endothelial cells can limit venous ISV over-sprouting around the spinal cord.
(A–B’) 82 hpf TgBAC(flt1:YFP);Tg(elavl3:gal4);Tg(UAS:mcherry-NTR) trunks after treatment with DMSO (A and A’) or 2 mM Mtz (B and B’) between 30 and 82 hpf. TgBAC(flt1:YFP) expression is observed strongly in ECs and weakly in cells residing in the spinal cord. Genetic ablation of neurons leads to an almost complete loss of TgBAC(flt1:YFP) expression in the spinal cord (B and B’). Scale bar, 50 µm. (C–C” and D–D”) High magnification single-plane confocal images of 80 hpf TgBAC(flt1:YFP);TgBAC(gfap:gal4ff);Tg(UAS:mcherry-NTR) spinal cord. TgBAC(flt1:YFP) expression does not co-localize with mCherry+ radial glia. Yellow dashed circles mark the position of the TgBAC(flt1:YFP)-positive spinal cord cells (C’, C”, D’, and D”). Scale bar, 30 µm. (E) Schematic diagram of the transplantation assay (F–J). Cells taken from TgBAC(etv2:EGFP) flt1bns29/bns29 or Tg(kdrl:TagBFP) flt1+/+ donor embryos were transplanted into Tg(kdrl:TagBFP) flt1+/+ or TgBAC(etv2:EGFP) flt1bns29/bns29 host embryos, respectively. (F and G) 154 hpf Tg(kdrl:TagBFP) flt1+/+ trunk vasculature with transplanted cells from TgBAC(etv2:EGFP) flt1bns29/bns29 embryos. Yellow arrows point to ectopic sprouts from transplanted TgBAC(etv2:EGFP) flt1bns29/bns29 ECs in the dorsal trunk. Only the transplanted TgBAC(etv2:EGFP) flt1bns29/bns29 ECs, but not the neighboring Tg(kdrl:TagBFP) flt1+/+ ECs, exhibit ectopic ISV sprouting. Scale bar, 100 µm. (H and I) 154 hpf TgBAC(etv2:EGFP) flt1bns29/bns29 trunk vasculature with transplanted cells from Tg(kdrl:TagBFP) flt1+/+ embryos. White arrows point to transplanted Tg(kdrl:TagBFP) flt1+/+ ECs in the dorsal trunk, which do not exhibit ectopic sprouting, unlike neighboring TgBAC(etv2:EGFP) flt1bns29/bns29 ECs that show ectopic sprouting. Scale bar, 100 µm. (J) Percentage of transplanted ISVs in the dorsal trunk that exhibited ectopic sprout(s) at 154 hpf for the experiments shown in panels (F–I).
Figure 7
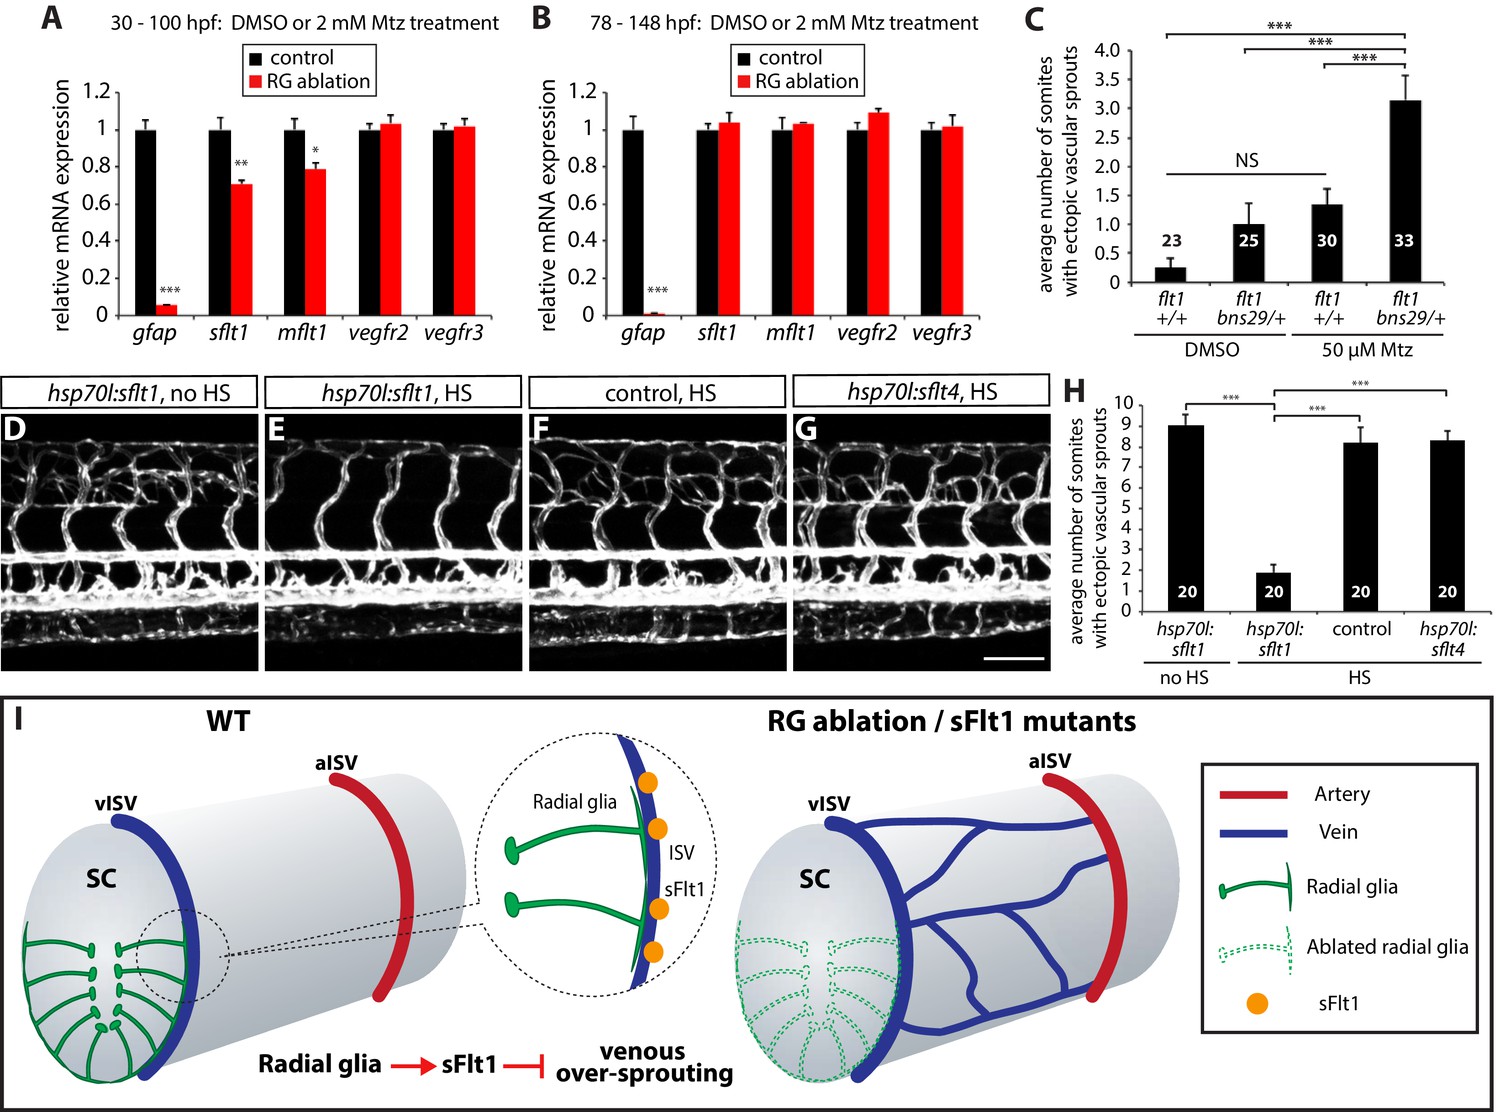
Radial glia limit venous over-sprouting around the spinal cord via the regulation of sflt1 expression.
(A) qPCR analyses of 100 hpf TgBAC(gfap:gal4ff);Tg(UAS:mcherry-NTR) trunk samples after treatment with DMSO or 2 mM Mtz between 30 and 100 hpf. Radial glia-ablated fish trunk samples show significantly reduced mRNA expression of gfap, sflt1, and mflt1. (B) qPCR analyses of 148 hpf TgBAC(gfap:gal4ff);Tg(UAS:mcherry-NTR) trunk samples after treatment with DMSO or 2 mM Mtz between 78 and 148 hpf. Radial glia-ablated fish trunk samples show significantly reduced gfap mRNA expression; however, sflt1 and mflt1 mRNA expression was not significantly different between control and radial glia-ablated samples. (C) Quantification of average number of somites that showed ectopic sprouting in 154 hpf flt1+/+ and flt1bns29/+ larvae treated with DMSO or 50 µM Mtz between 30 and 154 hpf (10 somites examined per animal; ≥23 animals examined per condition). flt1+/+ larvae treated with 50 µM Mtz or flt1bns29/+ larvae treated with DMSO did not show a statistically significant change in ectopic ISV sprouting compared to flt1+/+ larvae treated with DMSO. However, flt1bns29/+ larvae treated with 50 µM Mtz exhibited a significantly increased number of somites with ectopic sprouts compared to the other three treatments. See also Figure 7—source data 1 for quantification. (D–G) 154 hpf TgBAC(gfap:gal4ff);Tg(UAS:mcherry-NTR);Tg(kdrl:EGFP);Tg(hsp70l:sflt1, cryaa:cerulean) (D and E), TgBAC(gfap:gal4ff);Tg(UAS:mcherry-NTR);Tg(kdrl:EGFP) (F), and TgBAC(gfap:gal4ff);Tg(UAS:mcherry-NTR);Tg(kdrl:EGFP);Tg(hsp70l:sflt4, cryaa:cerulean) (G) trunk vasculature visualized by Tg(kdrl:EGFP) expression. Animals were treated with 2 mM Mtz between 30 and 54 hpf and then subject to no heat shock (D) or multiple heat shocks (E–G) starting at 62 hpf and every 12 hr after that. Overexpression of sFlt-1 blocks ectopic vessel sprouting after radial glia ablation (E). Scale bar, 100 µm. (H) Quantification of average number of somites that showed ectopic sprouting for the experiments shown in panels D–G (10 somites examined per animal; 20 animals examined per condition). Quantification was performed at 154 hpf. Overexpression of sFlt-1, but not of sFlt-4, significantly inhibited ectopic vessel sprouting after radial glia ablation. HS: heat shock. (I) Schematic diagrams showing radial glia regulation of the vascular patterning around the spinal cord. During development, the end-feet of radial glia lie in close proximity to the dorsal ISVs which surround the spinal cord. Genetic ablation of radial glia in early embryos leads to selective over-sprouting of venous ISVs. Perturbation of sFlt1 function also leads to over-sprouting of vISVs, and radial glia regulate the precise patterning of the venous vasculature around the spinal cord at least in part via the control of sFlt1 function in endothelium. RG: radial glia. In panels (C and H), values represent means ± SEM (*** indicates p<0.001 by one-way ANOVA followed by Tukey’s HSD test). In panels (A and B), values represent means ± SEM (*, **, and *** indicate p<0.05, p<0.01, and p<0.001, respectively, by Student’s t test).
-
Figure 7—source data 1
Quantification of average number of somites that showed ectopic blood vessels in flt1+/+ and flt1bns29/+ larvae.
Animals were treated with DMSO or 50 µM Mtz between 30 and 154 hpf, and quantification was performed at 154 hpf (10 somites examined per animal; 23–33 animals examined per condition).
- https://doi.org/10.7554/eLife.20253.019
Videos
Video 1
TgBAC(gfap:gfap-EGFP);Tg(kdrl:ras-mcherry) trunk at 132 hpf.
A vast majority of the cells that are marked by TgBAC(gfap:Gfap-EGFP) expression appear to have long radial processes towards the surface of the spinal cord, a morphology characteristic of radial glia. Scale bar, 20 µm.
Video 2
Ectopic vessels after radial glia ablation lie at the surface of, but not inside, the spinal cord.
7 dpf TgBAC(gfap:gal4ff);Tg(UAS:mcherry-NTR);Tg(kdrl:EGFP) trunk vasculature visualized by Tg(kdrl:EGFP) expression. Ectopic vessels after radial glia ablation lie at the surface of, but not inside, the spinal cord. Scale bar, 30 µm.
Tables
Table 1
List of primers used for qPCR analysis.
| Primer name | Primer sequence (5' to 3') |
|---|---|
| gfap qPCR Fw | AGGCTCATGTGAAGAGGAGCATAG |
| gfap qPCR Rv | CCTCATTATGGCAGATCCTTCCTC |
| sflt1 qPCR Fw (sflt1 specific) | CGTCCCACCACCTCAAATCCAAT |
| sflt1 qPCR Rv (sflt1 specific) | AAGCCCATCCAGCCGCTATCAG |
| mflt1 qPCR Fw (mflt1 specific) | GCTCATTCAGGTGAAGTGGACAG |
| mflt1 qPCR Rv (mflt1 specific) | AGAAGATCGCCTTCATAATGTGG |
| vegfr2 qPCR Fw | CATGAAGTGTCCACATATGTTTTTG |
| vegfr2 qPCR Rv | TTTTGGTTTGGGTATGTTGTTCTAC |
| vegfr3 qPCR Fw | GACCCAGAGCATCCATTCAT |
| vegfr3 qPCR Rv | AGGCTCTGGATACGGCACTA |
Download links
A two-part list of links to download the article, or parts of the article, in various formats.
Downloads (link to download the article as PDF)
Open citations (links to open the citations from this article in various online reference manager services)
Cite this article (links to download the citations from this article in formats compatible with various reference manager tools)
Radial glia regulate vascular patterning around the developing spinal cord
eLife 5:e20253.
https://doi.org/10.7554/eLife.20253


