Chemogenetic inhibition of the medial prefrontal cortex reverses the effects of REM sleep loss on sucrose consumption
- International Institute for Integrative Sleep Medicine (WPI-IIIS), University of Tsukuba, Japan
Figures
Figure 1 with 1 supplement
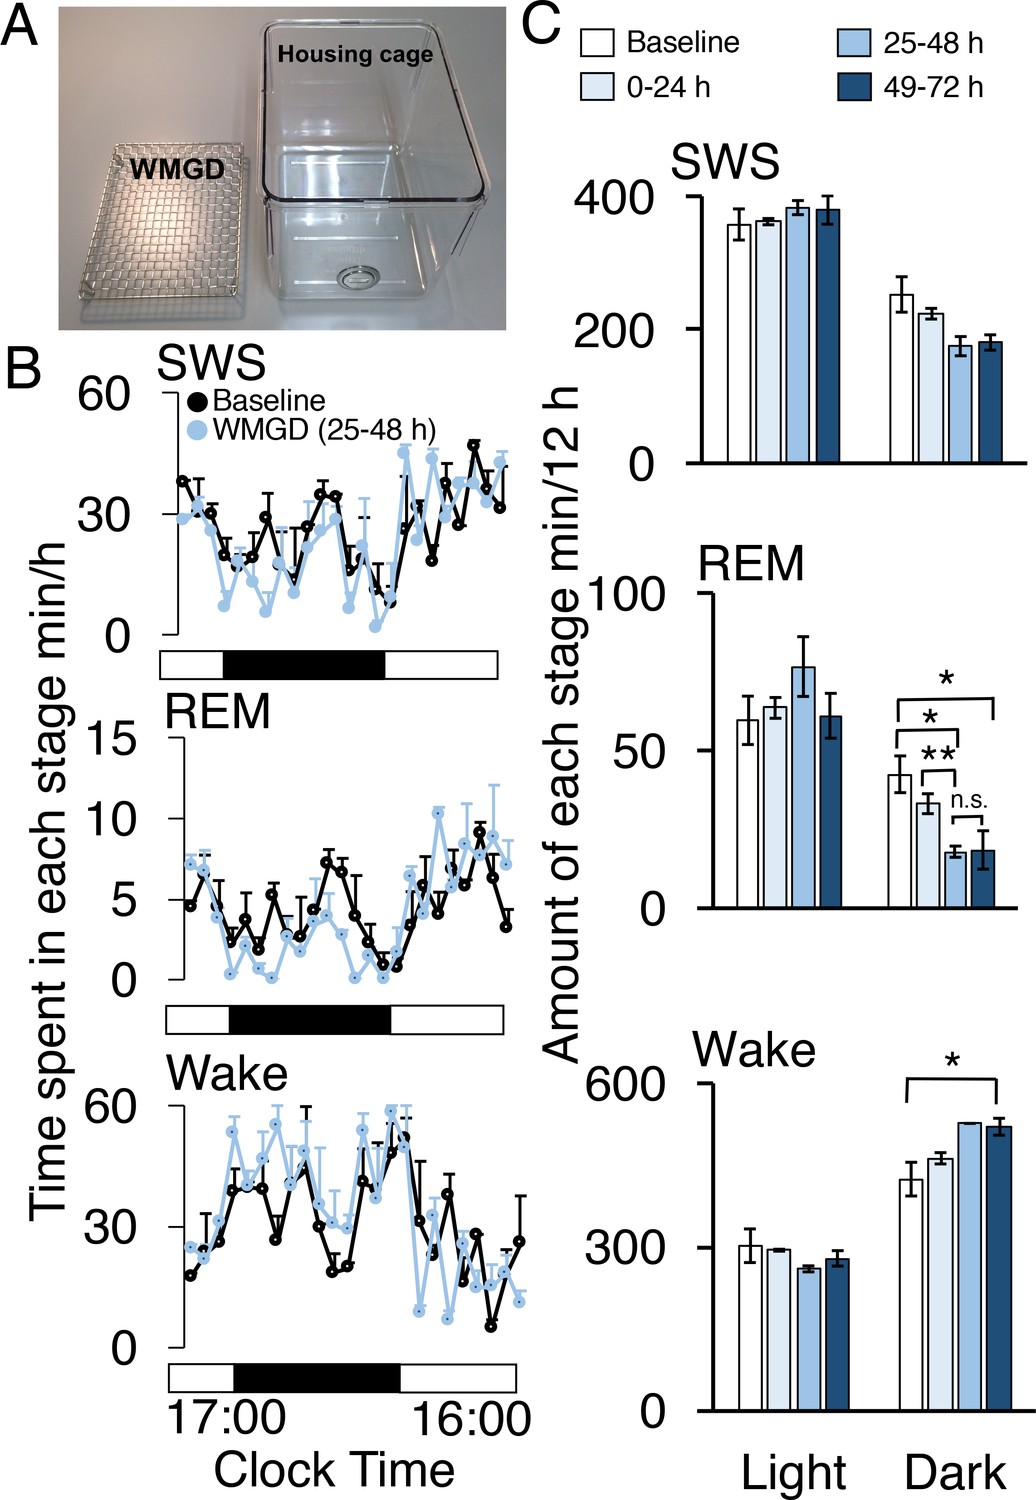
A wire-mesh-grid device (WMGD) produced REM sleep loss during the dark period in mice.
(A) A pictorial representation of the WMGD (left) and the housing cage in which the WMGD was placed (right). (B and C) Time-courses (25–48 hr) of slow wave sleep (SWS), REM sleep and wake (B) and time spent in each sleep stage (C). Black and white bars in (B) indicate dark and light period, respectively. *p < 0.05 and **p < 0.01 indicate significant differences between baseline and WMGD exposure (n = 3).
Figure 1—figure supplement 1
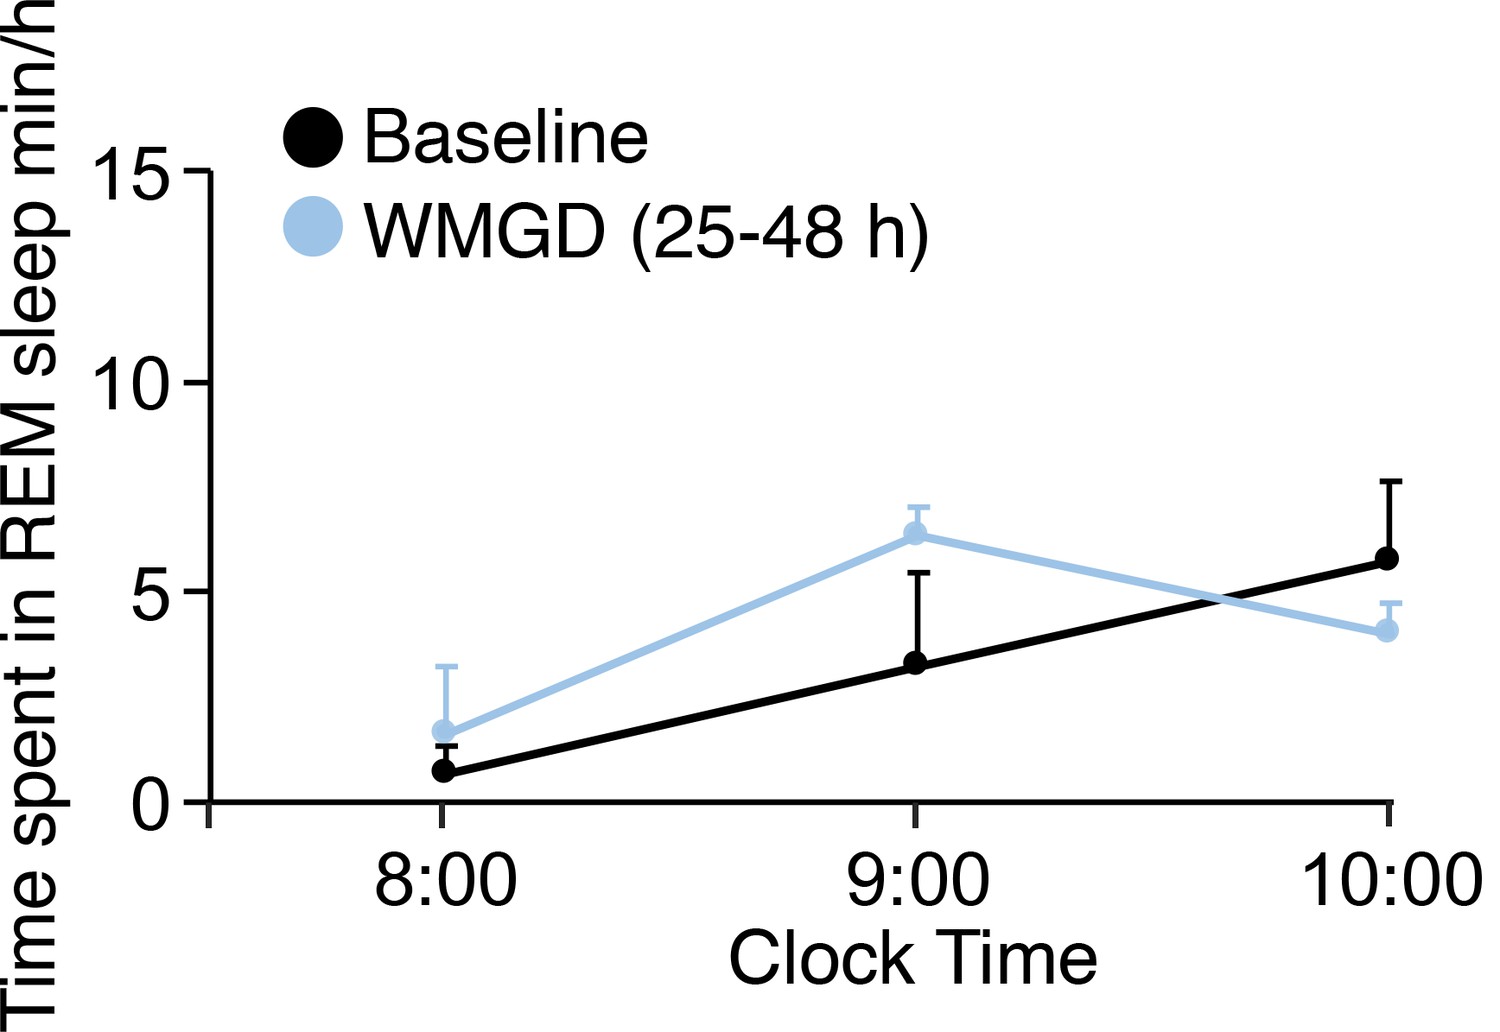
REM sleep does not rebound during the light phase in mice exposed to the WMGD for 25–48 hr compared to baseline.
REM, Rapid eye movement.
Figure 2
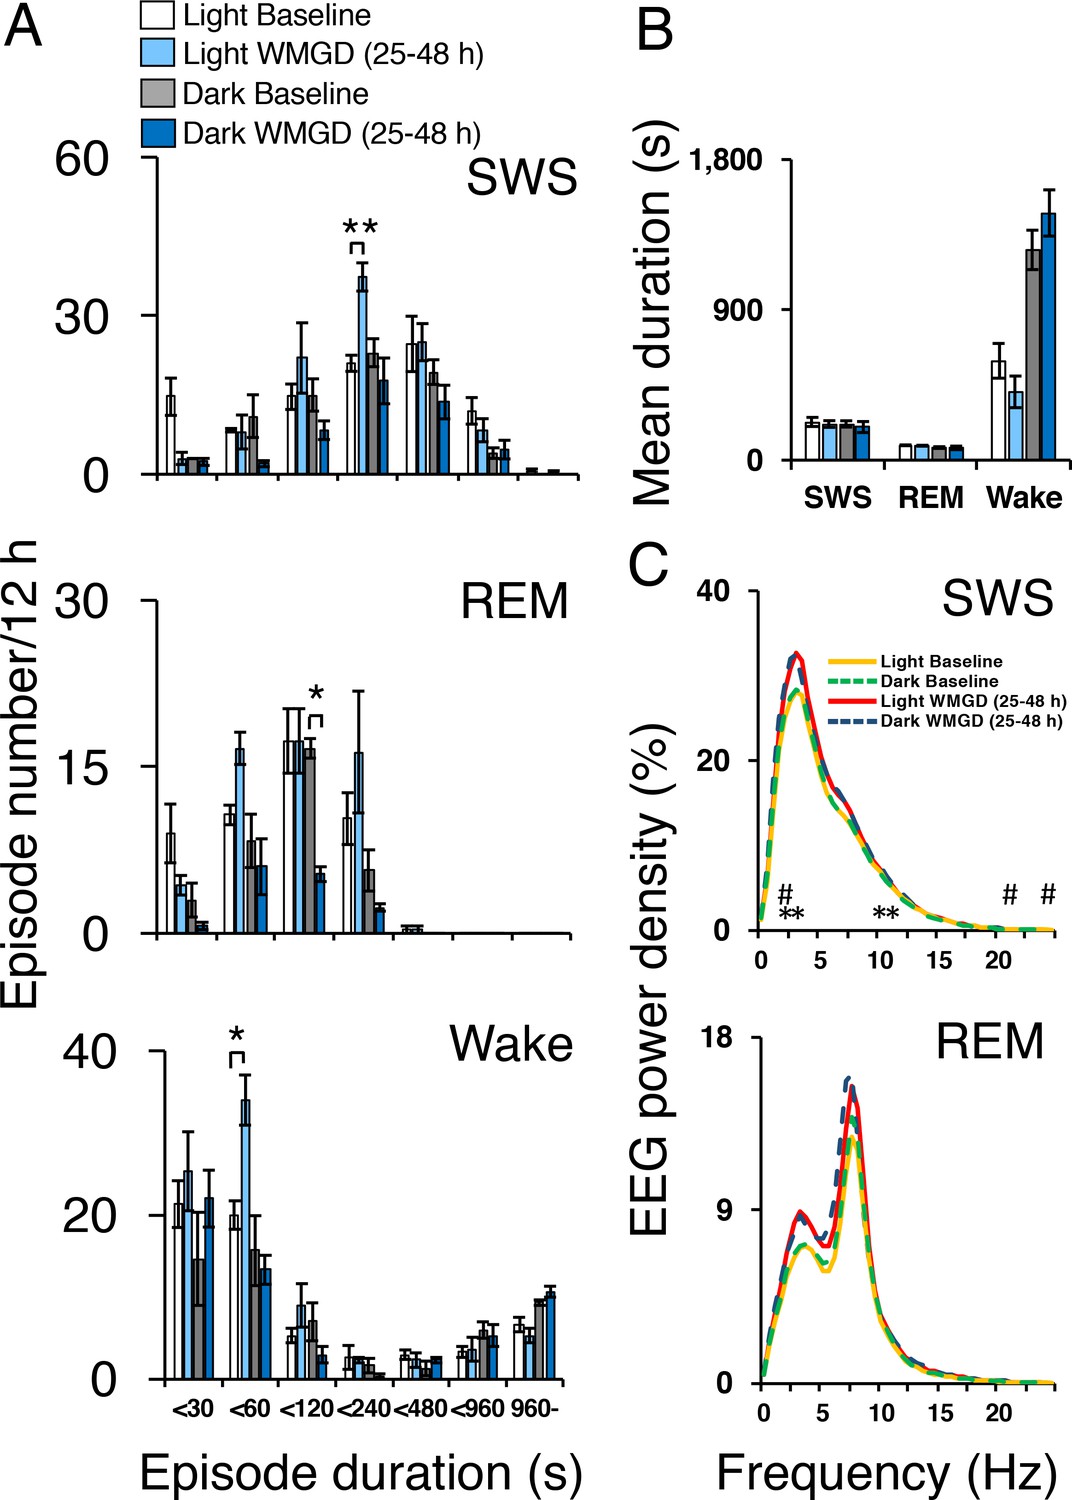
Sleep-wake profiles under baseline and wire-mesh-grid device (WMGD) conditions in mice for a 25–48 hr period, assessed by EEG/EMG recordings.
(A and B) Effect of the WMGD on episode number (A) and duration (B) of slow wave sleep (SWS), REM sleep and wake during the light and dark phases. *p < 0.05 and **p < 0.01, indicates significant differences between baseline and WMGD exposure (n = 3). (C) EEG power density of SWS and REM sleep episodes in the light and dark phases. # and * symbols indicate significant differences (p < 0.01) between baseline and WMGD exposure during light (#) and dark phases (*).
Figure 3
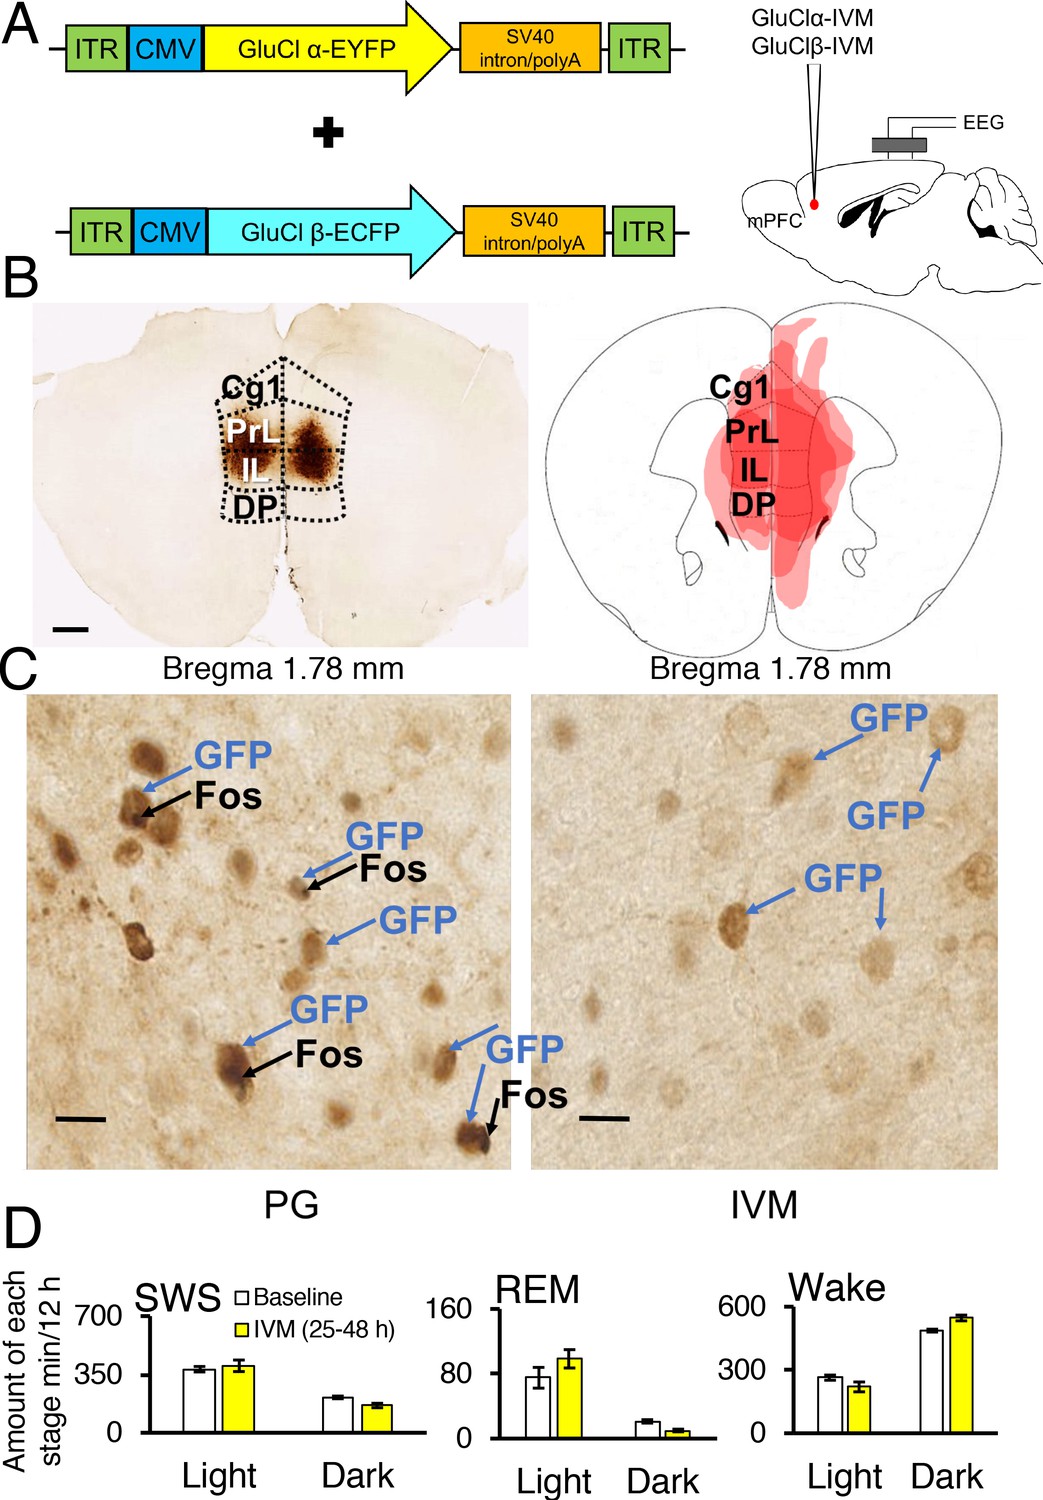
Chemogenetic inhibition of medial prefrontal cortex (mPFC) neurons in mice.
(A) Wild-type mice were injected with GluClα-IVM and GluClβ-IVM adeno-associated viruses (AAV; left) into the mPFC and implanted with somnographic electrodes (right). (B) Brain sections were stained against fluorescent protein (GFP) to confirm that GluClα and GluClβ proteins were expressed in the mPFC. Scale bar: 500 μm (left). Drawings of superimposed AAV injection sites in the mPFC are shown on the right (n = 3). (C) GFP (brown) and Fos (black) expression in two mice injected with AAV-GluClα-IVM and AAV-GluClβ-IVM into the mPFC and treated with propylene glycol (PG) or ivermectin (IVM). Scale bars: 20 μm. Blue and black arrows indicate neurons expressing GFP and Fos, respectively. (D) Time spent in slow wave sleep (SWS), REM sleep and wake between 25–48 hr after IVM treatment in mice injected with AAV-GluClα-IVM/AAV-GluClβ-IVM into the mPFC. Other abbreviations: ITR, inverted terminal repeat; CMV, cytomegalovirus; SV40, simian virus 40; EYFP, enhanced yellow fluorescent protein; ECFP, enhanced cyan fluorescent protein; Cg1, cingulate cortex; PrL, prelimbic cortex; IL, infralimbic cortex; DP, dorsal peduncular cortex.
Figure 4 with 1 supplement
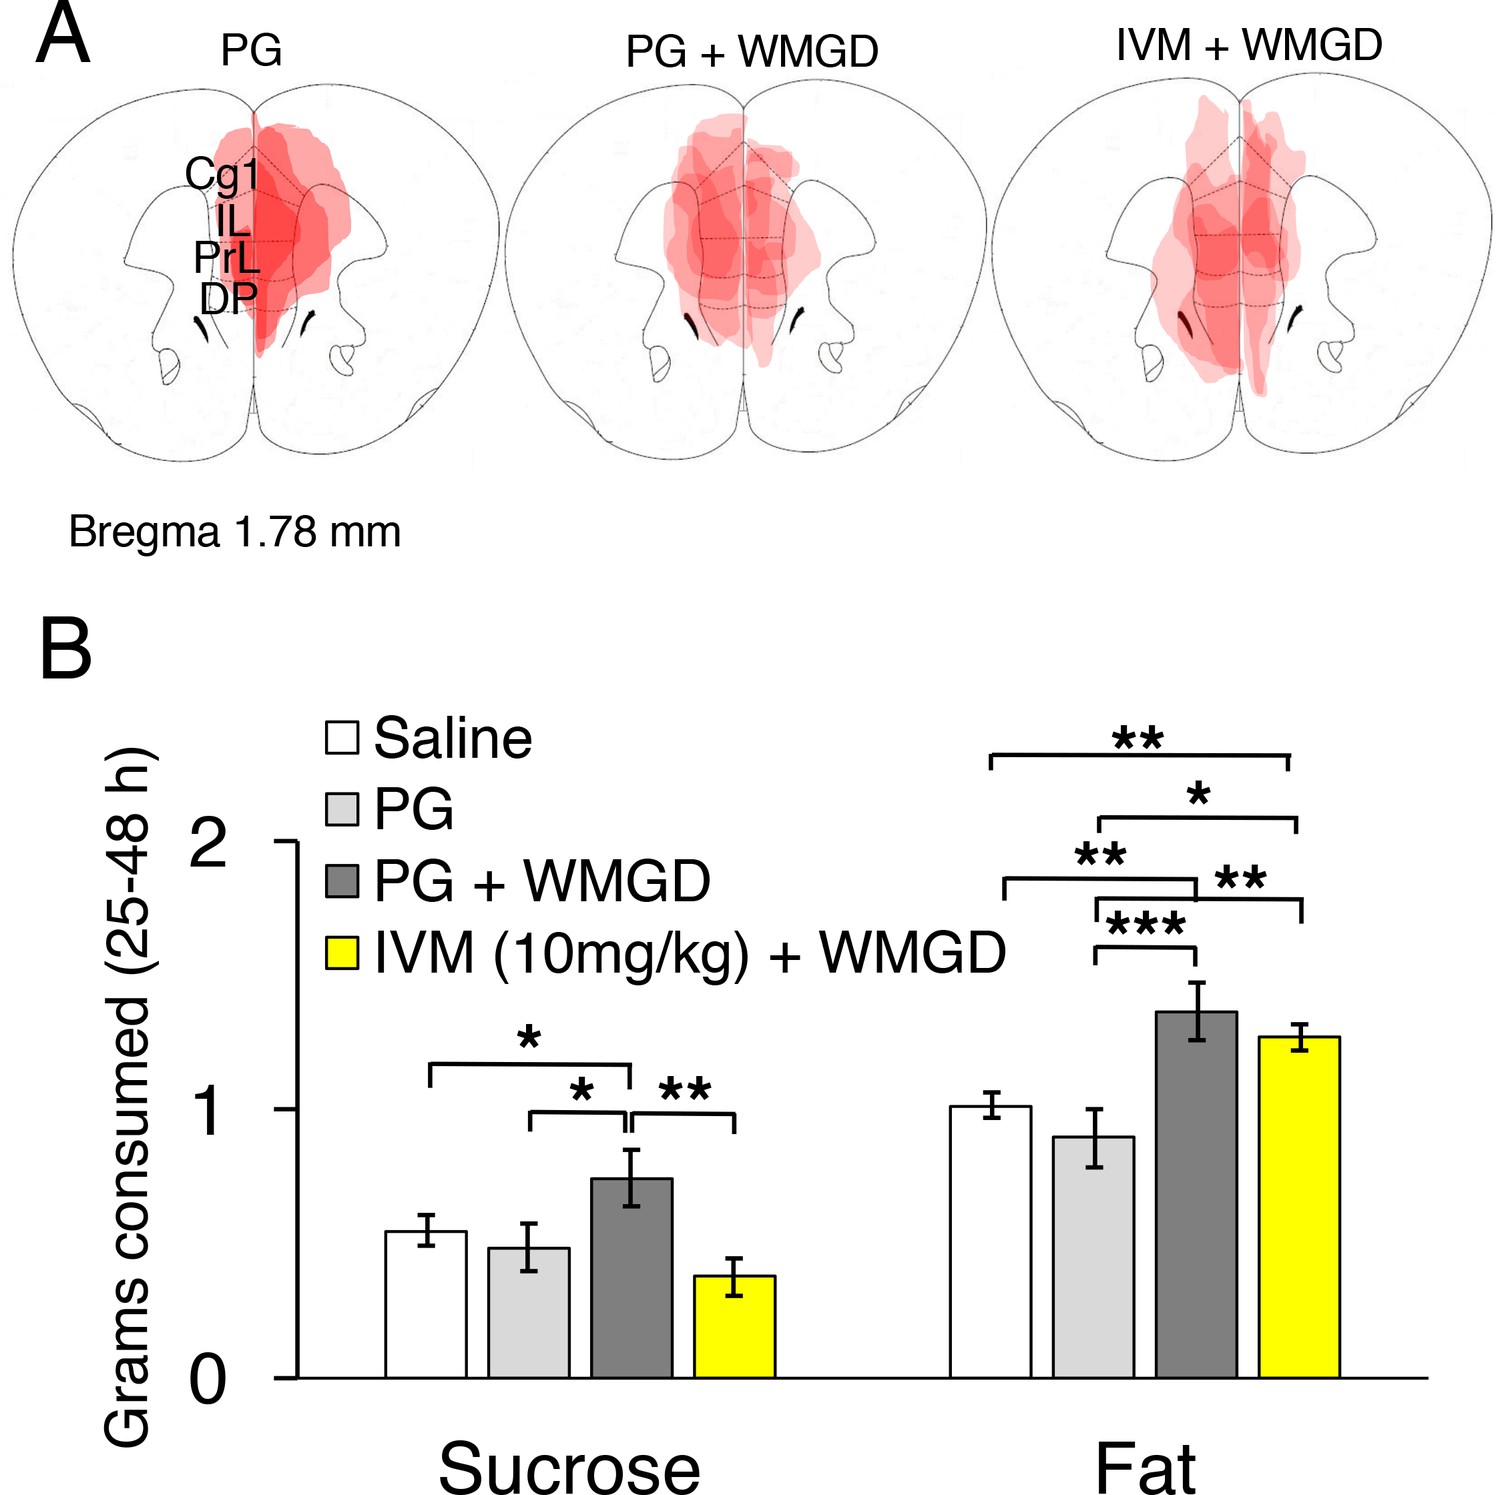
Chemogenetic inhibition of medial prefrontal cortex (mPFC) neurons reverses the effect of REM sleep loss on highly-palatable-foods consumption.
(A) Drawings of superimposed adeno-associated viruses (AAV) injection sites in the mPFC of mice used for baseline (n = 3; left panel) or wire-mesh-grid device (WMGD) experiments [n = 4 in the propylene glycol (PG), middle panel, or ivermectin (IVM), right panel, treated group]. (B) Grams of sucrose or fat consumed over a 25–48 hr period under baseline (nine wild-type mice treated with saline and three AAV-injected mice treated with PG) and WMGD [AAV-injected mice treated with PG (n = 4) or IVM (n = 4)] conditions. *p < 0.05, **p < 0.01 and ***p < 0.001 indicates significant differences between mice groups (one-tailed).
Figure 4—figure supplement 1
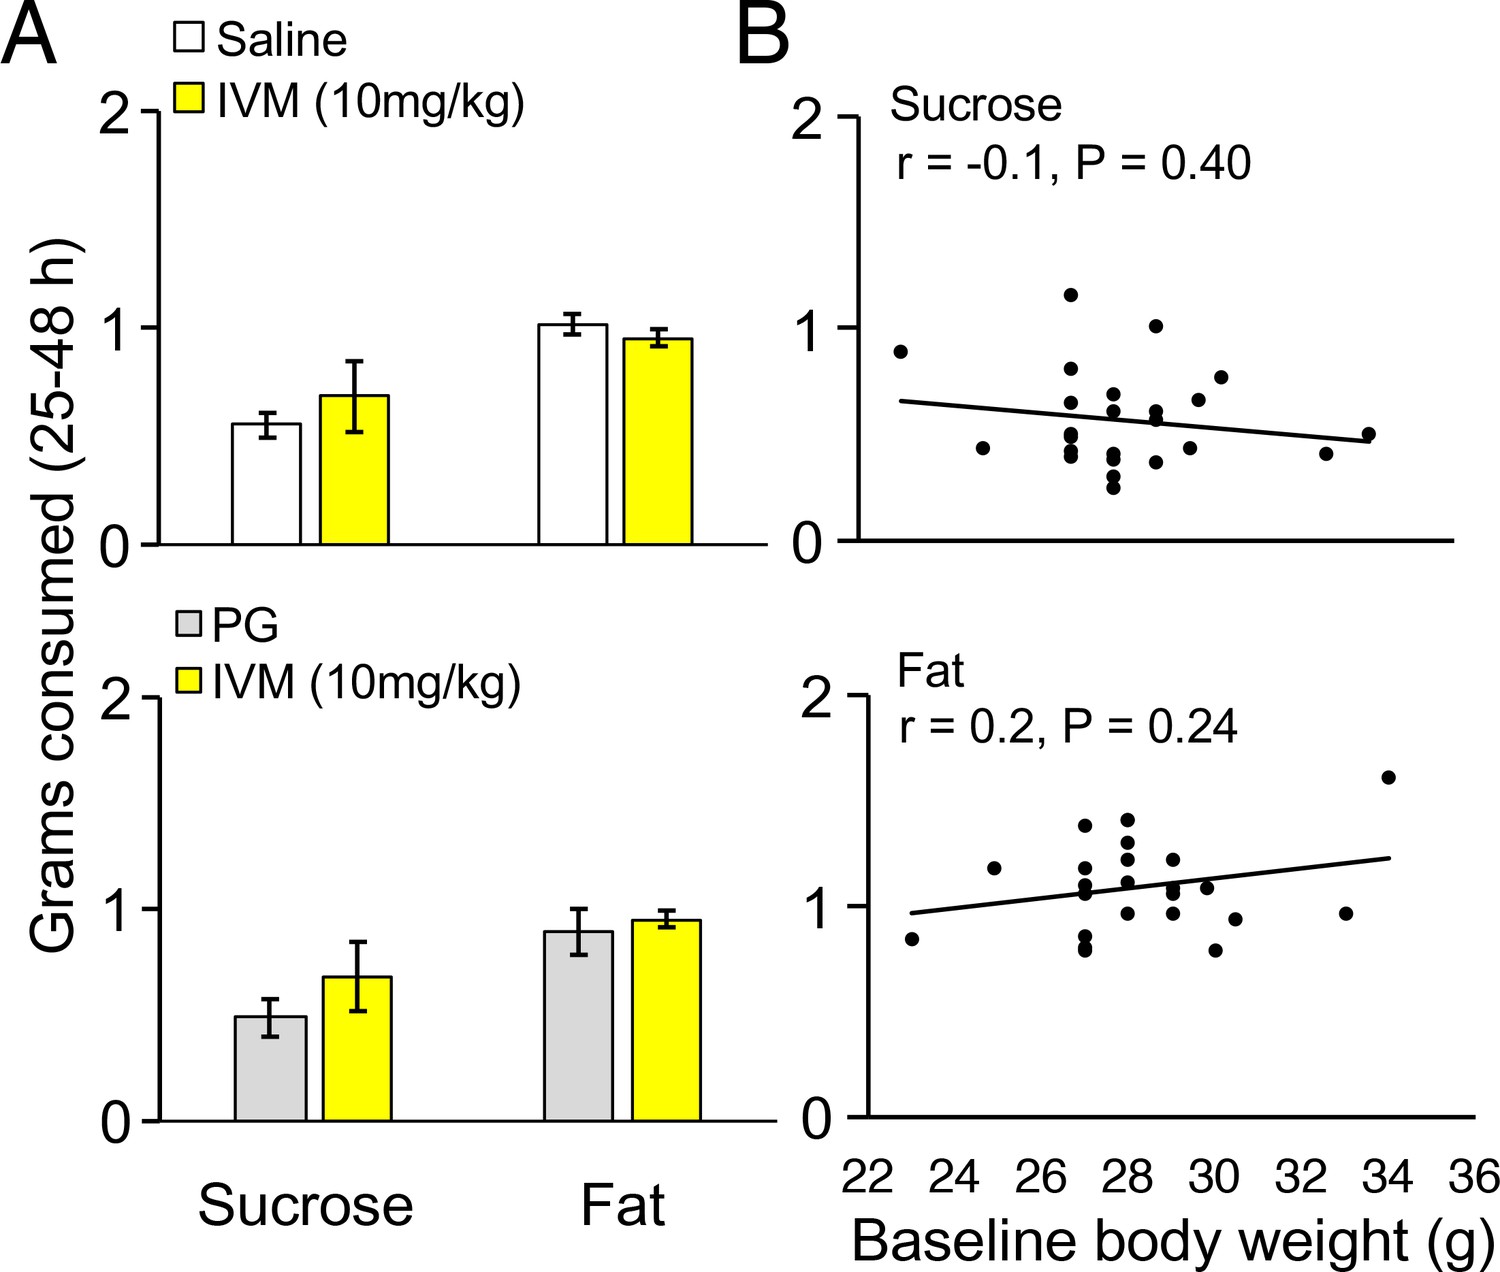
Control experiments for highly palatable foods consumption in mice.
(A) Grams of sucrose or fat consumed over a 25–48 hr period for wild-type mice treated with saline (n = 9) or AAV-injected mice treated with PG (n = 3) compared to AAV-injected mice treated with IVM (n = 4). (B) Grams of sucrose or fat consumed over a 25–48 hr period correlated with baseline body weight in grams for all mice.
Additional files
-
Supplementary file 1
Composition of the highly palatable diets used in the feeding experiments.
- https://doi.org/10.7554/eLife.20269.008
-
Supplementary file 2
Statistics reported in this study.
- https://doi.org/10.7554/eLife.20269.009
Download links
A two-part list of links to download the article, or parts of the article, in various formats.
Downloads (link to download the article as PDF)
Open citations (links to open the citations from this article in various online reference manager services)
Cite this article (links to download the citations from this article in formats compatible with various reference manager tools)
Chemogenetic inhibition of the medial prefrontal cortex reverses the effects of REM sleep loss on sucrose consumption
eLife 5:e20269.
https://doi.org/10.7554/eLife.20269


