Fatty acid analogue N-arachidonoyl taurine restores function of IKs channels with diverse long QT mutations
- University of Miami, United States
- Linköping University, Sweden
- University of Copenhagen, Denmark
Figures
Figure 1 with 4 supplements
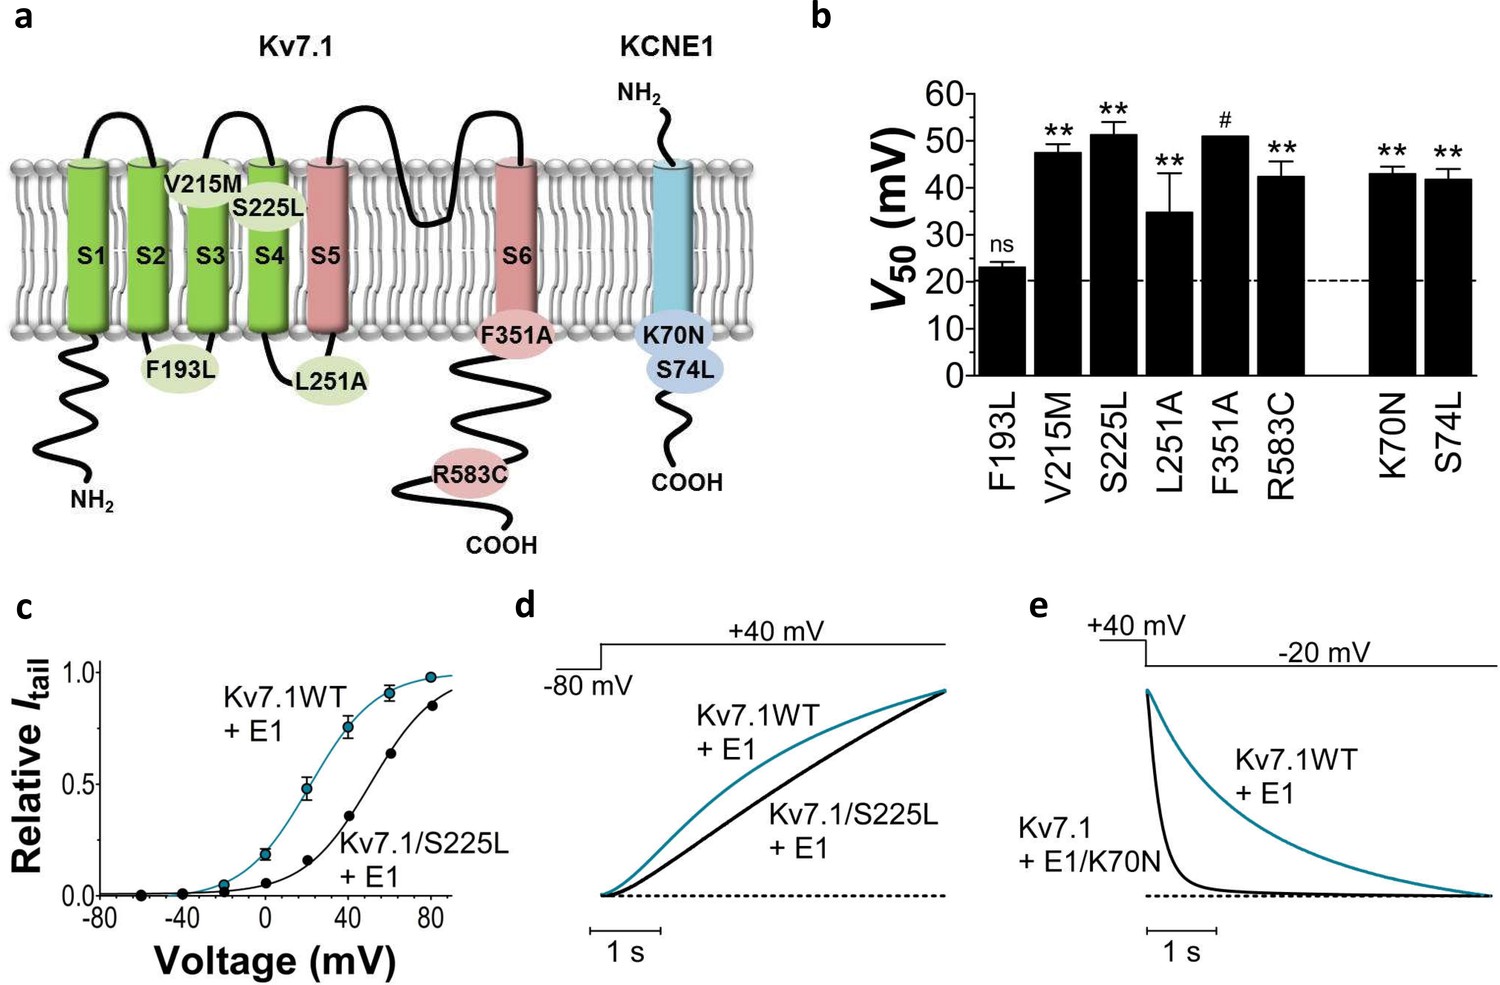
Biophysical properties of LQTS and LQTS-like KV7.1+KCNE1 channel mutants expressed in Xenopus oocytes.
(a) Topology of KV7.1 and KCNE1, and position of tested LQTS and LQTS-like mutants. (b) G(V) midpoints (V50) from the Boltzmann fits for mutants co-expressed with KCNE1. n = 5–11. Data as mean ± SEM. The statistics represent one-way ANOVA with Dunnett’s Multiple Comparison Test to compare the mutants to wild-type KV7.1+KCNE1; **p<0.01; ns is p≥0.05. # denotes lowest estimate. Dashed line denotes wild-type V50. (c) Representative example of KV7.1/S225L+KCNE1 G(V) (black line and symbols) compared to wild-type KV7.1+KCNE1 (blue line and symbols, mean ± SEM, n = 5). (d–e) Representative example of KV7.1/S225L+KCNE1 opening kinetics and KV7.1+KCNE1/K70N closing kinetics (black lines) compared to wild-type KV7.1+KCNE1 (blue lines).
Figure 1—figure supplement 1
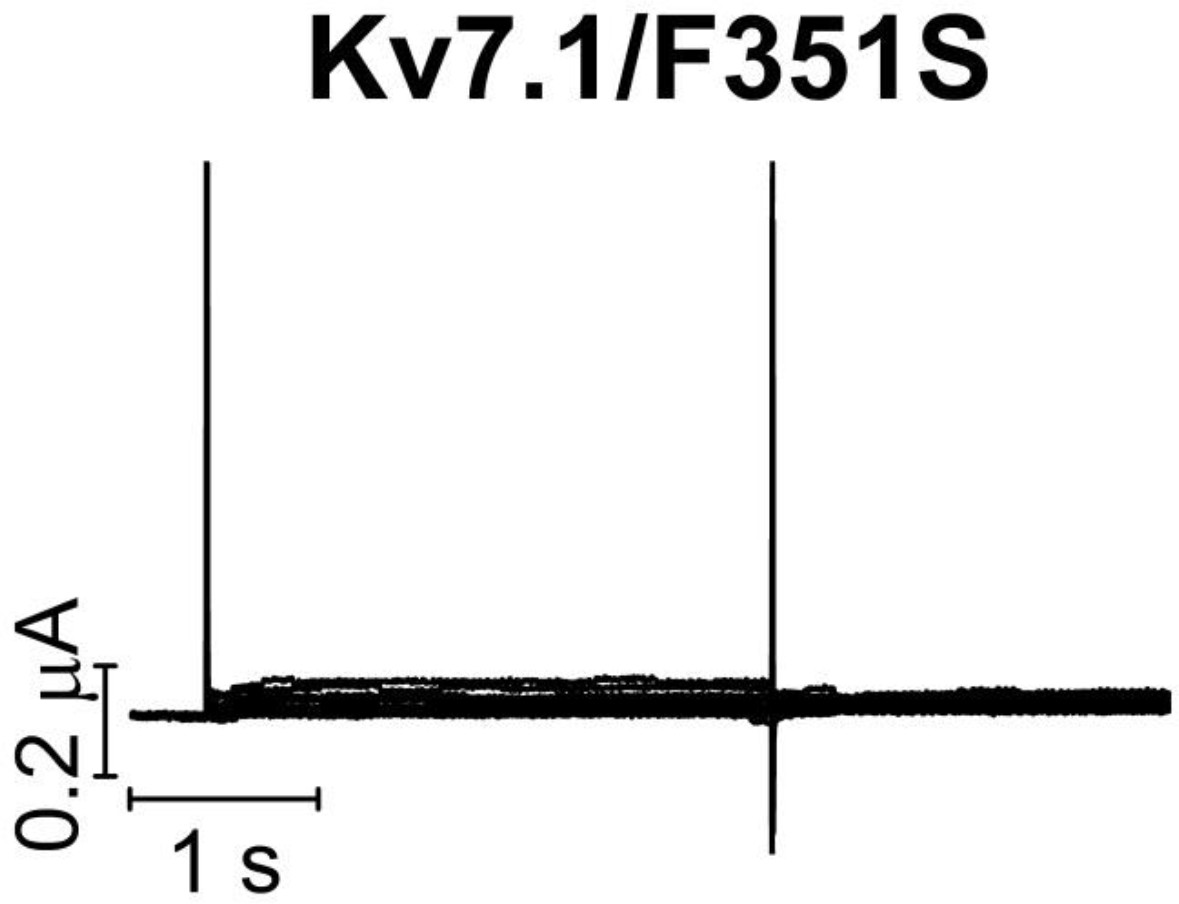
KV7.1/F351S mutant expressed in Xenopus oocytes.
The KV7.1/F351S mutant does not generate currents when expressed in Xenopus oocytes. The holding voltage is –80 mV, and test voltages range between –80 and +60 mV for 3 s in 10 mV increments. The tail voltage is –20 mV.
Figure 1—figure supplement 2

V50 of LQTS and LQTS-like KV7.1 mutants expressed in Xenopus oocytes.
G(V) midpoints (V50) for LQTS and LQTS-like mutants without co-expression of KCNE1. Mean ± SEM. n = 5–12. The statistics represent one-way ANOVA with Dunnett’s Multiple Comparison Test to compare V50 of mutant to V50 of wild-type KV7.1; **p<0.01; ns p≥0.05. Dashed line denotes wild-type V50.
Figure 1—figure supplement 3
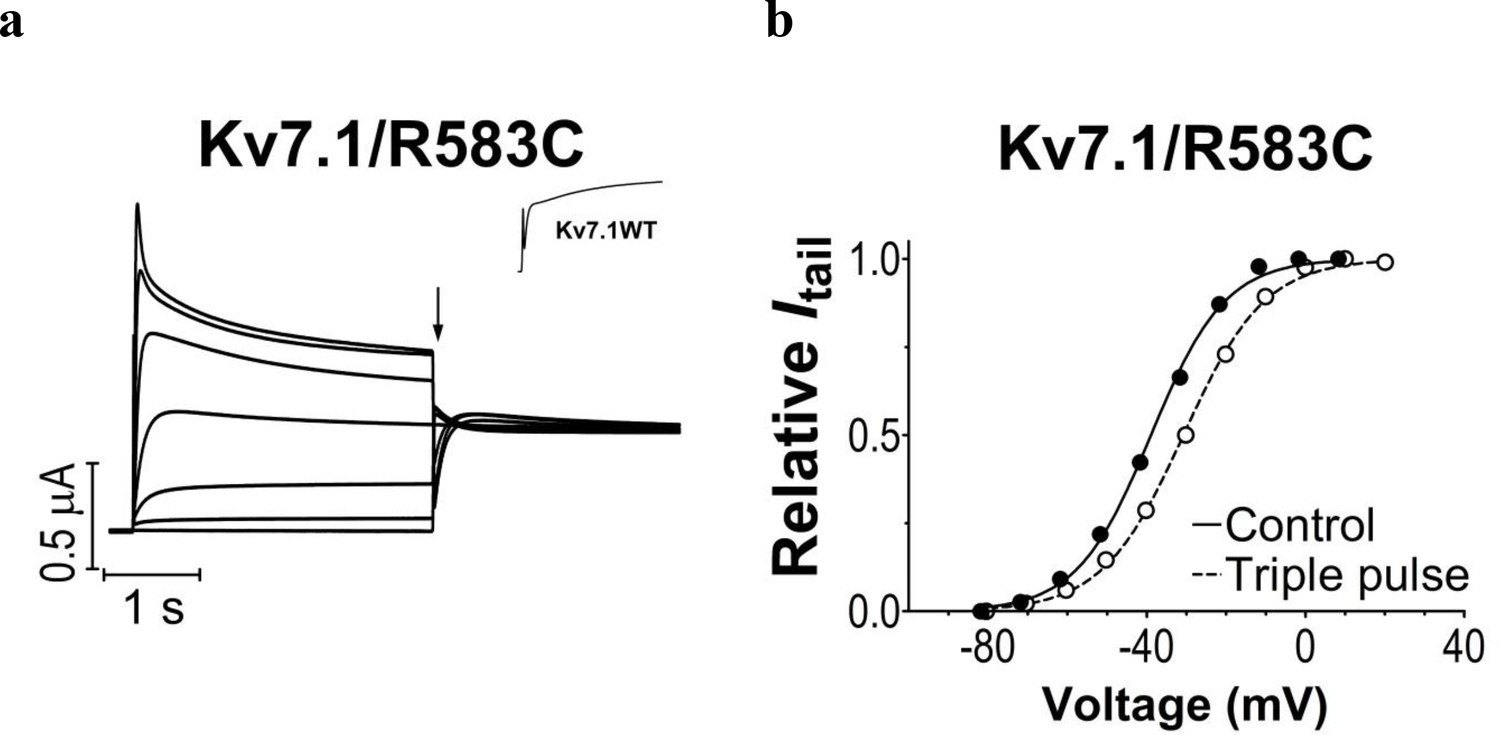
KV7.1/R583C mutant expressed in Xenopus oocytes.
(a) The KV7.1/R583C mutant generates currents that inactivate at positive voltages. The holding voltage is –80 mV, and test voltages range between –80 and +40 mV for 3 s in 20 mV increments. The tail voltage is –20 mV. Tail currents are measured at the arrow. Inset: representative current trace at +40 mV for wild-type KV7.1. (b) Representative example of G(V) curves generated using the protocol in panel a (filled circles) or a triple pulse protocol (open circles) with a brief hyperpolarizing pulse (–140 mV for 20 ms) between the test pulse and the tail pulse to release a fraction of channels from inactivation. The triple pulse protocol generates a G(V) that is shifted ~9 mV towards positive voltages (V50 = ~ –39 mV for the regular protocol and –30 mV for the triple pulse protocol), which matches the G(V) of the wild-type KV7.1 fairly well (V50 = –29.4 mV).
Figure 1—figure supplement 4
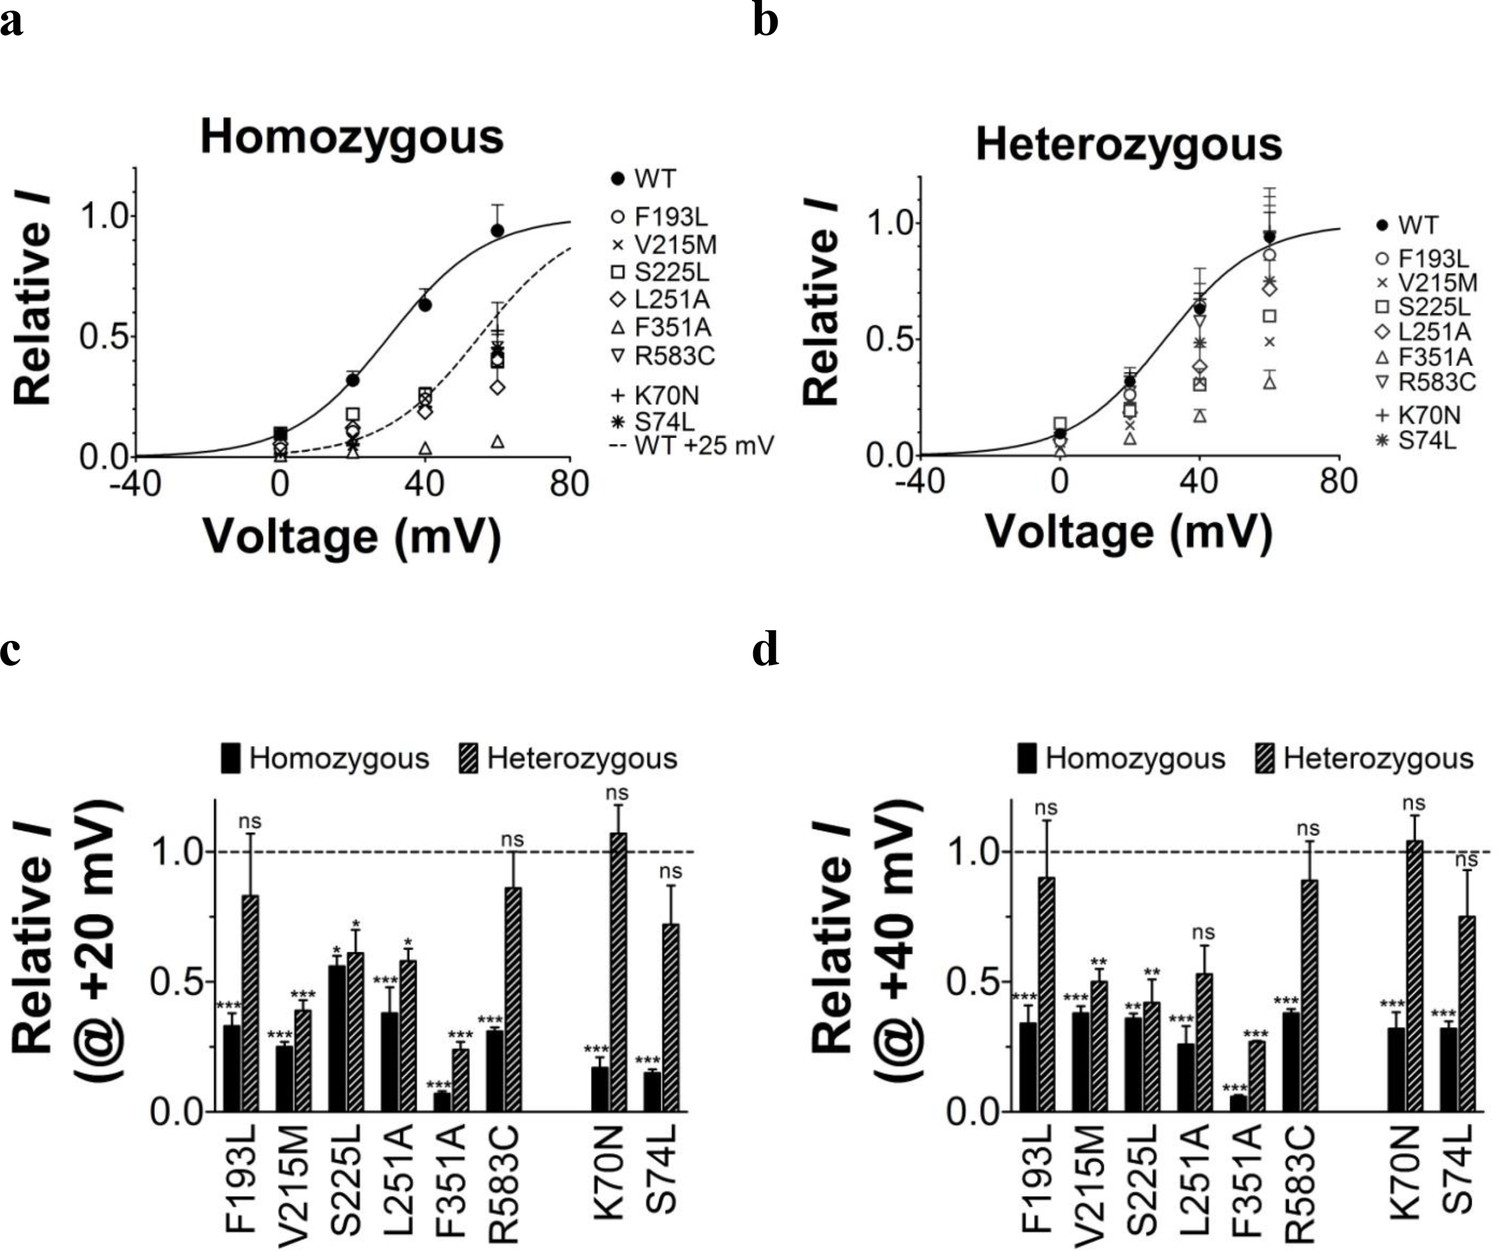
Comparison of current amplitude of wild-type KV7.1+KCNE1 and LQTS and LQTS-like mutants when expressed in Xenopus oocytes.
KV7.1 and KCNE1 were co-injected in oocytes for homozygous (a) and heterozygous (b) expression, as described in Materials and Methods. Current were recorded after two days of incubation at 16°C. The holding voltage is –80 mV, and test voltages range between 0 and +60 mV for 5 s in 20 mV increments. The tail voltage is –20 mV. Current amplitudes at the end of the 5 s test pulse are normalized to the wild-type KV7.1+KCNE1 current amplitude at +60 mV recorded in the same batch of oocytes. Dashed line in (a) is the wild-type curve shifted +25 mV. (c–d) Detailed comparison of current amplitudes at +20 mV (c) and +40 mV (d). Mutant current amplitudes are normalized to the wild-type KV7.1+KCNE1 current amplitude at indicated voltage. Dashed lines denote relative wild-type KV7.1+KCNE1 current amplitude (=1). The statistics represent one-way ANOVA with Dunnett’s Multiple Comparison Test to compare the current amplitude of mutants to wild-type current amplitudes. *p<0.05; **p<0.01; ***p<0.001; ns is p≥0.05. Mean ± SEM. n = 4–12.
Figure 2
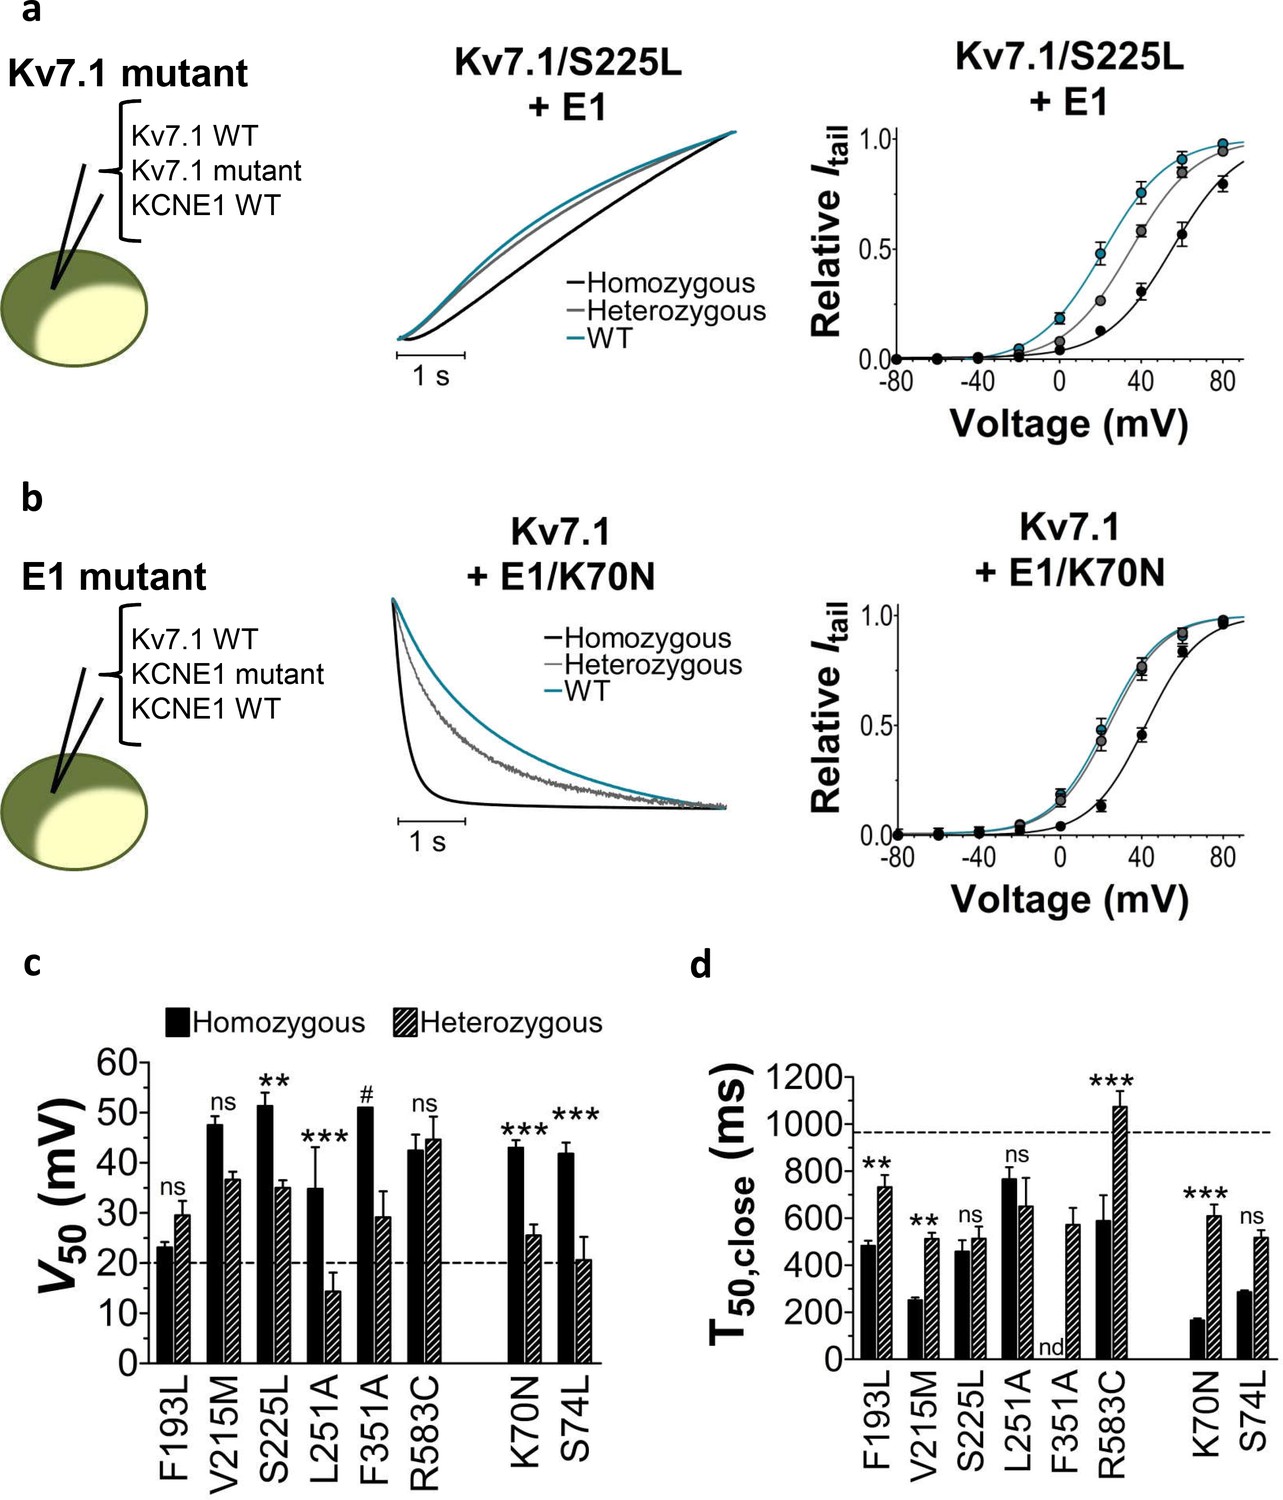
Comparison of homozygous and heterozygous expression of LQTS and LQTS-like mutants.
(a–b) Representative example of kinetics (middle panel) and G(V) (right panel) for homozygous expression and heterozygous expression of S225L (a) and K70N (b). Currents in response to steps from –80 mV to +40 mV (a, middle pane) and from +40 mV to –20 mV (b, middle panel). Homozygous expression (black), heterozygous expression (gray), and KV7.1+KCNE1 wild-type (blue). n = 7–13. (c–d) Summary of V50 (c) and T50 for closing (d) for homozygous and heterozygous expression. Data as mean ± SEM. n = 5–13. The statistics represent one-way ANOVA with pair-wise Bonferroni’s Test to compare homozygous and heterozygous expression; **p<0.01; ***p<0.001; ns is p≥0.05. # denotes lowest estimate. Not determined (nd). The statistics was not calculated for F351A. Dashed lines denote corresponding values for wild-type KV7.1+KCNE1.
Figure 3 with 3 supplements
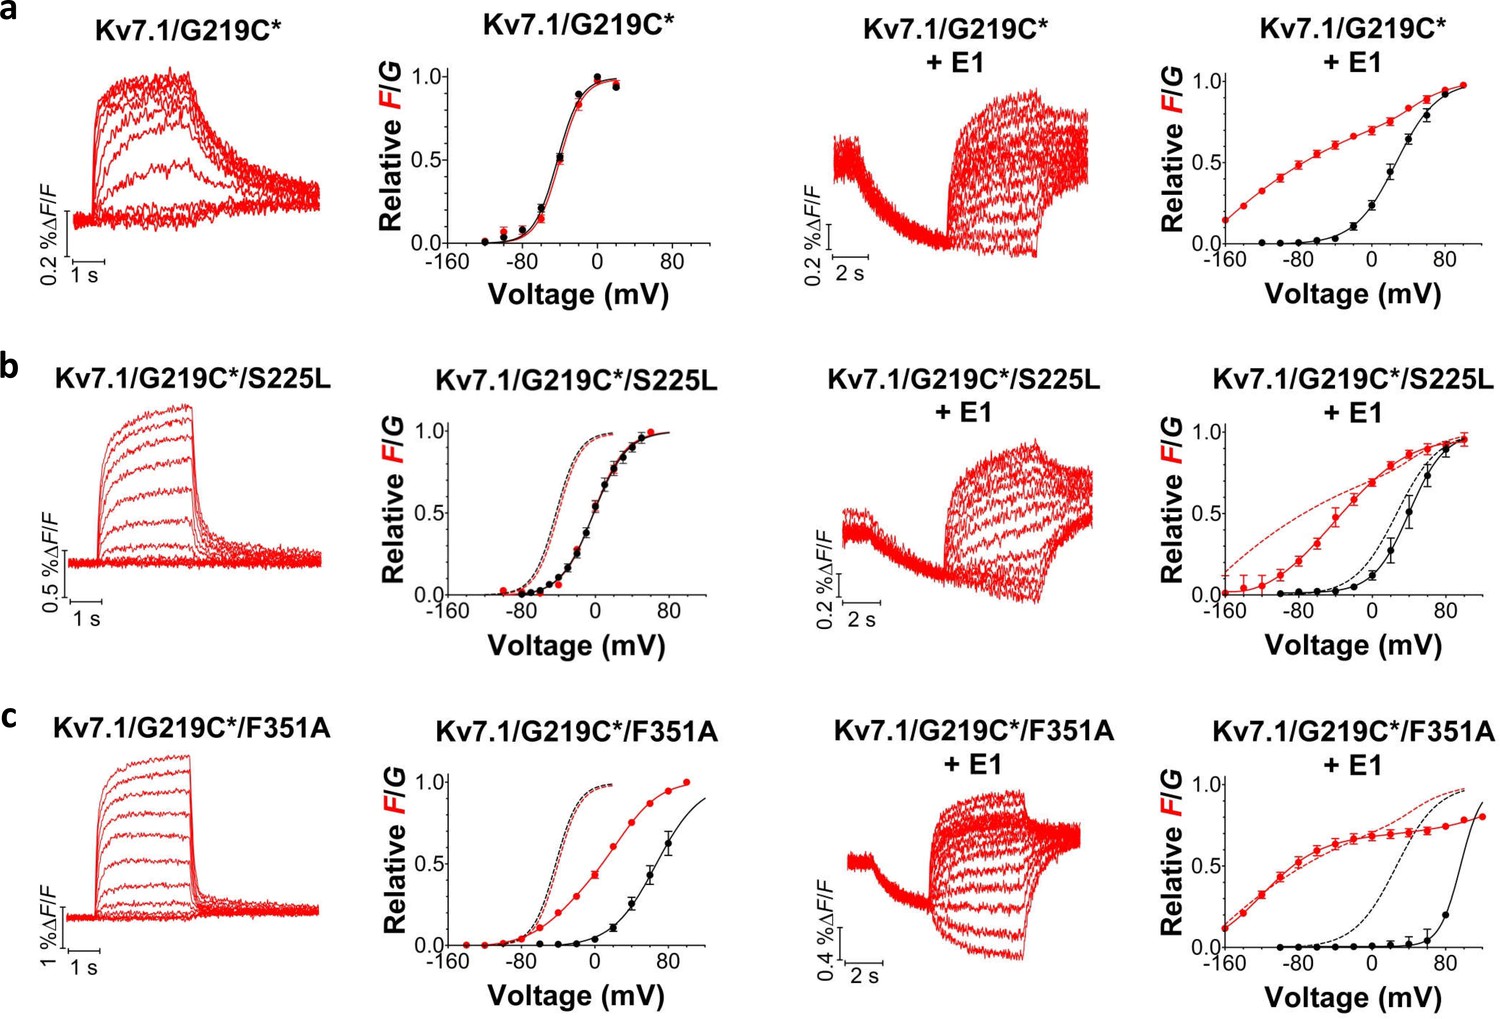
Voltage-clamp fluorometry recordings of wild-type and mutated KV7.1+KCNE1 channels.
(a-c) Representative fluorescence traces and mean F(V)/G(V) curves for KV7.1/G219C* (a), S225L (b), and F351A (c). Left panels without KCNE1 and right panels with KCNE1. The holding voltage is –80 mV, the pre-pulse –120 mV for 2 s (left panels) and –160 mV for 5 s (right panels), and test voltages between –140 and +80 mV for 3 s (left panels) and between –160 and +80 mV for 5 s (right panels) in 20 mV increments. The tail voltage is –80 mV (left panels) and −40 mV (right panels). For KV7.1/G219C*/F351A+KCNE1, the pre-pulse is –120 mV for 3 s, and test voltages ranging between –160 and +100 mV. The bottom of the fit of the KV7.1/G219C*/S225L+KCNE1 F(V) curve (which saturates fairly well at negative voltages) is set to 0 in the normalized F(V) curves in the right panels. The F1 amplitude of KV7.1/G219C*/F351A+KCNE1 is normalized to the F1 amplitude of wild-type. Data as mean ± SEM. n = 4–14. The dashed lines in (b) and (c) denote F(V) (red) and G(V) (black) for wild-type (from a).
Figure 3—figure supplement 1

Kinetic models for KV7.1 and KV7.1+KCNE1 channel gating.
(a) A 10-state allosteric gating scheme for KV7.1 channels. Horizontal transitions represent independent S4 movements that increase the fluorescence to an intermediate level (which generates the F1 component). The vertical transition represents concerted channel opening with a concomitant additional fluorescence increase (which generates the F2 component). Cartoon shows KV7.1 channel labeled with a fluorophore on S3-S4 with all four voltage sensors in the resting state (C0), with one (C1), or four (C4) voltage sensor activated in the closed channel (top) or with all four voltage sensors in the resting state (O0), with one (O1), or four (O4) voltage sensor activated with the channel opened (bottom). (b) A 6-state allosteric gating scheme for KV7.1+KCNE1 channels. Horizontal transitions represent independent S4 movements that increase the fluorescence to an intermediate level (which generates the F1 component). The vertical transition represents concerted channel opening with a concomitant additional fluorescence increase (which generates the F2 component). Cartoon shows KV7.1 channel labeled with a fluorophore on S3-S4 with all four voltage sensors in the resting state (C0), with one (C1), or four (C4) voltage sensor activated without channel opening (top) that is followed by a concerted conformational change of all four S4s associated with channel opening (O4) (bottom).
Figure 3—figure supplement 2

Simulations of wild-type and mutant KV7.1 and KV7.1+KCNE1 channels reproduce currents and fluorescence.
Simulated G(V) (black) and F(V) (red) curves for (a) wild-type, (b) S225L, and (c) F351A KV7.1 (left) and KV7.1+KCNE1 (right) channels using the KV7.1 and KV7.1+KCNE1 models in Figure 3—figure supplement 1. Parameters for the wild-type models were determined in earlier studies (see Supplementary file 4 for all rate constants). Current and fluorescence traces were simulated using Berkeley Madonna (Berkeley, CA).
Figure 3—figure supplement 3
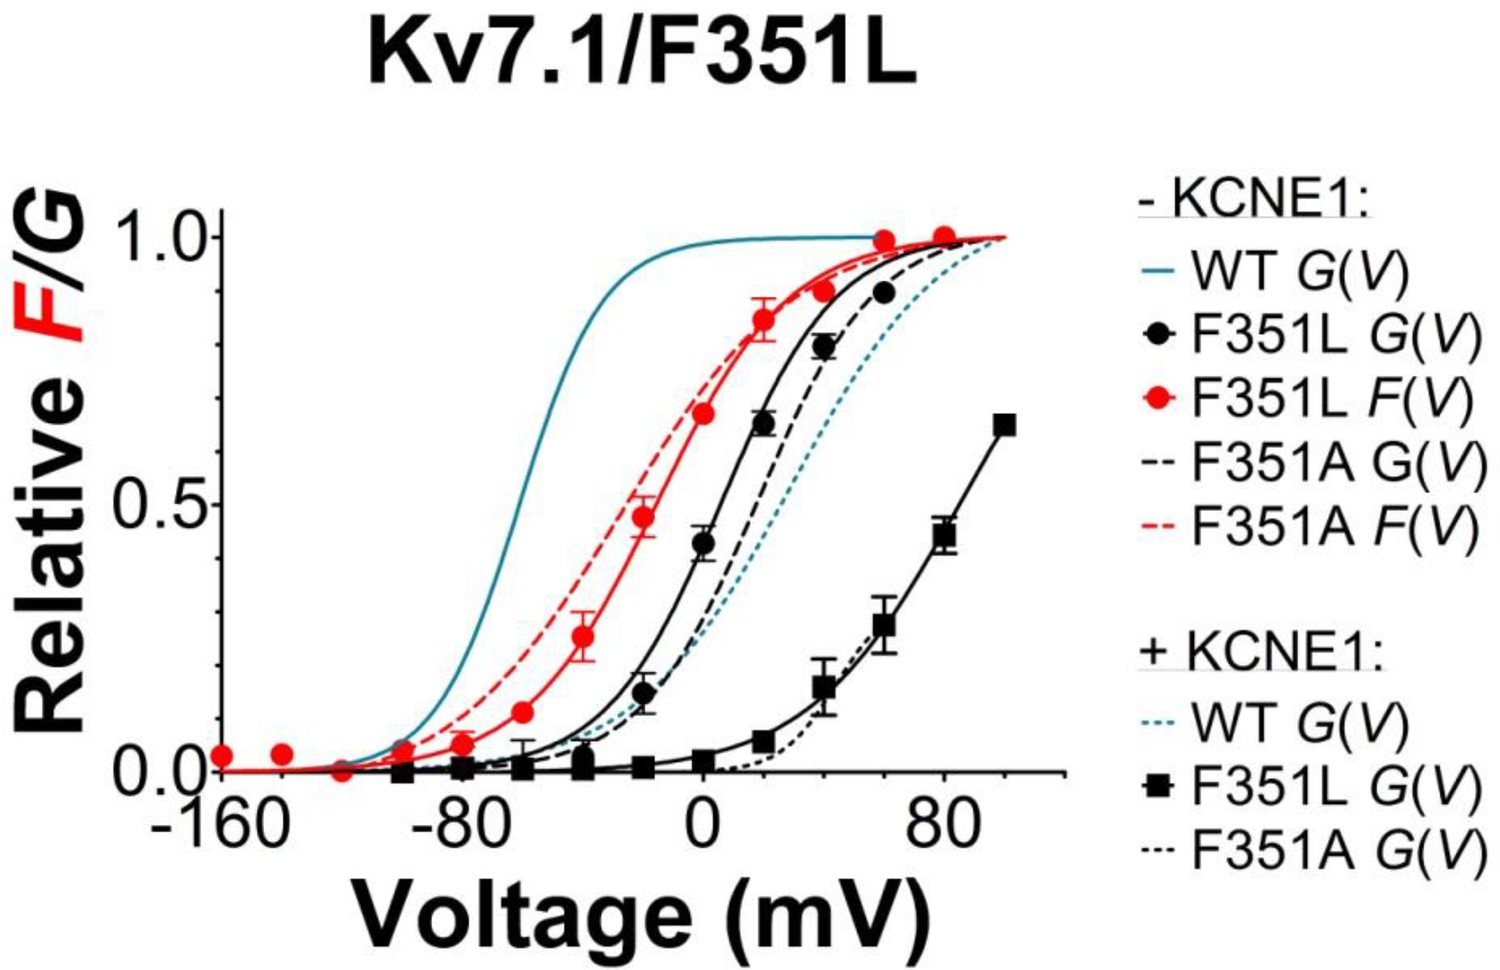
Voltage-clamp fluorometry recordings of the KV7.1/G219C*/F351L mutant with and without KCNE1 co-expressed.
Mean F(V)/G(V) curves for KV7.1/G219C*/F351L (mean ± SEM) are shown together with corresponding mean F(V)/G(V) curves for WT KV7.1/G219C* (blue lines) and KV7.1/G219C*/F351A (dashed red/black lines). Experiments are performed and data normalized as described in Figure 3. Note that all data presented in this graph are done on constructs with a Kv7.1/C214A/C331A background (Barro-Soria et al., 2014; Barro-Soria and Perez, 2015). The F(V)/G(V) curves are therefore shifted towards negative voltages compared the data presented in Figure 3 (which are done in WT background). n = 4–6.
Figure 4 with 4 supplements
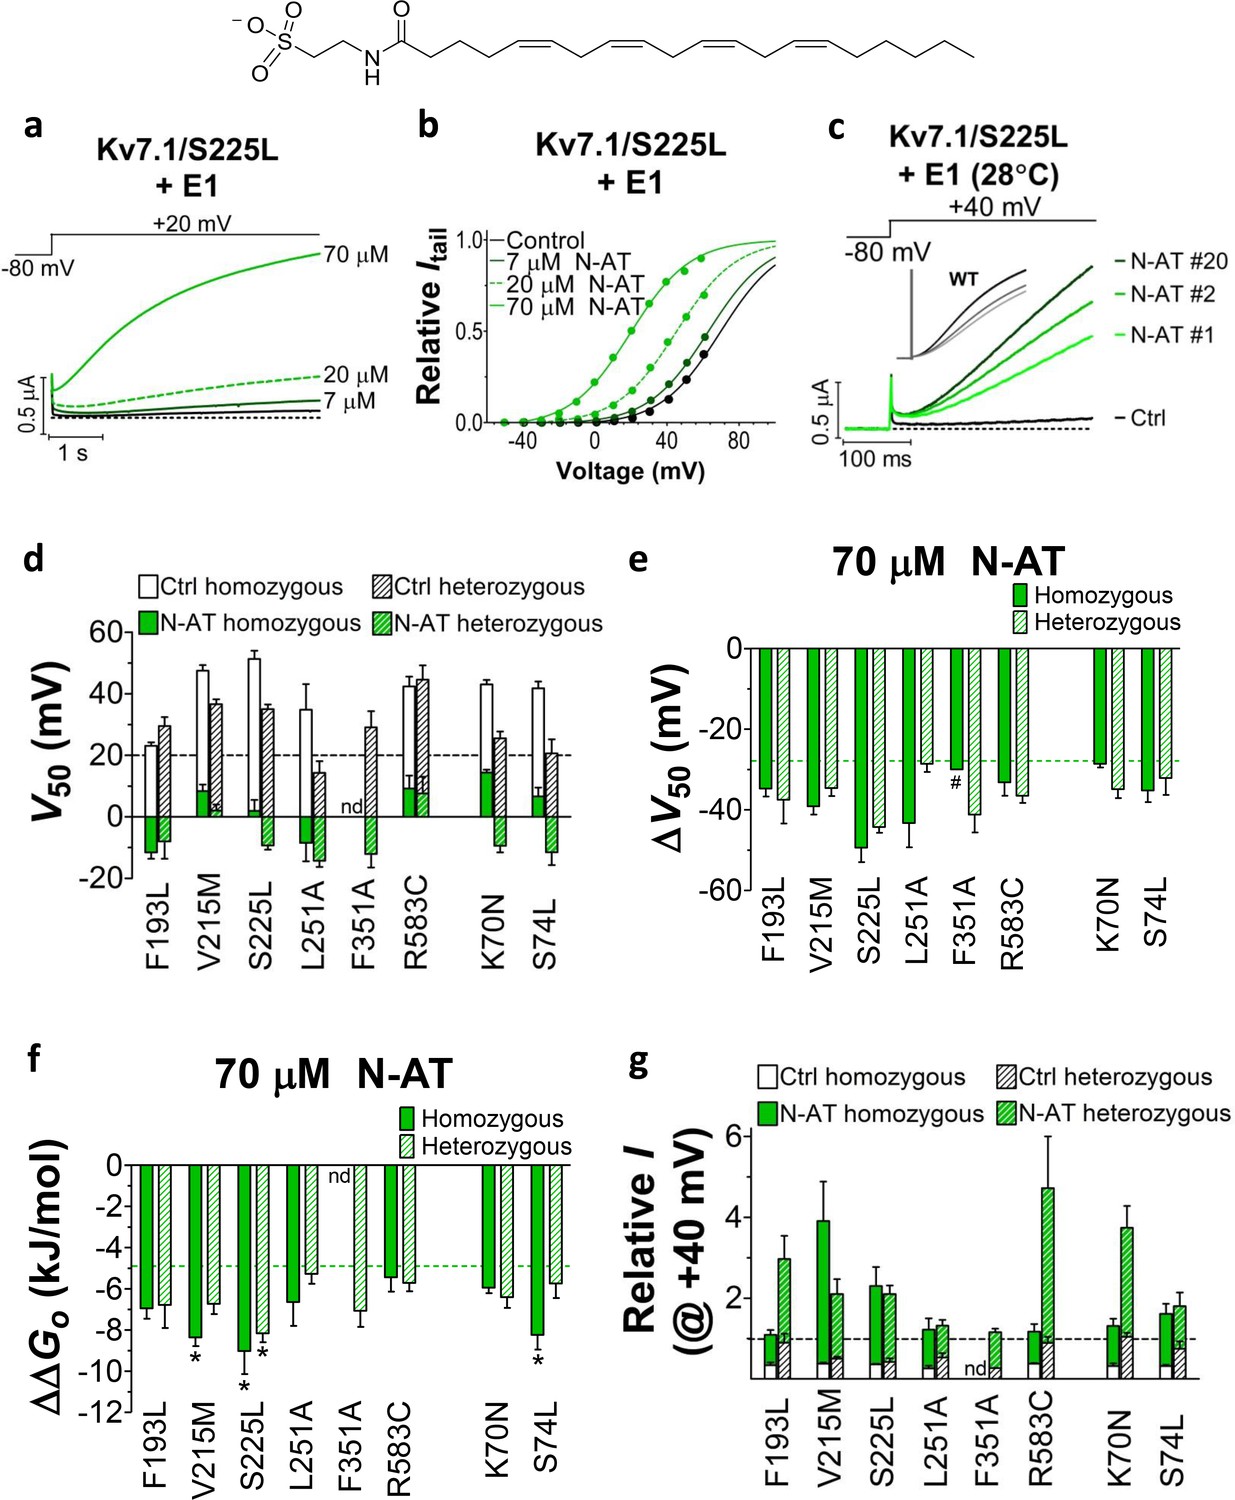
Effect of N-AT on LQTS and LQTS-like mutants.
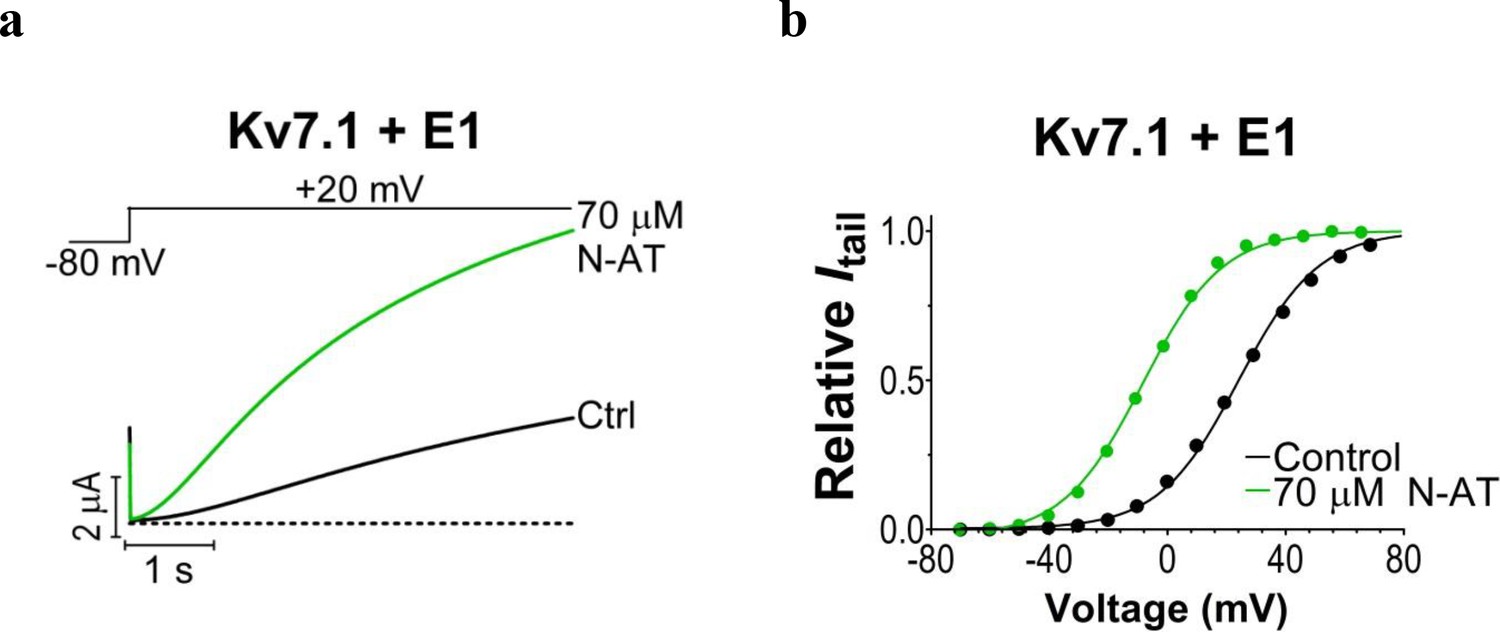
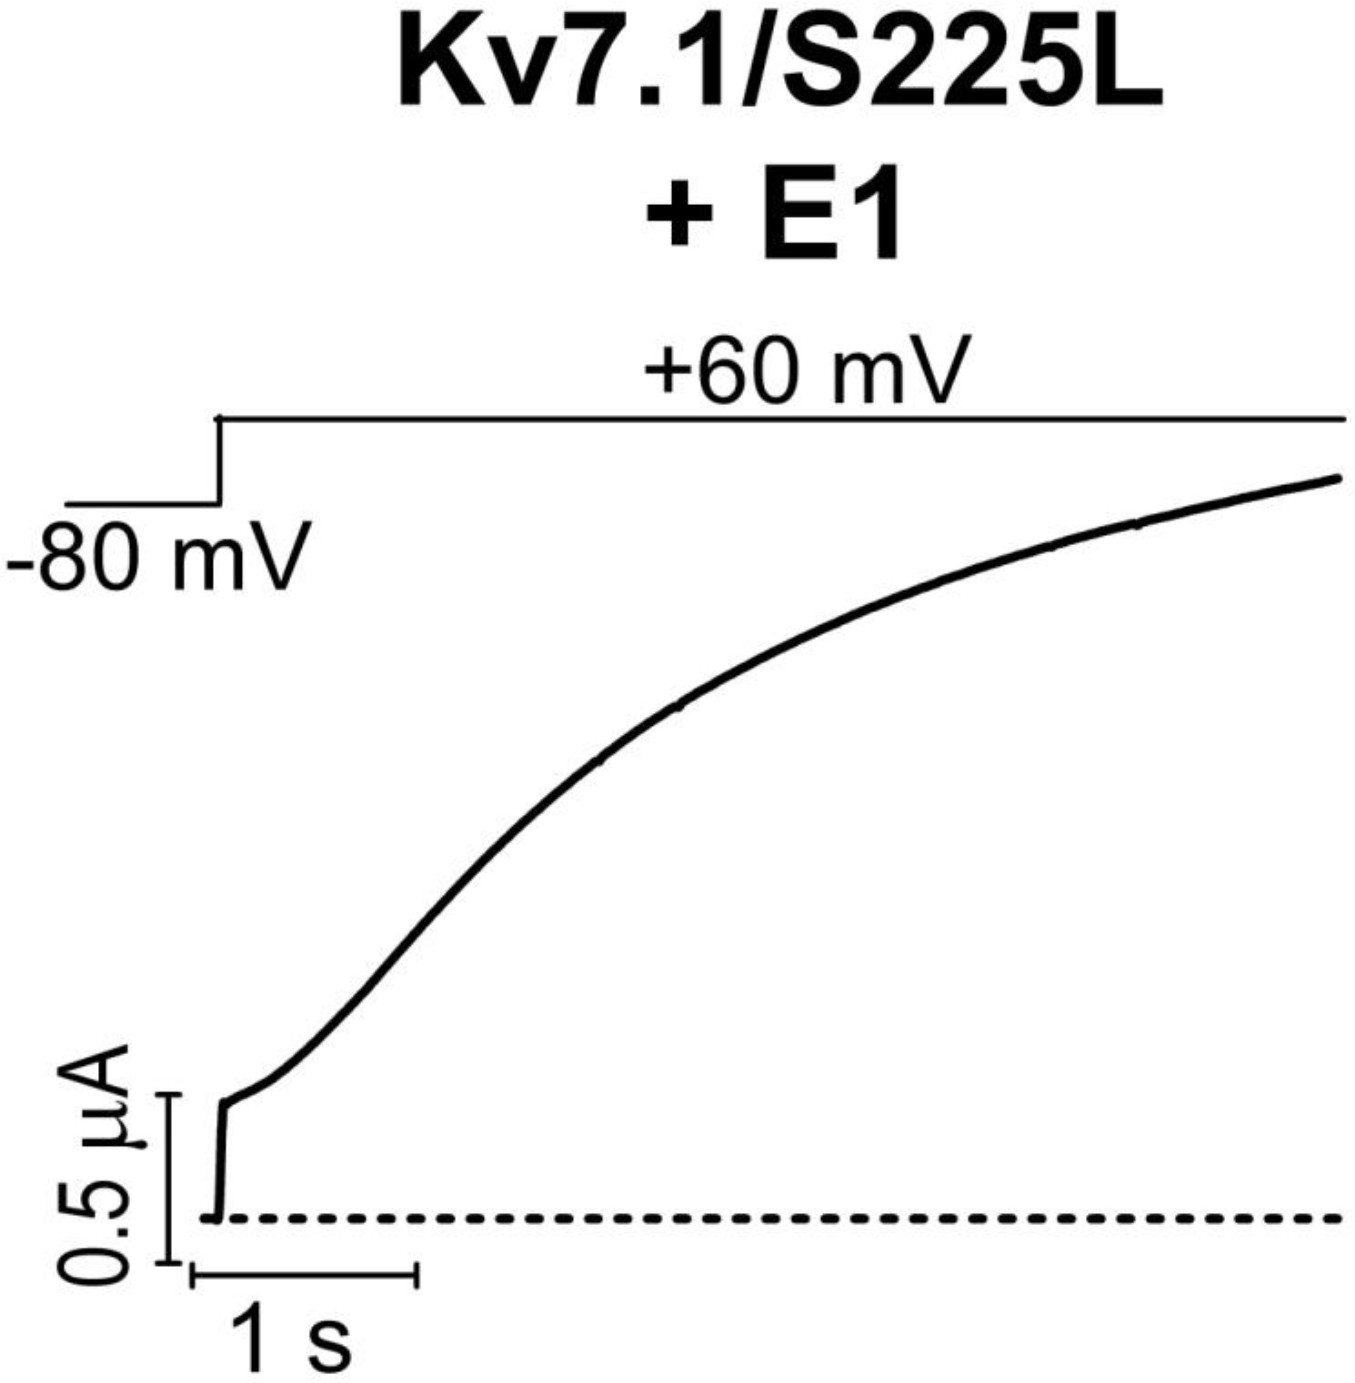
All these experiments are done in the presence of KCNE1. Structure of N-AT is shown. (a–b) Representative effect of 7–70 µM N-AT on current amplitude (a) and G(V) (b) of KV7.1/S225L+KCNE1. Dashed line in (a) denotes 0 µA. (c) Representative currents generated by KV7.1/S225L+KCNE1 during pulsing at 1 Hz and +28°C in control solution (black) and after the cell had been bathed continuously in 70 µM N-AT (light to dark green, # denotes sweep order). Inset: corresponding currents from wild-type KV7.1+KCNE1 scaled similarly as KV7.1/S225L+KCNE1. Light grey trace denotes sweep #1, grey trace denotes sweep #2, and dark grey trace denotes sweep #20. (d) Summary of V50 for LQTS and LQTS-like mutants before and after 70 µM N-AT application. Dashed line denotes V50 for wild-type KV7.1+KCNE1. (e–f) Summary of ΔV50 (e) and ΔΔGo (f) for LQTS and LQTS-like mutants induced by 70 µM N-AT. # denotes an approximation. Dashed lines denote corresponding ΔV50 and ΔΔGo induced by 70 µM N-AT for wild-type KV7.1+KCNE1. The statistics in (f) represent one-way ANOVA with Dunnett’s Multiple Comparison Test to compare the N-AT-induced change in ΔΔGo of mutants to N-AT-induced change in ΔΔGo of wild-type KV7.1+KCNE1; *p≤0.05. Only significant differences shown in (f), other comparisons have p>0.05. (g) Estimate of the ability of 70 µM N-AT to restore LQTS and LQTS-like mutant current amplitude at +40 mV. The mean N-AT induced increase in current amplitude for each mutant (from Figure 4—figure supplement 4b) is multiplied with the control amplitude for each mutant (from Figure 1—figure supplement 4d). Not determined (nd). Data as mean ± SEM. n = 5–12. Dashed line denotes relative wild-type KV7.1+KCNE1 current amplitude in control solution (i.e. without N-AT).
Figure 4—figure supplement 1
N-AT effect on wild-type KV7.1+KCNE1 expressed in Xenopus oocytes.
Representative effect of 70 µM N-AT on current amplitude (a) and G(V) (b) of wild-type KV7.1+KCNE1. The holding voltage is –80 mV and the tail current amplitude in (b) measured at –20 mV after 5 s test pulses. Dashed line in (a) denotes 0 µA current. G(V) curves in (b) are normalized to the fitted Gmax(as described in Materials and methods).
Figure 4—figure supplement 2

The time course of N-AT wash-in on KV7.1/S225L+KCNE1 expressed in Xenopus oocytes.
Representative example showing that N-AT effects on current amplitude reaches steady state for each concentration within minutes. The holding voltage is –80 mV and current amplitude measured at the end of a 5 s test pulse to +20 mV. Dashed line denotes baseline (control amplitude).
Figure 4—figure supplement 3
‘Leak’ component of KV7.1/S225L+KCNE1.
Currents generated by the KV7.1/S225L+KCNE1 mutant have a small instantaneous ‘leak’ component at positive voltages. Dashed line denotes 0 µA.
Figure 4—figure supplement 4
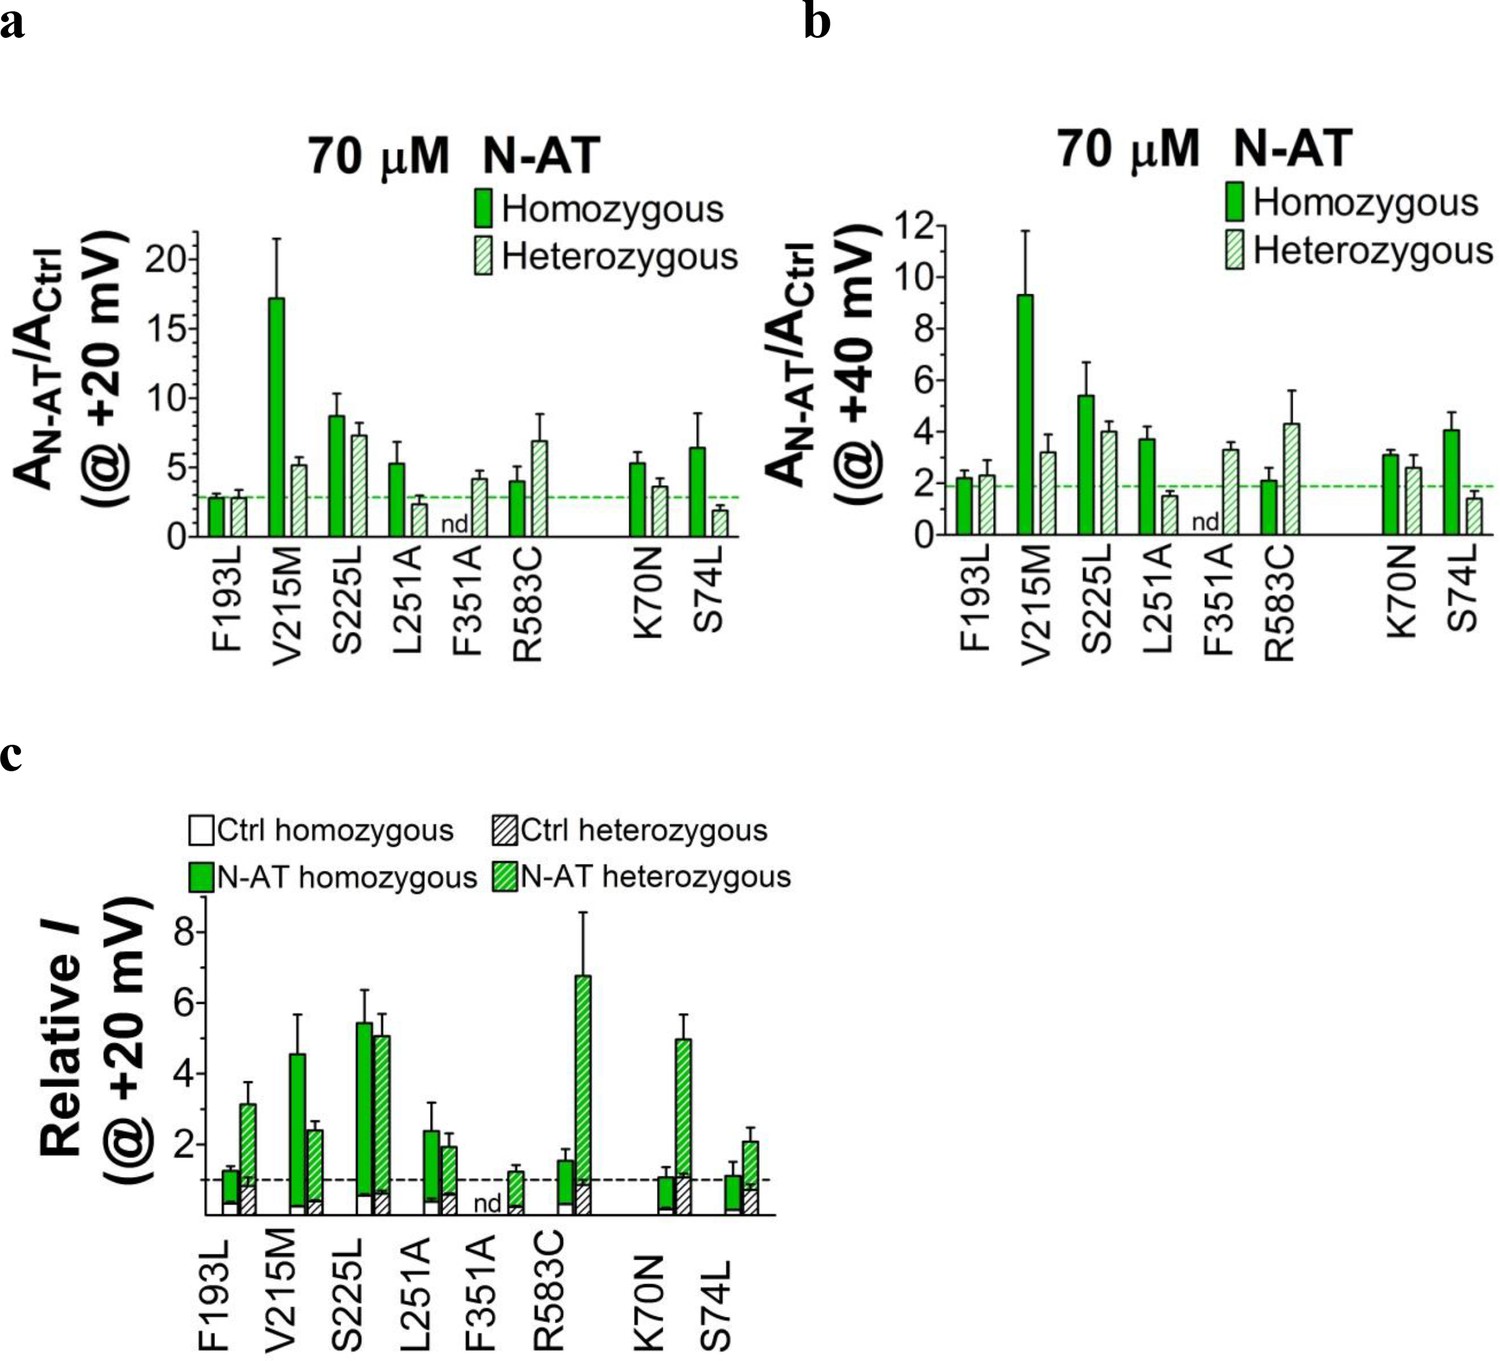
Effect of N-AT on current amplitude of LQTS and LQTS-like mutants.
(a-b) Current amplitudes in the presence of 70 µM N-AT measured at the end of a 5 s test pulse to +20 mV (a) or +40 mV (b). The currents are normalized to the current amplitude in control solution in the same oocyte. Dashed lines denote N-AT effects on wild-type KV7.1+KCNE1 current amplitude (a factor 2.9 ± 0.4 and 1.9 ± 0.3 (n = 5), respectively). (c) Ability of 70 µM N-AT to restore LQTS and LQTS-like mutant current amplitude at +20 mV. The mean N-AT-induced fold increase in current amplitude for each mutant (data from panel a) is multiplied by the relative current amplitude for each mutant compared to wild-type KV7.1+KCNE1 in control solution (from Figure 1—figure supplement 4). Dashed line denotes relative wild-type KV7.1+KCNE1 current amplitude in control solution (i.e. without N-AT). Mean ± SEM. n = 4–12. nd = not determined.
Figure 5 with 1 supplement
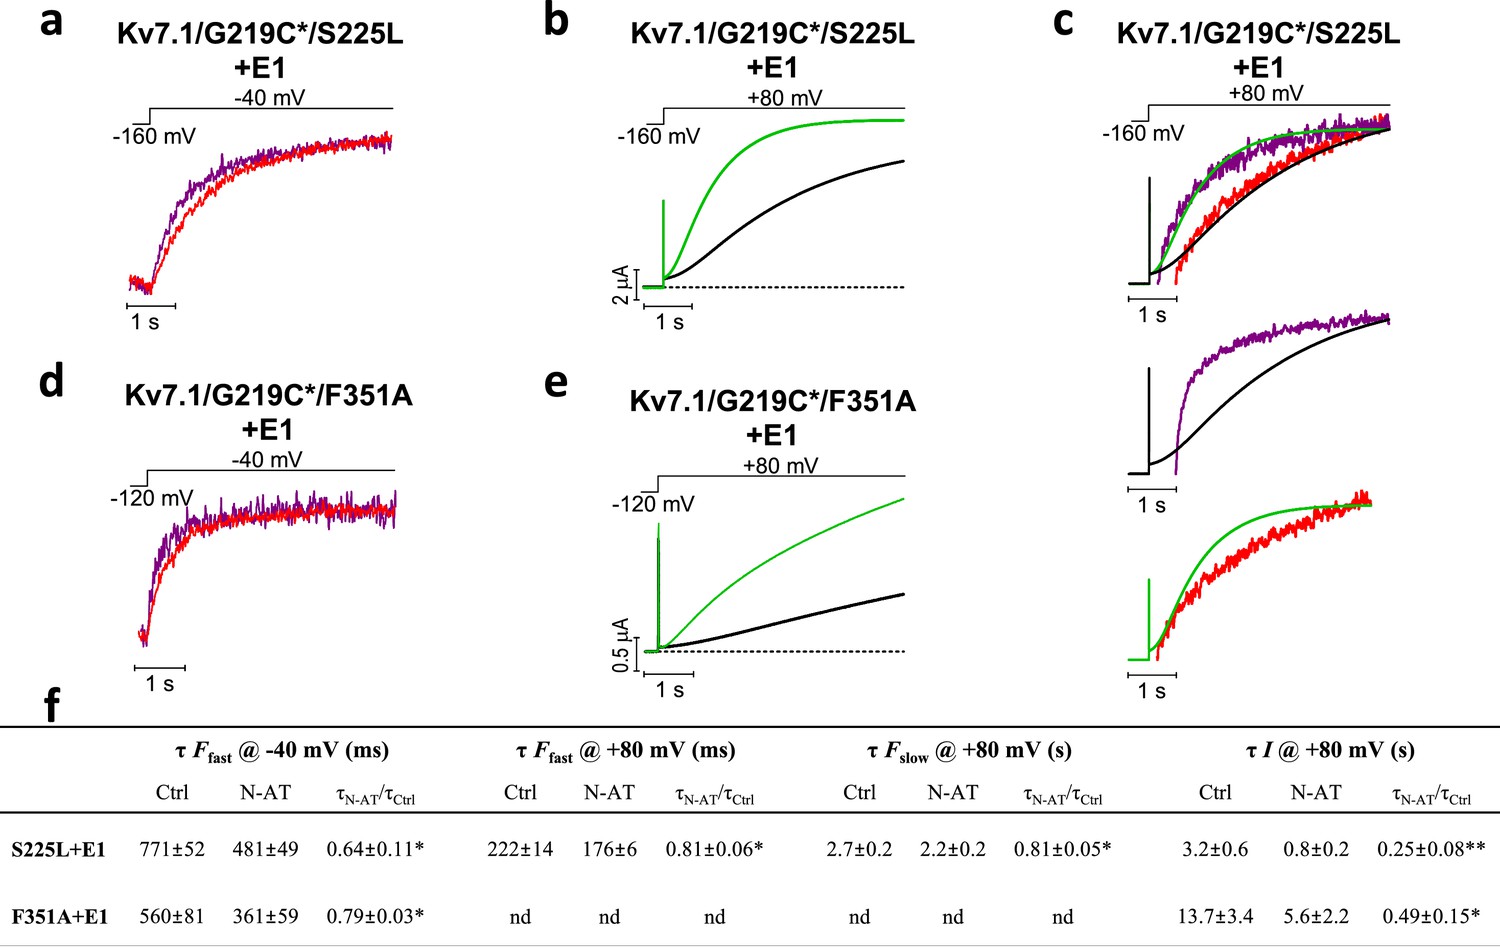
Effect of 70 µM N-AT on S4 movement and gate opening in S225L and F351A mutants.
(a–c) Representative example of the effect of 70 µM N-AT on F1 kinetics (a), current opening kinetics (b), and F2 kinetics (c) in KV7.1/G219C*/S225L+KCNE1. Control fluorescence (red) and current (black). N-AT fluorescence (magenta) and current (green). Top in (c) shows an overlay of the later part of the fluorescence (after most of F1 has occurred) and the later part of the currents (after the initial delay) before and after application of N-AT. Middle and lower (c) show that there is not a great overlap of the fluorescence in the presence of N-AT and the current in control solution (middle) or the fluorescence in control solution and the current in the presence of N-AT (lower). (d–e) Representative example of effect of 70 µM N-AT on F1 kinetics (d) and current opening kinetics (e) in KV7.1/G219C*/F351A+KCNE1. Same colouring as in (a–b). Dashed line in (b) and (e) denotes 0 µA. Fluorescence traces and all traces in (c) have been normalized to better allow temporal comparison. (f) Summary of the effect of 70 µM N-AT on the kinetic parameters of KV7.1/G219C*/S225L+KCNE1 and KV7.1/G219C*/F351A+KCNE1. Kinetics of the fast (F1) and slow (F2) fluorescence components were deduced from a double-exponential function fitted to the fluorescence traces. The kinetics of currents were deduced from a single-exponential function fitted to current traces. Ratios of time constants (τN-AT/τCtrl) were calculated pair-wise (control compared to N-AT) in each oocyte and analysed using two-tailed one sample t-test where ratios were compared with a hypothetical value of 1. Data as mean ± SEM. n = 4 (3for fluorescence kinetics for KV7.1/G219C*/F351A+KCNE1). *p<0.05; **p<0.01. nd = not determined.
Figure 5—figure supplement 1

Effect of N-AT on the F(V) of KV7.1/G219C*/S225L mutant co-expressed with KCNE1 in Xenopus oocytes.
(a) Representative example of the time course of the reduction in fluorescence intensity upon N-AT application. The fluorescence intensities shown is the fluorescence measured at +80 mV (during repeated applications of the voltage protocol used to measure the complete F(V) as in panel c), normalized to the fluorescence intensity at +80 mV recorded in the first F(V) in control solution. Red symbols denote control (without N-AT) and purple symbols denote in the presence of N-AT. The fluorescence signal reduces with time in the presence of N-AT. In contrast, the fluorescence signal is preserved in the absence of N-AT (red symbol, recorded in another cell). (b) Summary of fluorescence emission monitored from unbound Alexa488 in control solution and in taurine-supplemented control solution (0.25 or 0.5 M taurine). In these experiments, no oocytes or channels were present. A.U. denotes arbitrary units. Data as mean ± SEM. n = 3. (c) Mean F(V) curve for KV7.1/G219C*/S225L+KCNE1 in the absence (red symbols, data from Figure 3B) or presence of 70 µM N-AT. The holding voltage is –80 mV, the pre-pulse –160 mV for 5 s, and test voltages between –160 and +100 mV for 5 s in 20 mV increments. The tail voltage is –40 mV. Each F(V) curve is normalized between 0 and 1 based on the bottom and top deduced from the double Boltzmann fits for each curve (see Materials and methods). Data as mean ± SEM. n = 3 for N-AT.
Additional files
-
Supplementary file 1
Summary of biophysical properties of LQTS and LQTS-like mutations for single injection (left panel) and homozygous co-injection (right panel).
- https://doi.org/10.7554/eLife.20272.020
-
Supplementary file 2
Summary of biophysical properties of LQTS and LQTS-like mutations for homozygous (left panel) and heterozygous expression (right panel).
- https://doi.org/10.7554/eLife.20272.021
-
Supplementary file 3
Summary of effect of 70µM N-AT on WT and LQTS and LQTS-like mutants for homozygous (left panel) and heterozygous.
- https://doi.org/10.7554/eLife.20272.022
-
Supplementary file 4
Parameters for KV7.1 model (a) andKV7.1+KCNE1 model (b)in Figure 3—figure supplement 1.
- https://doi.org/10.7554/eLife.20272.023
Download links
A two-part list of links to download the article, or parts of the article, in various formats.
Downloads (link to download the article as PDF)
Open citations (links to open the citations from this article in various online reference manager services)
Cite this article (links to download the citations from this article in formats compatible with various reference manager tools)
Fatty acid analogue N-arachidonoyl taurine restores function of IKs channels with diverse long QT mutations
eLife 5:e20272.
https://doi.org/10.7554/eLife.20272


