An aging-independent replicative lifespan in a symmetrically dividing eukaryote
- The University of Texas at Austin, United States
Figures
Figure 1 with 3 supplements

A multiplexed fission yeast lifespan microdissector (multFYLM).
(A) Illustration of multFYLM (gray) loaded with fission yeast (orange). Blue arrows represent the media flow though the multFYLM. (B) Left: Fission yeast cells initially grow from the old-pole end (magenta). After new end takeoff (NETO), growth begins at the new-pole end (green). Right: multFYLM permits tracking of the old-pole cell, as well as its most recent siblings. (C) Optical image of a multFYLM showing six independent subsystems. Arrows indicate direction of media flow. Scanning electron micrographs of (D) a multFYLM subsystem and (E) a single catch channel. The channel is long enough to accommodate the old-pole cell, as well as the most recent new-pole sibling. (F) White-light microscope image of a row of catch channels loaded with cells. (G) Time-lapse images (H) and single-cell traces of a replicating cell. The old-pole (magenta) is held in place while the new-pole (green) is free to grow. The old-pole of the most recent sibling (black) extends until it is removed by flow into the central trench (after ~2 hr 30 m).
Figure 1—figure supplement 1
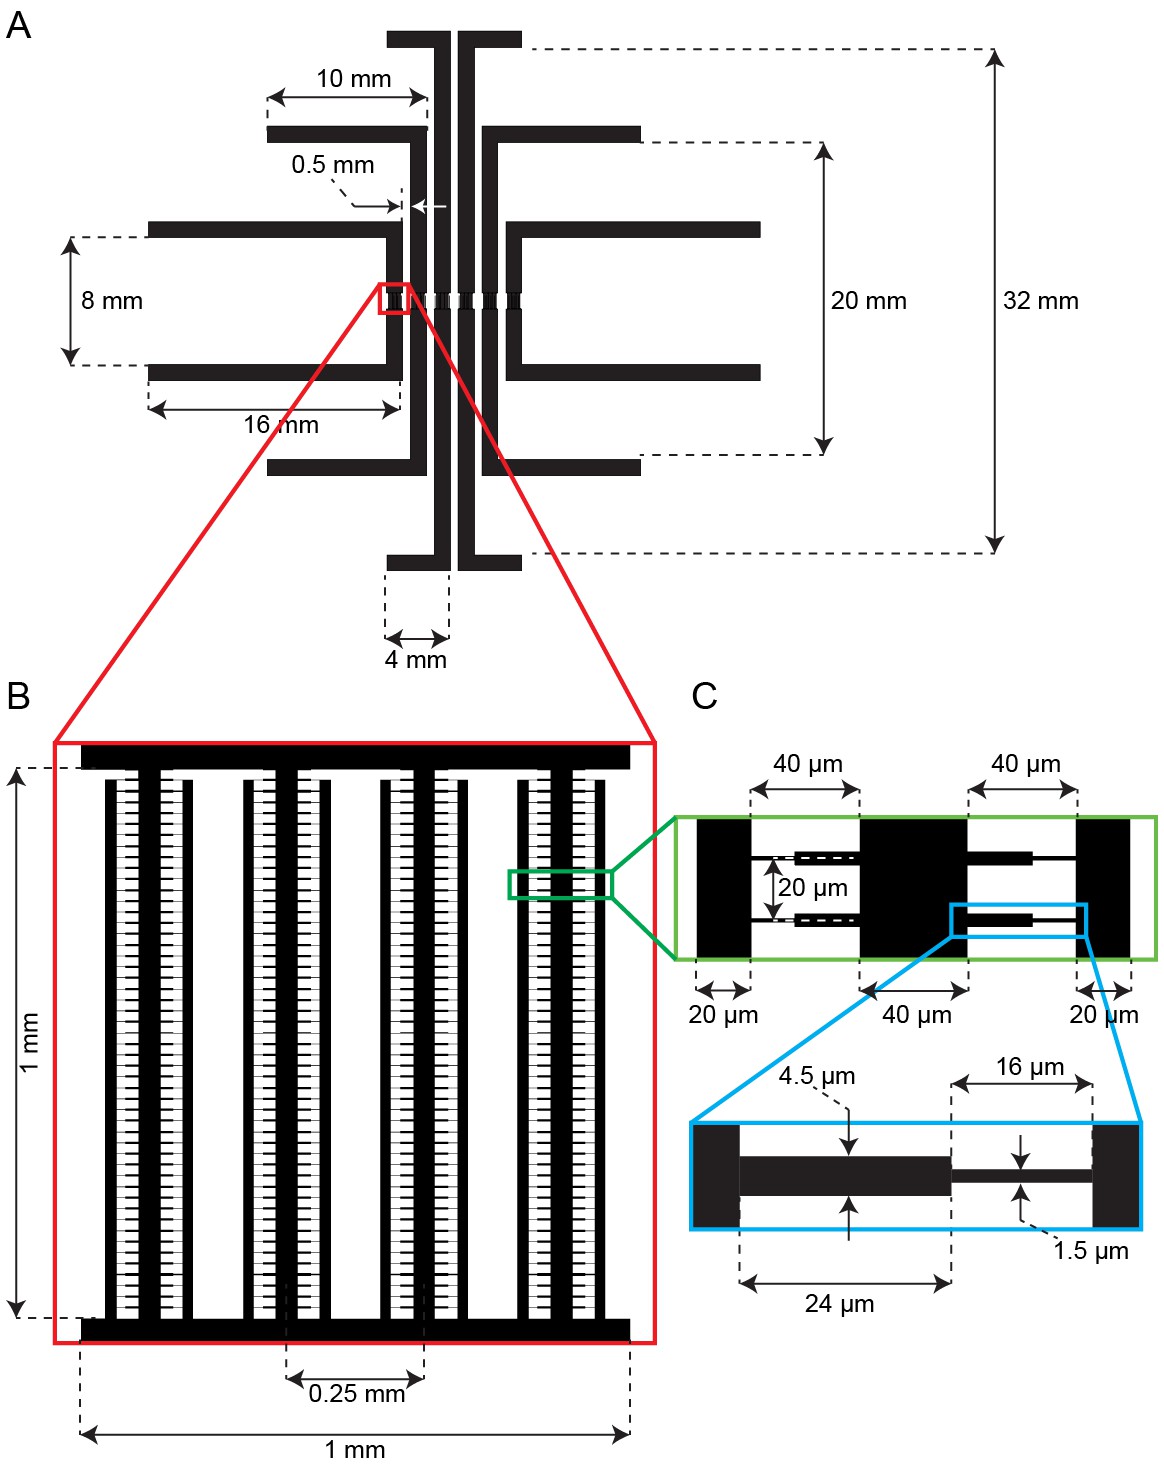
Schematic of the multiplexed fission yeast lifespan microdissector (multFYLM).
(A) The parallel subunits are designed to have the same fluidic resistance. This ensures similar flow rates through all devices when equal pressure is applied. (B) Detail showing the arrangement of central and side trenches of a single subunit. (C) Detail showing arrangement of the catch channels relative to the central and side trenches. (D) Detail showing the dimensions of one catch channel.
Figure 1—figure supplement 2

Loading and retention of cells in the multFYLM.
(A) Loading efficiency of each subunit in the multFYLM. Error bars: S.D. of the mean of three loading experiments. (B) Retention efficiency of cells in the multFYLM under constant media flow. Three representative experiments shown, with the associated number of loaded cells. We observed retention efficiencies as high as 99% over 140 hr. (C) Image of a single field of view of one subunit. White triangles mark captured cells. Scale bar: 25 µm.
Figure 1—figure supplement 3
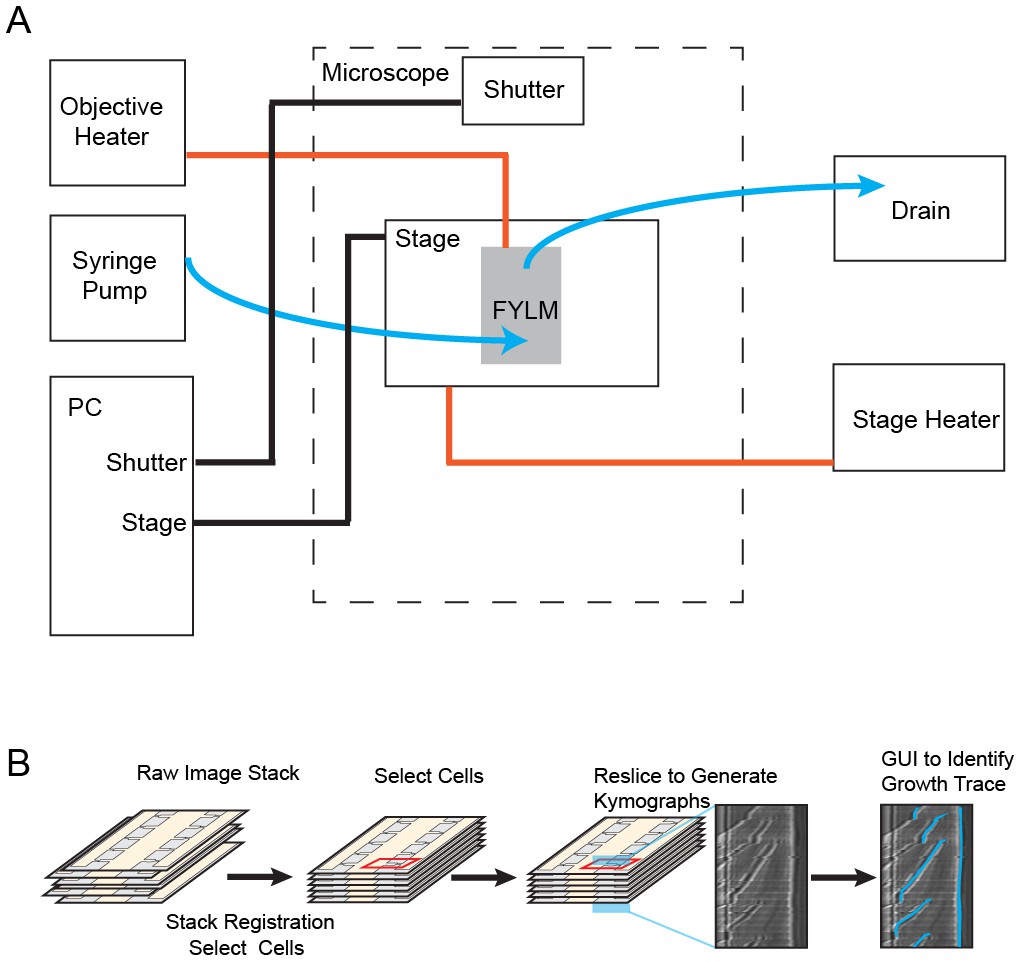
Experimental apparatus and image processing workflow.
(A) Schematic of experimental apparatus. Blue lines represent the flow of media, red lines represent temperature control, and black lines represent computer-controlled mechanical processes. A syringe pump delivers a constant flow of fresh media to the multFYLM. (B) FYLM Critic software workflow. Image stacks are first registered to remove jitter associated with moving the microscope stage. The user then selects cells of interest with a graphical user interface (GUI), and the software generates kymographs. Kymographs are annotated via a semi-automated GUI with the user helping to trace the growth of each cell. The software then quantifies the trace data and exports associated white-light and fluorescence intensities for downstream processing in MATLAB.
Figure 2 with 2 supplements

The fission yeast replicative lifespan (RLS).
(A) Survival curves for wild-type S. pombe (black) and wild-type S. cerevisiae (brown, data from Jo et al., 2015); both were grown in microfluidic microdissection devices. Numbers indicate the average lifespan. Red lines are a fit to a Gompertz (S. cerevisiae) and exponential decay (S. pombe) survival models. Shading indicates 95% confidence interval (C.I.). Dashed blue line: 50% survival. (B) Hazard rate curves for the data shown in (A). The hazard rate increases dramatically with increased replicative age for S. cerevisiae but not for S. pombe.
Figure 2—figure supplement 1
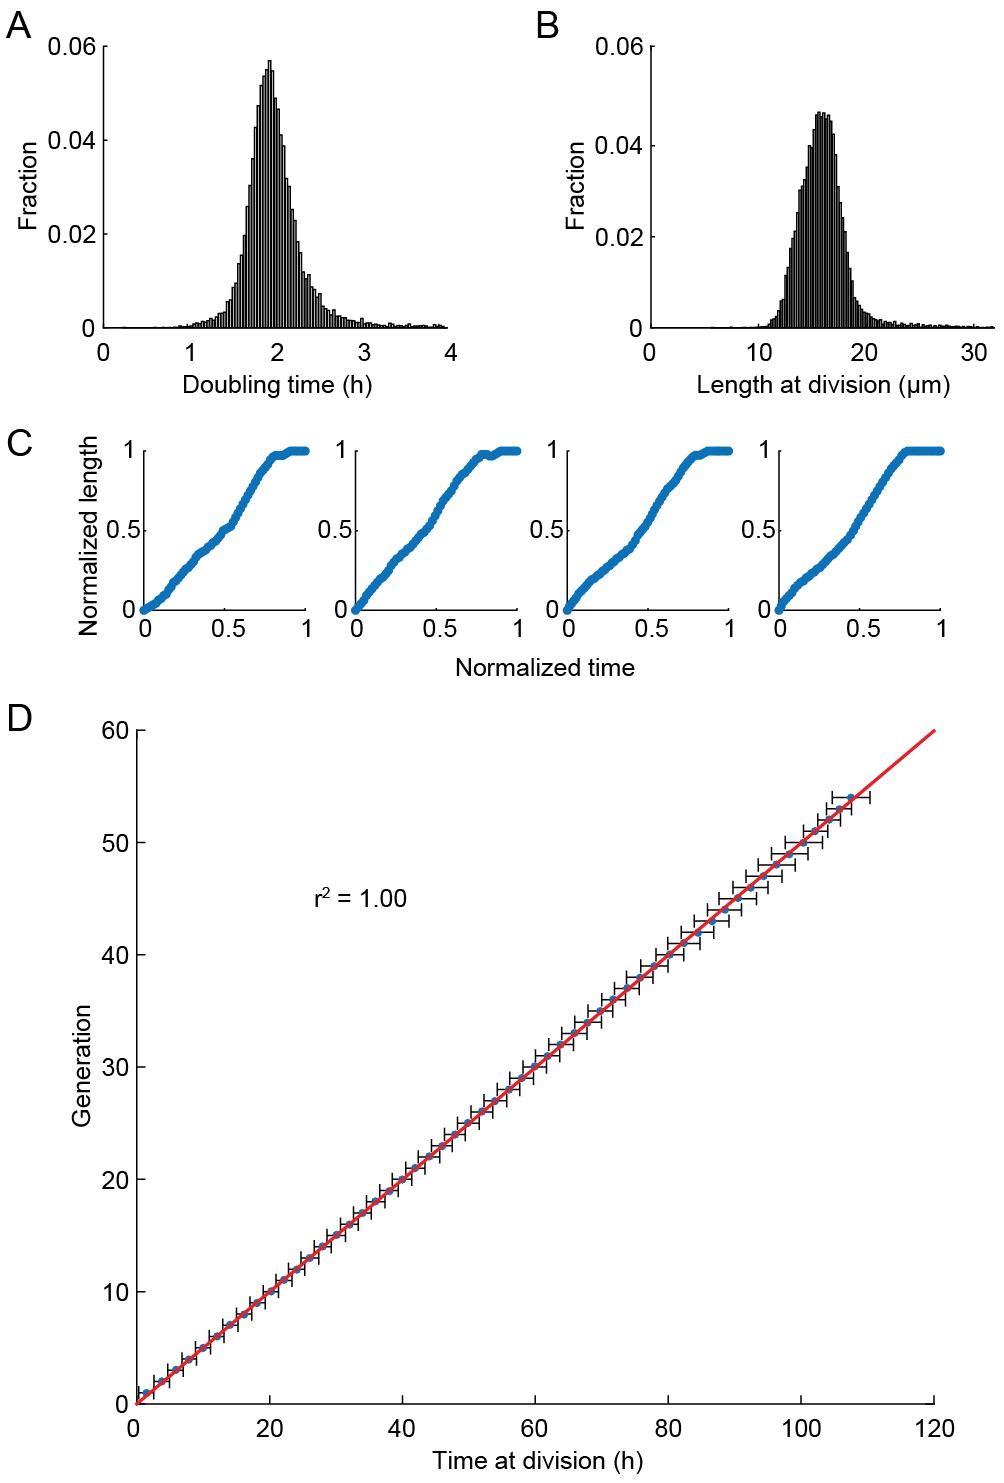
Health of cells in the multFYLM.
(A) Histogram of the doubling times and (B) division lengths of wild-type S. pombe (h- 972) observed in the multFYLM. The doubling time was 2.05 ± 0.45 hr (mean ± S.D., n = 13,453 cells). The mean length at division was 16 ± 2.2 µm. (C) Four representative examples of new end take-off (NETO). Each graph shows the normalized increase in the length of a randomly selected cell over a normalized time comprising one generation. (D) Doubling time did not generally change with age. Horizontal error bars are the SD of the mean time at division for a given generation. Number of cells used ranged from n = 517 at generation 1, to n = 147 at generation 53. The number of cells declines due mostly to cell death during the experiment.
Figure 2—figure supplement 2
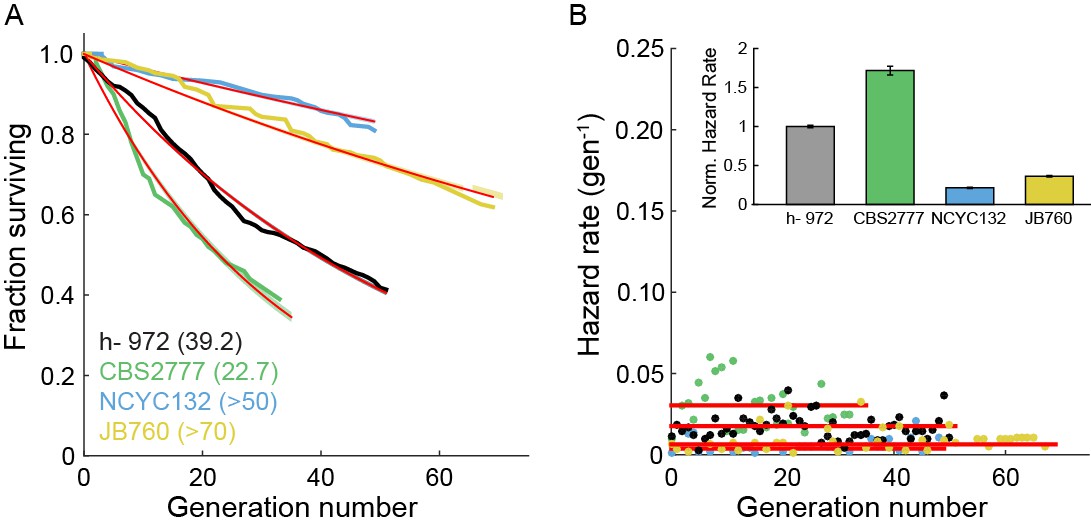
Survival and hazard curves for wild type fission yeast isolates.
(A) Survival curves of several wild-type strains. The replicative half-life is indicated in parenthesis. Red lines: exponential decay fit to the data. For the two particularly long-lived strains NCYC132 and JB760, we could only estimate a lower bound on the mean replicative lifespan. (B) Hazard functions of strains shown in (A). Inset: hazard rates normalized to the wild-type (h- 972) hazard rate (error bars indicate 95% CI). The constant hazard rates illustrate that none of the WT populations observed are aging.
Figure 3
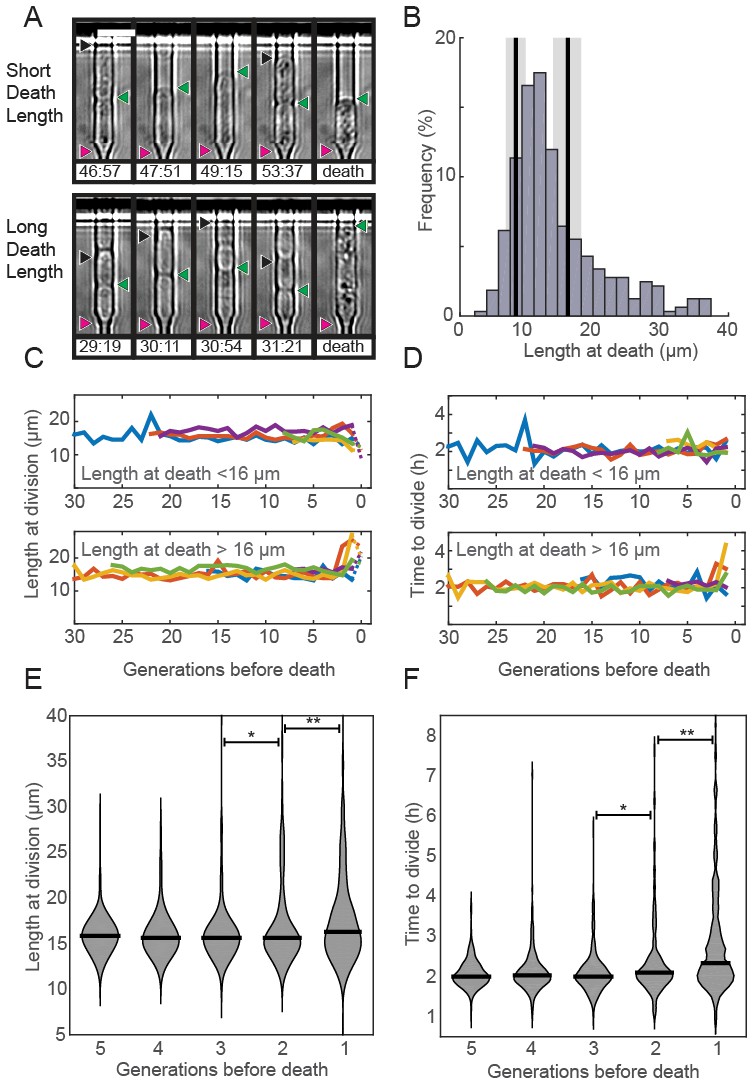
Fission yeast does not show signs of aging.
(A) Images of cells showing a short (top) and long (bottom) phenotype at death. Triangles indicate the old-pole, new-pole, and the new-pole of the previous division as in Figure 1G. Scale bar: 10 µm. (B) Histogram of cell length at death. The birth length was 8.3 ± 1.5 µm (mean ± st. dev., n = 326) and the length at division was 16 ± 2.2 µm (n = 326). (C) Cells dying with either short (top) or long (bottom) phenotype have normal length and (D) doubling times prior to death, as indicated by five representative cells. (E) Distribution of length and (F) doubling time at division in the five generations preceding death. Cells were post-synchronized to the time of death. The black bar shows the median value for each generation (n > 290 cells for all conditions). Sequential generations were compared using the Kolmogorov-Smirnov test (* for p<0.05, ** for p<0.01).
Figure 4
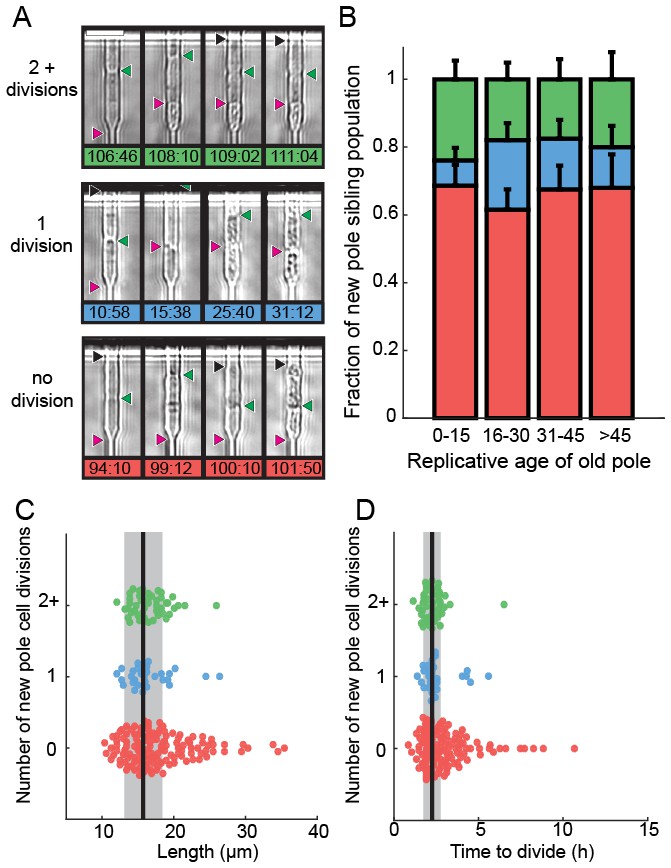
Analysis of siblings born during the last division of a dying cell.
(A) Last new-pole sibling continued to divide (top), died after one division (middle) or died without dividing (bottom). (B) The distribution of last-sibling phenotypes as a function of the old-pole replicative age (n = 245). Error bars are st. dev. measured by bootstrap analysis. (C) The length at division and (D) the doubling time of the new-pole siblings. Vertical black lines and gray bars show the mean and standard deviation of the total cell population.
Figure 5 with 2 supplements
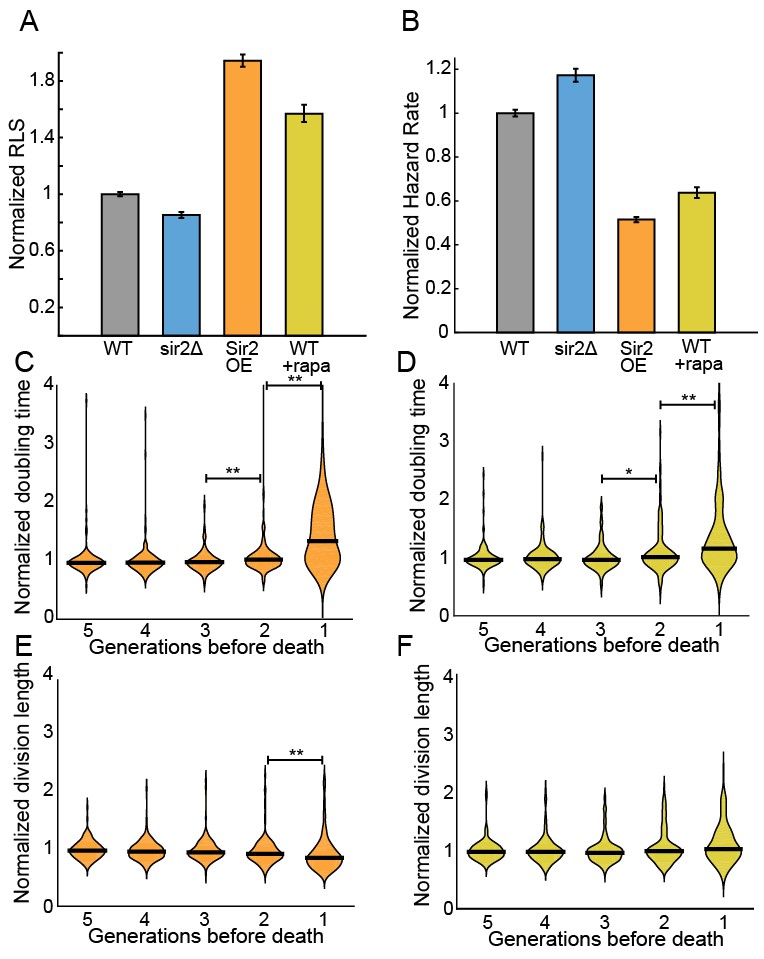
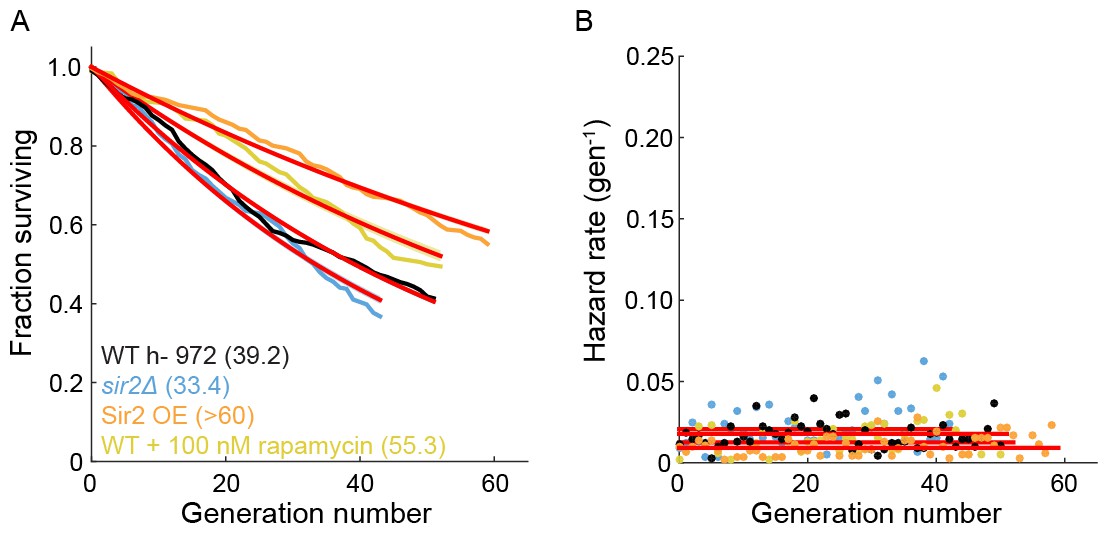
Sir2p and rapamycin extend replicative lifespan.
(A) Replicative lifespans and (B) hazard rates of strains normalized to the mean RLS and hazard rate of wild-type (h- 972) strain. Error bars: 95% C.I. on an exponential decay fit to the experimental survival curve. (C) Distribution of normalized doubling time in the five generations preceding death for Sir2p overexpression cells and (D) wild-type cells treated with 100 nM rapamycin. (E) Distribution of normalized length at division in the five generations preceding death for Sir2p overexpression cells and (F) wild-type cells treated with 100 nM rapamycin. Black bars show the median value. Sequential generations were compared using the Kolmogorov-Smirnov test (* for p<0.05, ** for p<0.01; n > 144 cells for all conditions).
Figure 5—figure supplement 1
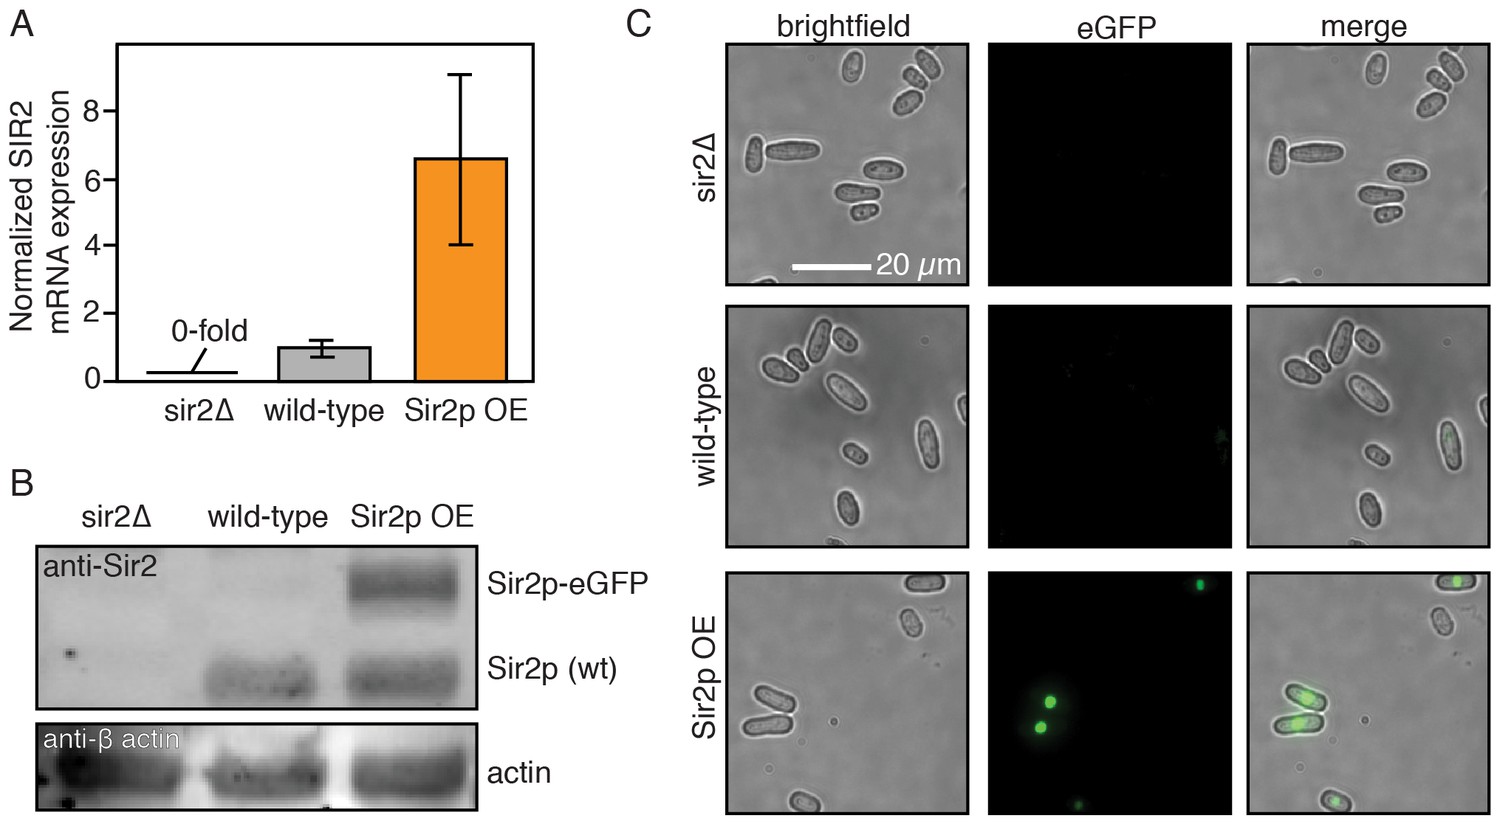
Sir2p expression levels.
(A) sir2 mRNA transcript levels as measured by qPCR. The sir2Δ strain was included as a negative control. Error bars: normalized SEM of at least three replicates. (B) Sir2p protein levels as detected by an anti-Sir2p antibody. Actin is included as loading control. Sir2p-eGFP migrates slower than endogenous Sir2p. (C) Single cell fluorescence imaging confirms that Sir2p-eGFP is expressed and localizes to the nucleus. Scale bar: 20 µm.
Figure 5—figure supplement 2
The effect of Sir2p and rapamycin on the RLS of fission yeast.
(A) The replicative half-life is indicated in parenthesis. A lower bound is reported for the long-lived Sir2p overexpression strain. Red lines represent an exponential decay fit to the curve. (B) Hazard functions of strains shown in (A). The constant hazard rates illustrate that none of the WT strains are aging.
Figure 6 with 3 supplements
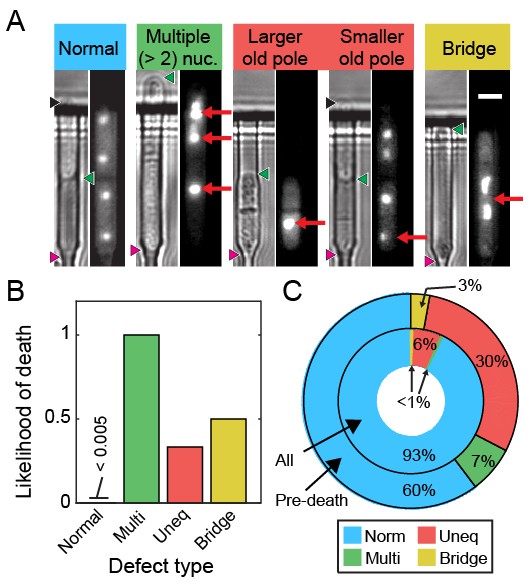
Ribosomal DNA (rDNA) instability is highly correlated with cell death.
(A) Images of cells exhibiting rDNA instability, as reported by gar2-mCherry, which binds to rDNA. (B) Likelihood of cell death following one of the defects observed in (A). (C) Dying cells exhibited elevated rDNA defects (outer ring) relative to healthy dividing cells (inner ring).
Figure 6—figure supplement 1
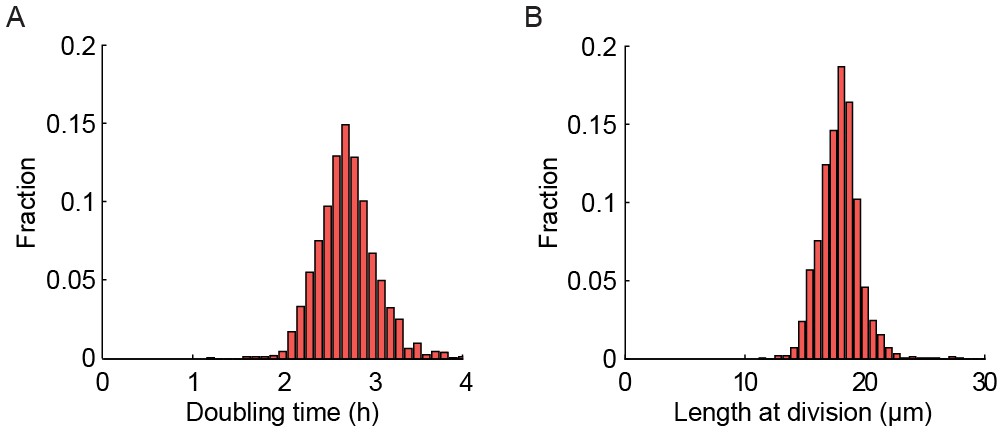
Strains expressing gar2-mCherry maintain wild-type replication rates.
(A) Histogram of doubling times of a strain expressing gar2-mCherry. The doubling time is 2.83 ± 0.87 hr (mean ± st. dev.; n = 1547). (B) Histogram of length at division. The length is 18.0 ± 2.3 µm (mean ± st. dev.; n = 1547).
Figure 6—figure supplement 2
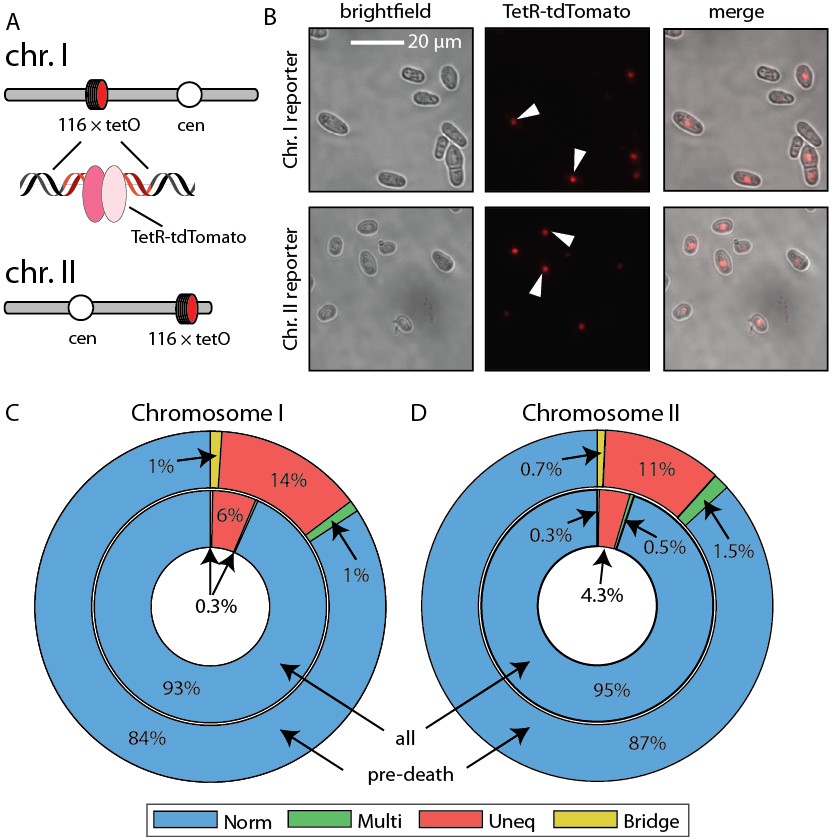
Live imaging of chromosome mis-segregation rates.
(A) Chromosome loci were labeled with a 112-tetO repeat. TetR-tdTomato binds this array and allows live cell imaging of chromosome dynamics. Schematic adapted from Petrova et al. (2013). (B) Images of cells with chromosome I and chromosome II labeled with the tetO-TetR array. (C) Chromosome mis-segregation defects were characterized as in Figure 6. Norm: equal separation of fluorescent foci between siblings, Multi: multiple foci observed in single sibling, Uneq: unequal fluorescence between siblings, Bridge: foci remain connected post-division. Dying cells showed 2.3-fold elevated chromosome I and (D) 2.6-fold elevated chromosome II mis-segregation defects (outer ring) relative to healthy dividing cells (inner ring).
Figure 6—figure supplement 3
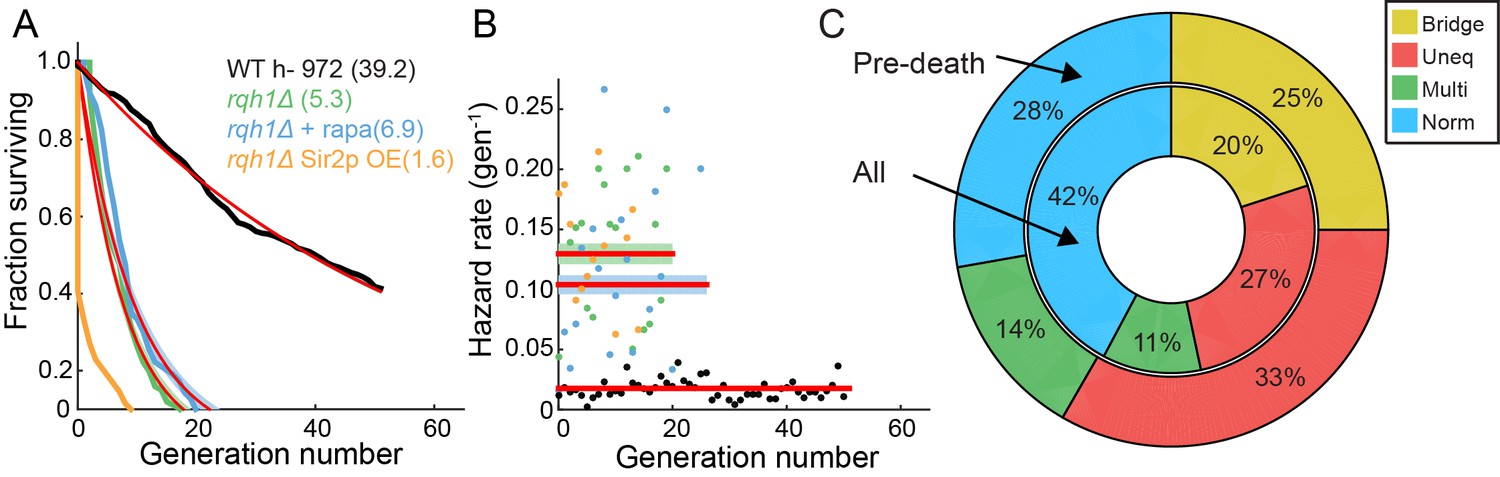
Characterization of the RLS of an rqh1Δ strain.
(A) Survival curve of WT (black, 95% CI: 38.6–39.8 generations), rqh1Δ (green, 95% CI: 5.0–5.7), rqh1Δ + 100 nM rapamycin (blue, 95% CI: 6.2–7.2), and rqh1Δ sir2OE (orange). The extremely short lifetime of the rqh1Δ sir2OE strain precluded an accurate fit. (B) Hazard curves for the strains shown in (A). The number of cells, RLS, hazard rate, and goodness of fit parameters are summarized in Supplemental file 1. (C) The incidence of nucleolar defects for all divisions (center ring) and preceding death (outer ring) in rqh1Δ strain.
Figure 7
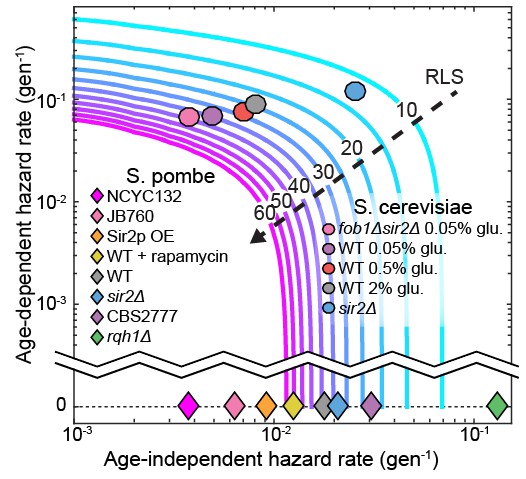
The replicative lifespan is an incomplete reporter of cellular aging.
RLS contours were generated from experimentally determined ranges of Gompertz coefficients using Equation (7). Fission yeast strains examined in this study and budding yeast from an analogous study (Jo et al., 2015) were plotted on the chart based on the coefficient values from either a Gompertz or exponential decay fit. In all cases, the 95% CI of the coefficients was smaller than the marker size.
Videos
Video 1
Operation of the multFYLM.
Time-lapse imaging of fission yeast in a single field of view of the multFYLM for approximately 140 hr. Scale bar is 20 µm.
Video 2
New-pole sibling phenotypes.
Time-lapse images of a cell where the last division produces a healthy new-pole cell that divides more than once. Scale bar is 20 µm.
Video 3
New-pole sibling phenotypes.
Time-lapse images of a cell where the last division produces an unhealthy new-pole cell that divides once before dying. Scale bar is 20 µm.
Video 4
New-pole sibling phenotypes.
Time-lapse images of a cell where the last new-pole cell does not divide. Scale bar is 20 µm.
Additional files
-
Supplementary file 1
This supplemental file contains tables of data used in making figures and also a table of strains used.
It references four works not referenced in the main text: Wood and Nurse, 2013; Xhemalce and Kouzarides, 2010; Weisman et al., 2005; Nakazawa et al., 2008
- https://doi.org/10.7554/eLife.20340.024
Download links
A two-part list of links to download the article, or parts of the article, in various formats.
Downloads (link to download the article as PDF)
Open citations (links to open the citations from this article in various online reference manager services)
Cite this article (links to download the citations from this article in formats compatible with various reference manager tools)
An aging-independent replicative lifespan in a symmetrically dividing eukaryote
eLife 6:e20340.
https://doi.org/10.7554/eLife.20340


